
Technical Analysis
BTC/USDT
The US Senate narrowly approved President Trump’s “big and beautiful” comprehensive tax cut and spending bill. The bill, which passed with Vice President Vance’s tie-breaking vote, was sent to the House of Representatives to become law before July 4th. On the other hand, New York Attorney General Letitia James stated that the GENIUS Act passed by the Senate is insufficient in terms of investor protection and demanded stricter supervision of stablecoin issuers and mandatory identity verification. Today, US unemployment claims, Non-Farm Payrolls and Fed member Bostic’s statements will be followed in the data set.
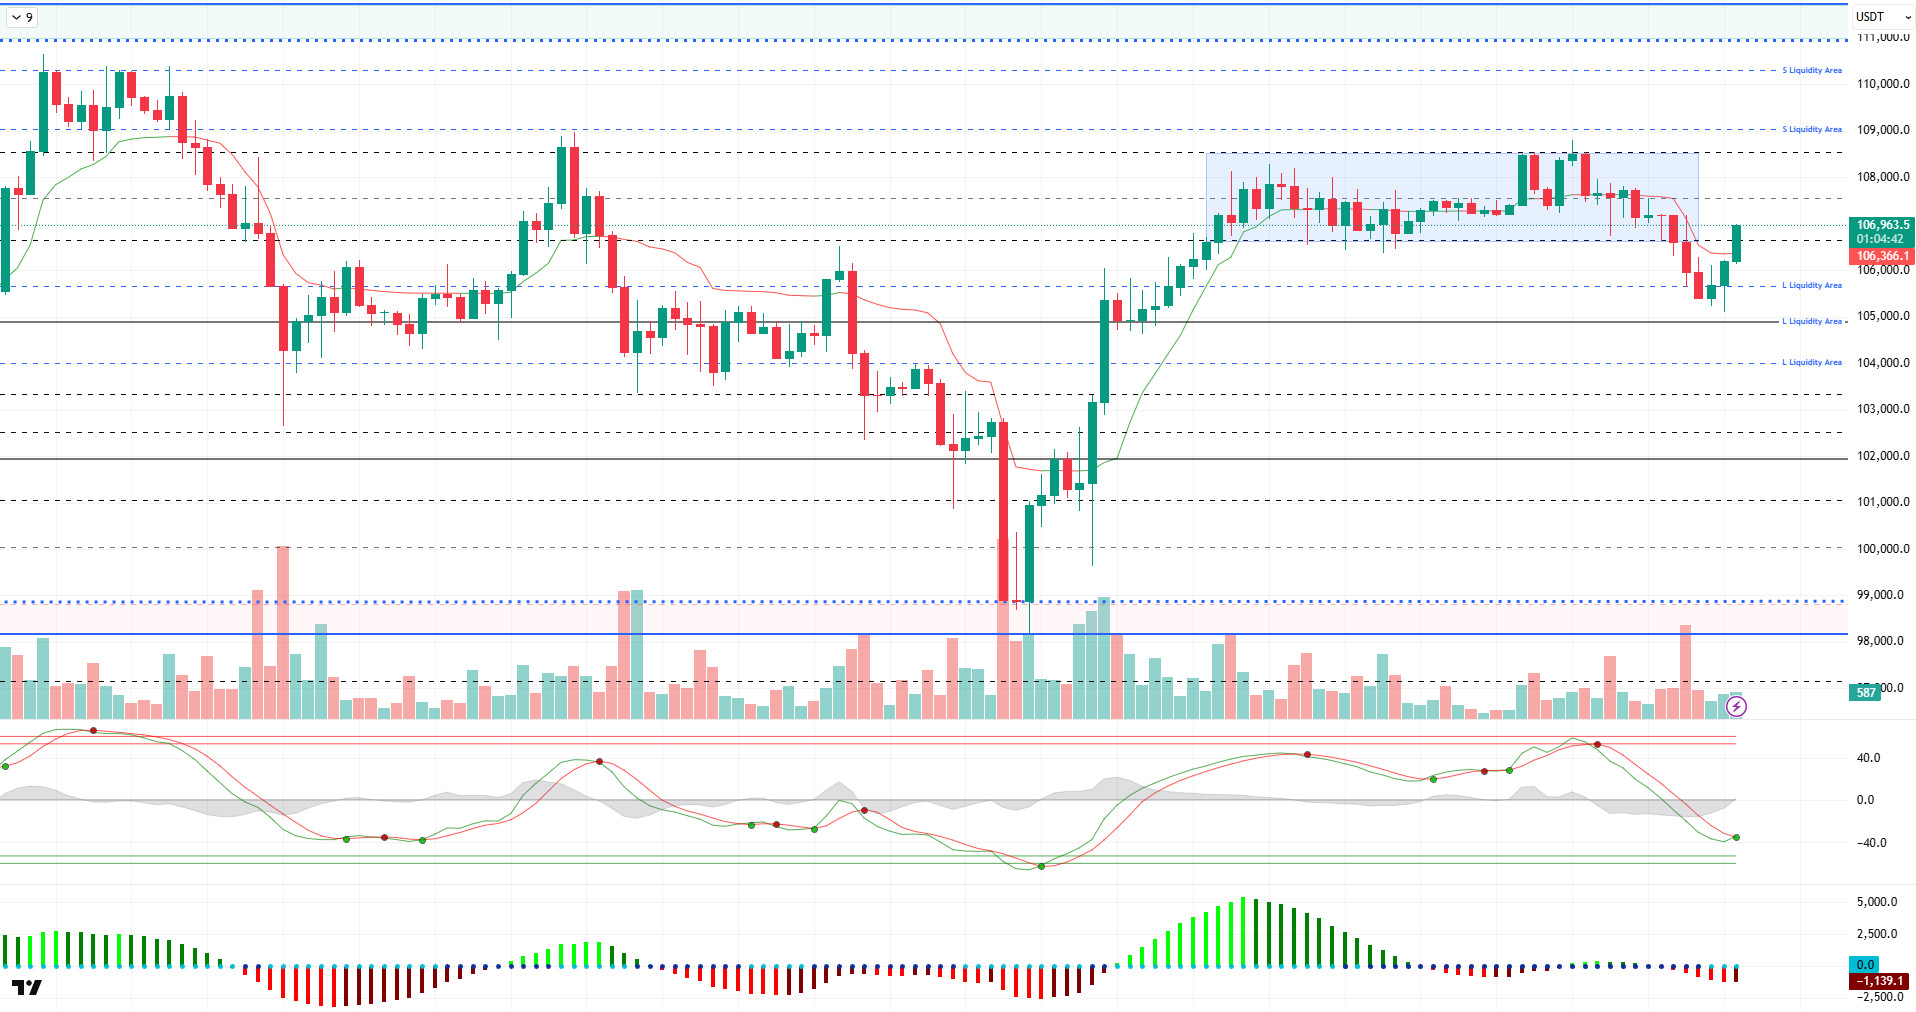
Looking at the technical outlook, BTC made a downward breakout. With the breakdown of the 106,600 level within the horizontal band range, BTC fell to 105,100 levels. Then, the price reacted from this level and reached 107,000 at the time of writing the analysis.
On the technical indicators front, Wave Trend (WT) is pointing to a trend reversal near the oversold area, while the histogram on the Squeeze Momentum (SM) indicator may move into positive territory once again, although the histogram is negative again. The Kaufman moving average is moving just below the price at 106,300, confirming the short-term bullishness.
Liquidity data shows that the buy trades with the recent decline were liquidated above the 105,000 level. Then, BTC, which is heading towards the liquidity area again, may target selling positions within the 108,000 – 110,000 band this time.
As a result, while fundamental developments continue to be the catalyst for pricing, liquidity data and technical indicators have started to accompany it. In the continuation of upward movements, 109,000 and then 110,000 levels can be followed as resistance points. On the other hand, we will follow the 106,600 support zone again in a possible selling pressure.
Supports 106,600 – 106,000 – 105,500
Resistances 108,500 – 109,000 – 110,000
ETH/USDT
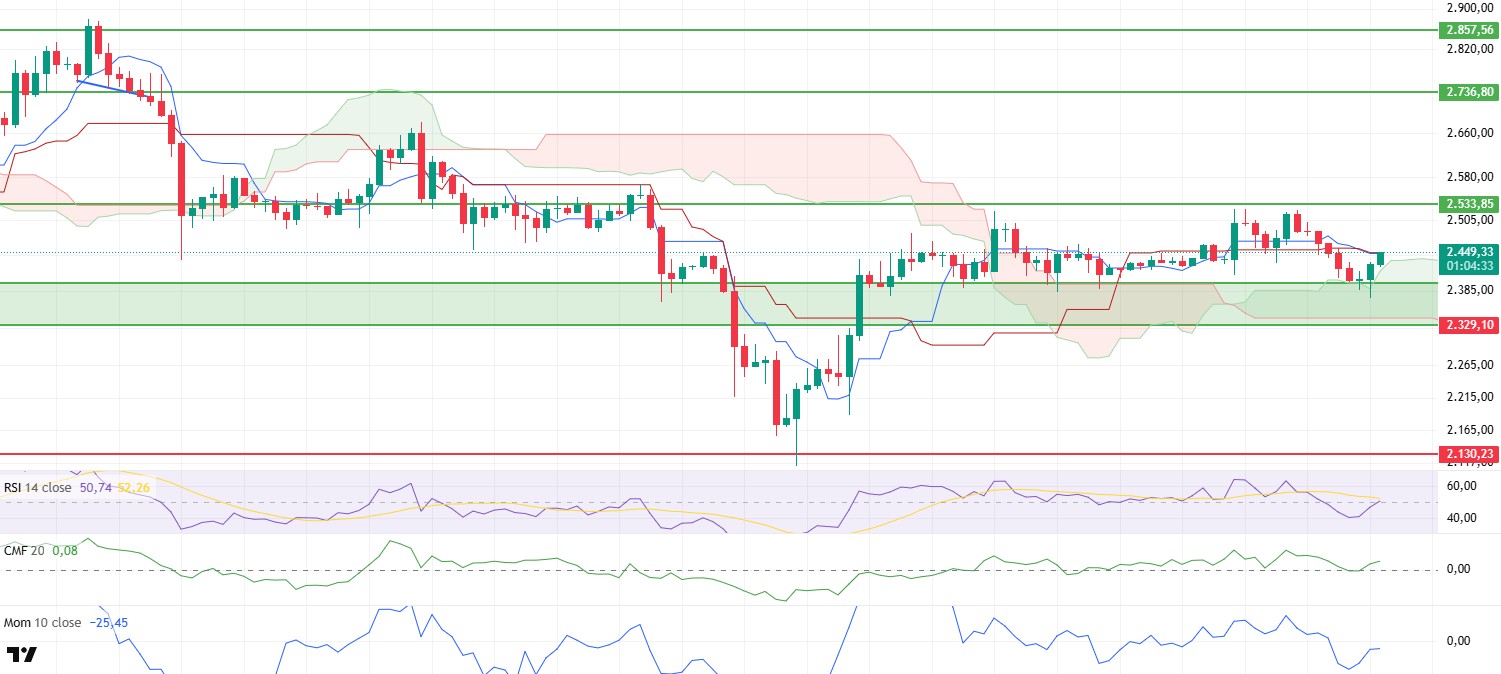
As highlighted in last night’s analysis, ETH experienced a significant correction with selling pressure, falling first to the $2,400 level and then to the main support area marked by the green box on the chart. However, thanks to strong reaction buying from this area, the price rebounded and rose as high as $2,450. This movement is noteworthy in terms of showing that the support areas are working effectively and buyers are activated in these regions.
On the technical indicators side, short-term positive signals are gaining weight again. The Chaikin Money Flow (CMF) indicator, after falling back to the zero line, is showing an upward movement again, indicating that liquidity inflows to the market have increased again. This development indicates that buyers are gaining strength, especially in the short term, and the market is gaining confidence in areas where it finds support.
Relative Strength Index (RSI) and momentum indicators have also turned upward after the recent pullback. The bullish momentum of both indicators supports the continuation of the upward trend in short-term price movements. This suggests that the market’s recovery is not just a short-term reaction, but also a technically grounded uptrend.
Looking at the Ichimoku indicator, the price continues to hover above the kumo cloud, indicating that the overall trend is still in positive territory. In particular, the regaining of the previously lost tenkan and kijun levels with the recent rise is an important indicator of strength in terms of the short-term outlook. This creates a technical basis for the price to turn its direction upwards again.
As a result, it seems likely that upward movements will continue with the positive signals received from technical indicators in the intraday outlook. In particular, the persistence of the price above the $2,450 zone, which coincides with the tenkan and kijun levels, is critical for the continuation of the current rise . In the opposite scenario, that is, in case of a stay below this level, price movements can be expected to be stuck in a more horizontal band and the market will continue to search for direction.
Top of Form
Below the Form
Supports 2,329 – 2,130 – 2,029
Resistances 2,533 – 2,736 – 2,857
XRP/USDT
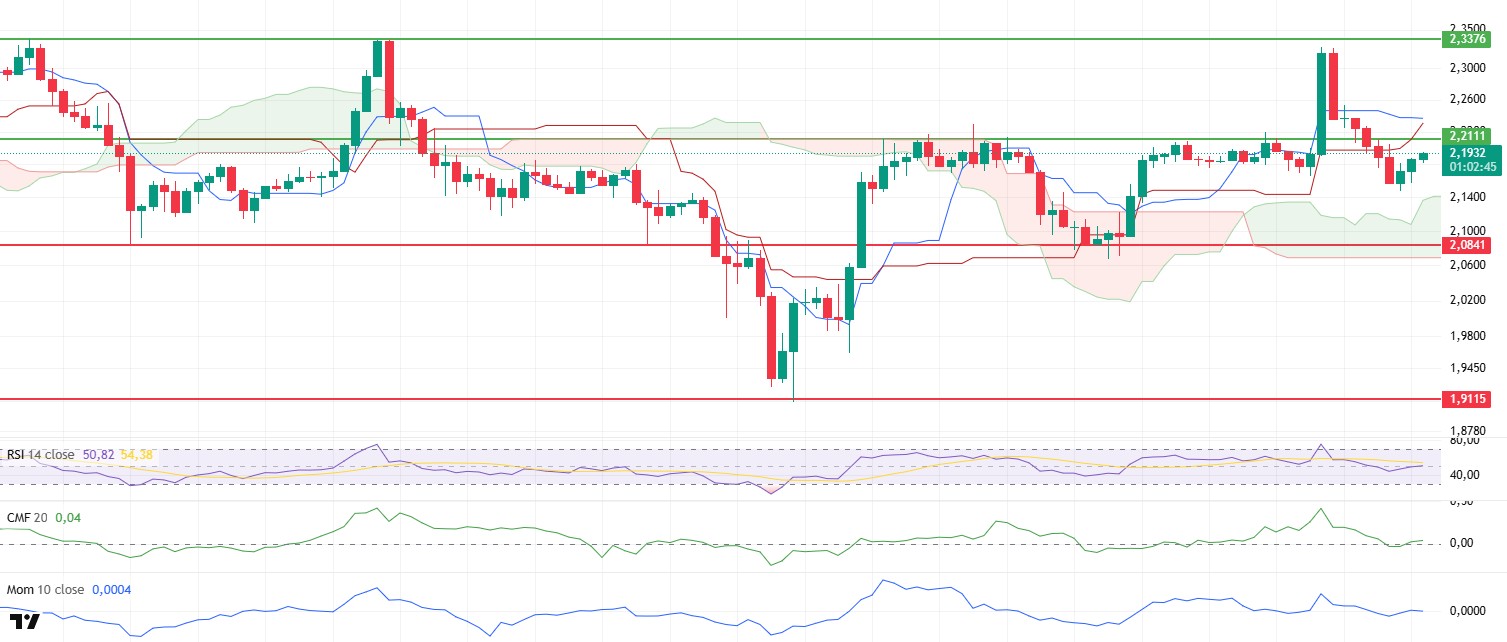
XRP continued its downward trend with the effect of selling pressure yesterday evening and fell to the level of $2.14. However, with the reaction purchases from this level, there was a limited recovery and the price rose again to the level of $2.19. This movement was especially important in terms of showing that short-term support areas were working effectively and that the market encountered buyers in these regions.
Analyzing the technical indicators, it is noteworthy that the Chaikin Money Flow (CMF) indicator first fell into negative territory and then recovered and moved into positive territory. This movement indicates that the liquidity outflows in the market have diminished and the buy side has started to re-engage. This recovery in CMF can be considered as an important signal that the market has gained resistance against selling pressure in the short term.
On the Ichimoku indicator, a mixed structure is noteworthy. The fact that the price remains below both tenkan and kijun levels indicates that the weakness in the short-term outlook continues and the downward pressure is still valid. In particular, the convergence of these two levels and the price’s positioning below both of them is a development that increases the downside risk in the short term. On the other hand, the fact that the price is still hovering above the kumo cloud shows that the overall trend remains positive and the main upward trend has not yet been disrupted.
Momentum has a similar dual structure. Although the indicators are slightly bullish on the rebound in price action, they remain structurally negative. This suggests that the current rally is not yet a strong enough turnaround signal and that weakness in the market persists.
As a result, in the short term, the XRP price can be expected to rise towards the $2.21 level. However, this area is working as a strong resistance and the price is likely to struggle to break through this level. If $2.21 is breached, short-term bullish movements may strengthen as buyers gain momentum and the price may head towards the upper band. Therefore, the $2.21 level is a critical threshold both in terms of technical outlook and market psychology.
Supports 2.0841 – 1.9115 – 1.7226
Resistances 2.2111 – 2.3376 – 2.5900
SOL/USDT
DeFi Development launches $100 million private convertible bond offer to acquire Solana.
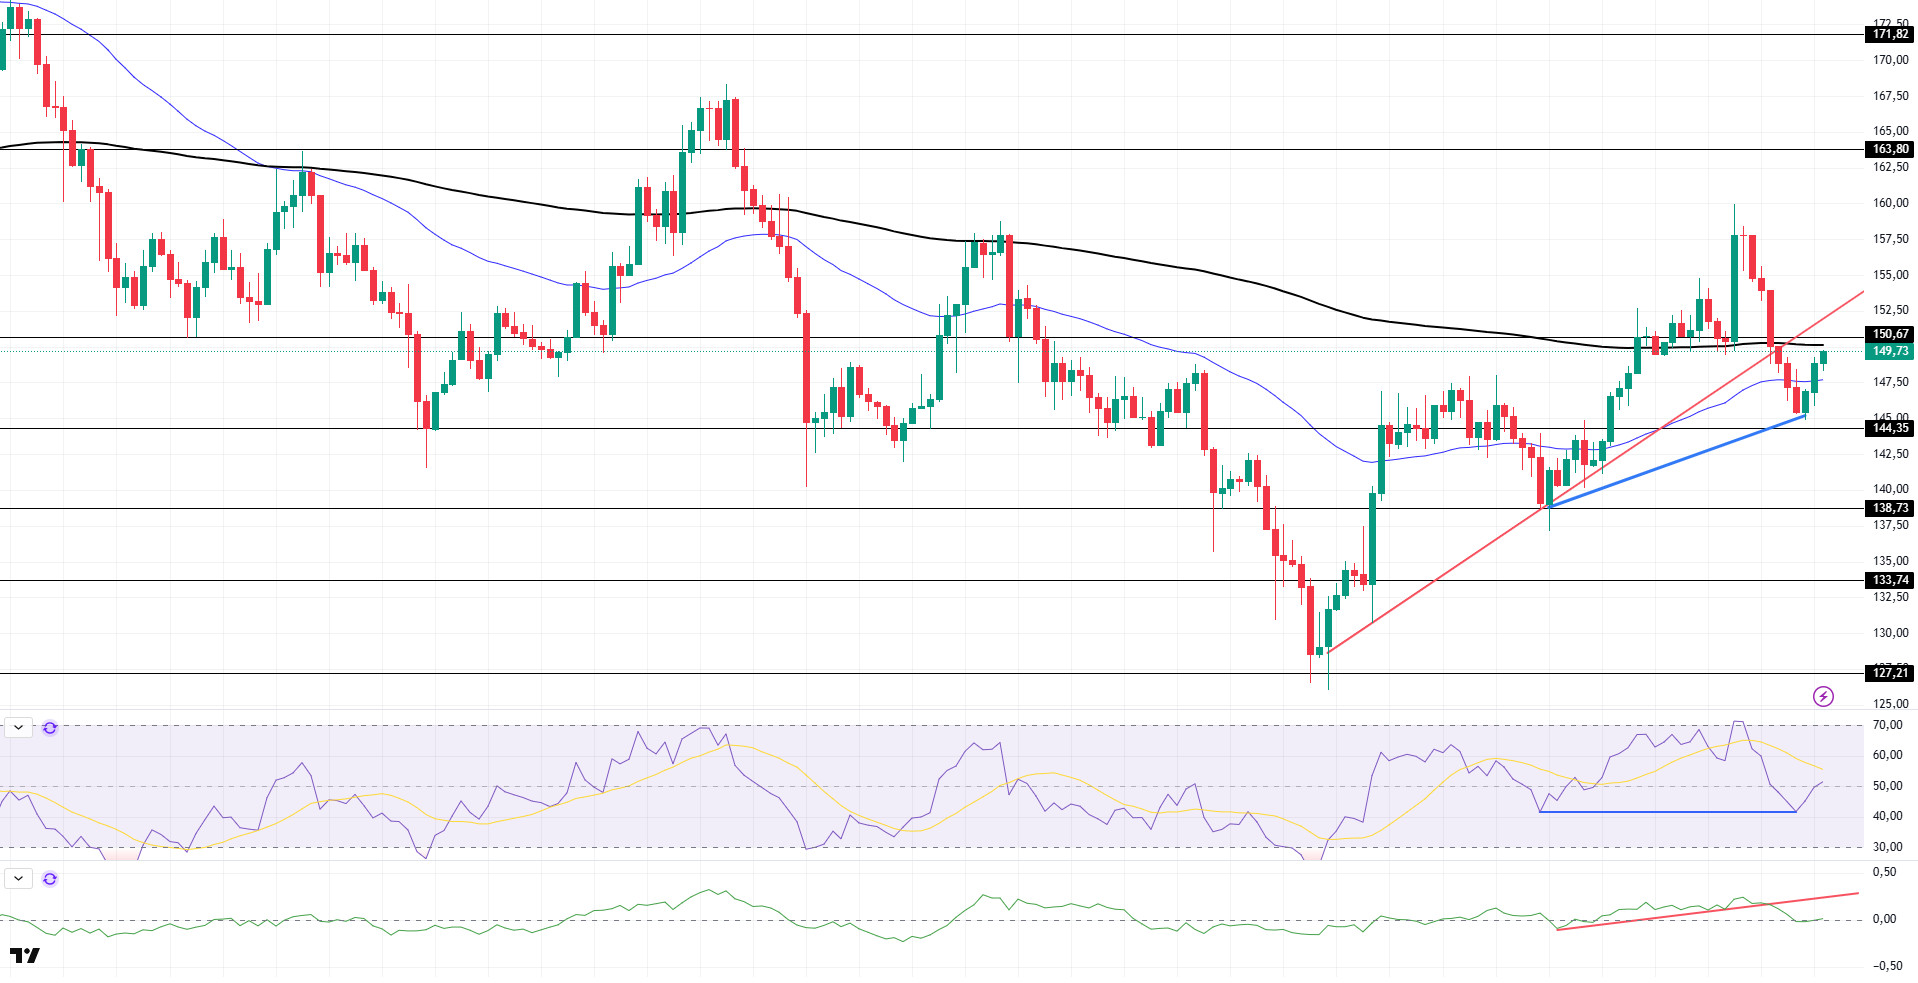
SOL price was slightly bullish. The asset accelerated by testing the strong support at $144.35 and rallied from there. With this rise, the price broke the 50 EMA moving average to the upside, and if it continues its momentum, the 200 EMA (Black Line) moving average and the base level of the uptrend may work as resistance. If the price continues to stay below the 200 EMA moving average, the $ 144.35 level and the 50 EMA (Blue Line) moving average are important support levels.
On the 4-hour chart, the 50 EMA continued to be below the 200 EMA. This suggests that the bearish trend may continue in the medium term. At the same time, the fact that the price is between both moving averages suggests that the market is currently in a short-term decision phase. Chaikin Money Flow (CMF-20) is now at the neutral level; in addition, a decline in inflows could push CMF back into negative territory. It has also broken the uptrend that started on June 27 to the downside. This could deepen the decline. Relative Strength Index (RSI-14) moved from negative to neutral. On the other hand, positive divergence should be monitored. In case of an uptrend due to macroeconomic data or positive news on the Solana ecosystem, the $150.67 level stands out as a strong resistance point. If this level is broken upwards , the rise can be expected to continue. If there are pullbacks due to contrary developments or profit realizations, the $ 144.35 level can be tested. In case of a decline to these support levels, the increase in buying momentum may offer a potential bullish opportunity.
Supports 144.35 – 138.73 – 133.74
Resistances 150.67 – 163.80 – 171.82
DOGE/USDT
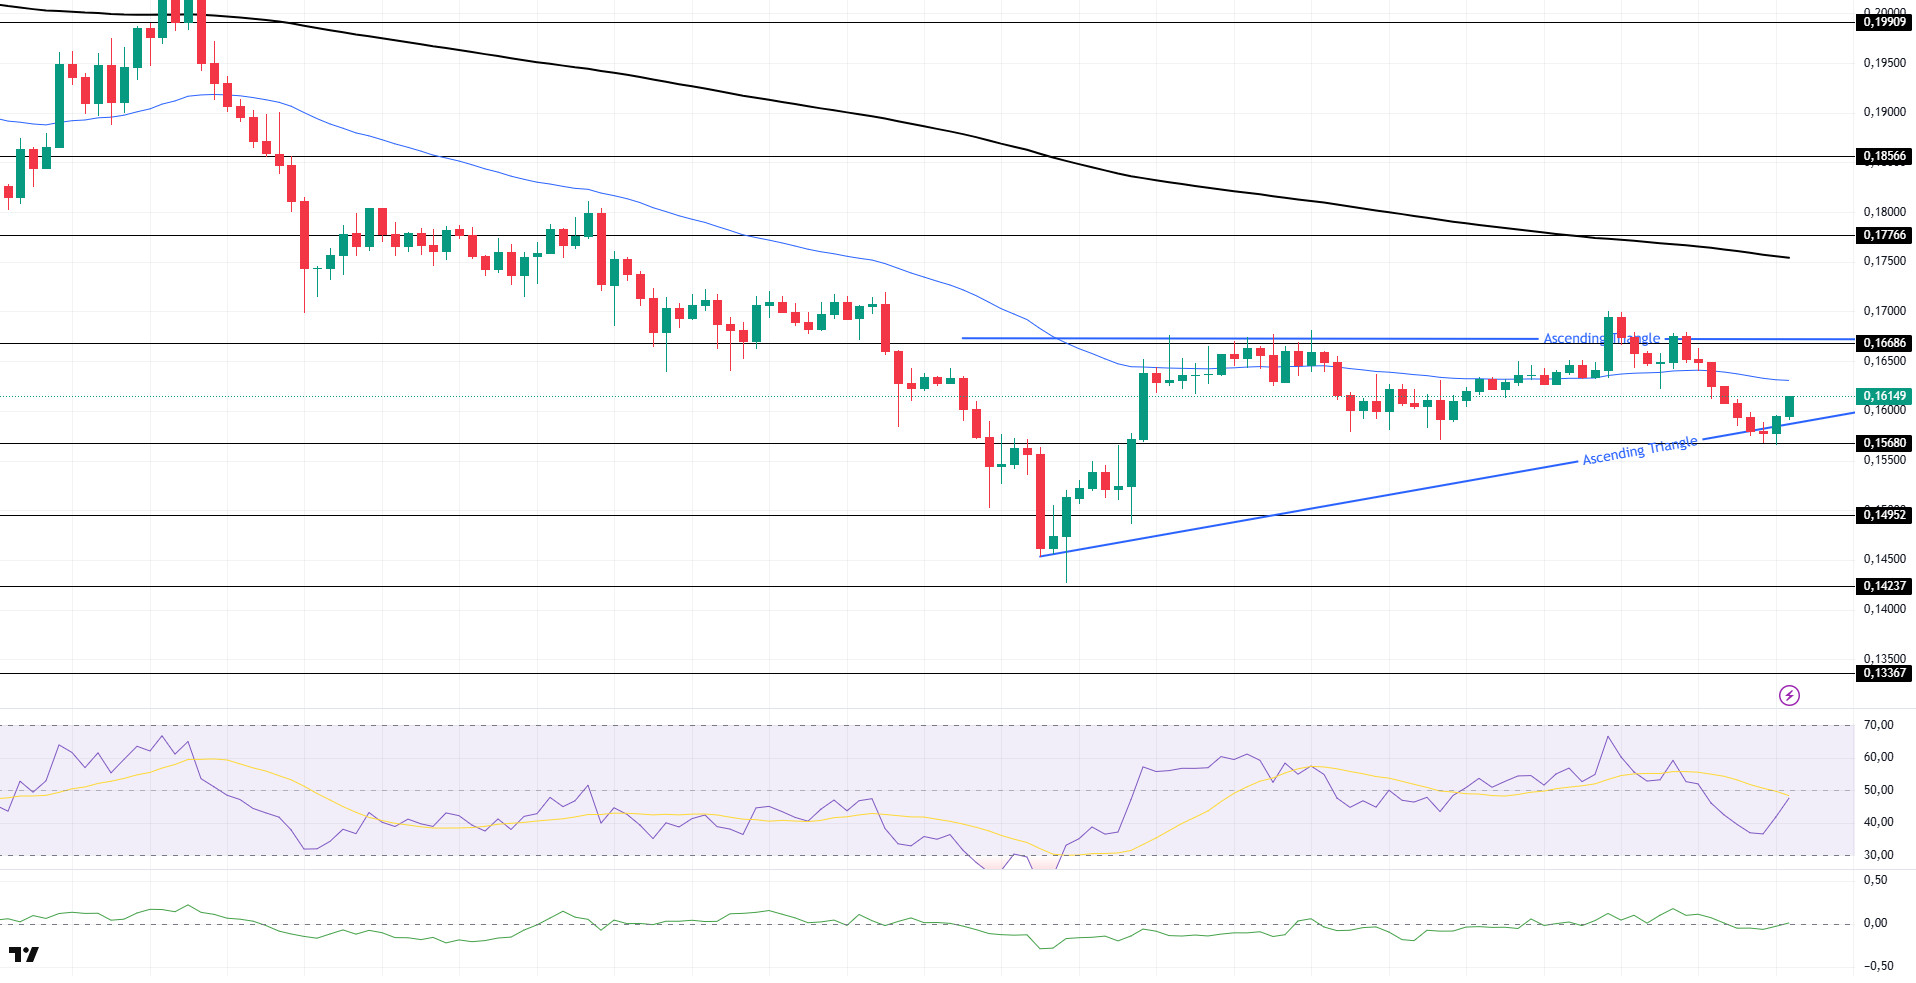
DOGE price continued its decline. Breaking the 50 EMA (Blue Line) moving average to the downside, the asset continued its decline and retreated to the base of the ascending triangle pattern. The price, which received slight support from the strong support at $0.15680 and the base level of the descending triangle pattern, has now started to rise with slight acceleration. If the price acceleration continues, it may test the 50 EMA moving average as resistance. On candle closes below the ascending triangle pattern, the $0.14952 level can be followed as support.
On the 4-hour chart, the 50 EMA (Blue Line) continues to be below the 200 EMA (Black Line). This suggests that the asset is bearish in the medium term. The fact that the price is below both moving averages suggests that the asset is bearish in the short term. Chaikin Money Flow (CMF-20) maintains its neutral position. In addition, positive inflows may move CMF into positive territory. Relative Strength Index (RSI-14) continued to be in negative territory. On the other hand, it seems to have broken the selling pressure. The $0.16686 level stands out as a strong resistance zone in the case of possible rises in line with political developments, macroeconomic data or positive news flow in the DOGE ecosystem. In the opposite case or possible negative news flow, the $0.15680 level may be triggered. In case of a decline to these levels, the momentum may increase and a new bullish wave may start.
Supports 0.15680 – 0.14952 – 0.14237
Resistances 0.16686 – 0.17766 – 0.18566
Legal Notice
The investment information, comments and recommendations contained herein do not constitute investment advice. Investment advisory services are provided individually by authorized institutions taking into account the risk and return preferences of individuals. The comments and recommendations contained herein are of a general nature. These recommendations may not be suitable for your financial situation and risk and return preferences. Therefore, making an investment decision based solely on the information contained herein may not produce results in line with your expectations.