
BTC/USDT
Looking at the key developments, Bitcoin’s market value reached $2.36 trillion, surpassing Amazon and rising to fifth place among global mainstream assets, making it the best-performing currency as of 2025. Institutional purchases continue unabated; Japanese fashion brand ANAP purchased 28.74 BTC, while Remixpoint acquired 116.72 BTC. The Bhutanese Royal Government transferred a total of 449.3 BTC to central exchanges over the past 11 days.
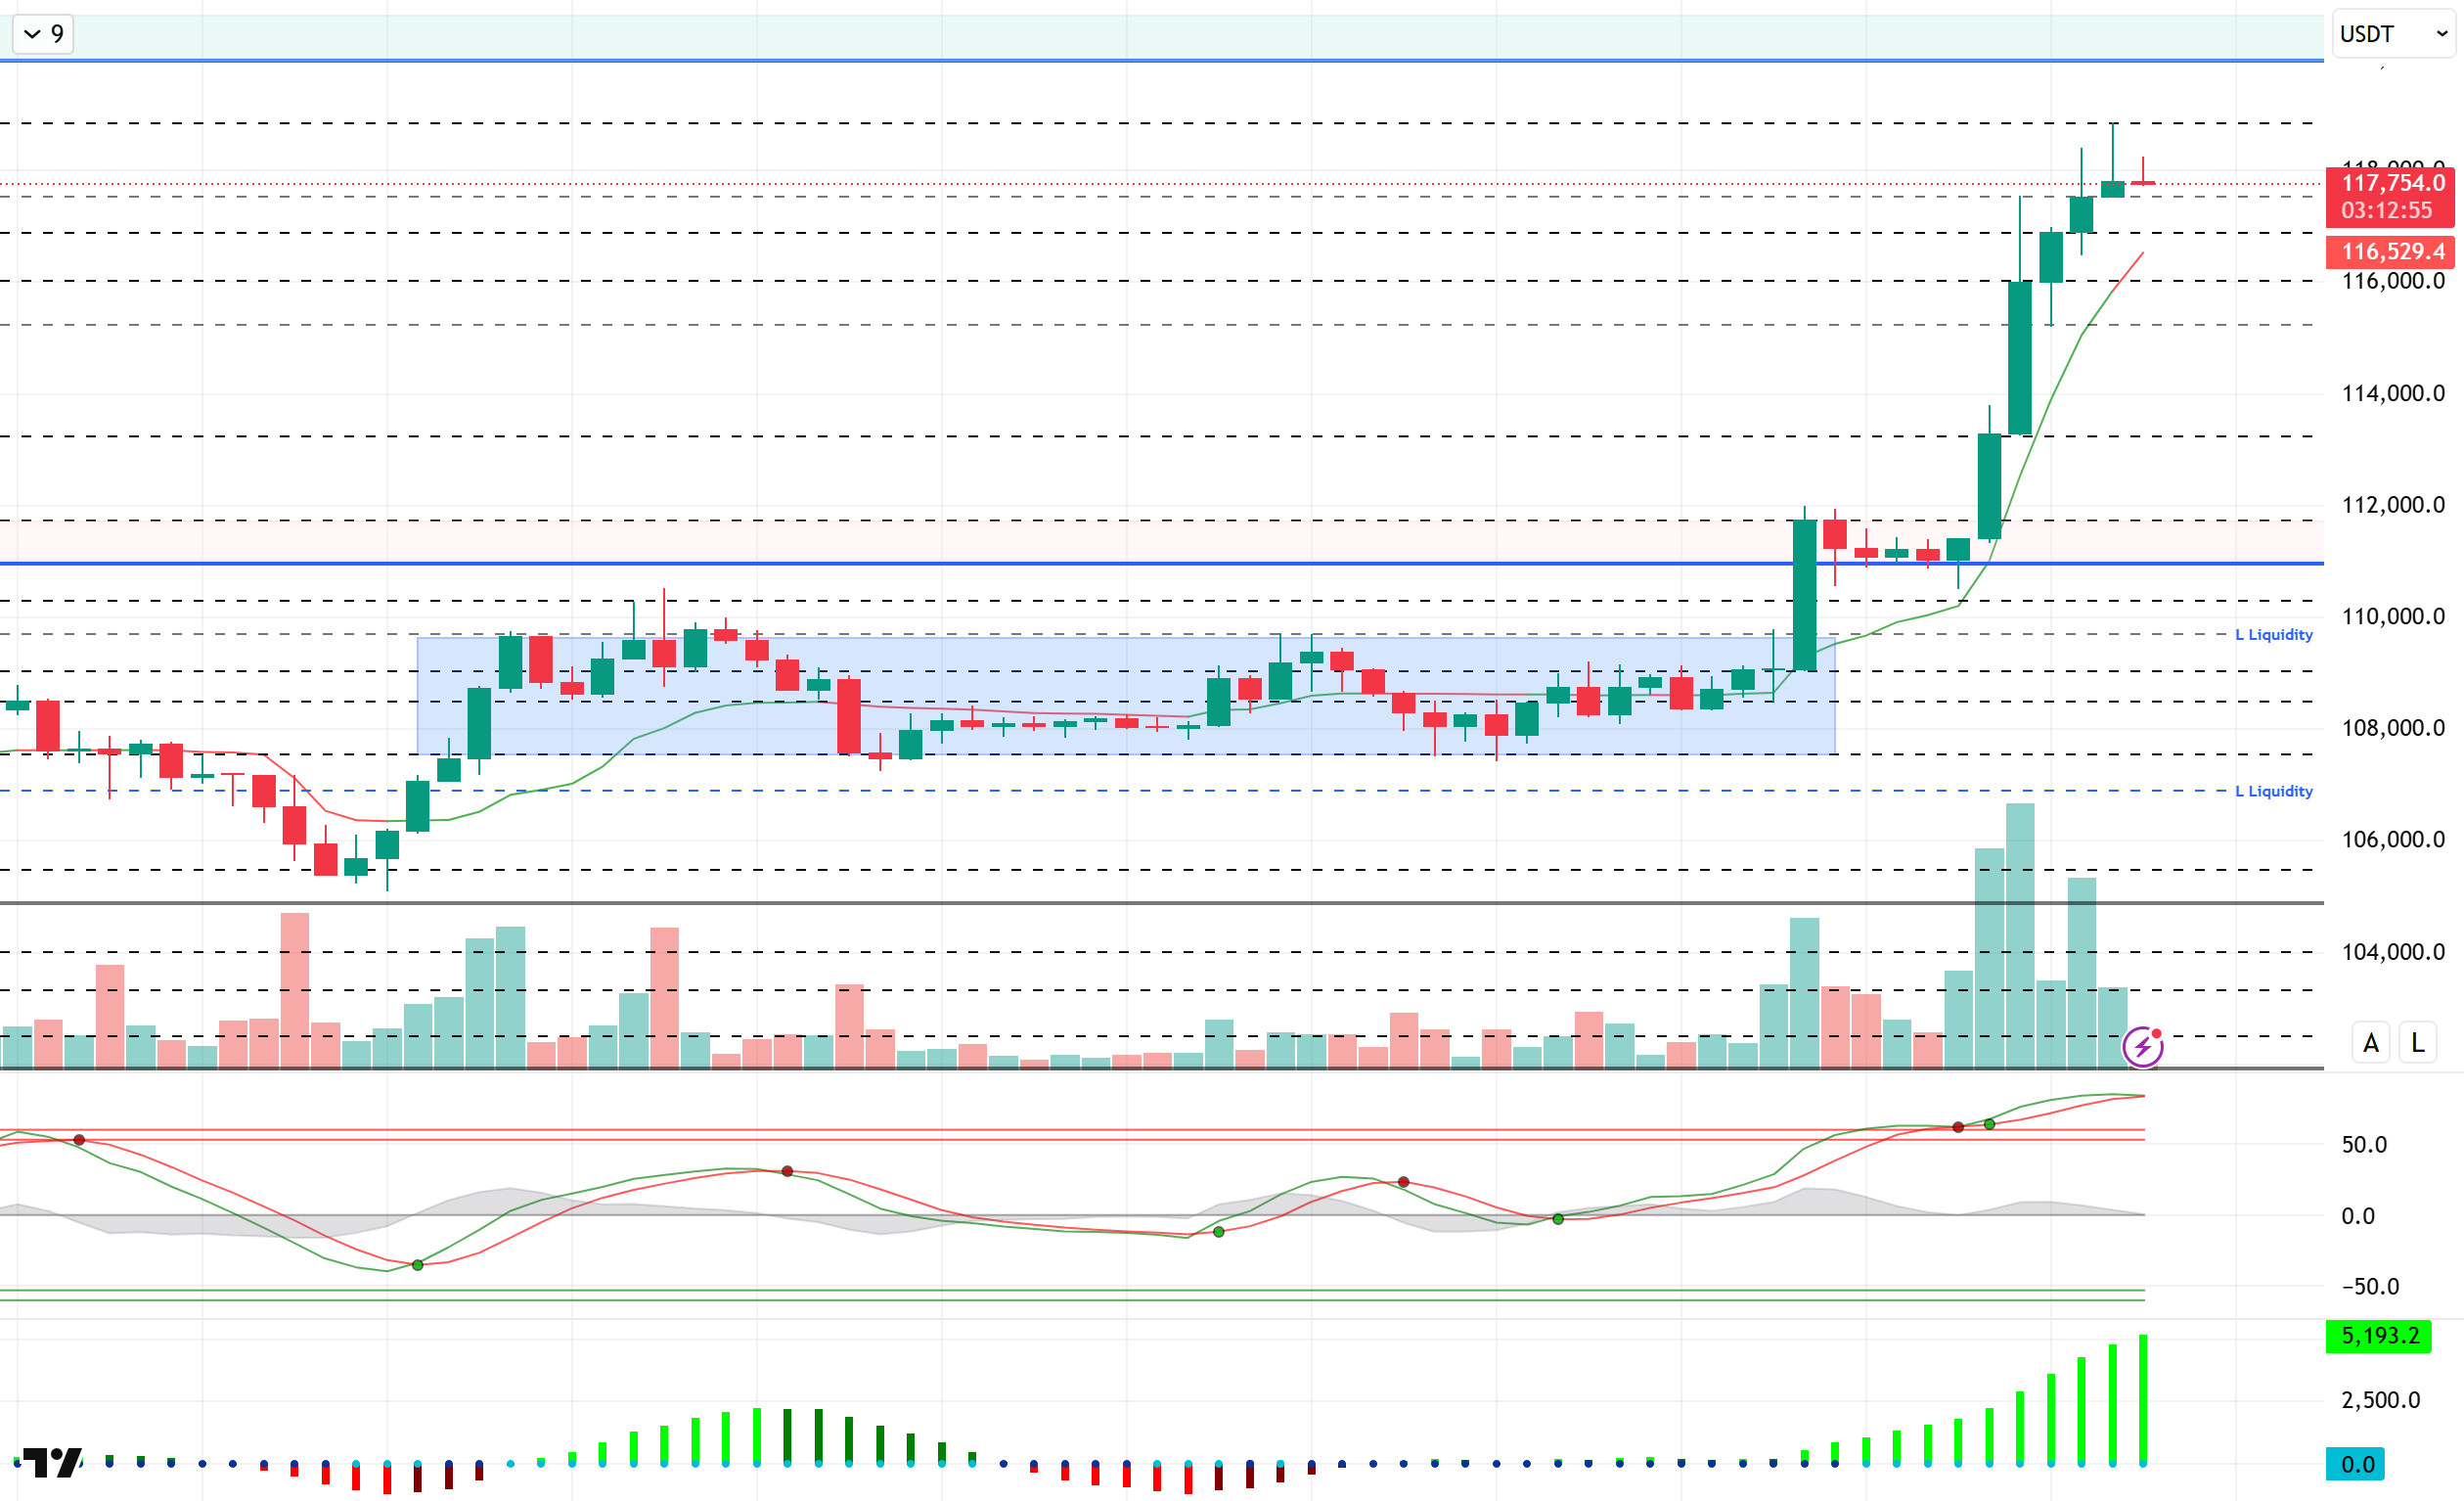
Looking at the technical picture, we can see that the upward trend in the BTC price is continuing. In the previous analysis, a new high was recorded at the 118,400 level. After consolidating at this level for a while, BTC regained momentum and reached an all-time high of 118,800. At the time of this analysis, BTC is trading around the 117,800 level and continues to maintain its strong position.
Looking at technical indicators, the Wave Trend (WT) oscillator has entered the overbought zone with the latest rise, signaling a possible trend reversal, while showing divergence with the current rise. In contrast, the Squeeze Momentum (SM) indicator continues to remain in positive territory, providing momentum support to price movement without any signs of weakness. The Kaufman moving average has risen to the 116,500 level, remaining just below the price and supporting the upward movement.
When liquidity data is examined, a limited accumulation of buy positions at the 110,000 level is observed in the short term, while a strong accumulation of buy positions at the 106,600 level continues in the longer term. Notably, with the recent rally, approximately 2.42 billion dollars worth of short positions have been liquidated, marking the largest single-day liquidation in the past four years.
In summary, it is noteworthy that fundamental developments continue to contribute positively to pricing and that BTC is entering the upcoming crypto week with a new ATH. Although the technical outlook indicates some weakness in the short term due to excessive buying, increasing momentum and market risk appetite appear to be supportive for the BTC price. During this process, the psychological level of 120,000 stands out as an important resistance level, while the 116,800 – 116,000 range will be monitored as minor support areas in the event of a potential profit-taking sell-off.
Supports 116,800– 116,000 – 115,000
Resistances 118,800 – 120,000 – 125,000
ETH/USDT
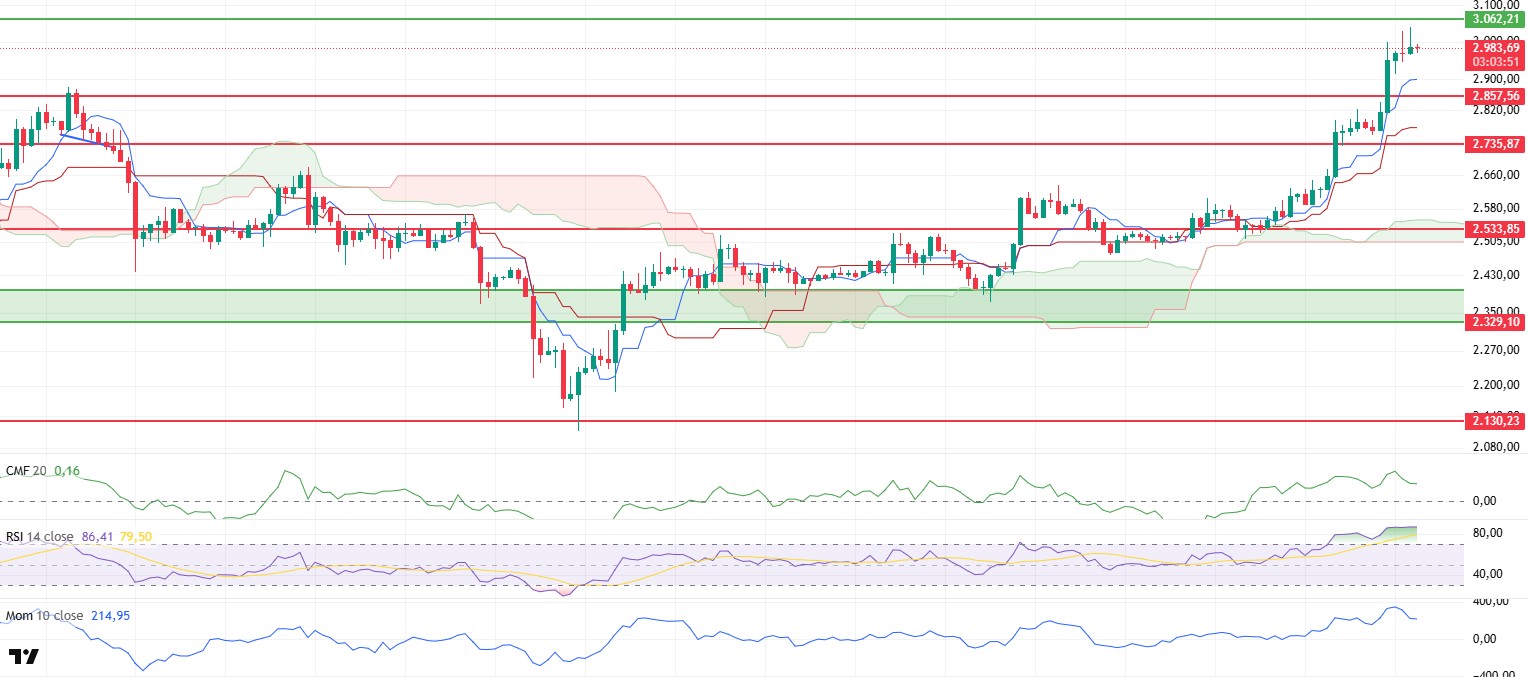
ETH rose to $3,040 during the day before falling back to $2,980 due to selling pressure. This price movement was accompanied by noticeable easing in some technical indicators, particularly those in overbought territory.
The pullback seen in the Chaikin Money Flow (CMF) indicator can be interpreted as a natural reflection of profit-taking at the $3,000 level. While the decline in CMF indicates some liquidity outflow from the market, the indicator’s continued presence in positive territory suggests that the overall market structure remains intact.
The Relative Strength Index (RSI) indicator has also shifted to a slight downward trend. However, its continued presence in the overbought zone indicates that the upward movement has become too heated and that the risk of a short-term correction persists. This RSI outlook suggests that a cooling-off period may be necessary for the uptrend to continue.
On the other hand, a slight slowdown in momentum is also noticeable. This indicates that the price may have started to lose momentum and is searching for a new equilibrium zone. The horizontal movement of the Ichimoku indicator components also supports this view. It is possible to say that the market is showing a tendency to consolidate at these levels.
Overall, if the price breaks through the psychological resistance level of $3,000 in the evening with high volume, an upward movement is expected to gain momentum. Closings above this level could pave the way for higher targets, along with a retest of the $3,040 peak. On the other hand, the 2,857 dollar level stands out as an important support point in case of potential pullbacks. This area should be monitored as a critical zone where the price could show signs of recovery, as it has historically been one of the regions where buyer activity has intensified.
Supports 2,857 – 2,735 – 2,533
Resistances 3.062 – 3.246 – 3.455
XRP/USDT
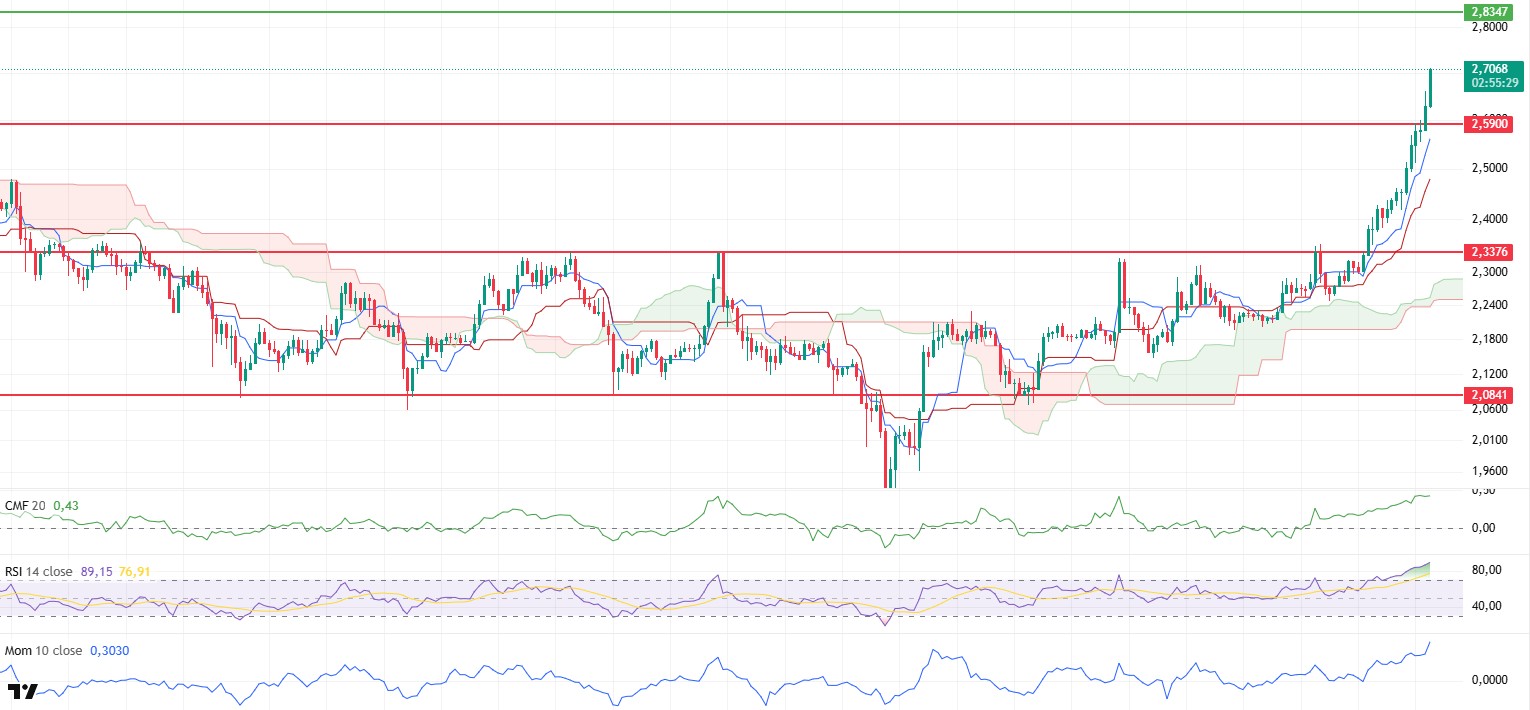
XRP managed to break through the critical resistance level of $2.59 with high volume as expected and continued its upward momentum, rising to $2.68. This upward movement is not limited to breaking a technical barrier, but also indicates strong momentum that is boosting market confidence and supporting the uptrend. The break of the resistance level with high volume indicates that this movement is not temporary and that buying momentum remains strong.
Technical indicators continue to maintain their positive structure in line with price movements. The Relative Strength Index (RSI) indicator remains in the overbought zone but continues to maintain its upward trend. Under normal conditions, the RSI being at these levels could indicate an overbought condition and pose a risk of correction. However, in the current situation, the price increase is strongly supported by momentum, so this RSI reading does not signal weakness but rather indicates the strength of the trend.
The Chaikin Money Flow (CMF) indicator also remains in positive territory, continuing its upward movement. This indicates increased liquidity inflows into the market and strong ongoing investor interest in XRP. The CMF’s structure reveals that the uptrend is not only technical but also structurally grounded, indicating sustainable buying appetite.
Overall, if the XRP price remains above the $2.59 level, the upward trend is expected to continue up to the $2.83 level. The absence of strong resistance up to this level suggests that the price has room to move higher from a technical perspective. However, closes below the 2.59 dollar level could signal a weakening of the current momentum and pave the way for short-term corrective movements. Therefore, this level should be closely monitored as a critical threshold for the health of the trend.
Supports 2.5900 – 2.3376 – 2.2111
Resistances 2.8347 – 3.1497 – 3.4014
SOL/USDT
FTX released shares worth $31 million in SOL.
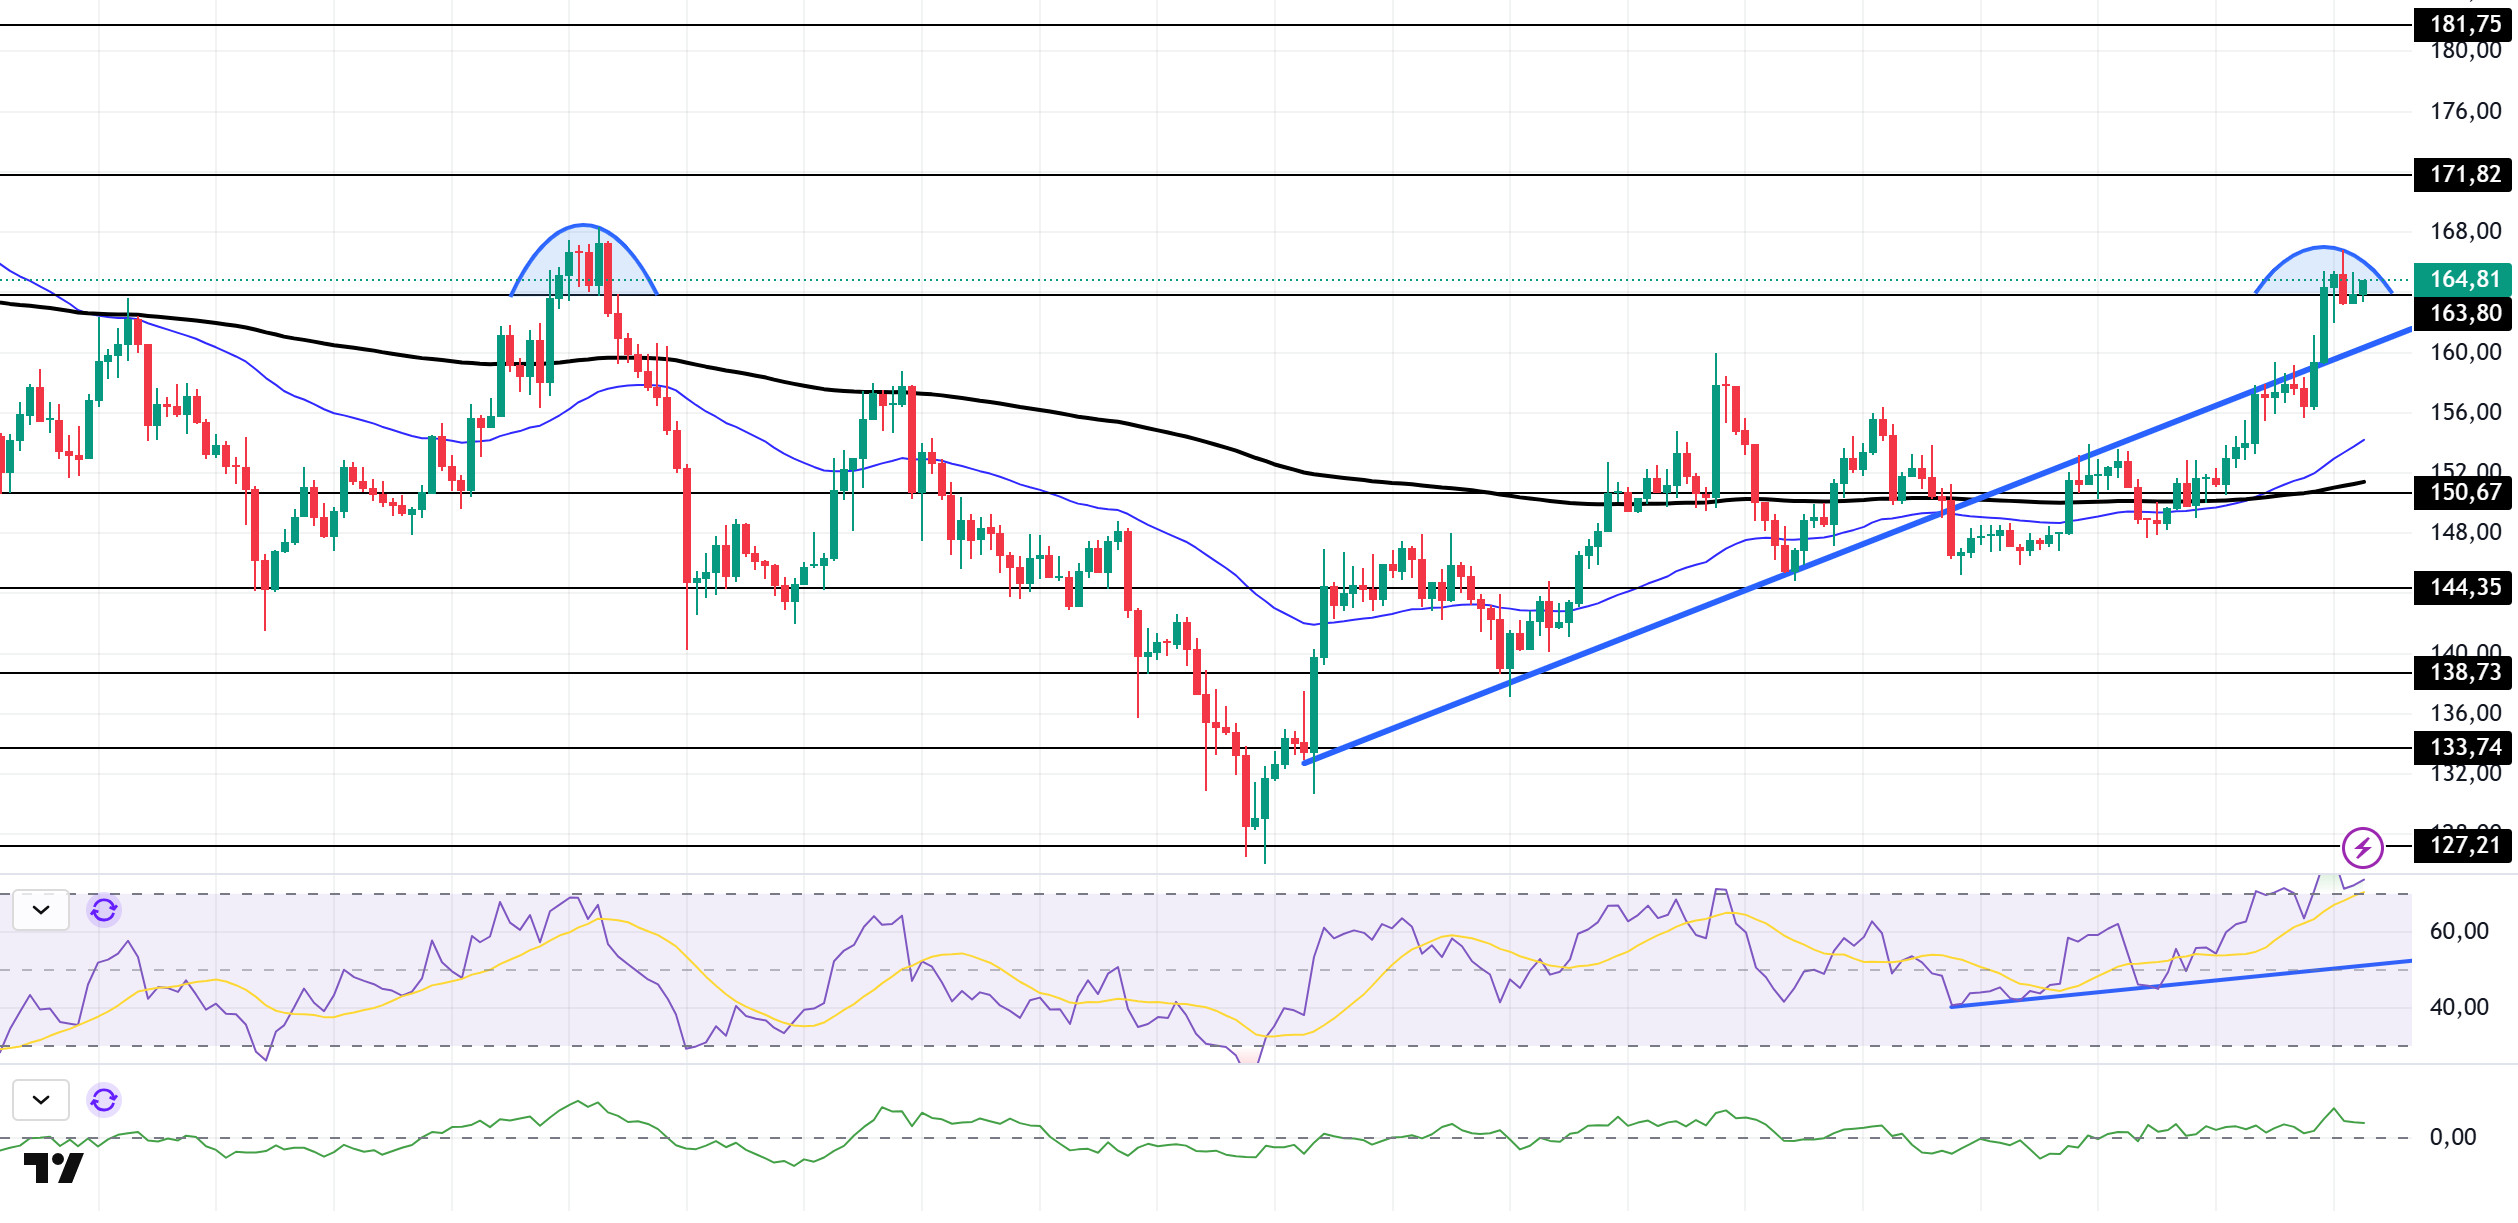
SOL price remained flat during the day. The asset broke the upward trend that began on June 23, breaking through the strong resistance level of $163.80, and began to retreat, trading below this level again. If the retreat continues, it may test the upward trend as support. On the other hand, the double top formation that has formed could deepen the pullback.
On the 4-hour chart, the 50 EMA (Blue Line) remains above the 200 EMA (Black Line). This indicates that the upward trend may continue in the medium term. Additionally, the price being above both moving averages suggests that the market is currently in an upward trend in the short term. Chaikin Money Flow (CMF-20) remained in positive territory; however, the decline in money inflows could push CMF into negative territory. The Relative Strength Index (RSI-14) remained in positive territory and is in the overbought zone. This could trigger profit-taking. Additionally, it remains above the upward trend that began on July 4. If there is an upward movement due to macroeconomic data or positive news related to the Solana ecosystem, the $171.82 level emerges as a strong resistance point. If this level is broken upward, the upward trend is expected to continue. In the event of a pullback due to adverse developments or profit-taking, the $150.67 level could be tested. A decline to these support levels could see an increase in buying momentum, potentially presenting a buying opportunity.
Supports 150.67 – 144.35 – 138.73
Resistances 163.80 – 171.82 – 181.75
DOGE/USDT
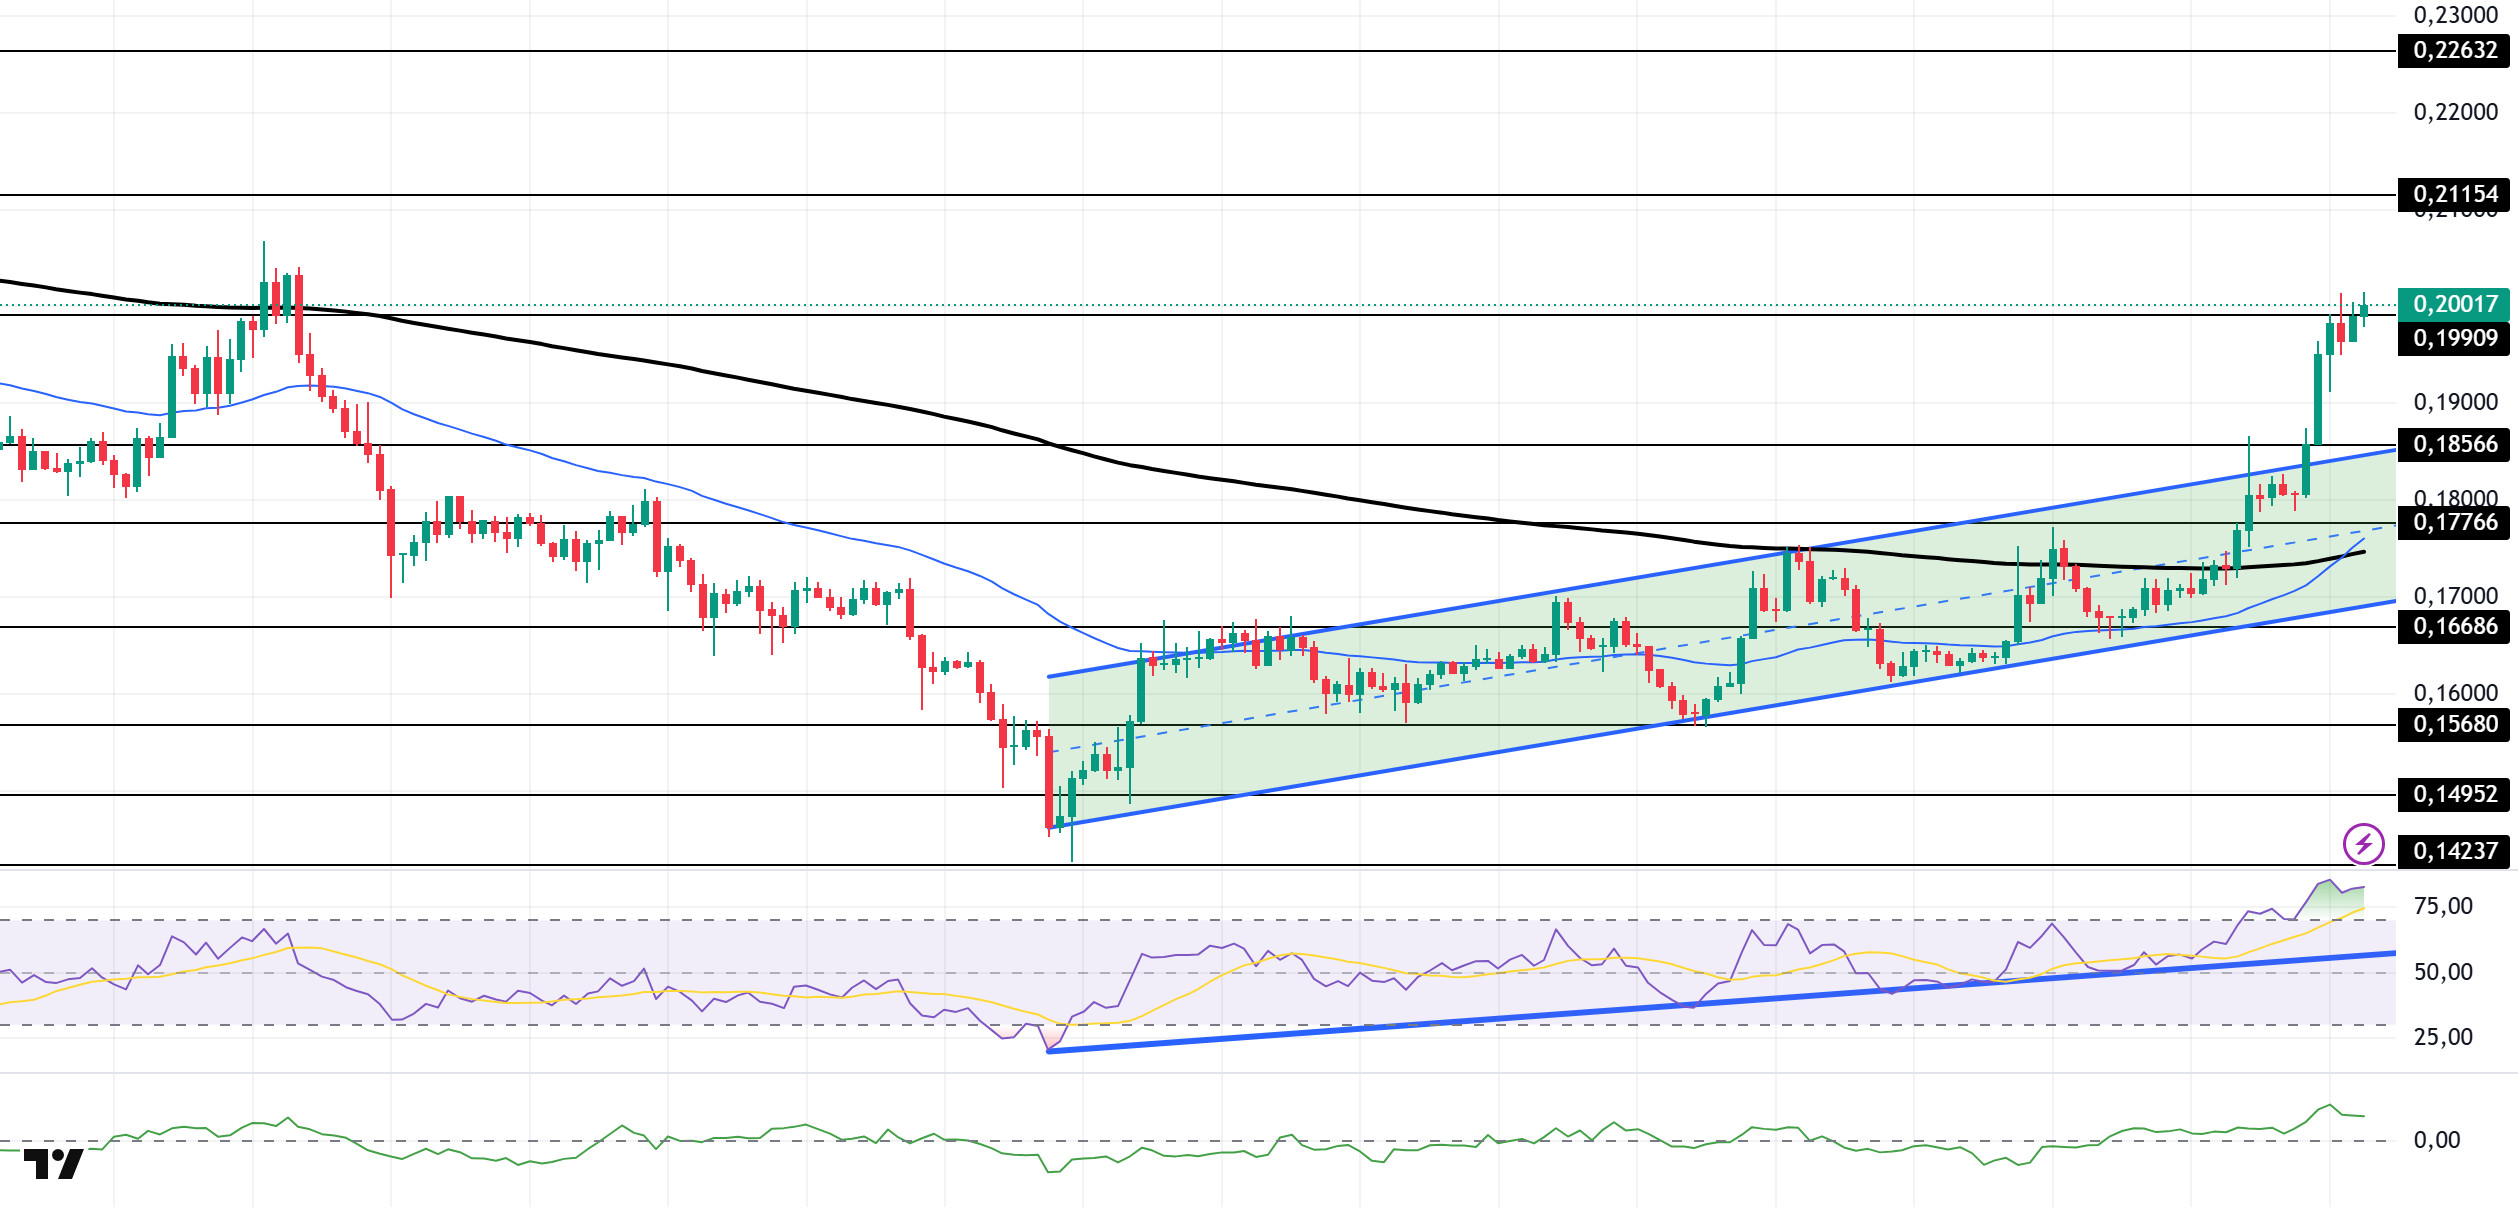
The DOGE price remained flat during the day. The asset managed to stay above the 200 EMA (Black Line) moving average but lost momentum and failed to break through the strong resistance level of $0.19909. If the upward momentum continues, the $0.21154 level could be targeted. In the event of a pullback, the 0.18566 dollar level could be triggered.
On the 4-hour chart, the 50 EMA (blue line) has started to move above the 200 EMA (black line). This indicates that the asset is in an upward trend in the medium term. The price being above both moving averages signals that the asset is in an upward trend in the short term. Chaikin Money Flow (CMF-20) remains in positive territory. Additionally, negative cash inflows could push the CMF into the negative zone. The Relative Strength Index (RSI-14) is in the overbought zone and continues to hold above the upward trend that began on June 22, supported by that trend. Being in the overbought zone may trigger profit-taking. In the event of upward movements driven by political developments, macroeconomic data, or positive news flow within the DOGE ecosystem, the $0.21154 level emerges as a strong resistance zone. In the opposite scenario or in the event of negative news flow, the 0.18566 dollar level could be triggered. A decline to these levels could increase momentum and potentially initiate a new upward wave.
Supports 0.18566 – 0.17766 – 0.16686
Resistance levels 0.19909 – 0.21154 – 0.22632
Legal Notice
The investment information, comments and recommendations contained herein do not constitute investment advice. Investment advisory services are provided individually by authorized institutions taking into account the risk and return preferences of individuals. The comments and recommendations contained herein are of a general nature. These recommendations may not be suitable for your financial situation and risk and return preferences. Therefore, making an investment decision based solely on the information contained herein may not produce results in line with your expectations.