Technical Analysis
BTC/USDT
US President Trump said that the conflict between Israel and Iran could resume and that it could happen very soon. Reiterating his concerns about Iran’s nuclear program, Trump stated that they are ready to intervene if necessary. At the same time, Trump reiterated his intention to dismiss Fed Chairman Powell and announced that he is considering 3-4 candidates for the new presidency. In Asia, Hong Kong, which has taken an important step in the field of digital assets, aims to accelerate the tokenization and integration process by publishing the “Digital Asset Policy 2.0” document. In the corporate sphere, Japan-based Metaplanet increased its reserve to 12,345 by buying another 1,234 BTC and continues to expand its global strategy through its subsidiary in the US.
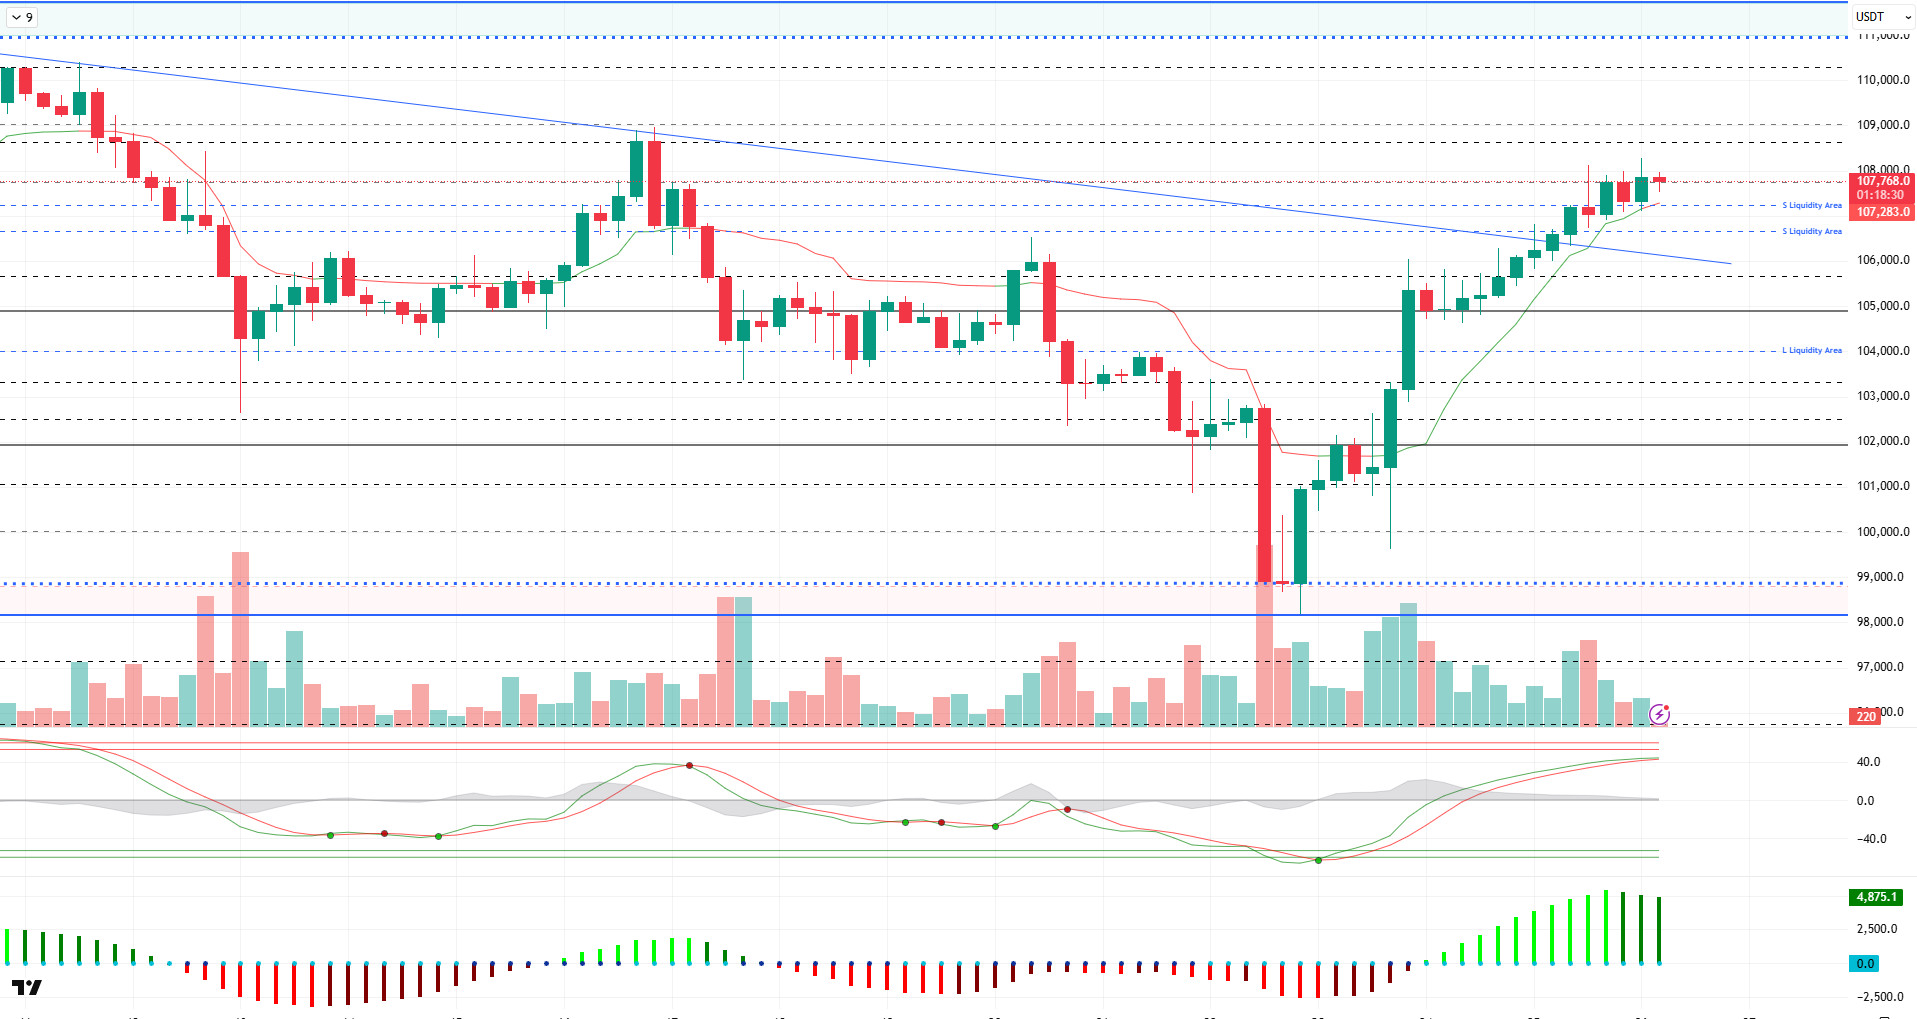
When we look at the technical outlook, BTC gives a strong image by taking place above the 106,000 level as it continues to maintain and build on its gains. Breaching the upper line of the downtrend structure, BTC continues to trade at 107,700 at the time of writing.
On the technical indicators front, the Wave Trend (WT) oscillator is weakening as it moves close to the overbuy zone. The Squeeze Momentum (SM) indicator is also showing signs of weakening, with the histogram back in positive territory, supporting the uptrend. The Kaufman moving average continues to be below the price, positioned at 107,200.
Analyzing the liquidity data, buy trades started to reappear, while the liquidation of the sell trades in the 107.300 band was also realized with the last rise. While the selling level is diluted, the buying levels remain stable.
As a result, while the positive scenario created by fundamental developments continues in terms of pricing, some technical weakening as well as liquidity data accompany the weakening. In this context, ATH will be followed as a resistance area and 105,500 – 105,000 will be followed as a support band in a possible selling pressure.
Supports 106,000 – 105,000 – 103,300
Resistances 107,300 – 109,000 – 110,000
ETH/USDT
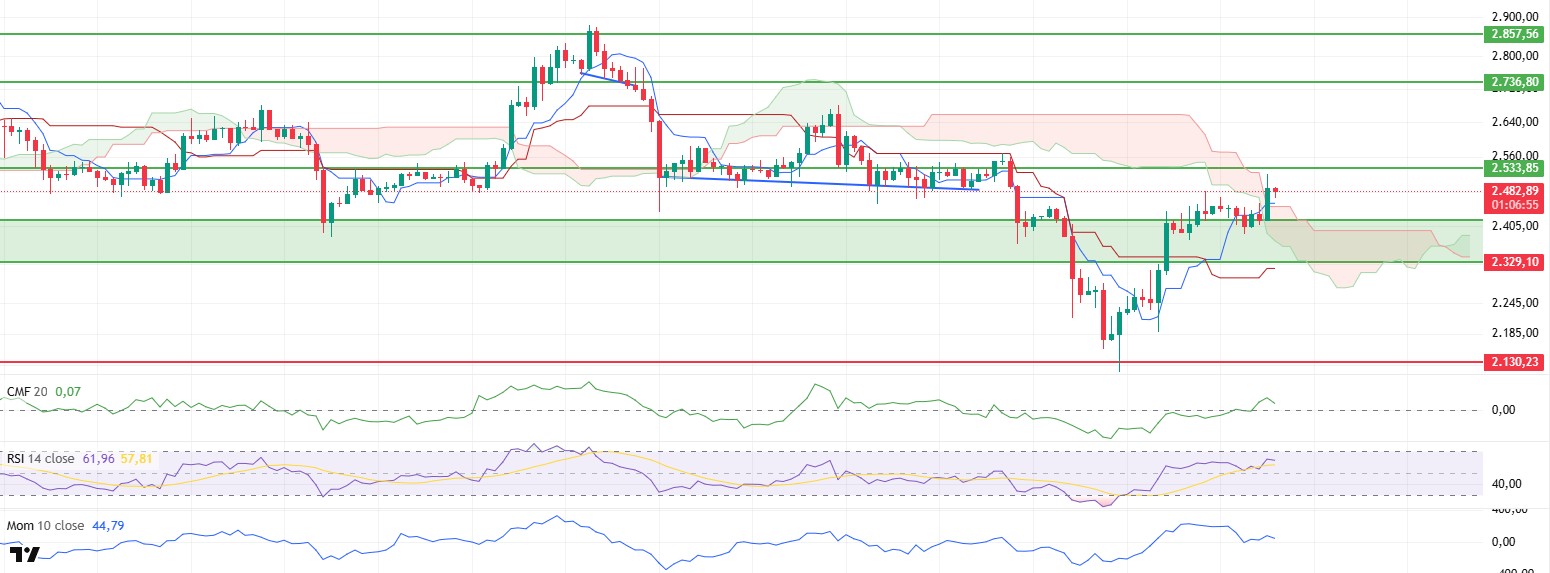
ETH retreated to below the $2,400 level with the sales that came in the evening hours yesterday. However, this decline was short-lived and the price recovered again with the purchases in the night hours and rose to the level of $2,520. While it is noteworthy that the upper band of the kumo cloud was exceeded during this rise, the price’s persistence above this level stands out as an important threshold in technical terms. Although there is a slight pullback momentarily, the price still manages to hold on to the kumo cloud.
Technical indicators point to a positive outlook in general. Cumulative Volume Delta (CVD) data shows that the bullish move was supported by spot buying. This is important in terms of showing that the uptrend is not only due to leveraged positions, but also real buyers are on the move. On the other hand, the fact that the funding rate returned to positive after briefly moving into negative territory suggests that the interest in long positions in futures trading has increased again and that the market is generally in an upward expectation.
The Chaikin Money Flow (CMF) indicator also supports this outlook. The indicator is still in positive territory and continues its upward momentum. Although CMF has weakened slightly with the recent decline, the fact that it has managed to stay in positive territory shows that buyers still dominate the market and liquidity inflows continue.
When the Relative Strength Index (RSI) indicator is analyzed, it is seen that it continues to stay above the based MA line. This supports that the overall trend is still upwards, while the slight pullback seen on the momentum side indicates that price movements may remain limited during the day. In other words, the market may move in a horizontal band for a while.
On the Ichimoku indicator, the price exceeded the upper band of the kumo cloud and the cloud color turned green again, supporting a positive picture, especially in terms of the short and medium-term outlook. This picture can be considered as a signal that the market is starting to enter an uptrend again.
In the general outlook, the positive structure in technical indicators and the persistence of the price above the kumo cloud maintain the upside expectation in the intraday outlook. However, the weakness in momentum suggests that this move may remain limited especially in the first half of the day and a stronger price action may develop towards the evening hours. On the other hand, if the price dips below the kumo cloud, this may increase selling pressure and a retracement back towards the $2,400 levels may occur. Therefore, the kumo cloud level should be followed as a critical technical threshold for the rest of the day.
Top of Form
Below the Form
Supports 2,329 – 2,130 – 2,029
Resistances 2,533 – 2,736 – 2,857
XRP/USDT
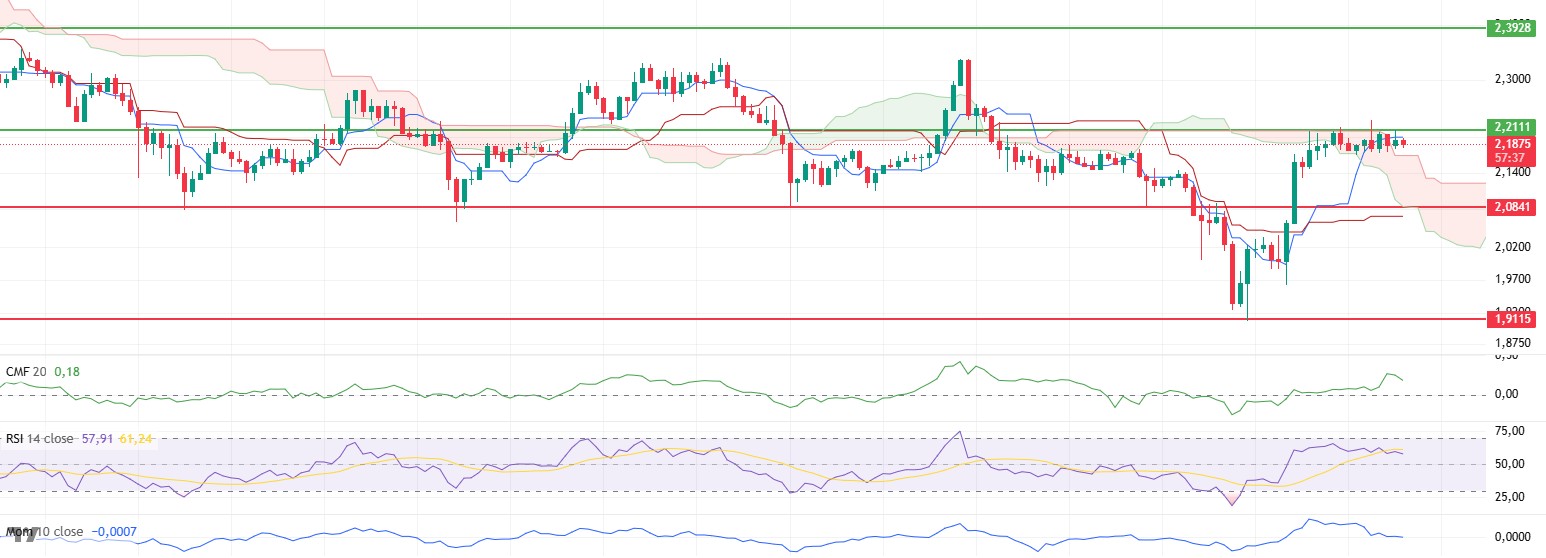
XRP price continues its horizontal movement within a narrow band. Especially after retesting the $ 2.21 level at night, it is seen that the price stabilized around $ 2.18 with the selling pressure from this region. While the price remaining stable at these levels shows that the market has become unstable and directionless, the technical outlook indicates that this stable structure may break down in the short term.
The momentum indicator continues to weaken after the price failed to break the $2.21 level. This outlook suggests that upside momentum remains weak, especially in the short term, and potential upside may remain limited. The suppression of momentum suggests that the price may remain at lower levels for a while or move towards the lower band of the horizontal trend with small pullbacks.
Despite this weak momentum, the Chaikin Money Flow (CMF) indicator still remains in positive territory. This shows that liquidity inflows continue in the market, albeit limited, and the buy side is still active in the market. However, the lack of a significant rise in CMF also reveals that purchases are struggling to turn into a strong rally.
When the Ichimoku indicator is analyzed, it is seen that the price remains above the kumo cloud. However, while the horizontal trend continues, the downward contraction of the kumo cloud and the descent below the tenkan level indicates an increase in technical weakness in the short term. This structure supports that downward correction movements may come to the fore as the price cannot exceed the resistance of $2.21.
In general terms, as long as the price remains below the $2.21 level, small-scale retracements are likely to continue due to weak momentum and technical fragility. However, in case of persistence above this level, the recovery trend in technical indicators can be felt more clearly and upward price movements may regain momentum. Therefore, the $2.21 level stands out as the critical threshold for intraday direction determination.
Supports 2.0841 – 1.9115 – 1.7226
Resistances 2.2111 – 2.3928 – 2.5900
SOL/USDT
Invesco and Galaxy submitted the S-1 form for the Solana ETF.
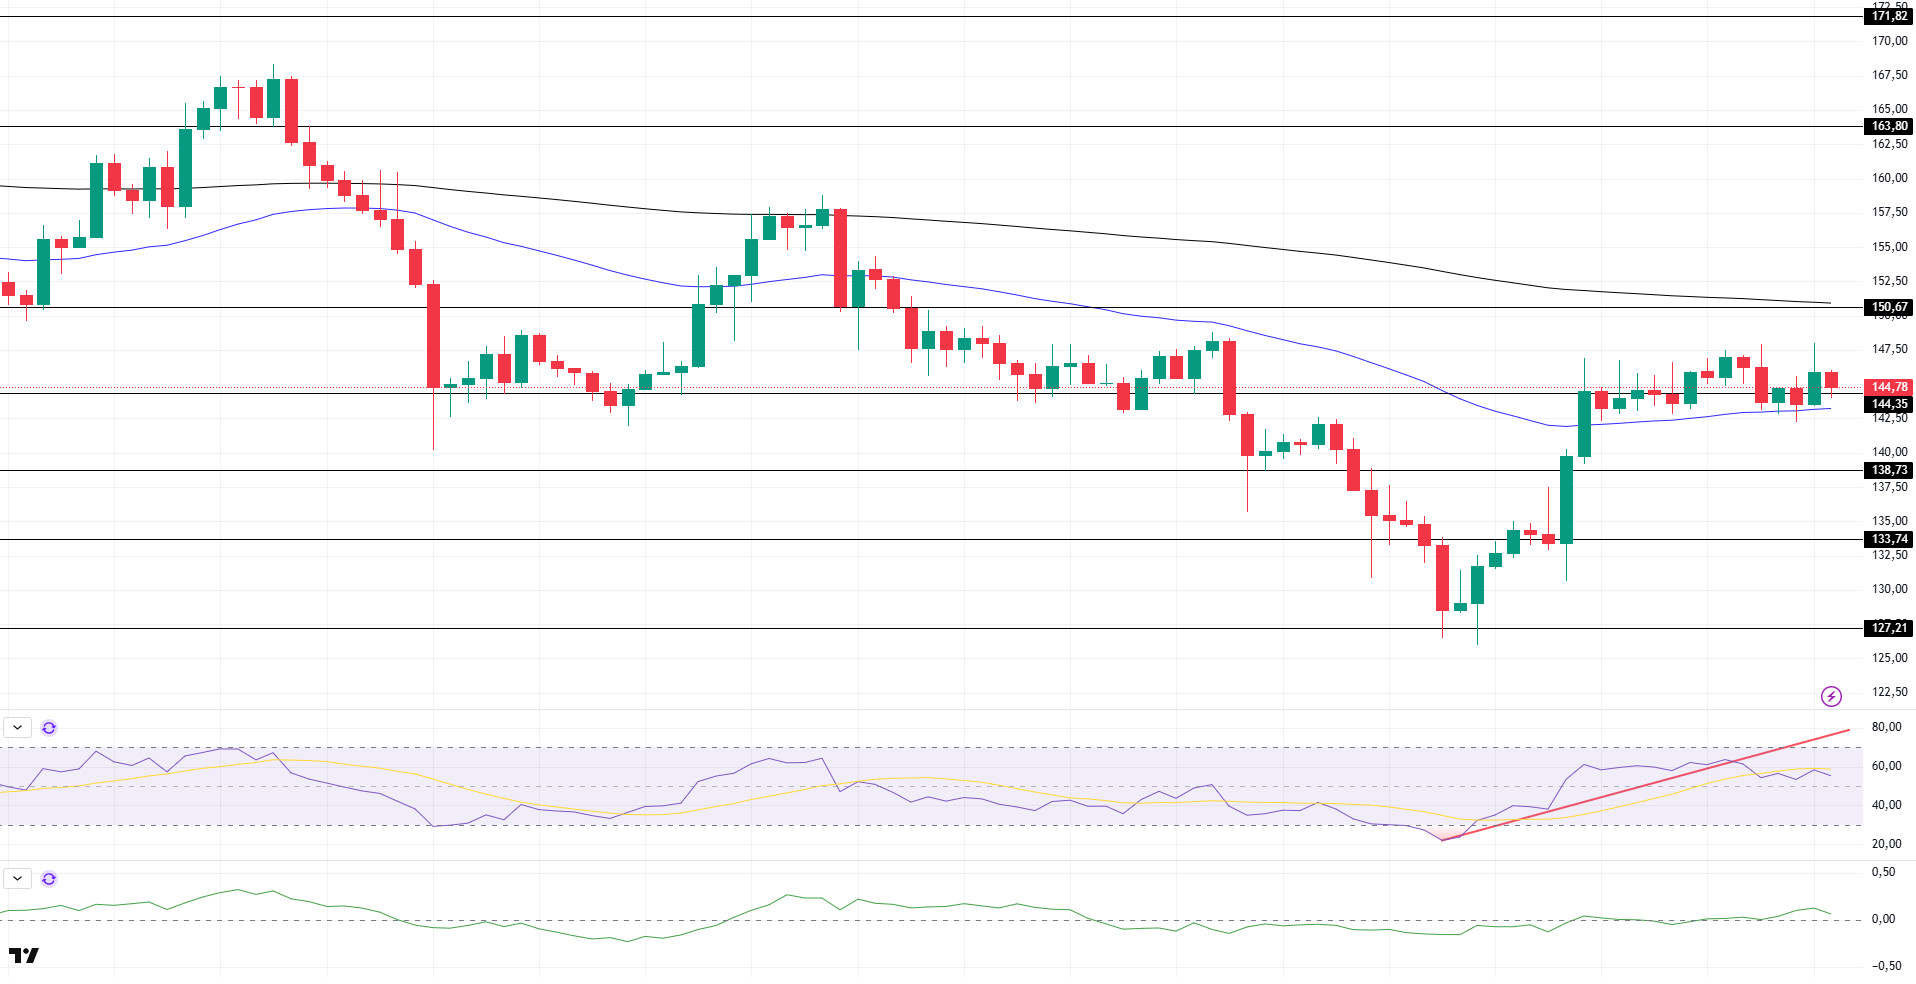
SOL price continued its sideways movement. The asset remains above the strong support level of $144.35 and the 50 EMA (Blue Line) moving average. If the upside movement continues, it may test the 200 EMA (Black Line) moving average as resistance. Candle closes below the $144.35 level and the 50 EMA may result in a pullback.
On the 4-hour chart, the 50 EMA continued to be below the 200 EMA. This suggests that the bearish trend may continue in the medium term. At the same time, the fact that the price is between both moving averages suggests that the market is currently in a short-term decision-making phase. Chaikin Money Flow (CMF-20) crossed into positive territory; an increase in additional inflows may move CMF into positive territory. Relative Strength Index (RSI-14) continued to move at the mid-level of the positive zone. However, selling pressure has emerged. On the other hand, it also broke the uptrend that started on June 22nd to the downside. This may bring a decline. The $150.67 level stands out as a strong resistance point in case of an uptrend on the back of macroeconomic data or positive news on the Solana ecosystem. If this level is broken upwards, the rise can be expected to continue. If there are pullbacks due to contrary developments or profit realizations, the $ 138.73 level can be tested. In case of a decline to these support levels, the increase in buying momentum may offer a potential bullish opportunity.
Supports 144.35 – 138.73 – 133.74
Resistances 150.67 – 163.80 – 171.82
DOGE/USDT
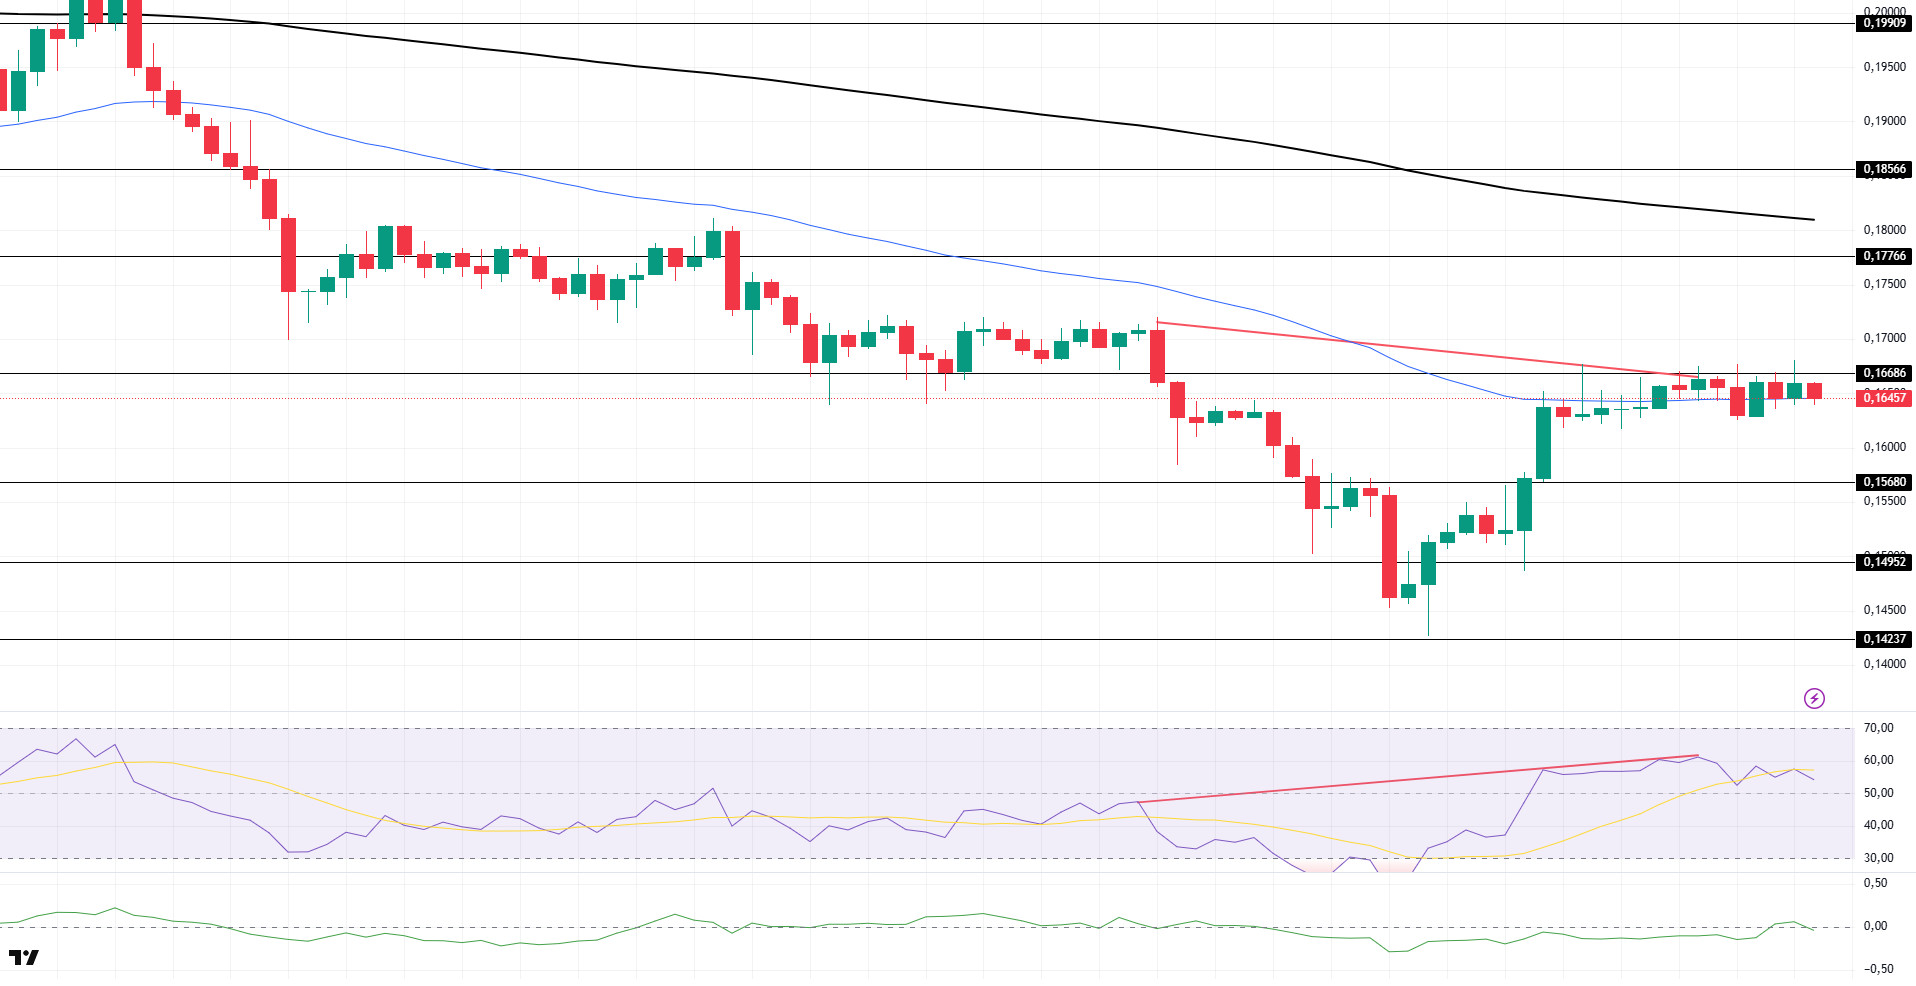
DOGE price continued to move sideways. The asset hit strong resistance at $0.16686 and failed to break it, testing the 50 EMA (Blue Line) moving average as support. If the price accelerates upwards and closes above the $0.16686 level, it may test the $0.17766 level.
On the 4-hour chart, the 50 EMA (Blue Line) continues to be below the 200 EMA (Black Line). This suggests that the asset is bearish in the medium term. The fact that the price is between the two moving averages suggests that the asset is in the decision phase in the short term. Chaikin Money Flow (CMF-20) remained in negative territory. In addition, negative inflows may push CMF deeper into the negative territory. Relative Strength Index (RSI-14) remained in positive territory. However, selling pressure has emerged. However, there is a bearish mismatch. These may cause a decline. The $0.16686 level stands out as a strong resistance zone in the uptrend that may be experienced in line with political developments, macroeconomic data or positive news flow in the DOGE ecosystem. In the opposite case or possible negative news flow, the $0.15680 level may be triggered. In case of a decline to these levels, the momentum may increase and a new bullish wave may start.
Supports 0.15680 – 0.14952 – 0.14237
Resistances 0.16686 – 0.17766 – 0.18566
Legal Notice
The investment information, comments and recommendations contained herein do not constitute investment advice. Investment advisory services are provided individually by authorized institutions taking into account the risk and return preferences of individuals. The comments and recommendations contained herein are of a general nature. These recommendations may not be suitable for your financial situation and risk and return preferences. Therefore, making an investment decision based solely on the information contained herein may not produce results in line with your expectations.