
Aktif Adresler
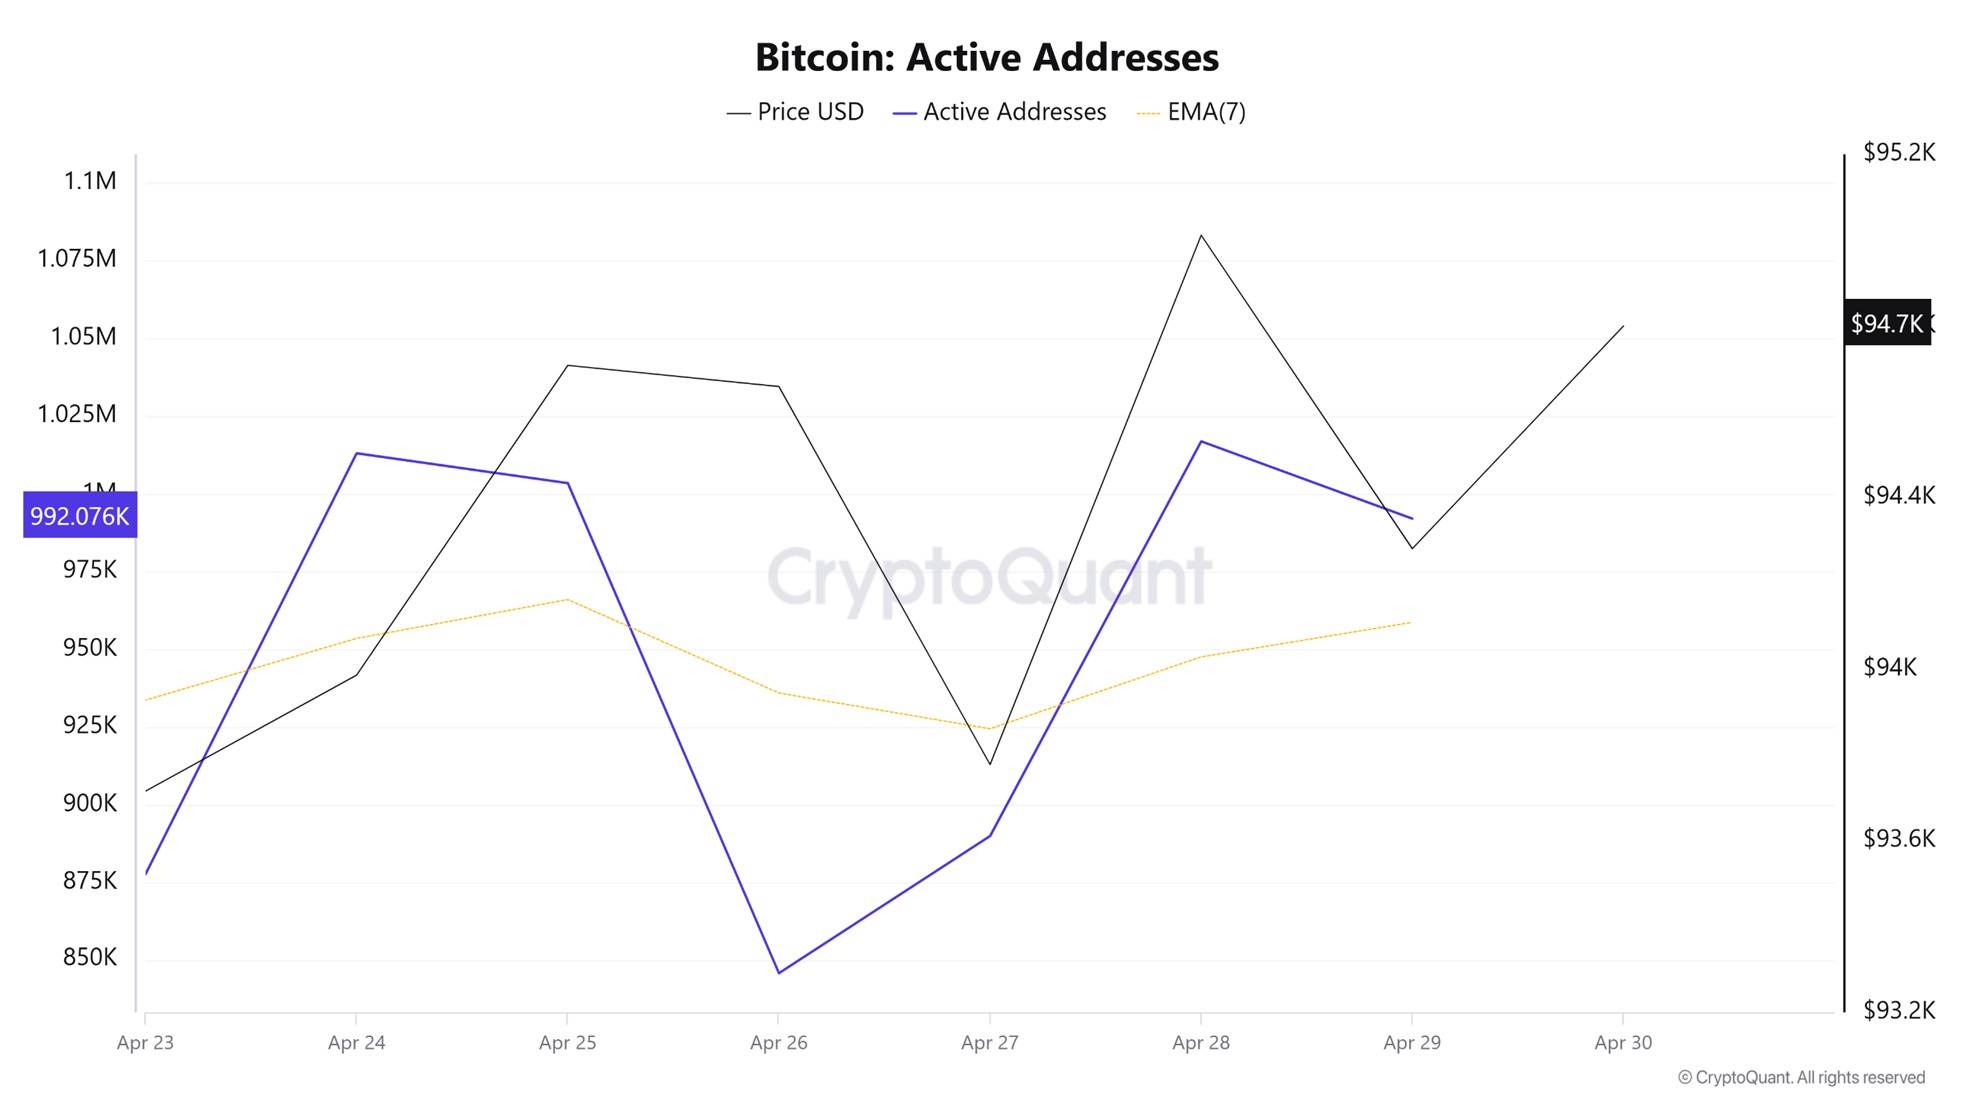
In terms of active addresses, there were 1,016,940 active entries on the BTC network this week between Nisan 23 and Nisan 30, 2025. During this period, Bitcoin rose to $95,011. In the region marked on the chart, where the price and the number of active addresses intersect, we see that Bitcoin purchases have changed direction. When we follow the 7-day simple moving average, it is observed that the price follows an upward trend on the dates when this average cuts the price. This situation indicates that the Bitcoin price is experiencing entries at $93,000 levels.
Aktif Gönderme Adresleri
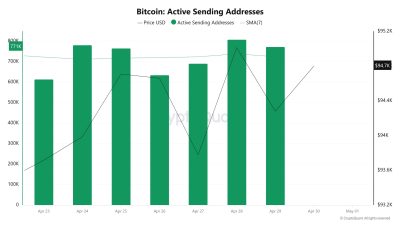
With the Black Line (price line) in active shipping addresses, there has been a significant drop in active shipping addresses after Nisan 26. On the day when the price hit its lowest point, active sending addresses rose as high as 634,644 indicating that buyers sold their positions as Bitcoin stayed around the $94,000 level for a while. As a result, it is seen that price drops cause an acceleration in sending addresses.
Aktif Alıcı Adresleri
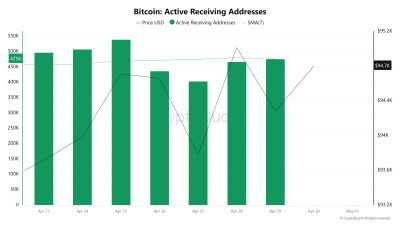
With the Black Line (price line) in active shipping addresses, there has been a significant rise in active shipping addresses after Nisan 28. On the day of the price high point, active shipping addresses fell as low as 403,217 indicating that buyers took their positions at Bitcoin’s $93,000 levels.
Breakdowns
MRVR
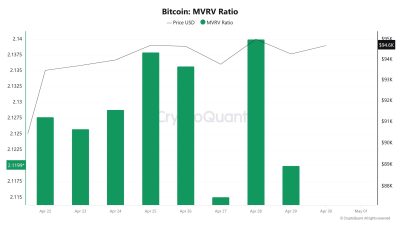 On Nisan 23rd, Bitcoin price was 93,715 while MVRV Ratio was 2.12. As of Nisan 29, the Bitcoin price was 94,280, while the MVRV Ratio was 2.11. Compared to last week, Bitcoin price increased by 0.60% while MVRV Ratio decreased by 0.47%.
Realized Price
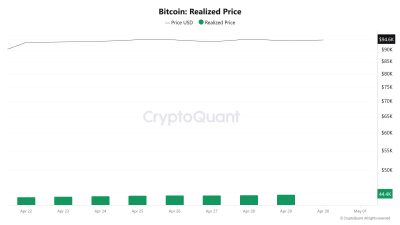
On Nisan 23rd, Bitcoin price was 93,715 while Realized Price was 44,084. As of Nisan 29, the Bitcoin price was 94,280 while the Realized Price was 44,472. Compared to last week, there was a 0.6% increase in Bitcoin price and a 0.88% increase in Realized Price.
Spent Output Profit Ratio (SOPR)
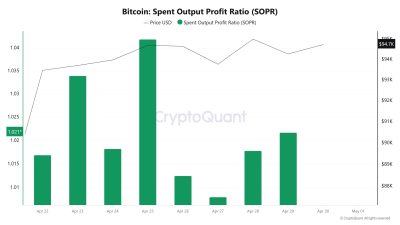
On Nisan 23, the Bitcoin price was at 93,715 while the SOPR metric was at 1,033. As of Nisan 29, the Bitcoin price rose to 94,280 while the SOPR metric fell to 1,021. Compared to last week, Bitcoin price increased by 0.6% while the SOPR metric decreased by 1.16%.
Türevler
Açık Faiz
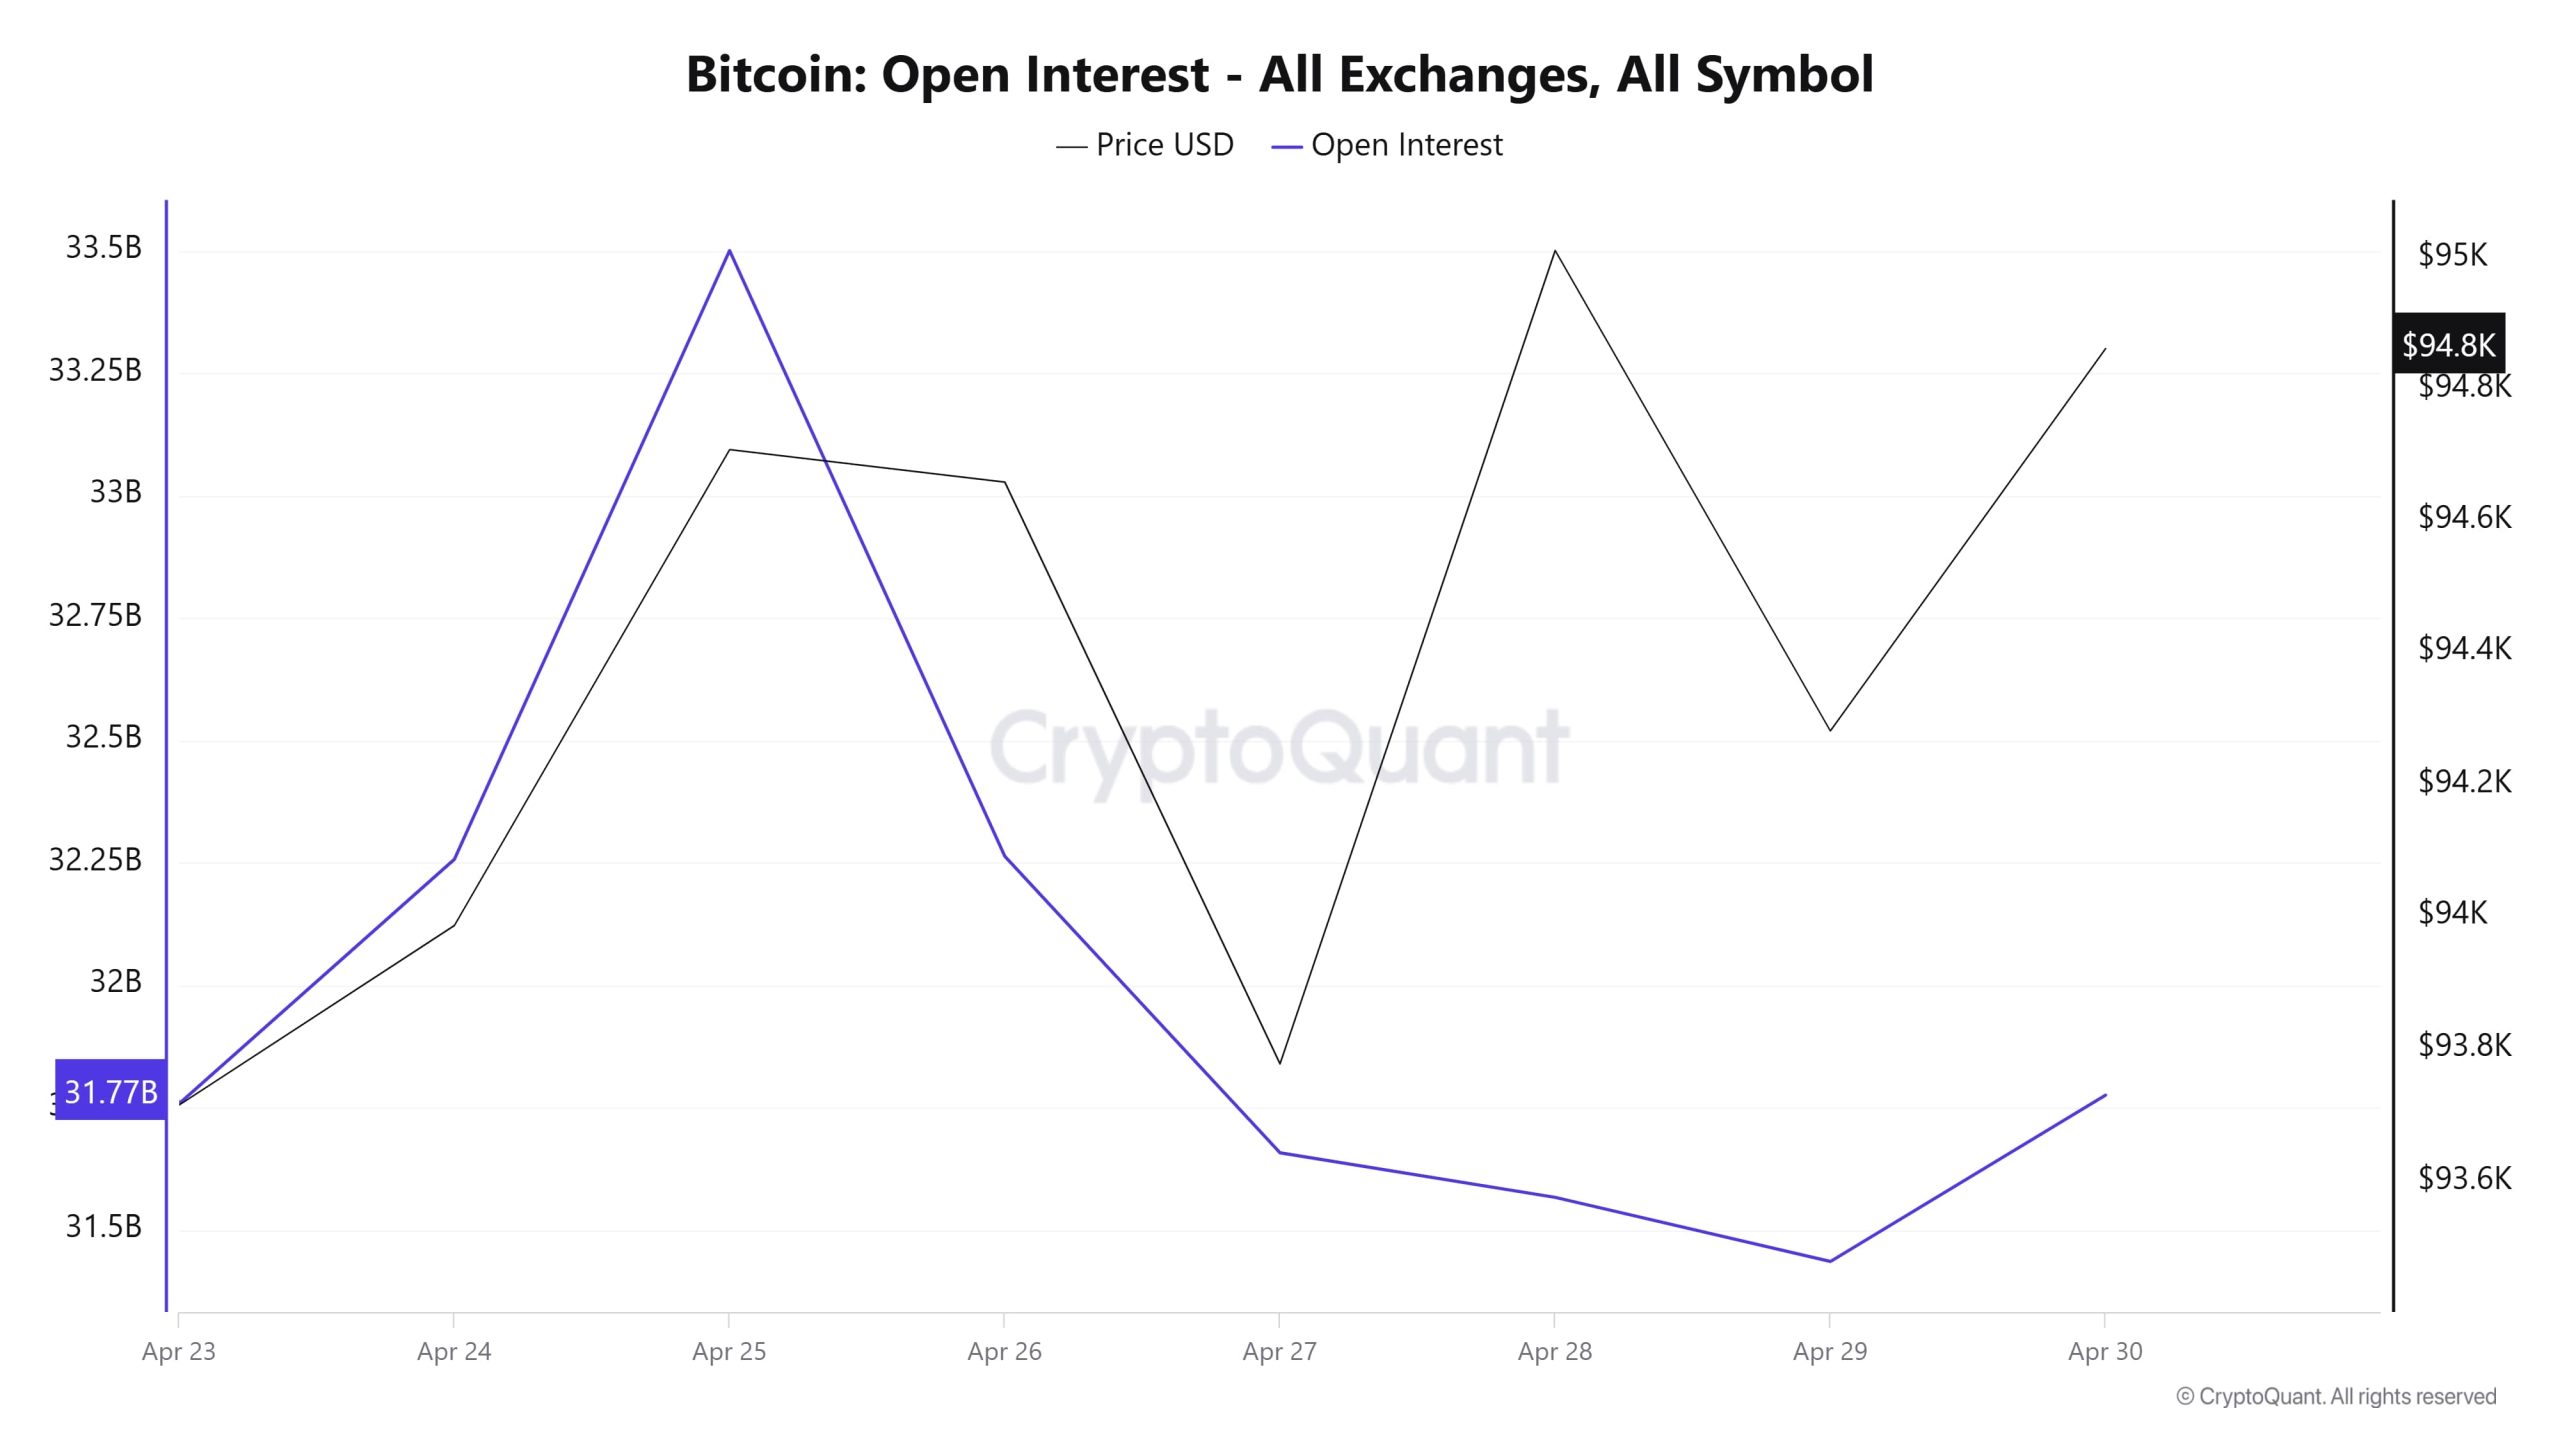
At the beginning of the week, on Nisan 23, open interest was at $31.77 billion while the price hovered around $93,600. By Nisan 25, both open interest and price increased, with open interest reaching a weekly high of $33.5 billion, while the price seems to have accompanied this rise. This parallel movement indicates that long positions intensified in the market and the increased participation supported the price. However, as of Nisan 26, both price and open interest declined rapidly. This sharp decline, especially in open interest, indicates that long positions have been largely closed or liquidations have taken place. This, in turn, seems to have put downward pressure on the price. On Nisan 27, although the price made a short-lived bounce, the downward trend in open interest continued, suggesting that the market was rising on spot weighted buying and selling on the futures side. By Nisan 29, open interest fell to a weekly low of $31.4 billion. At this point, although the price showed a temporary rebound, the low open interest level indicates weak participation in the market. Finally, on Nisan 30th, both price and open interest show a limited recovery trend and the futures side also seems to be gaining weight.
Fonlama Oranı
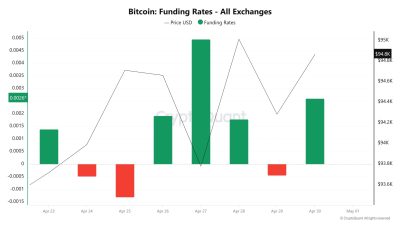
Last week, the Bitcoin futures market saw remarkable fluctuations in funding rates. On the first day of the week, the funding ratio was positive, indicating that long positions were gaining weight. However, the ratio turned negative on Nisan 24 and 25; especially the significant negative ratio on Nisan 25 revealed that short positions increased significantly and the market entered a downward expectation. From Nisan 26 onwards, funding ratios turned positive again, reaching their highest level of the week on Nisan 27, indicating that the market was overly long. This high level of long positioning usually signals that the market is overheating and a possible correction is imminent. As a matter of fact, there was a sharp pullback on the price side on the same day. In the following days, the funding ratio remained positive, but price action was limited, suggesting that upward momentum was weak despite the long positions. On Nisan 29, the funding rate turned negative again while the price declined, indicating that the cautious stance in the market continued. On Nisan 30, the funding rate turned positive again and the price reacted upwards. This simultaneous rise suggests that buyers have re-engaged in the short term.
Uzun ve Kısa Tasfiyeler
As BTC moved sideways in a relatively narrow range this week, long and short liquidation rates remained low compared to previous weeks. 234 million dollars of long and 256 million dollars of short transactions were liquidated.
| Tarih | Uzun Tutar (Milyon $) | Kısa Tutar (Milyon $) |
|---|---|---|
| Nisan 23 | 50.35 | 105.79 |
| Nisan 24 | 66.24 | 22.72 |
| Nisan 25 | 19.29 | 56.07 |
| Nisan 26 | 7.20 | 9.12 |
| Nisan 27 | 13.99 | 7.42 |
| Nisan 28 | 53.90 | 33.39 |
| Nisan 29 | 23.82 | 22.11 |
| Toplam | 234.79 | 256.62 |
Tedarik Dağıtımı
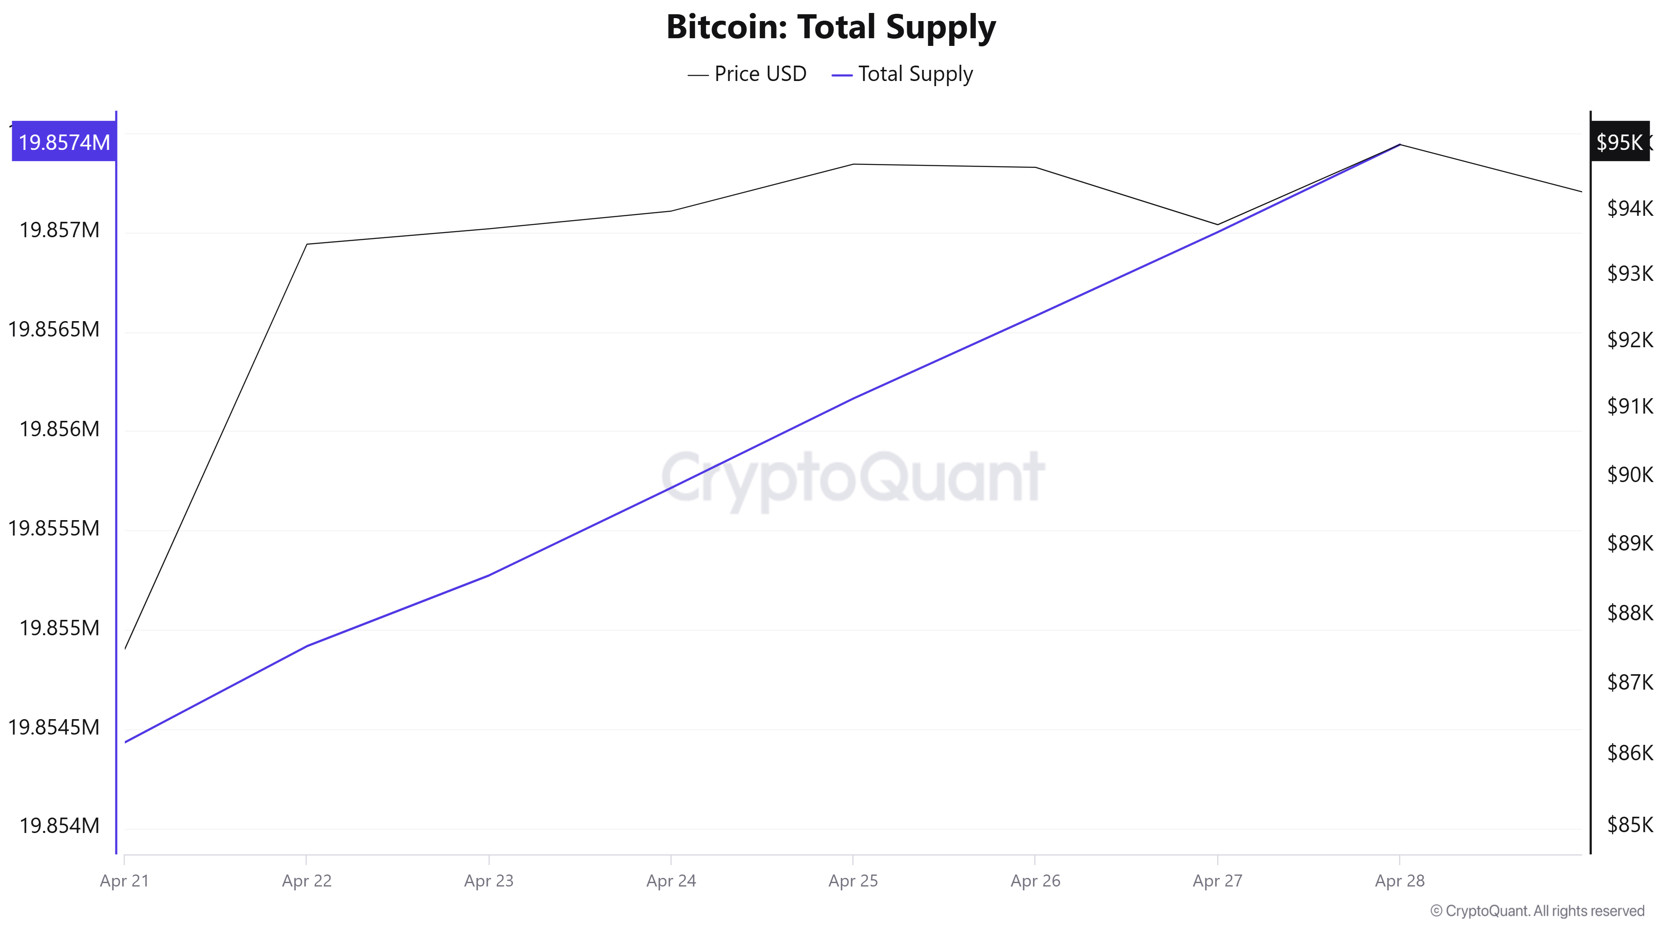
Total Supply: It reached 19,854,433 units, up about 0.01515% from last week.
New Supply: The amount of BTC produced this week was 3,009.
Velocity: Velocity, which was 13.03 last week, was 13.02 as of Nisan 28.
| Cüzdan Kategorisi | 21.04.2025 | 28.04.2025 | Değişim (%) |
|---|---|---|---|
| < 1 BTC | 8.5442% | 8.5392% | -0.0585% |
| 1 – 10 BTC | 11.7060% | 11.6663% | -0.3394% |
| 10 – 100 BTC | 24.7852% | 24.7460% | -0.1585% |
| 100 – 1k BTC | 28.2169% | 28.4193% | 0.7177% |
| 1k – 10k BTC | 18.2797% | 18.2761% | -0.0197% |
| 10k+ BTC | 8.4675% | 8.3528% | -1.3568% |
Looking at the wallet distribution of the current supply, a limited decrease of 0.0585% was observed in the < 1 BTC category, while holders of 1 – 10 BTC experienced a similarly limited decrease of 0.3394%. The 10 – 100 BTC range showed a slight decline of 0.1585%, while the 100 – 1K BTC segment showed a significant increase of 0.7177%. While 1K – 10K BTC holders experienced a flat decrease of 0.0197%, the most notable change occurred in the 10K+ BTC category, with a strong decrease of 1.3568% in this segment.
Döviz Rezervi
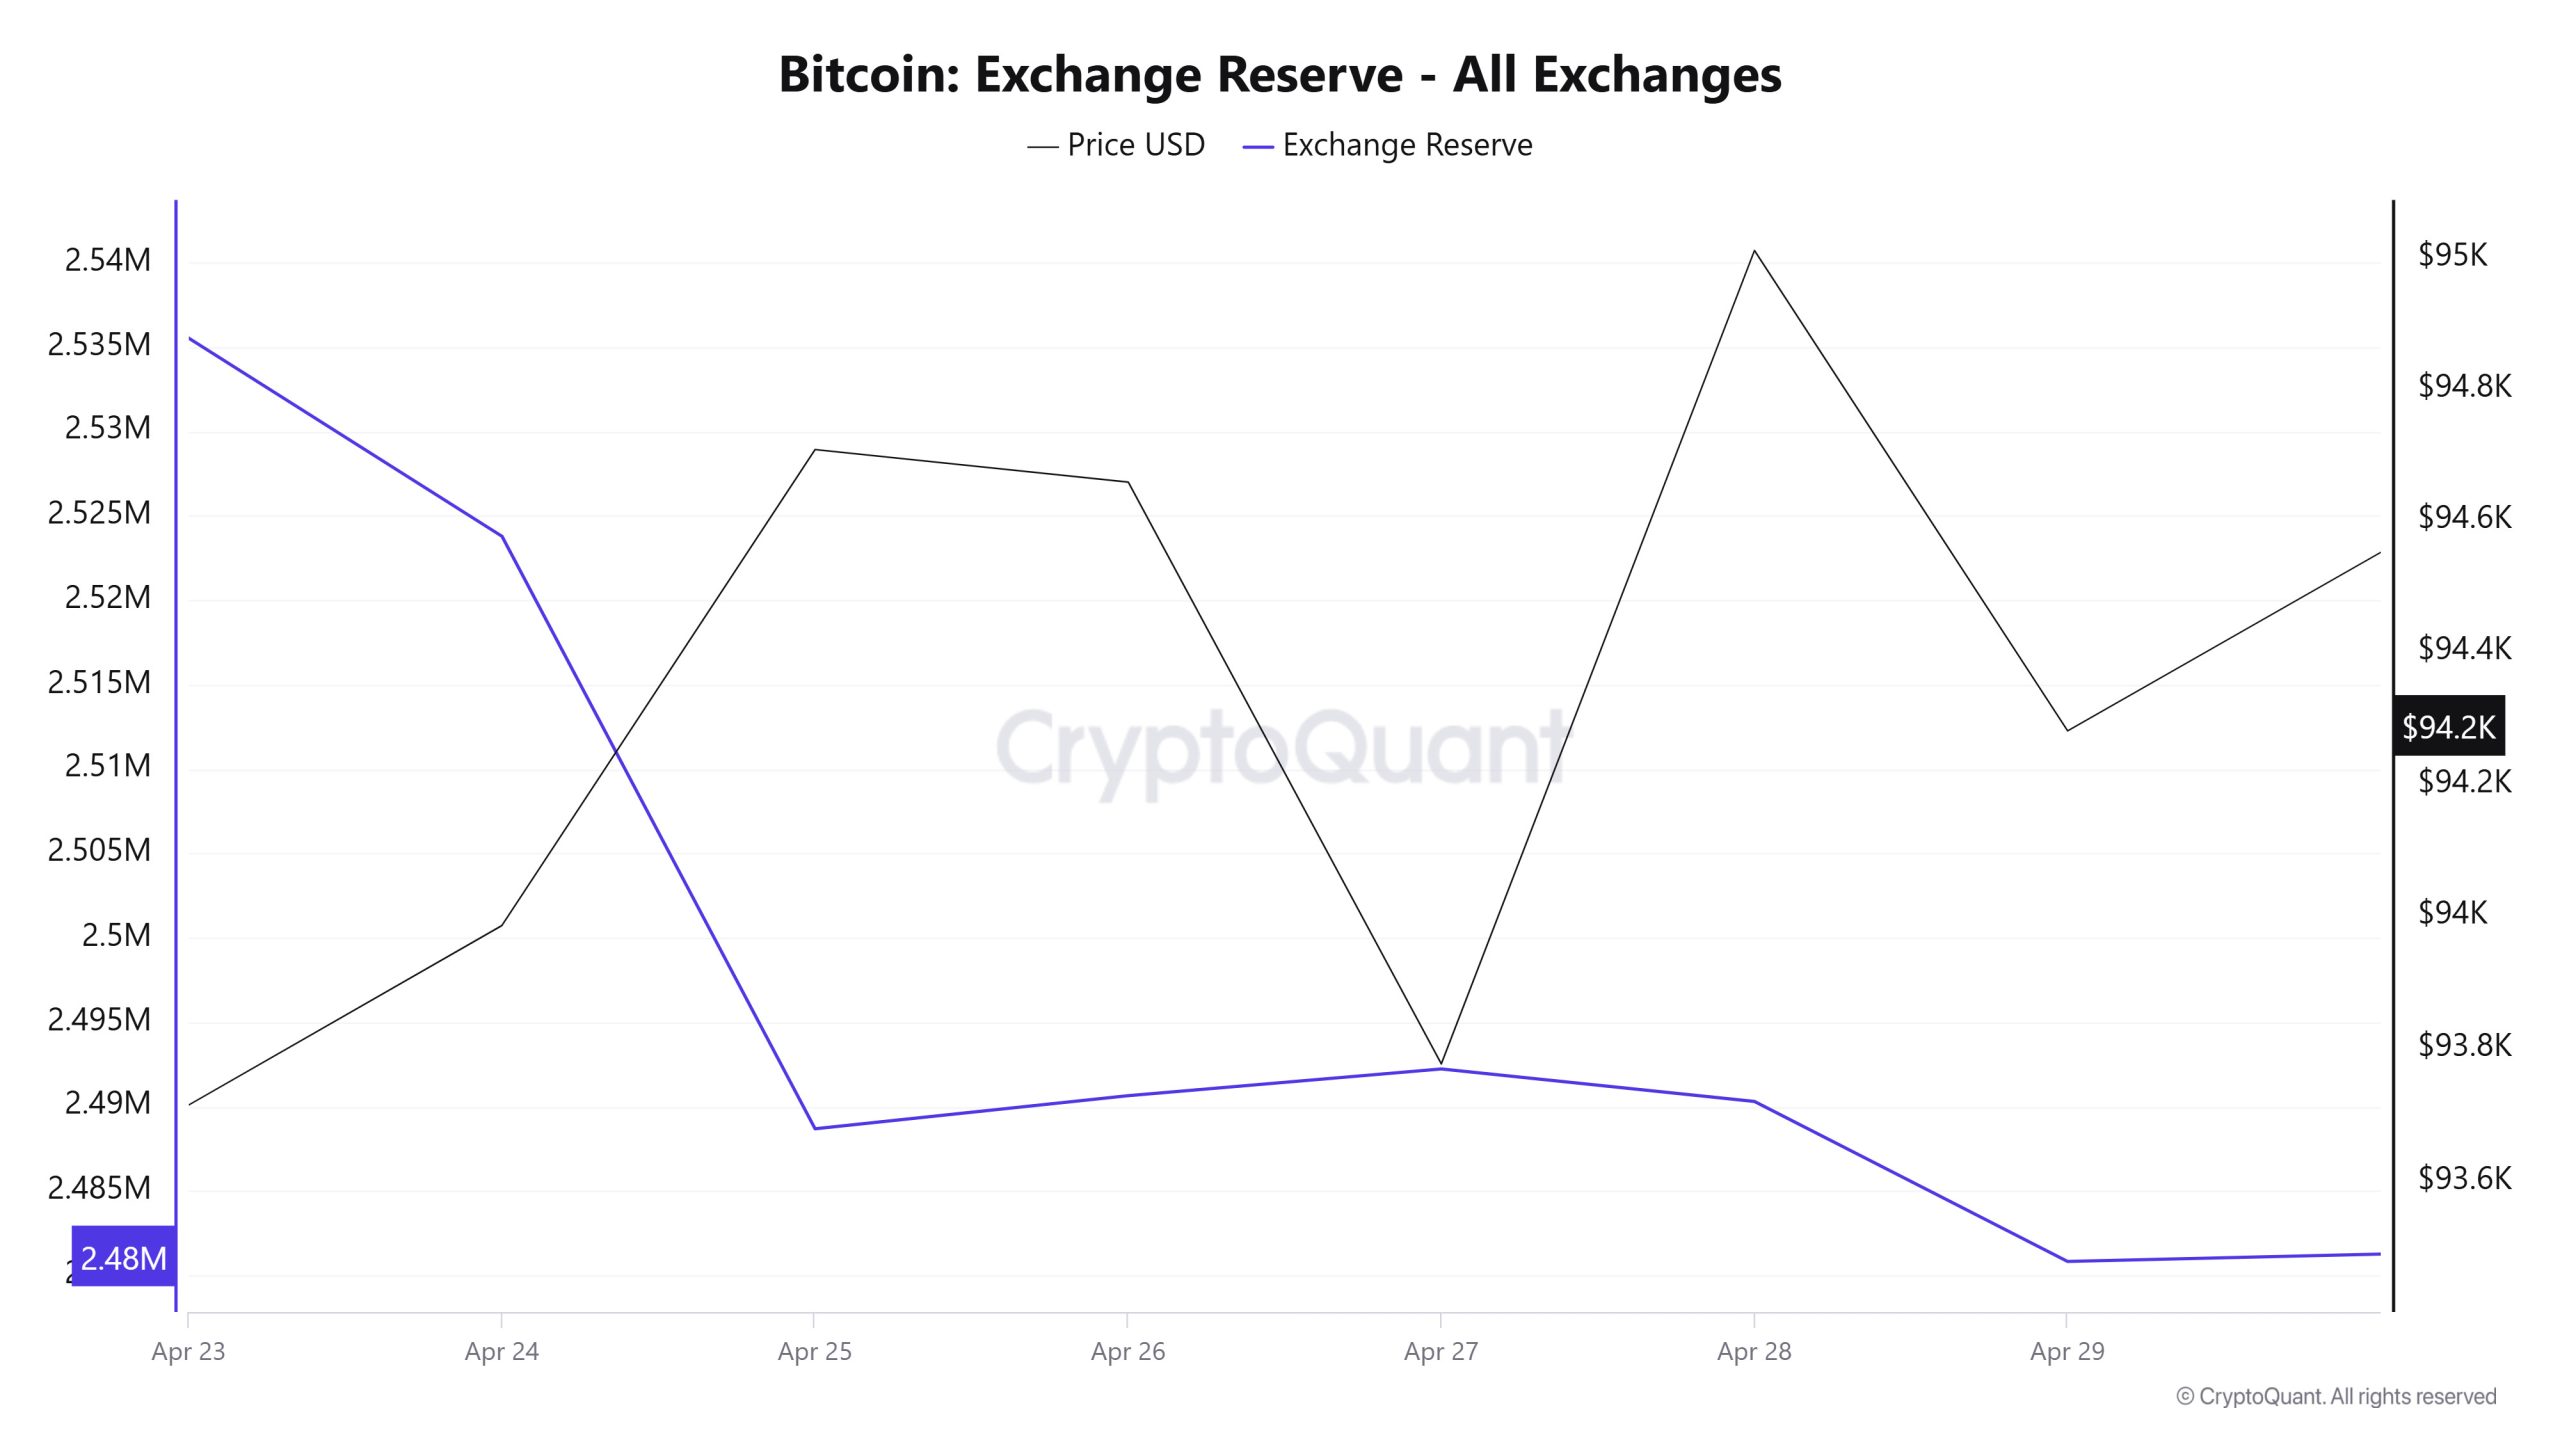
Between Nisan 23-29, 2025, Bitcoin reserves on exchanges decreased from 2,535,533 BTC to 2,480,838 BTC. In total, there was a net outflow of 54,695 BTC during this period, and exchanges’ Bitcoin reserves decreased by 2.16%. The Bitcoin price increased by approximately 0.6% over the same period. Bitcoin, which closed at $93,715 on Nisan 23, 2025, closed at $94,281 on Nisan 29, 2025. The significant decline in reserves on exchanges indicates that investors are increasing their long-term custody tendency and selling pressure is decreasing. These outflows on crypto exchanges may put upward pressure on the Bitcoin price by causing supply to shrink.
| Tarih | 23-Apr | 24-Apr | 25-Apr | 26-Apr | 27-Apr | 28-Apr | 29-Apr |
|---|---|---|---|---|---|---|---|
| Exchange Inflow | 45,087 | 49,627 | 57,142 | 15,611 | 13,106 | 35,160 | 48,186 |
| Exchange Outflow | 50,275 | 61,359 | 92,244 | 13,648 | 11,532 | 37,079 | 57,666 |
| Exchange Netflow | -5,188 | -11,732 | -35,102 | 1,963 | 1,575 | -1,919 | -9,480 |
| Döviz Rezervi | 2,535,533 | 2,523,801 | 2,488,699 | 2,490,662 | 2,492,237 | 2,490,319 | 2,480,838 |
| BTC Price | 93,715 | 93,986 | 94,708 | 94,659 | 93,777 | 95,011 | 94,281 |
Ücretler ve Gelirler
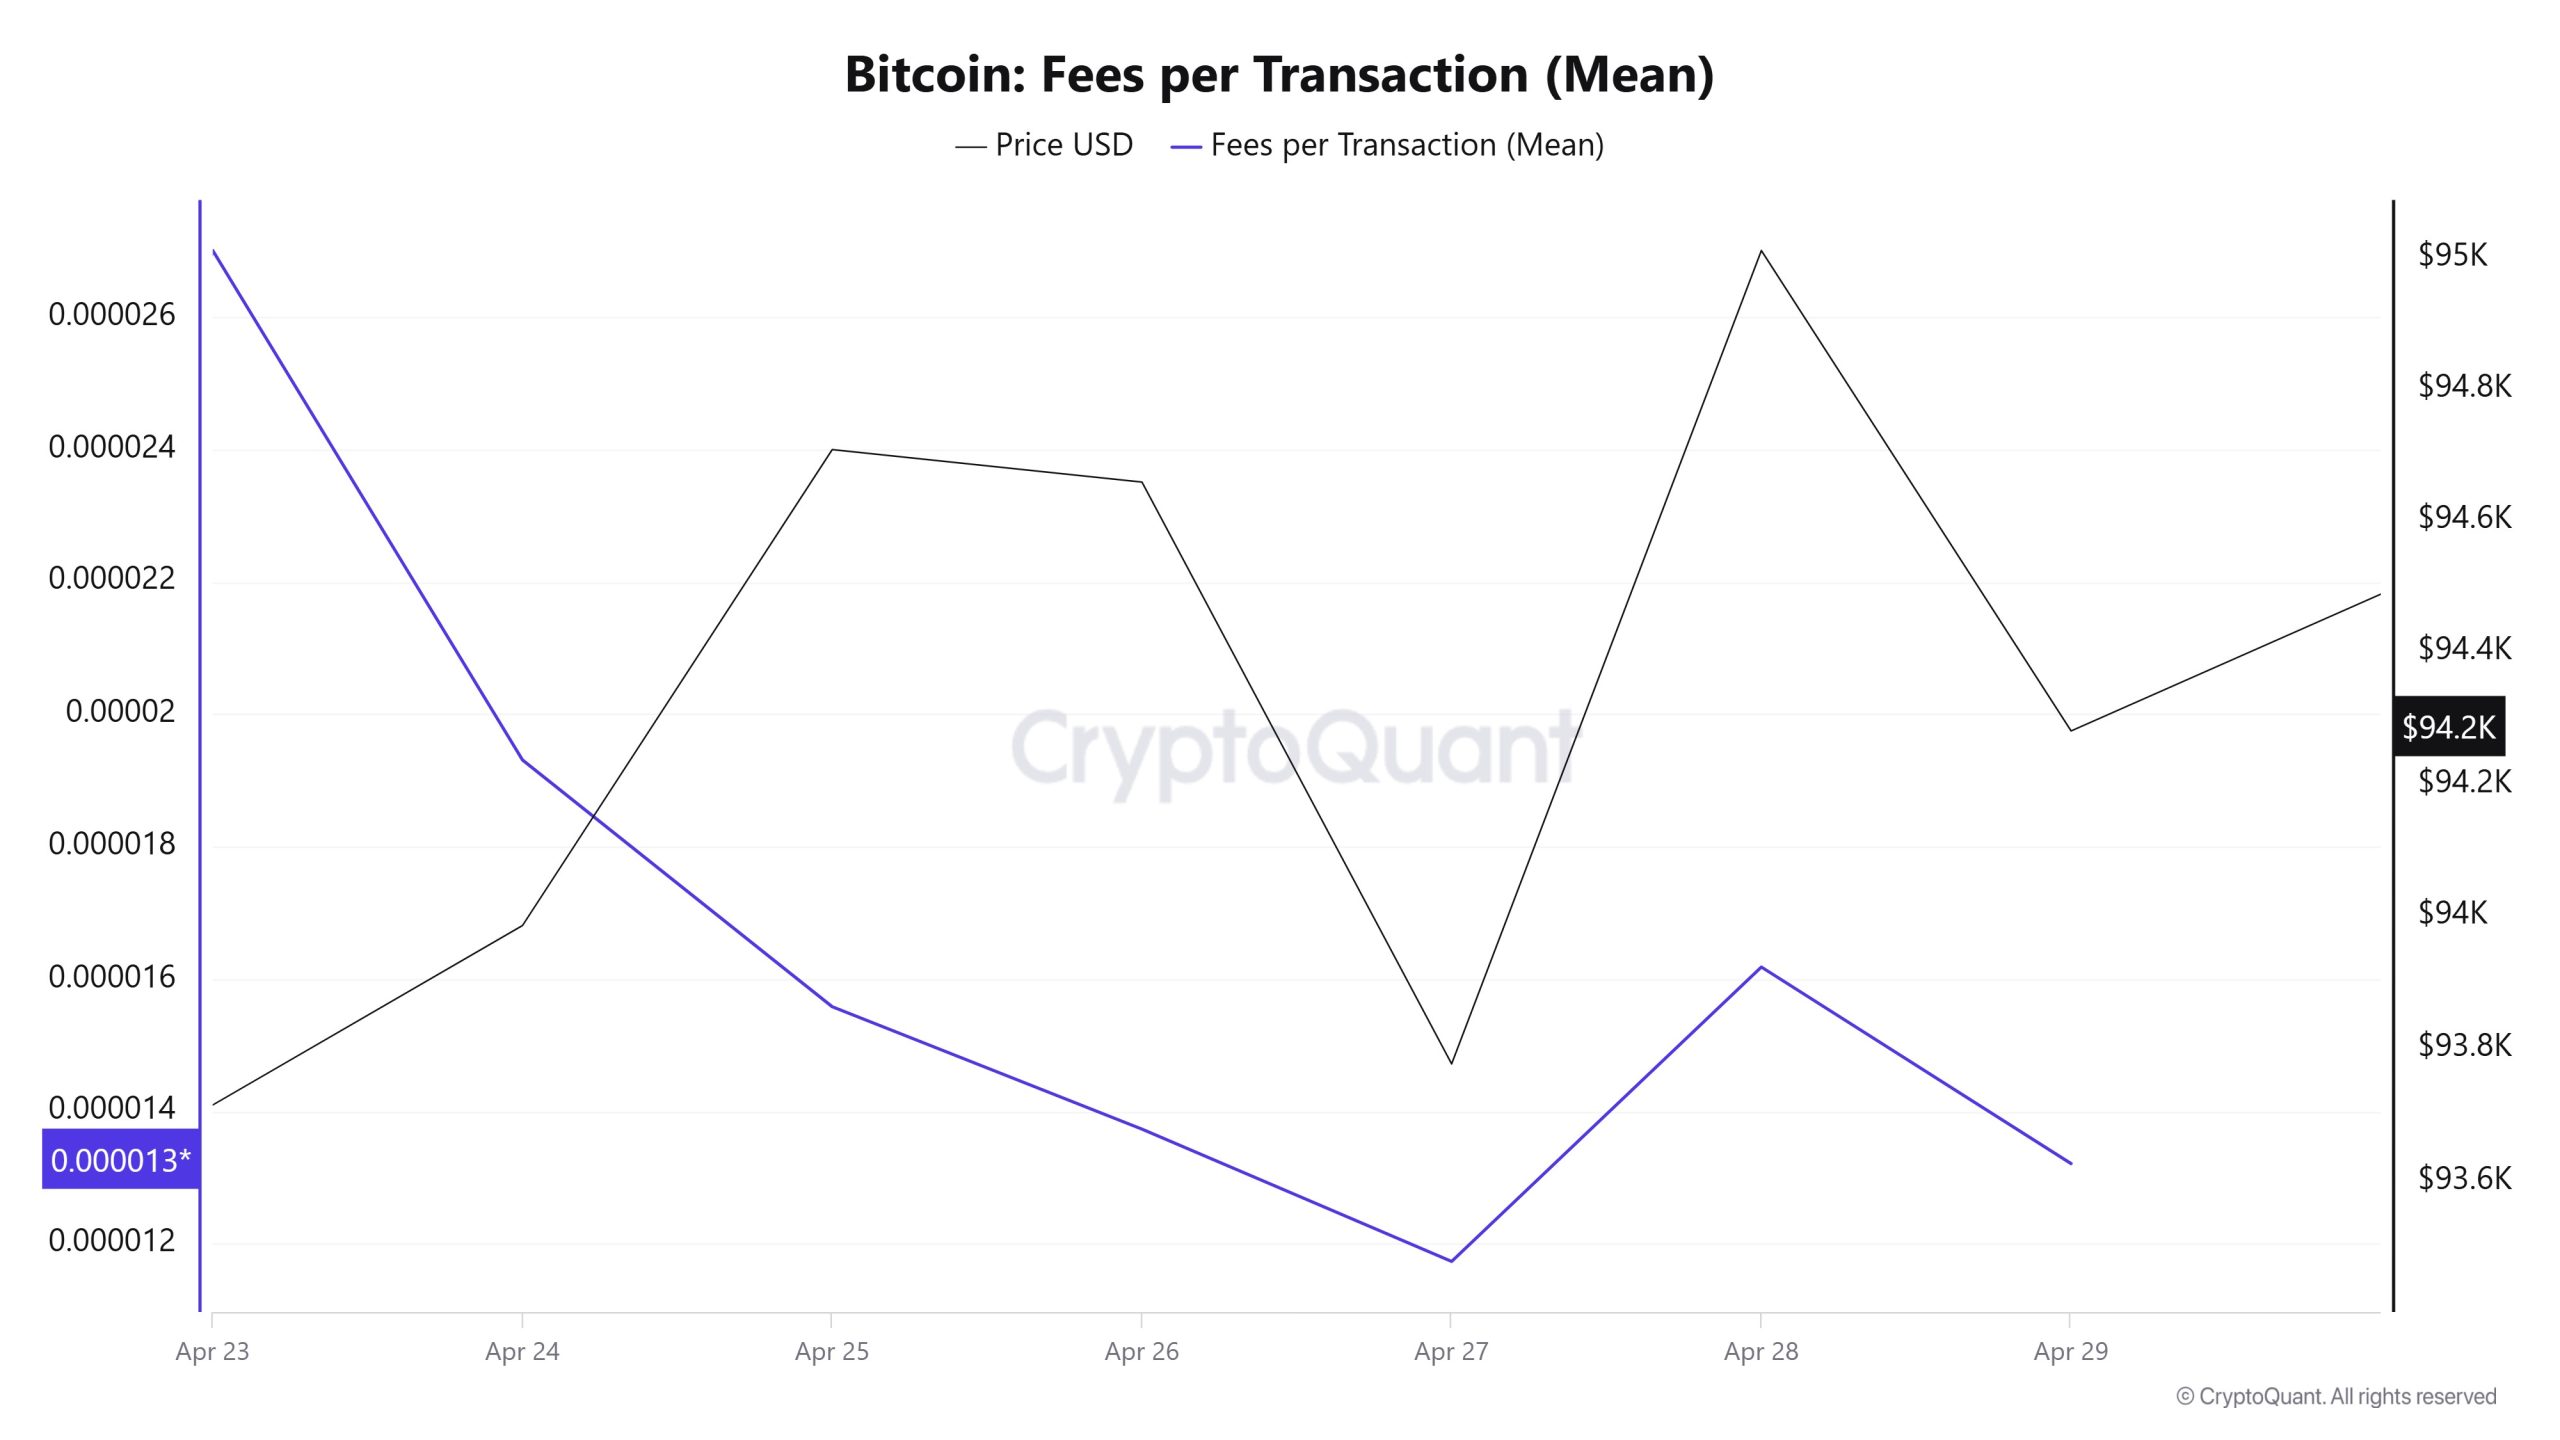
Analyzing the Bitcoin Fees per Transaction (Mean) data between Nisan 23 and 29, it was observed that this value was at 0.00002701 on Nisan 23, the first day of the weekly period. The value, which followed a decreasing trend until Nisan 27 with the effect of the horizontal course seen in the Bitcoin price, decreased to 0.00001173 on this date and recorded its lowest value on a weekly basis.
After Nisan 27, Bitcoin Fees per Transaction (Mean) value, which entered an upward trend with the movements observed in Bitcoin price, closed at 0.00001321 on Nisan 29, the last day of the weekly period, with a slight increase.
Bitcoin: Fees (Total)
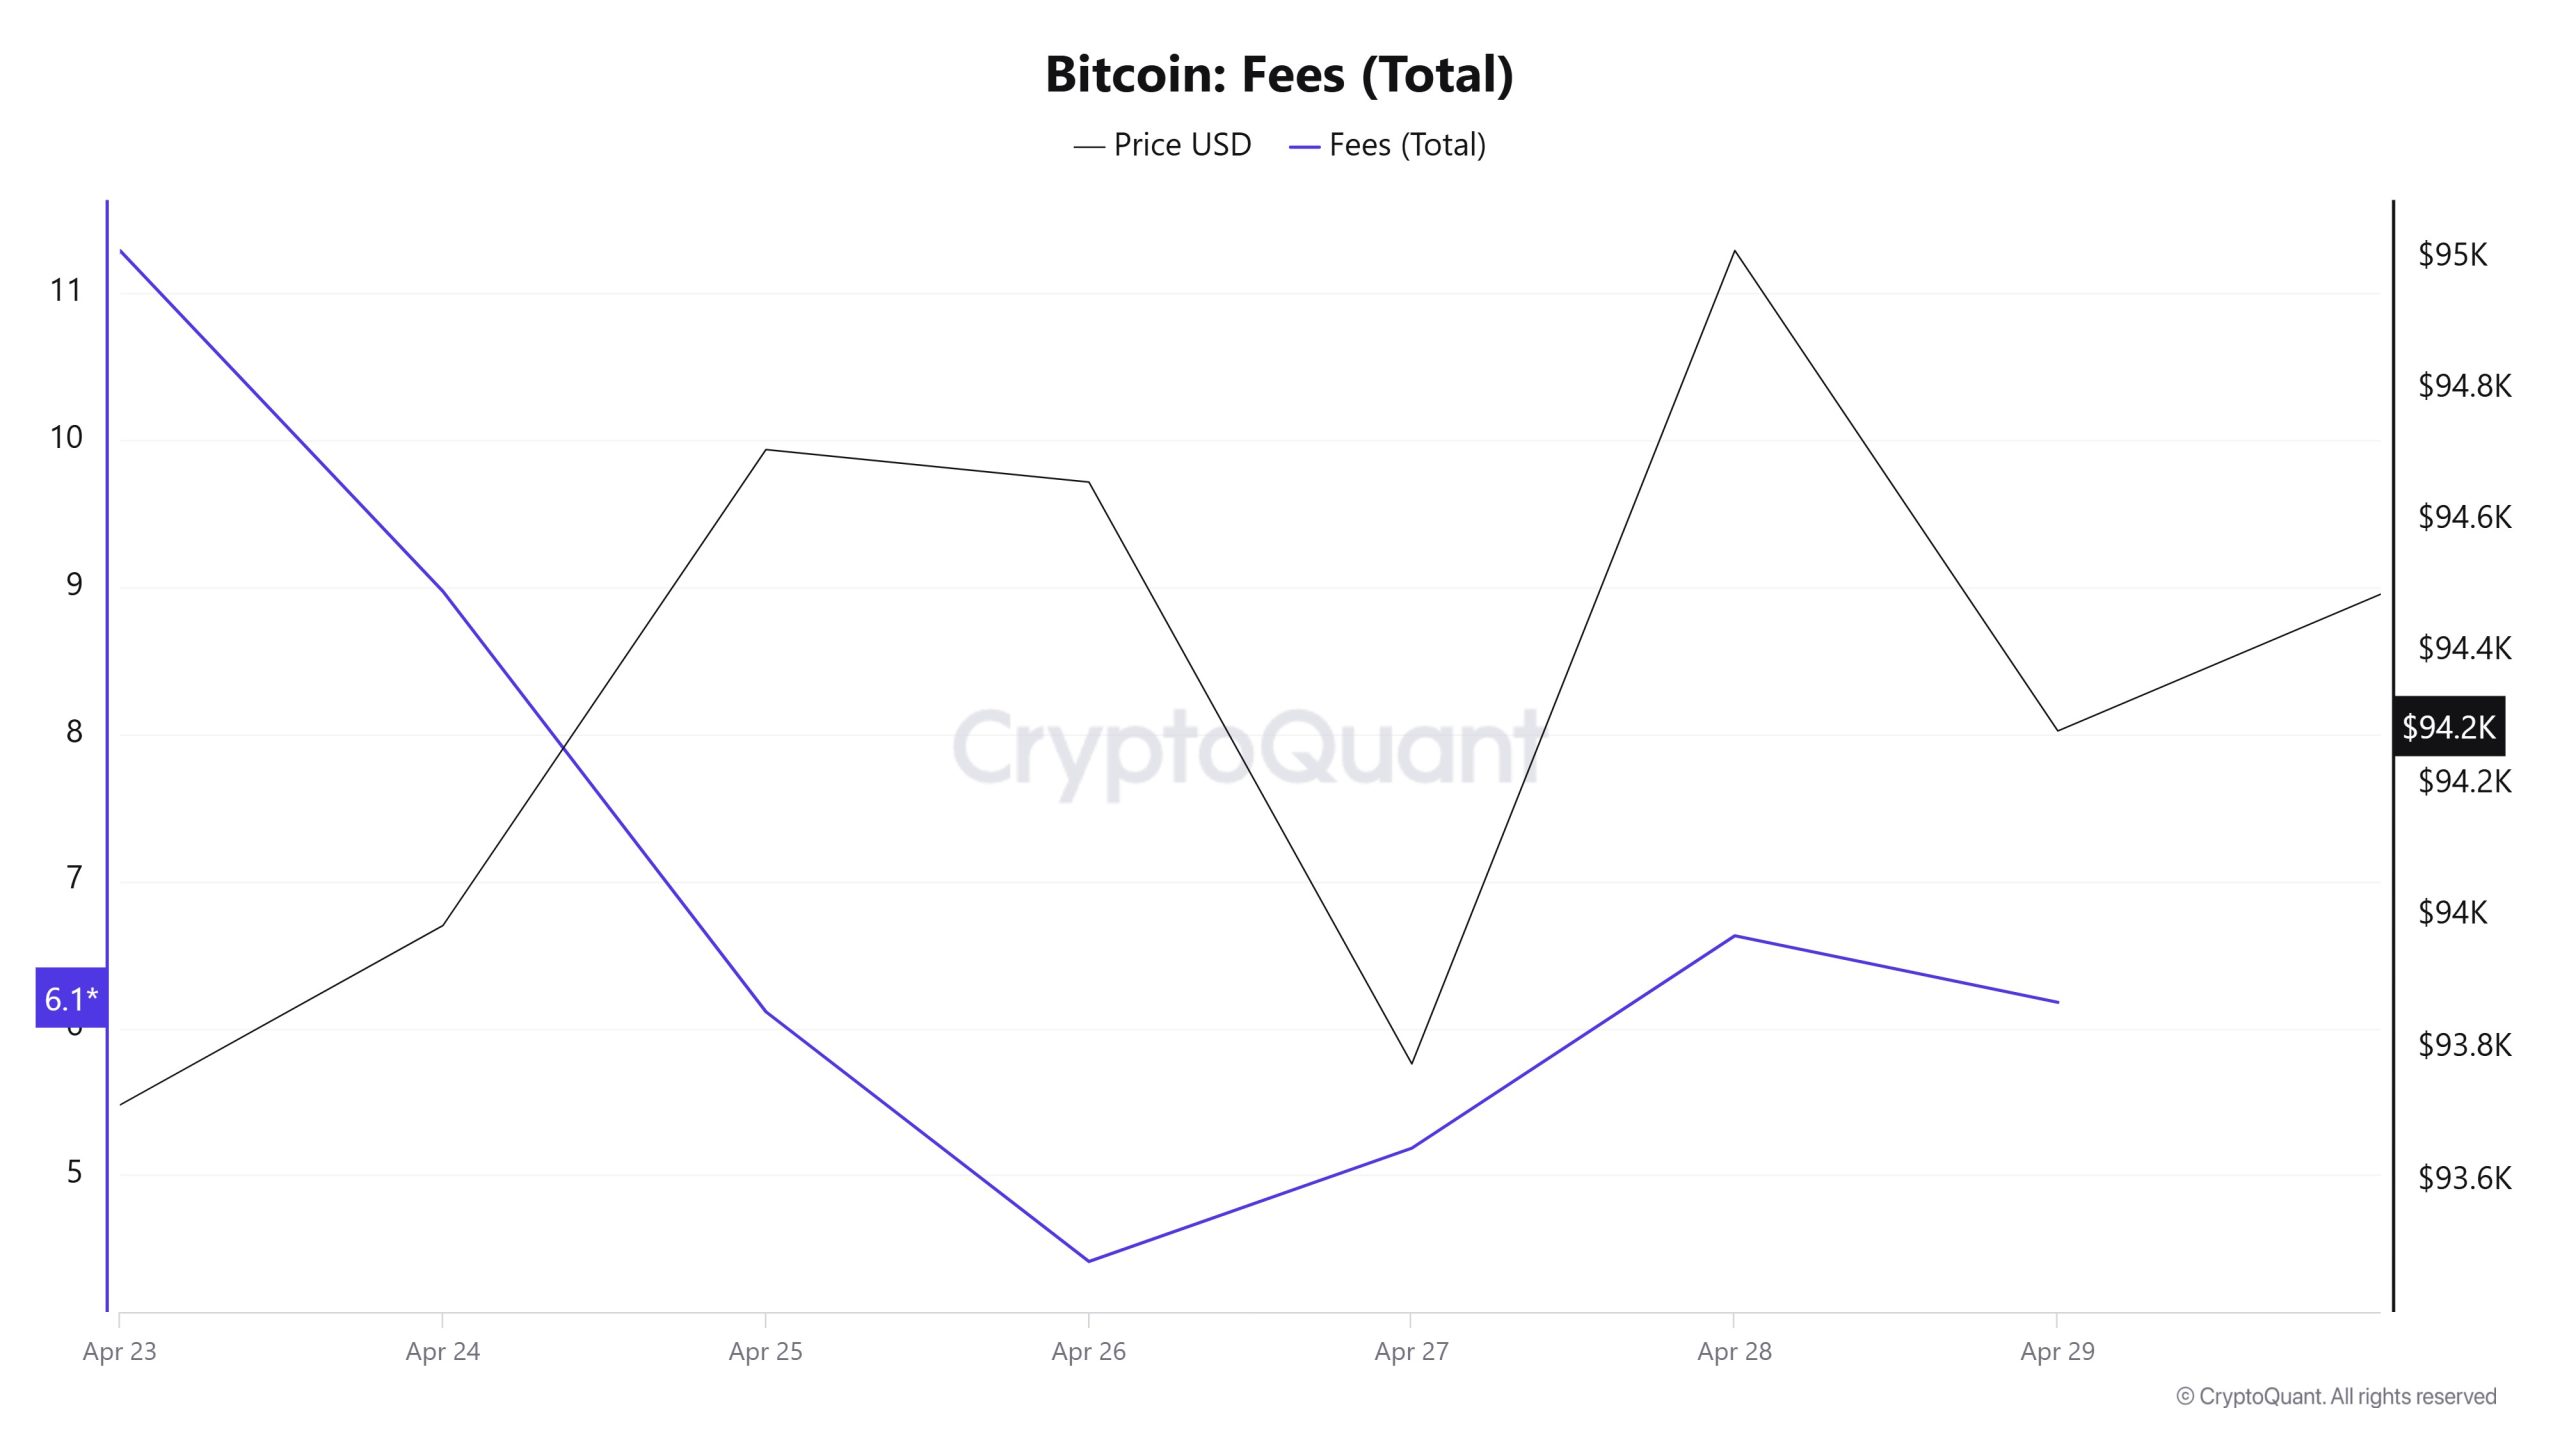
Similarly, when the Bitcoin Fees (Total) data between Nisan 23 and 29 are analyzed, it is seen that this value was at 11.29144978 on Nisan 23, the first day of the weekly period. The value, which followed a decreasing trend until Nisan 26 with the effect of the horizontal course seen in the Bitcoin price, decreased to 4.411245459 on this date and recorded its lowest value on a weekly basis.
After Nisan 26, Bitcoin Fees per Transaction (Mean) value, which entered an upward trend with the movements observed in Bitcoin price after Nisan 26, rose slightly on Nisan 29, the last day of the weekly period, and closed at 6.17471382.
Miner Flows
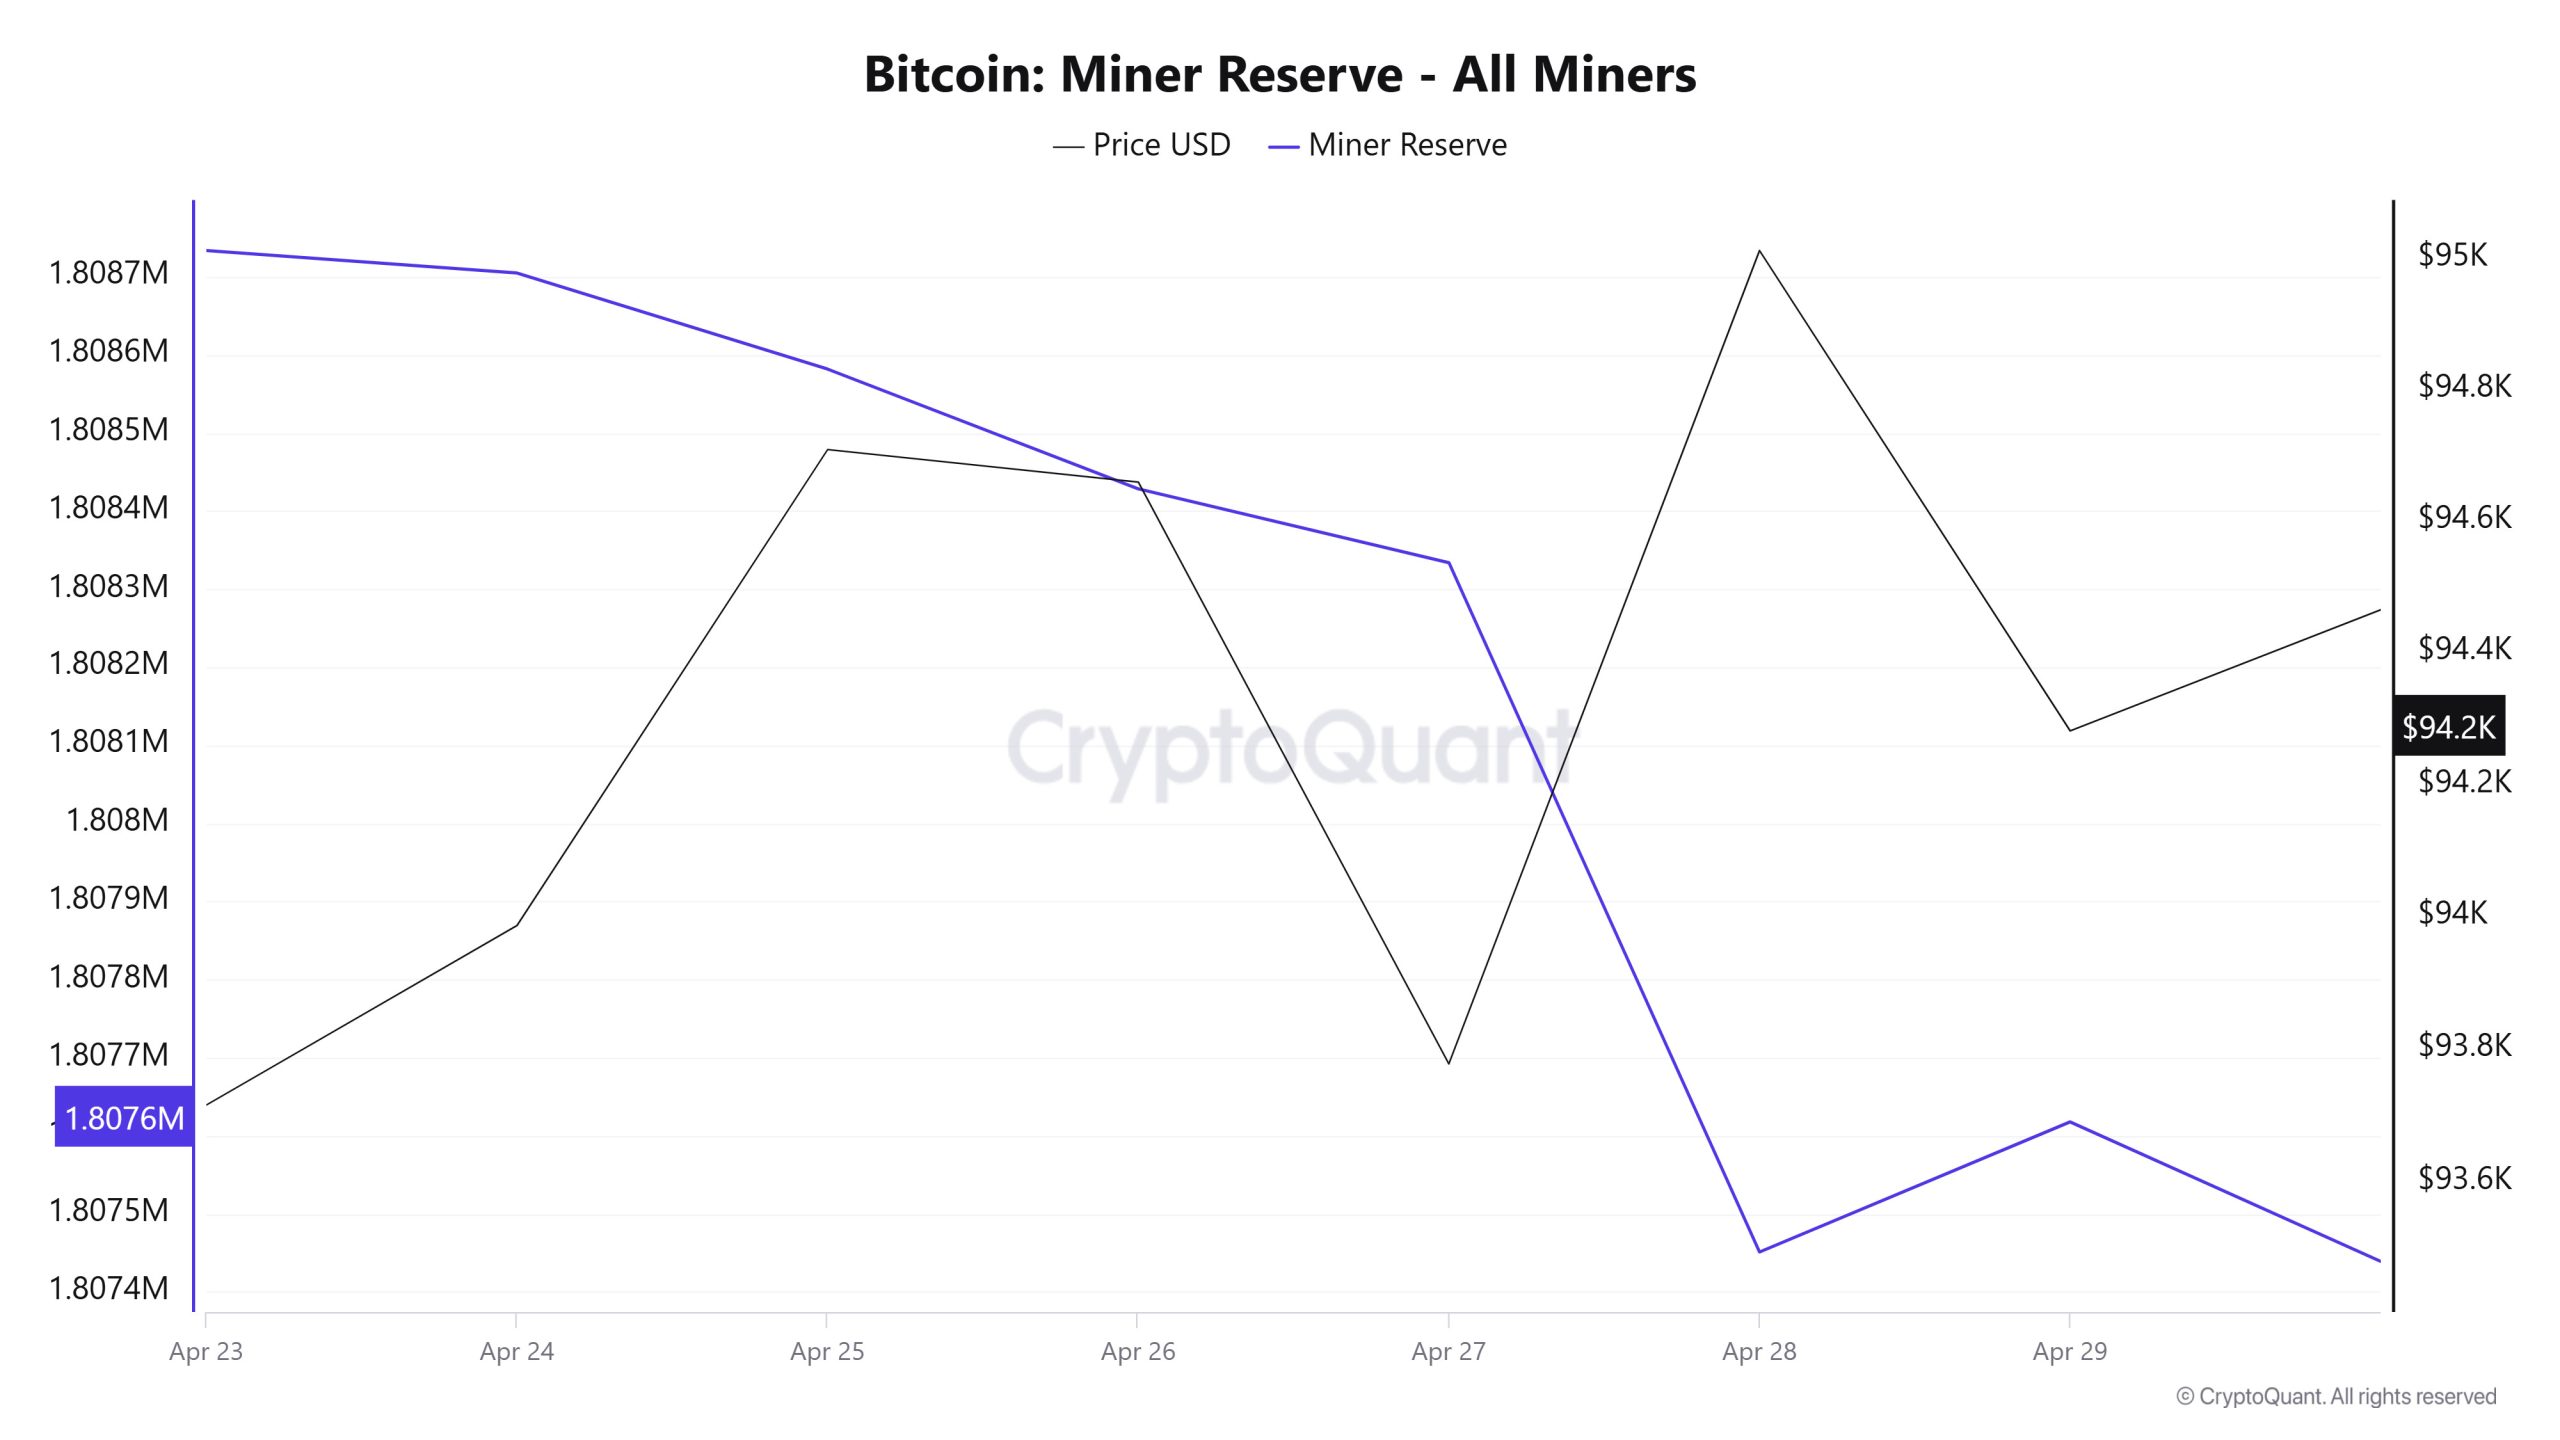
As seen in the Miner Reserve table, the number of Bitcoins in miners’ wallets decreased this week. There is a negative correlation between Miner Reserve and Bitcoin price throughout the week.
Miner Inflow, Outflow and Netflow
Between Nisan 23 and Nisan 29, 43,892 Bitcoins were outflowed from miners’ wallets and 42,823 Bitcoins were inflowed into miners’ wallets between the same dates. The Miner Netflow for this week was -1069 Bitcoin. Meanwhile, the Bitcoin price was $93,715 on Nisan 23 and $94,280 on Nisan 29.
For the week, the net flow (Miner Netflow) was negative as Bitcoin inflow into miner wallets (Miner Inflow) was less than Bitcoin outflow from miner wallets (Miner Outflow).
| Nisan 23 | Nisan 24 | Nisan 25 | Nisan 26 | Nisan 27 | Nisan 28 | Nisan 29 | |
|---|---|---|---|---|---|---|---|
| Miner Inflow | 6524.13 | 6981.57 | 8270.10 | 4839.23 | 4341.41 | 6207.11 | 5659.63 |
| Miner Outflow | 6478.15 | 7010.31 | 8393.14 | 4992.57 | 4436.02 | 7089.54 | 5493.06 |
| Miner Netflow | 45.98 | -28.74 | -123.04 | -153.34 | -94.61 | -882.44 | 166.57 |
İşlem
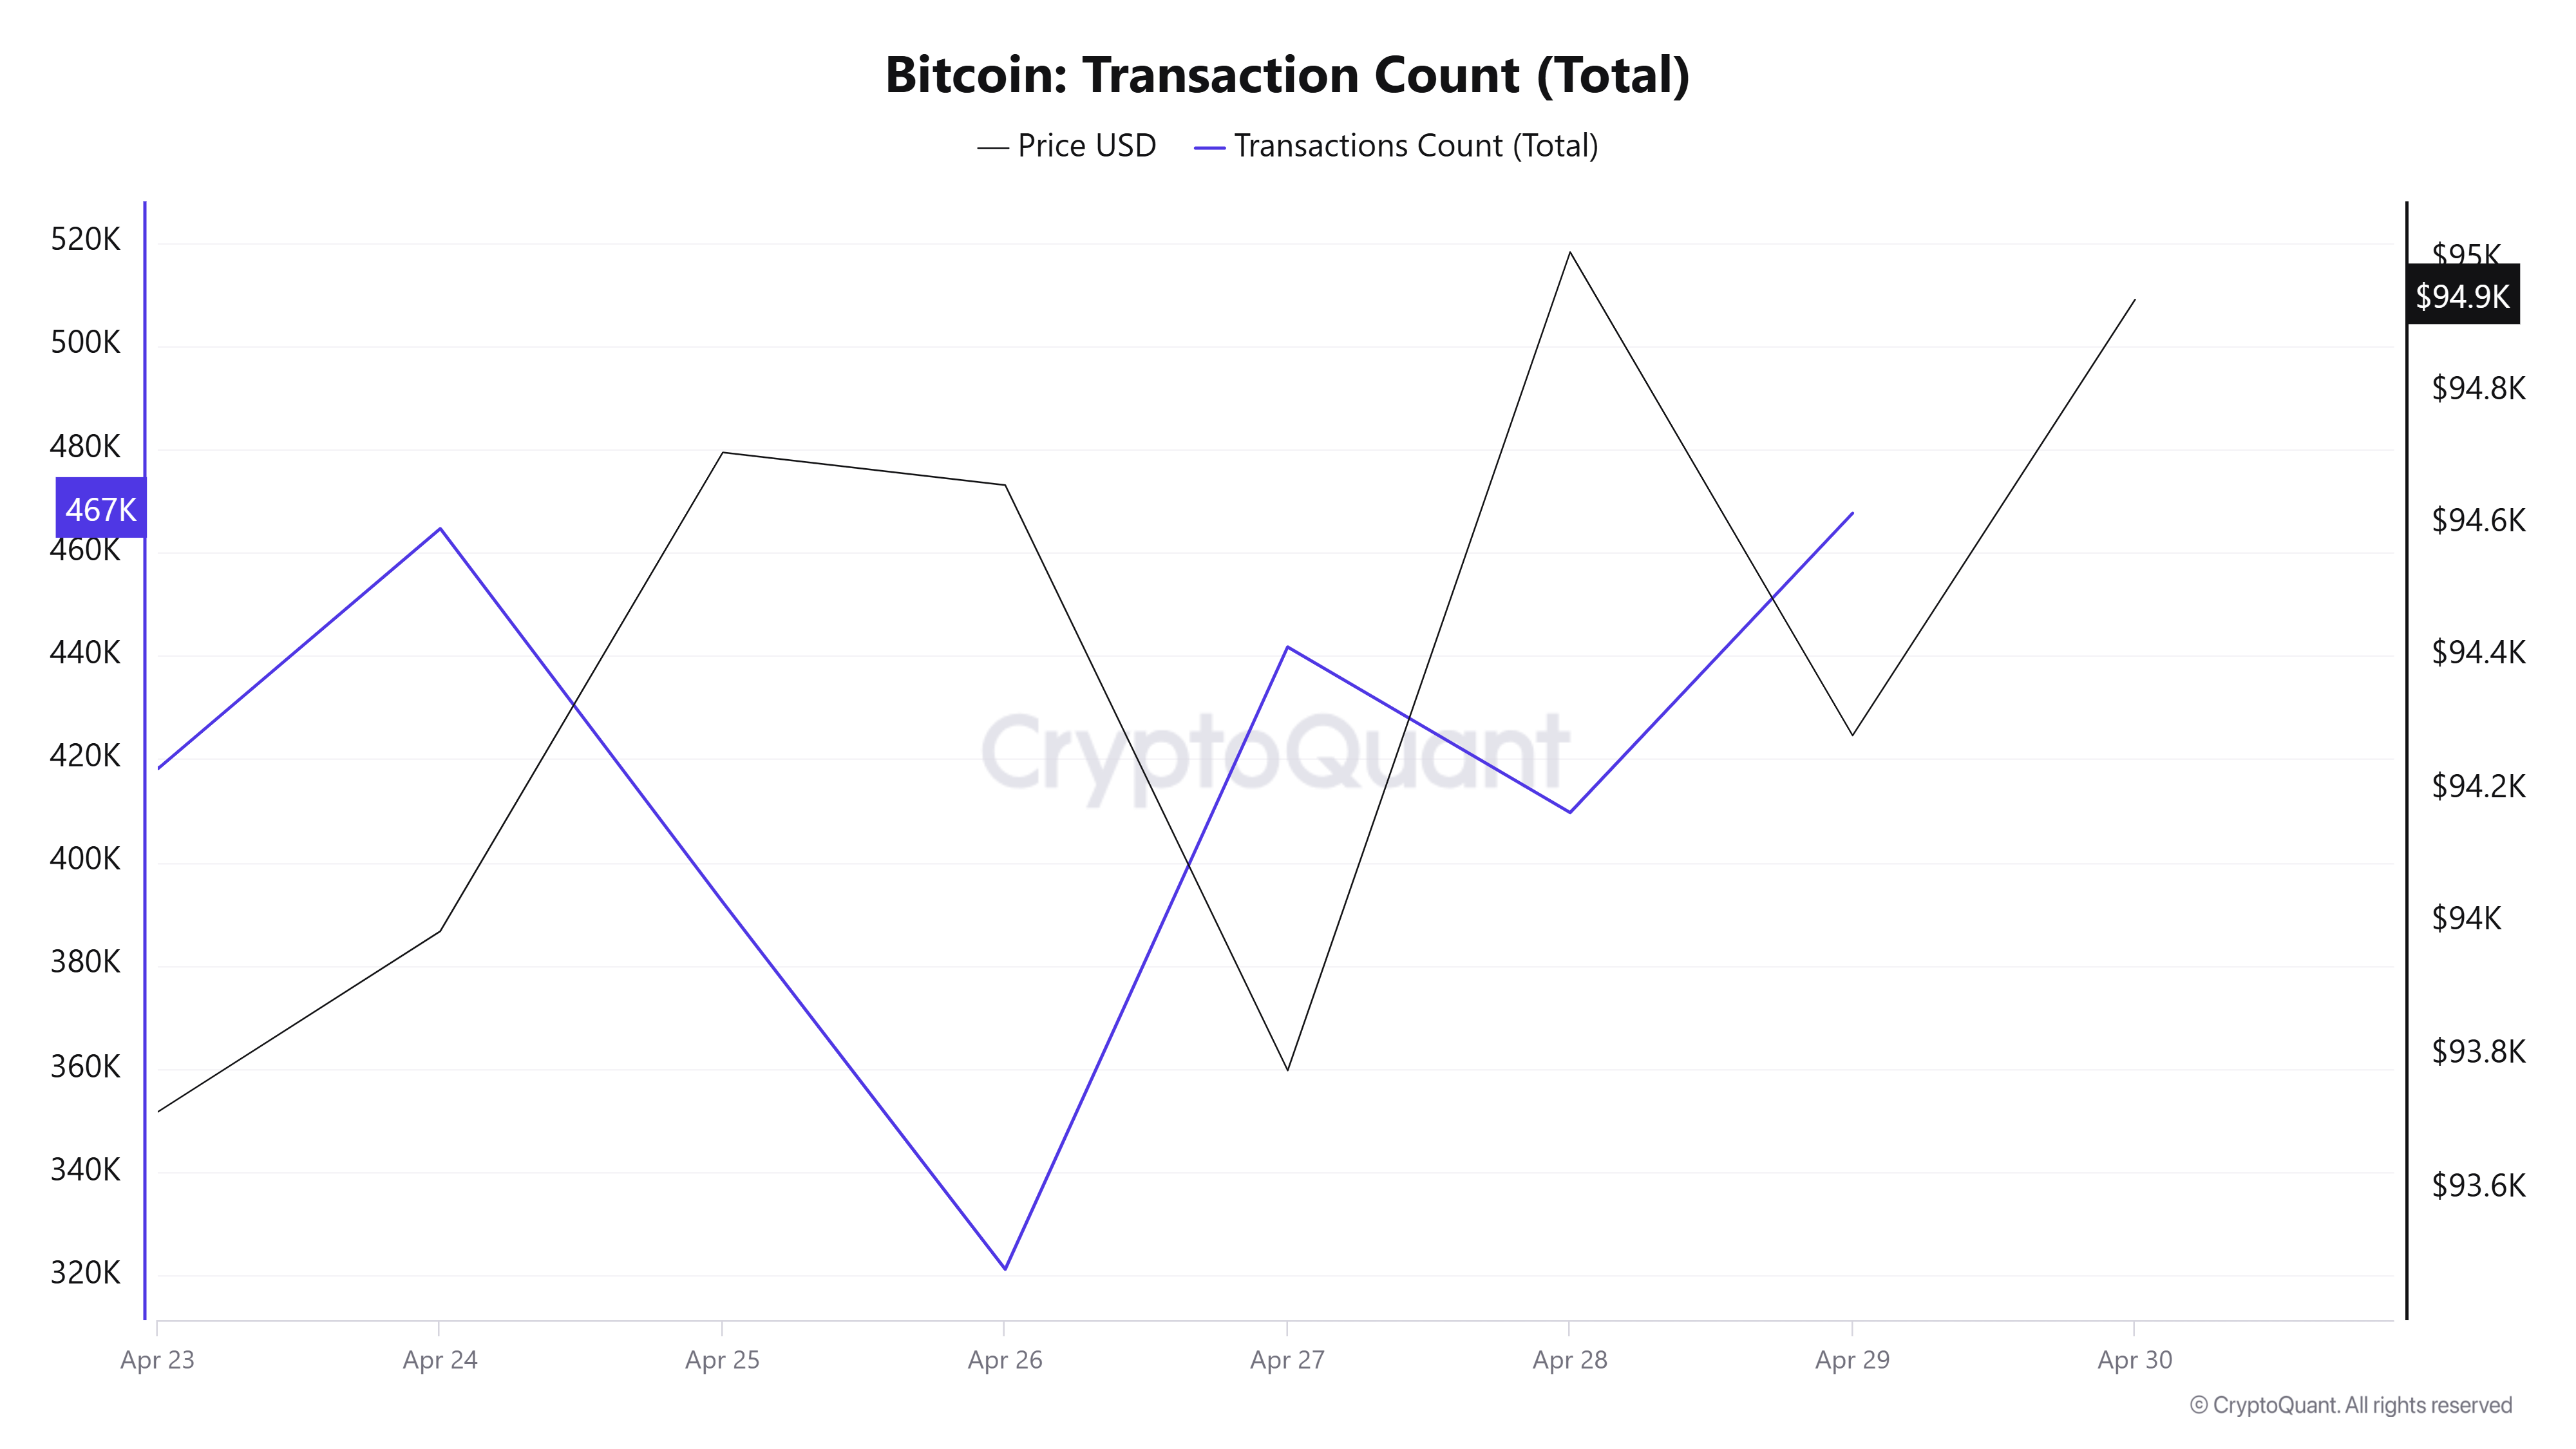
Last week, there were 3,549,489 transactions on the Bitcoin network, compared to 3,036,125 this week, a decrease of about 14.47%. The 464,598 transactions recorded on Nisan 24th was the highest transaction volume of the week, while the lowest number of transactions was 321,224 on Nisan 26th.
The correlations between price and number of trades are dominated by negative correlations. The decrease in the number of trades this week compared to the previous week creates a weaker network outlook.
Tokens Transferred
While 3,878,668 BTC was transferred last week, it increased by 20.78% to 4,684,921 BTC this week. On Nisan 23, 960,830 BTC was transferred, the highest token transfer volume of the week, while the lowest token transfer volume of 373,898 BTC was recorded on Nisan 26. There is a gradual decrease in the amount of BTC transferred on the network between Nisan 23-26. Between 27-29, there is a steady increase in the amount of tokens transferred. In the “amount of BTC transferred – Price” relationship, positive and negative correlations were observed with equal weight throughout this week.
Whale Activities
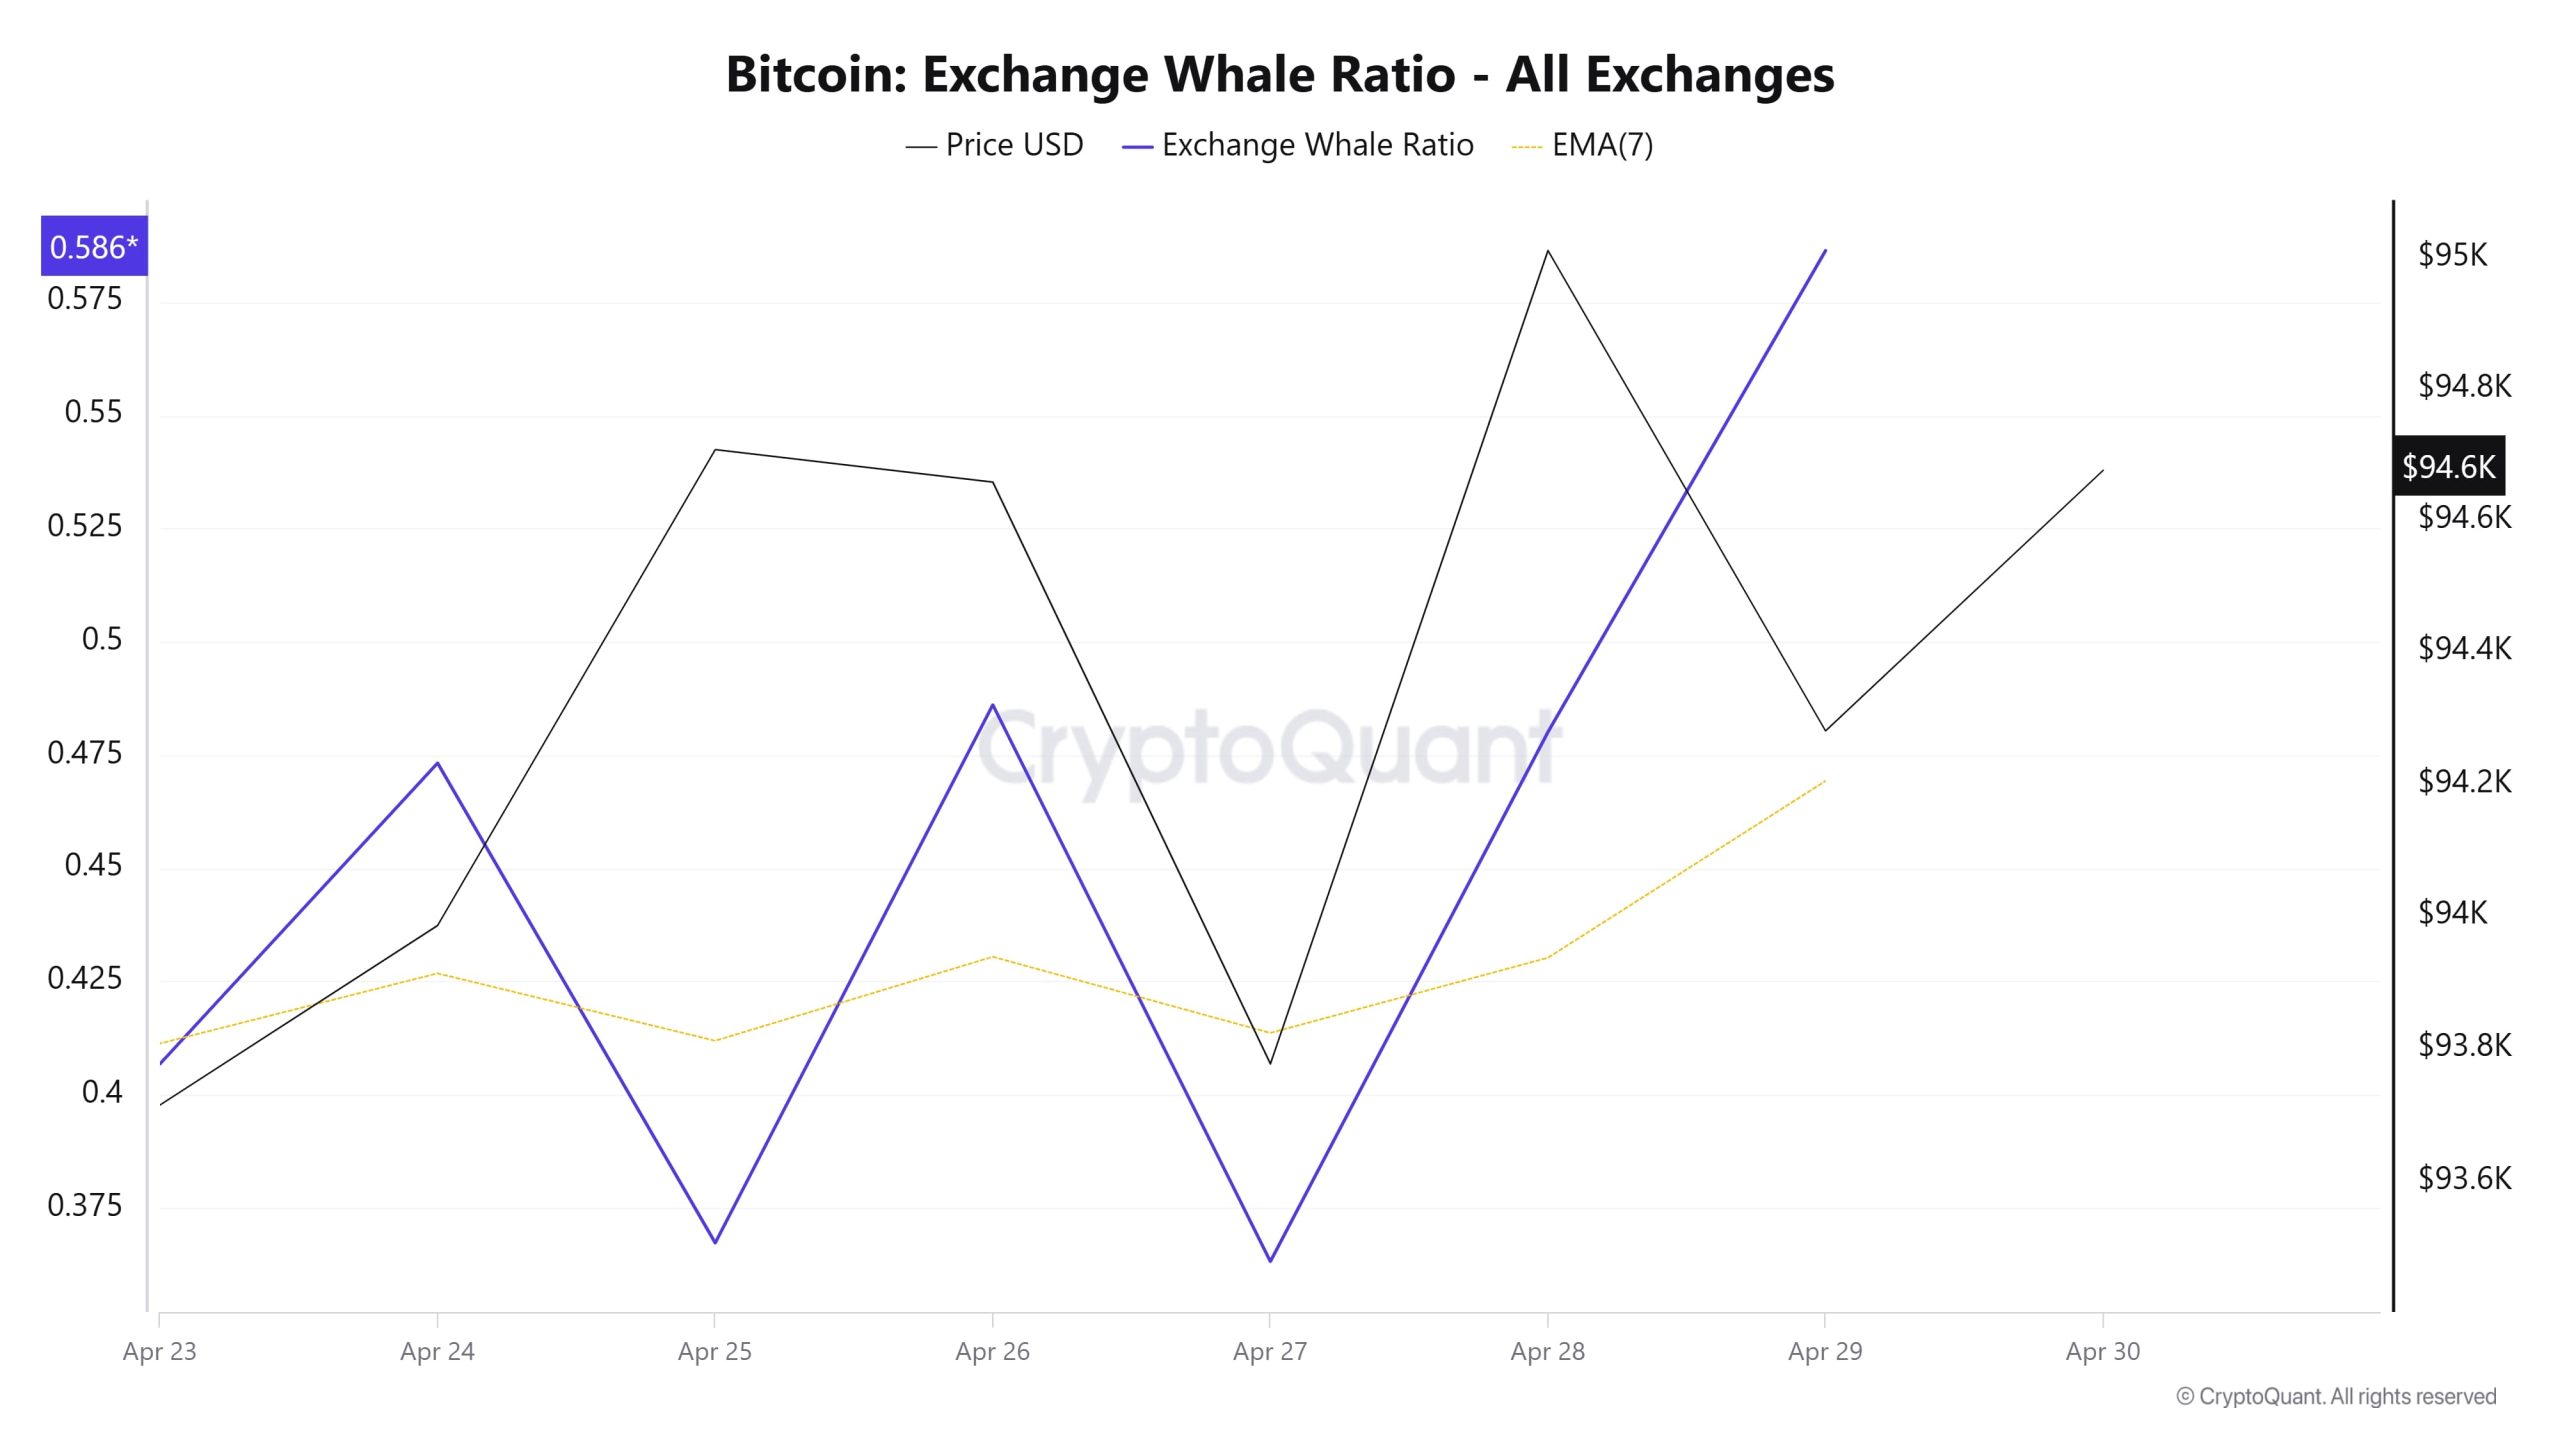
Whales Data
Over the last 7 days, data from the cryptocurrency market showed that whale activity on centralized exchanges used centralized exchanges at a normal level at the beginning of the process. Towards the middle of the process, these activities remained flat. When we look at the Exchange Whale Ratio metric, the rate of whales using central exchanges at the beginning of the 7-day period was measured as 0.406. When this ratio is above 0.35, it usually means that whales use central exchanges frequently. This measurement decreased in the middle of the process and fell to 0.363 on Nisan 27, the lowest point of the process. As of now, the ratio of 0.586 is the highest point of the process. BTC moved sideways between $92,000 and $94,000 during this period. This shows us that the whales are using the central exchanges in a balanced way in buying and selling movements. At the same time, total BTC transfers increased by about 21% compared to last week, with 4,684,961 BTC moving. The data showed that the supply of Bitcoin exchanges dropped to a seven-year low on Nisan 29th to 2.488 million BTC last Cuma. As a result, small investors appear to have played a bigger role in last week’s uptrend. While this suggests that there was a decline in whale activity throughout the process, a renewed surge in whale activity towards the end of the process, although negative, suggests that the market is still in the decision phase
BTC Onchain Overall
| Metric | Rise 📈 | Decline 📉 | Neutral ➖ |
|---|---|---|---|
| Active Addresses | ✓ | ||
| Breakdowns | ✓ | ||
| Türevler | ✓ | ||
| Tedarik Dağıtımı | ✓ | ||
| Döviz Rezervi | ✓ | ||
| Ücretler ve Gelirler | ✓ | ||
| Miner Flows | ✓ | ||
| İşlem | ✓ | ||
| Whale Activities | ✓ |
*The metrics and guidance in the table do not, by themselves, describe or imply an expectation of future price changes for any asset. The prices of digital assets may vary depending on many different variables. The onchain analysis and related guidance are intended to assist investors in their decision-making process, and making financial investments based solely on the results of this analysis may result in harmful transactions. Even if all metrics produce a bullish, bearish or neutral result at the same time, the expected results may not be seen depending on market conditions. Investors who review the report should take these warnings into account.
Yasal Uyarı
Bu dokümanda yer alan yatırım bilgi, yorum ve tavsiyeleri yatırım danışmanlığı hizmeti niteliği taşımamaktadır. Yatırım danışmanlığı hizmeti, yetkili kuruluşlar tarafından kişilerin risk ve getiri tercihleri dikkate alınarak kişiye özel olarak verilir. Bu dokümanda yer alan yorum ve tavsiyeler genel niteliktedir. Bu tavsiyeler mali durumunuz ile risk ve getiri tercihlerinize uygun olmayabilir. Bu nedenle, sadece bu dokümanda yer alan bilgilere dayanarak yatırım kararı vermeniz beklentilerinize uygun sonuçlar doğurmayabilir.
NOT: Bitcoin onchain analizinde kullanılan tüm veriler Cryptoqaunt'a dayanmaktadır.
