
Active Addresses
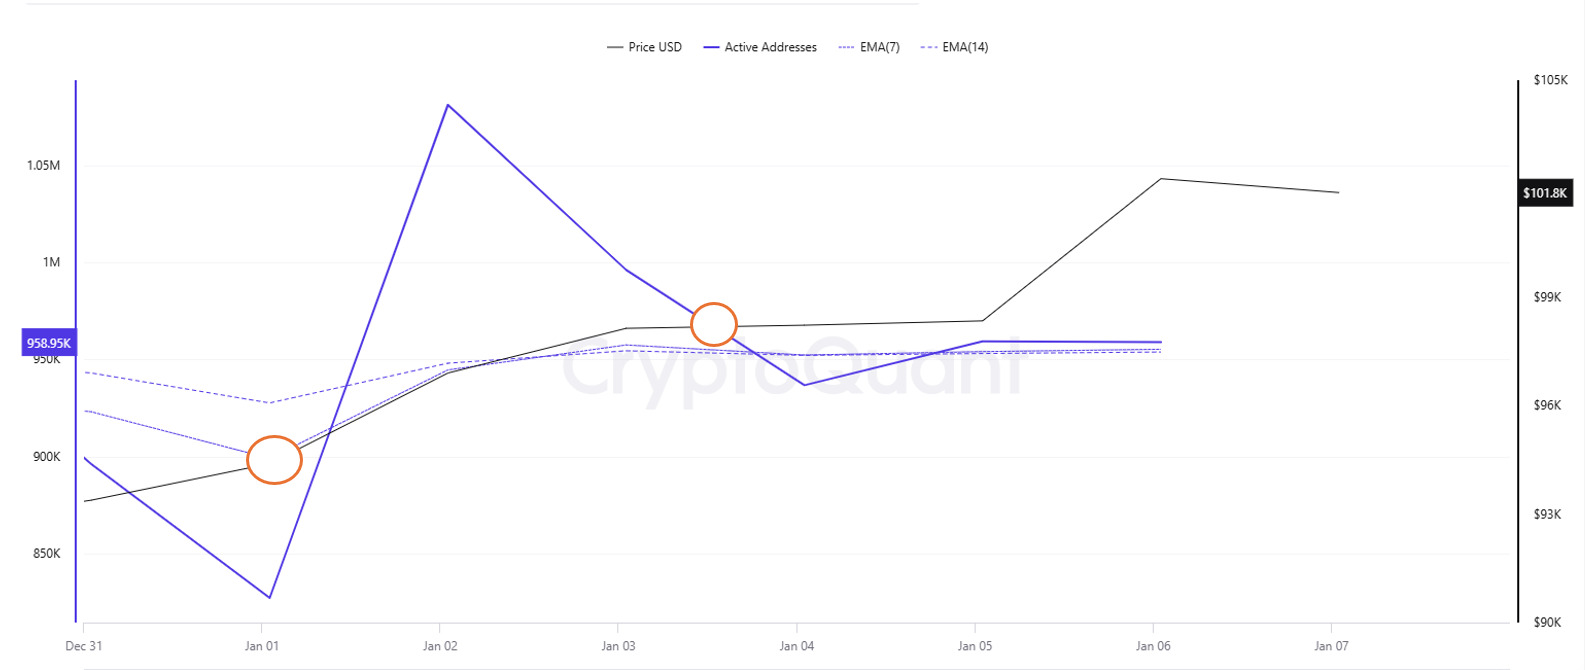
In the number of active addresses, there were 958,957 $ entries to exchanges between Ocak 01 and Ocak 08, 2025 this week. During this period, Bitcoin rose from $97,000 to $102,000. The highest number of active addresses since the last week of Aralık, we see that Bitcoin purchases accelerated in the region where the price and the number of active addresses intersect in the region marked on the chart of addresses ready to trade. The active addresses, which rose to 1,082,401 on Ocak 2, may indicate that the market is strengthening and investors are more interested. When we follow the 7-day simple moving average, it is observed that the price follows an upward trend on the dates when this average cuts the price. Bitcoin reached 938,502,571 in correlation with the active address EMA (7). This situation indicates that the Bitcoin price is experiencing entries at $ 98,000 levels.
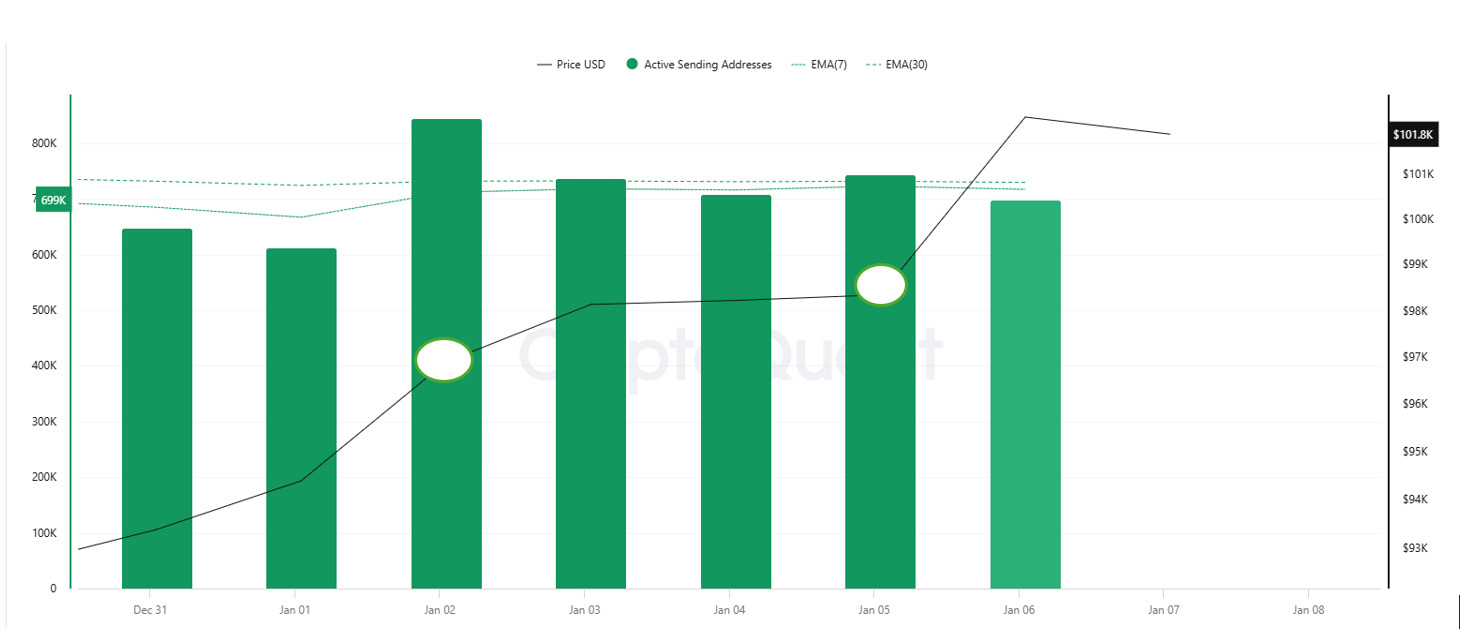
On the exits, there was a significant increase in active shipping addresses towards Ocak 5, along with the Black Line (price line). On the day of the price peak, active shipping addresses rose as high as 743,834 , indicating that buyers sold their positions as Bitcoin stayed around the $98,000 level for a while.
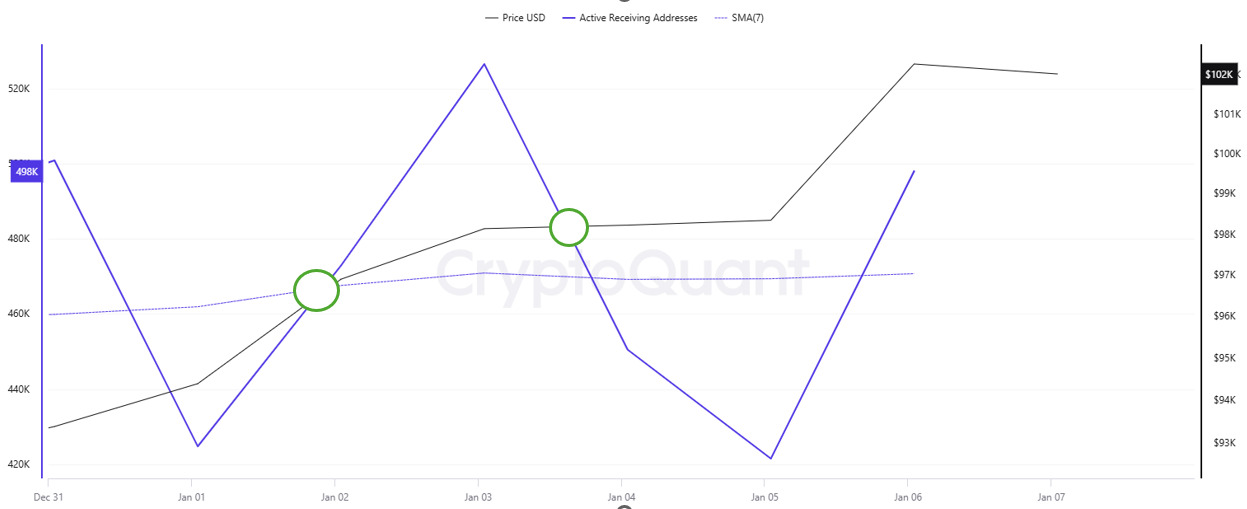
Active Receiving Addresses, on the other hand, show that on Ocak 1, the price approached the lowest level of the number of buyers (424,703) and investors went to increase their bitcoin positions. Bitcoin shows $94,304 as the longest buying level for traders. However, on the chart, the SMA (7-Day) at 467,605,714 appears to change the trend direction at the point where it intersects with the price. This may indicate the costing levels of buyers before the price rises.
Breakdowns
MRVR
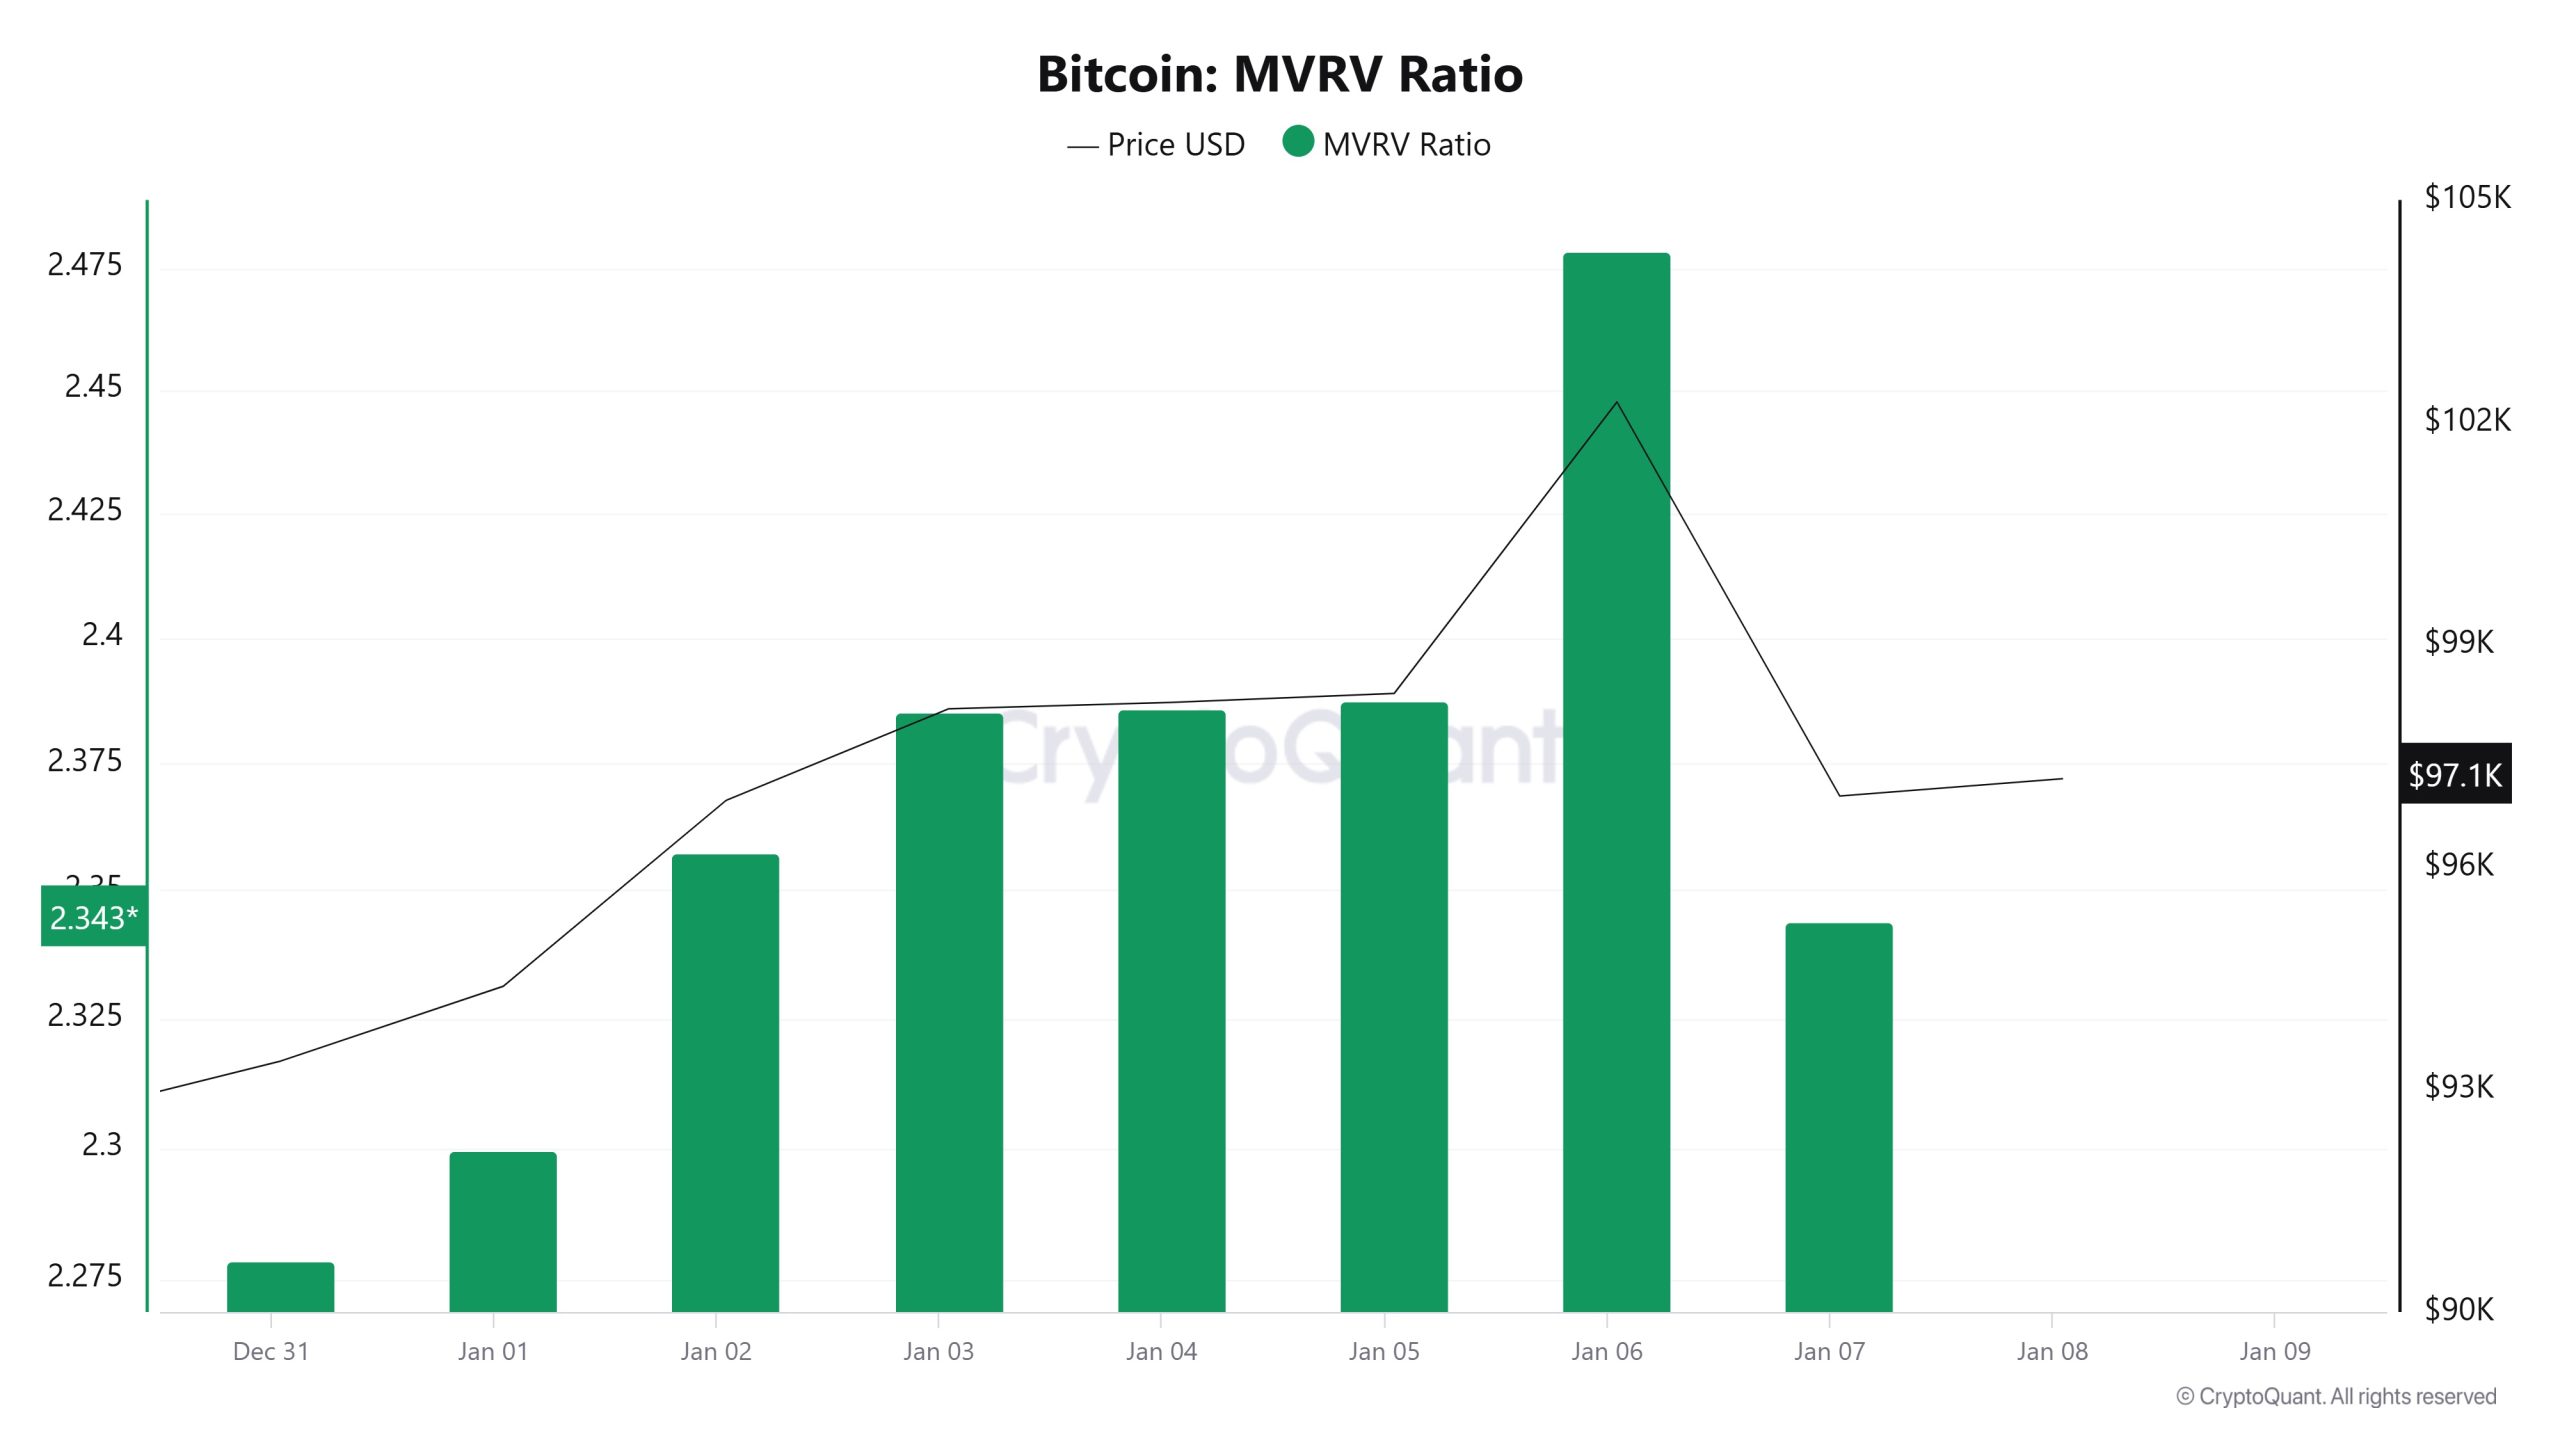
As of Ocak 1, the Bitcoin price was 94,394 and the MVRV Ratio was 2.29. On Ocak 7, the Bitcoin price increased to 96,961 and the MVRV Ratio increased to 2.34. This represents a 2.72% increase in Bitcoin price and a 2.18% increase in MVRV Ratio compared to Ocak 1. This rise in price and MVRV Ratio may indicate that market participants have taken a more positive approach during this period and confidence in short-term valuations has increased. The rise in the MVRV Ratio to 2.34 may indicate that Bitcoin’s market capitalization has reached a slightly higher level compared to historical averages and investors are inclined to buy during this period. This could be considered a sign of a recovery in the market in the short term. However, the fact that the MVRV is not at extremely high levels may suggest that investors continue to act cautiously, and the market remains balanced.
Realized Price
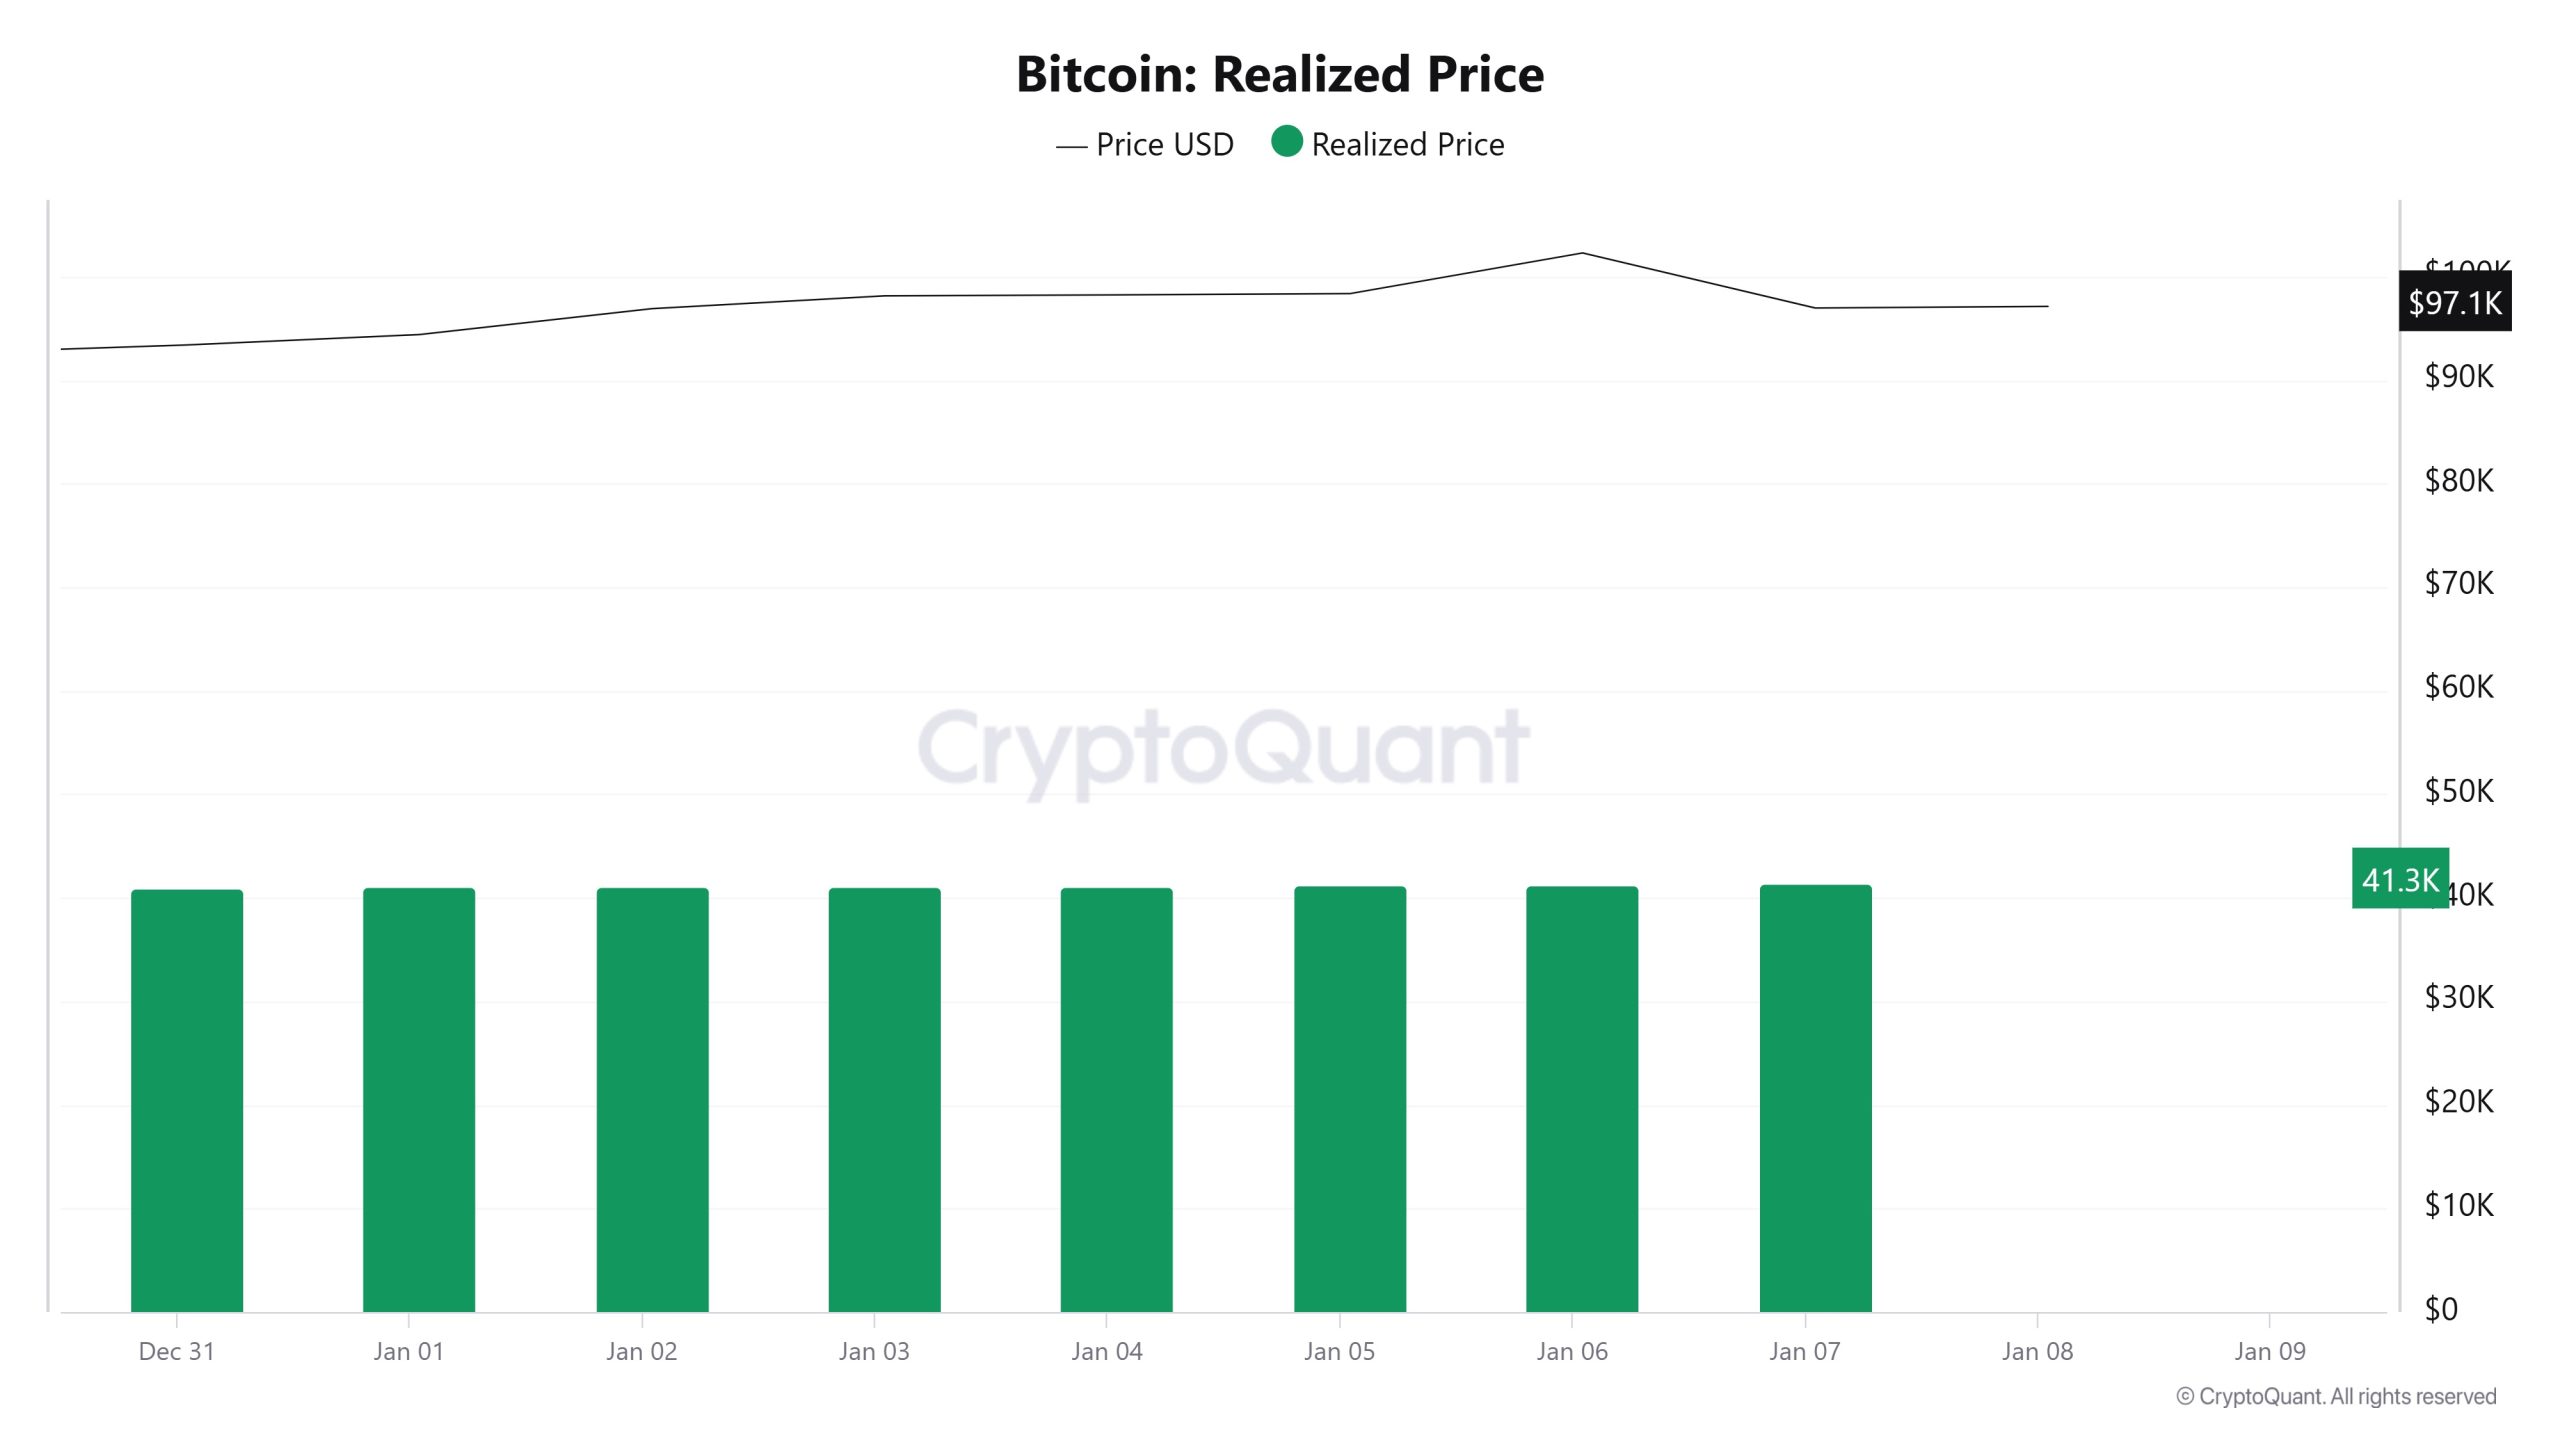
On Ocak 1, the Bitcoin price was 94,394 while the Realized Price was 41,049. On Ocak 7, the price increased to 96,961 while the Realized Price increased to 41,367. This represents a 2.72% increase in market price and a 0.77% increase in Realized Price.
The faster increase in the market price compared to the Realized Price suggests that short-term purchases were effective and speculative demand increased. The limited increase in Realized Price, on the other hand, indicates that long-term investors continue to support the market gradually.
While the Realized Price continues to rise, indicating that Bitcoin continues to be valued by long-term holders in general, the slow pace of increase may suggest that new long-term purchases have not yet gained strong momentum. This suggests that market prices are mostly influenced by short-term traders, while long-term investors remain cautious.
Spent Output Profit Ratio (SOPR)
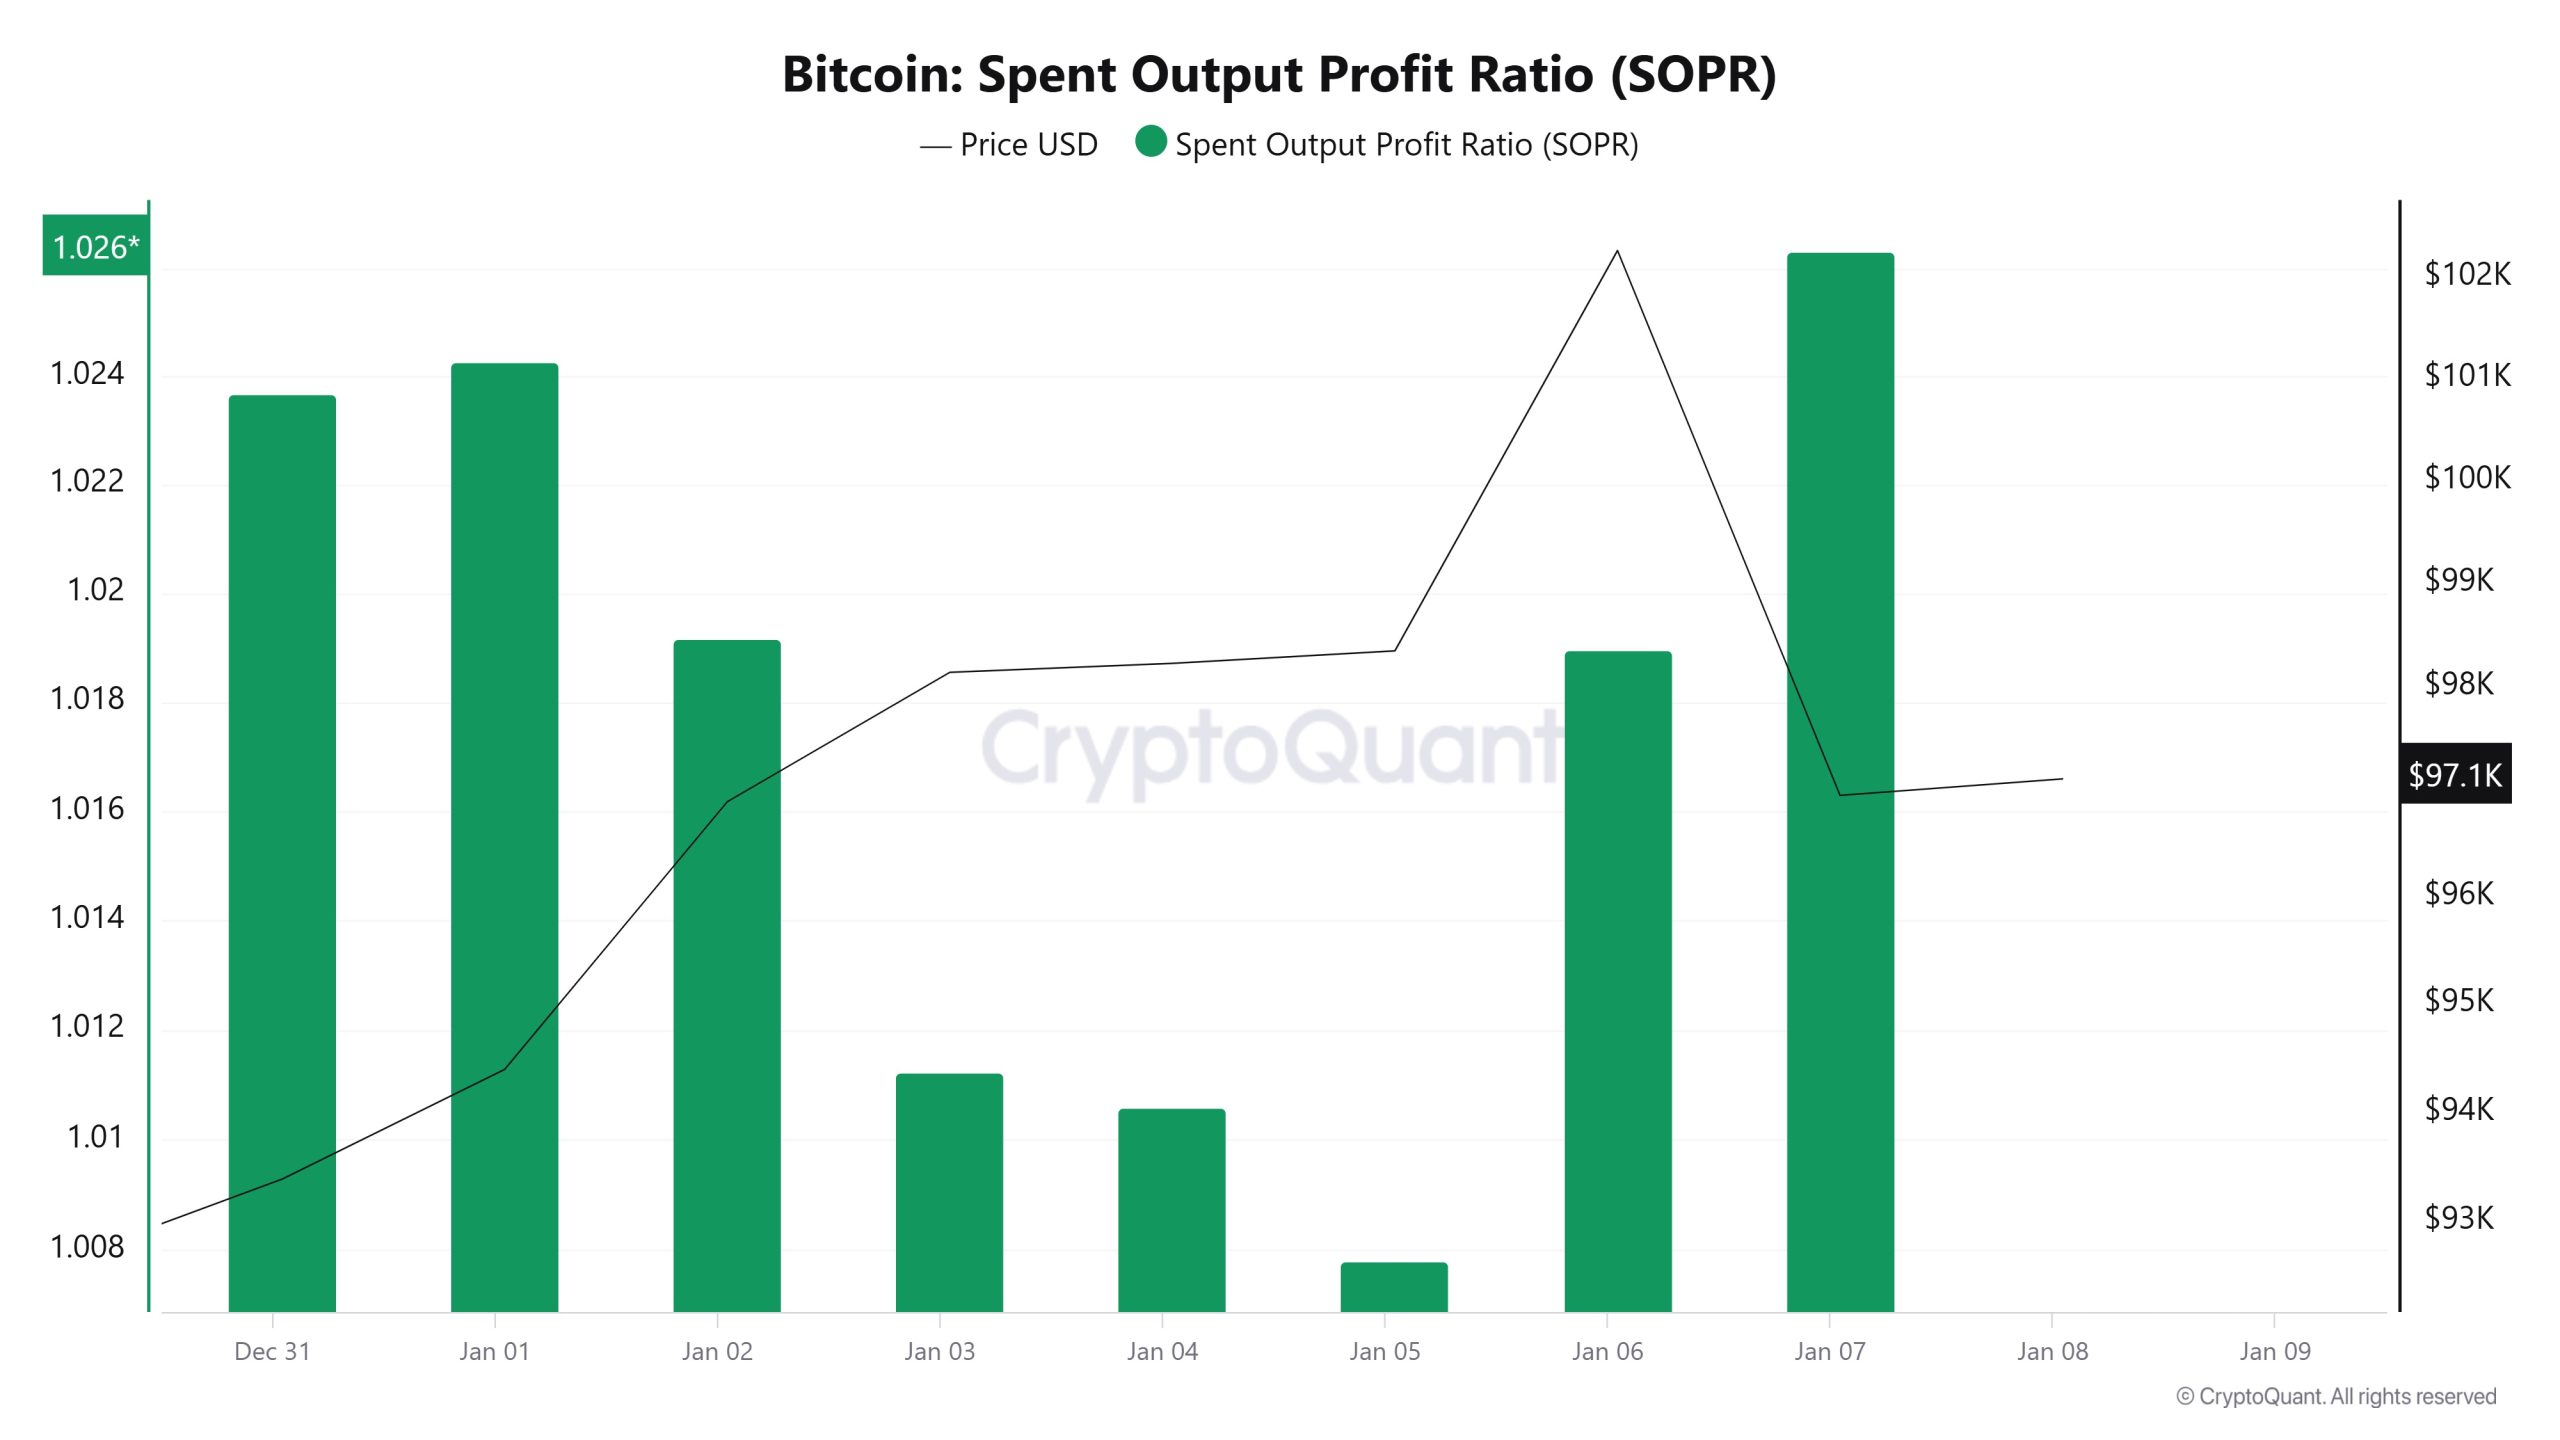
On Ocak 1, the Bitcoin price was 94,394 and the SOPR was 1.0242. On Ocak 7, the price rose to 96,961 and the SOPR to 1.0263. A SOPR above 1 indicates that market participants are mostly selling at a profit.
The limited increase in SOPR (0.2%) suggests that profit realizations are controlled and the market is not experiencing excessive selling pressure. The rise in Bitcoin price along with SOPR indicates a healthy profit realization process and suggests that the market remains balanced.
Türevler
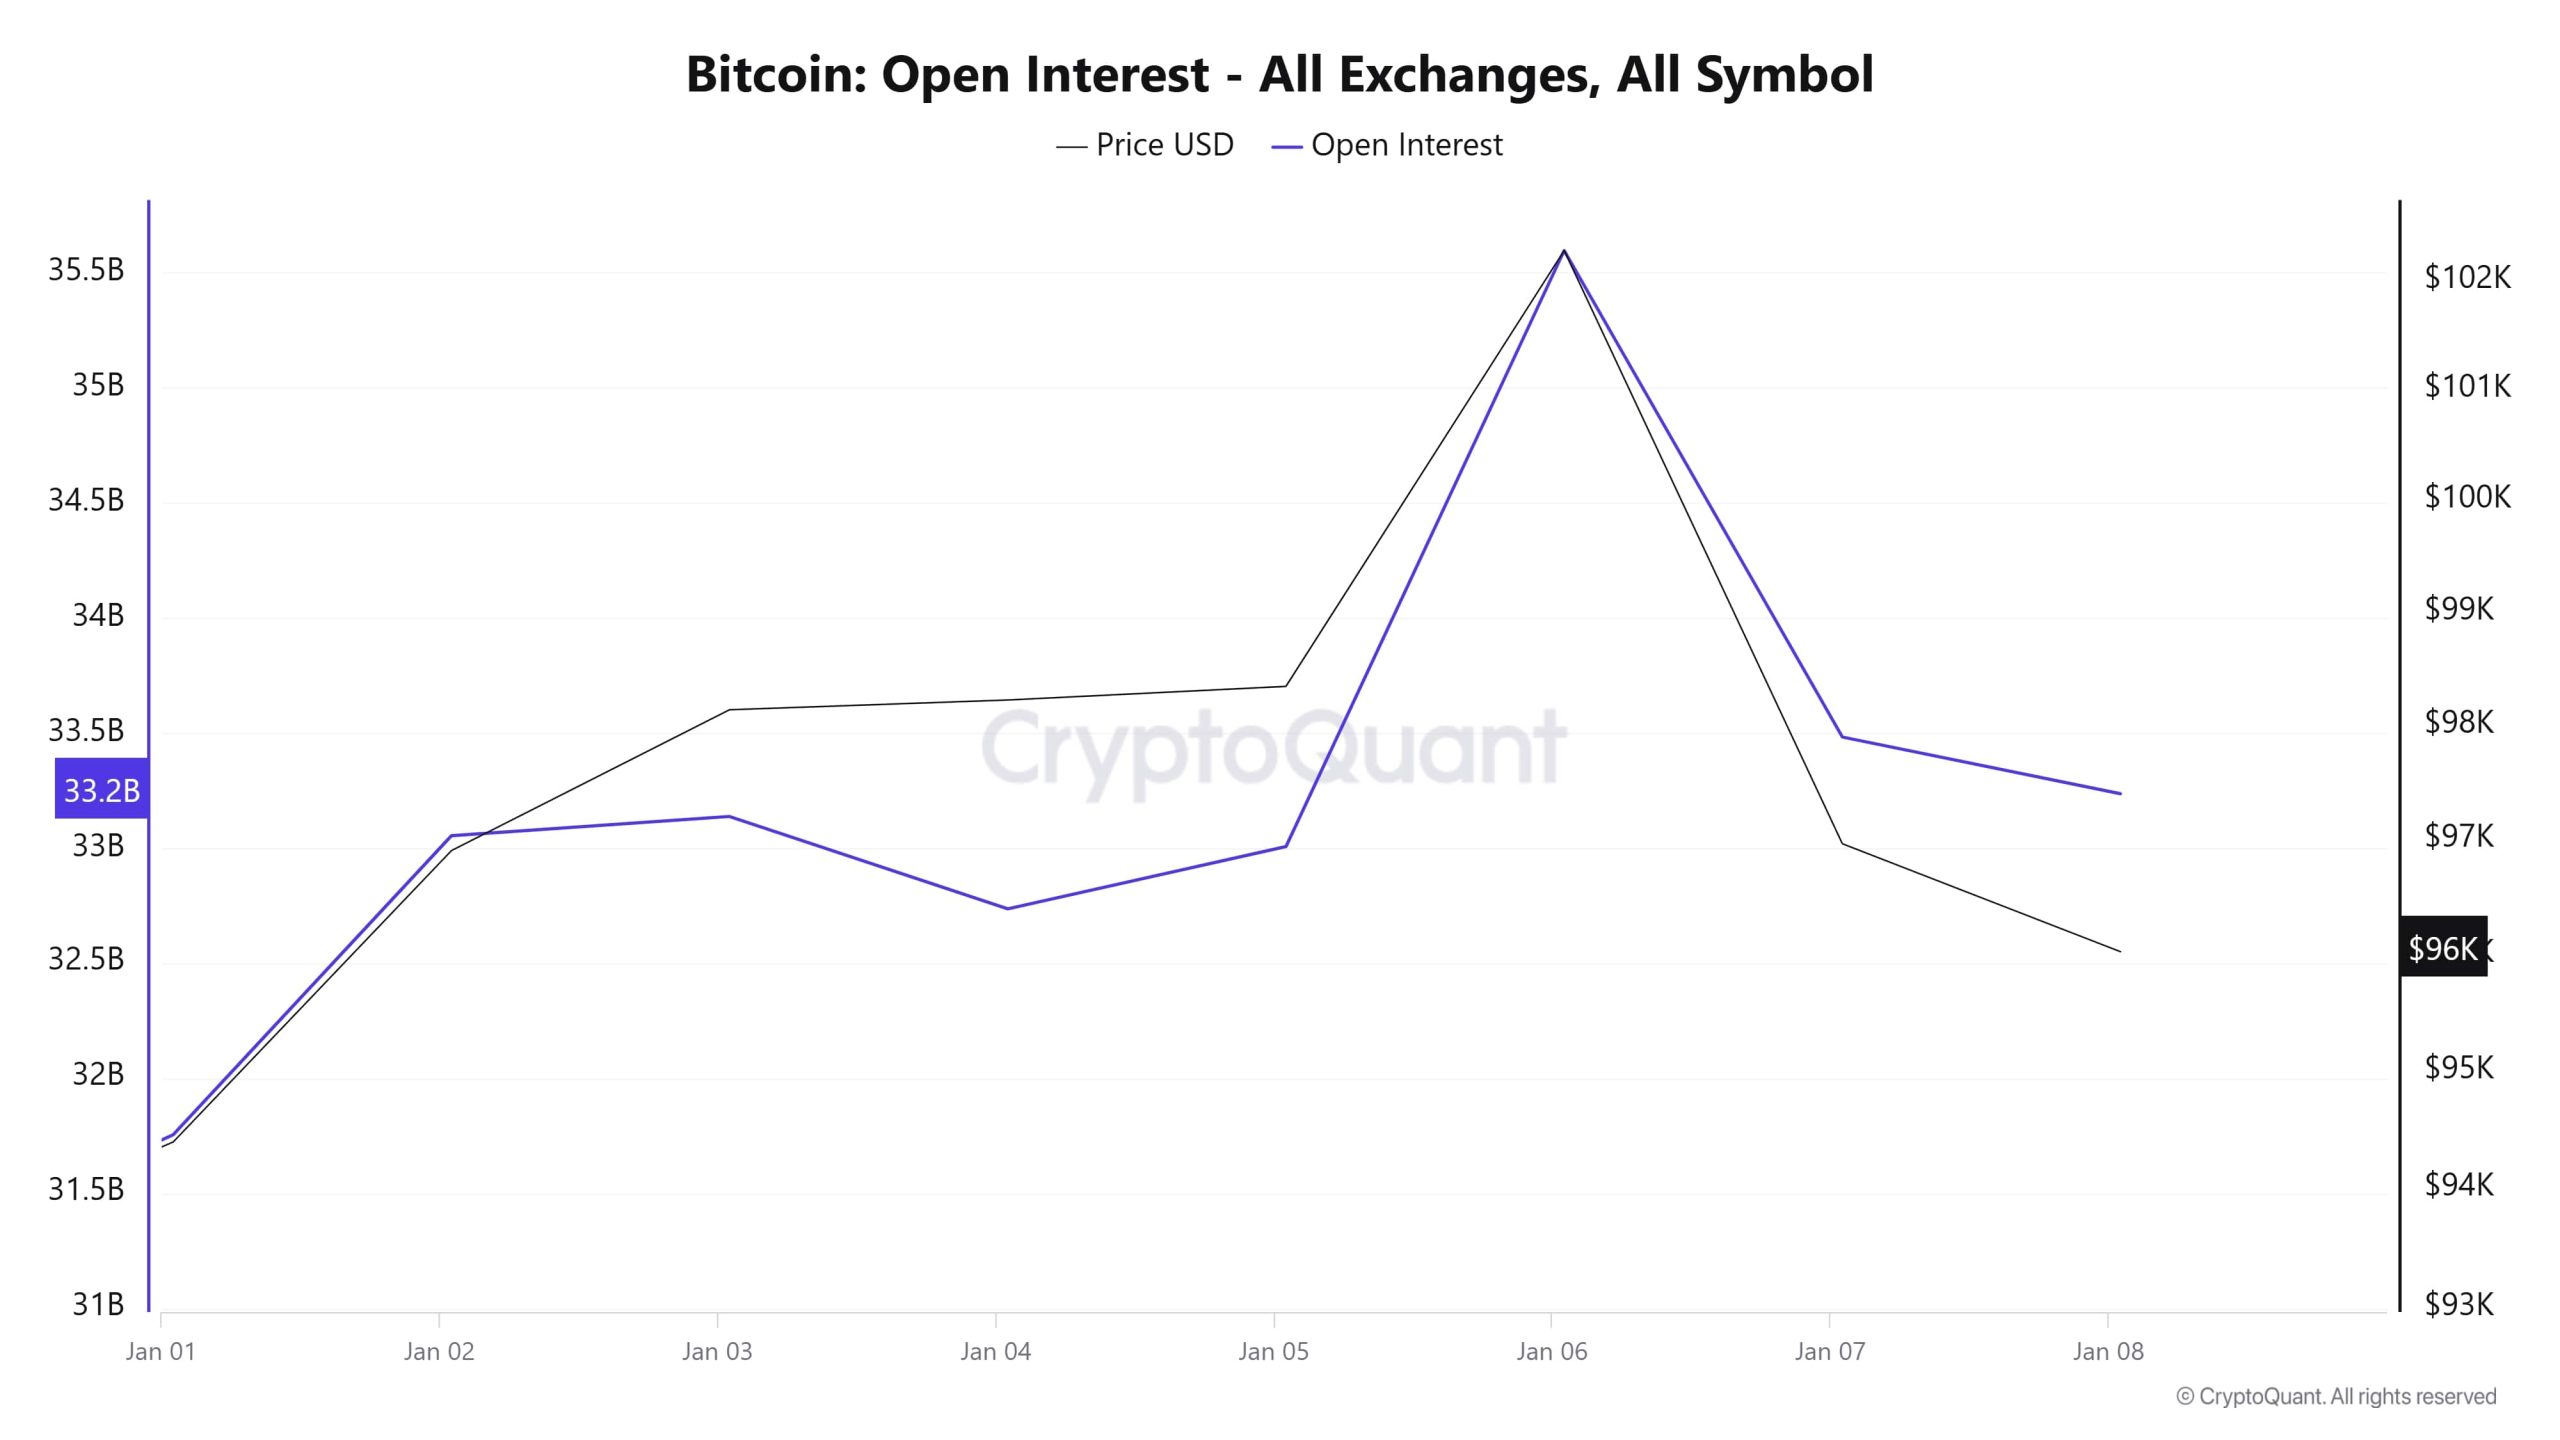
Looking at the Open Interest (OI) data in the chart, it can be seen that OI experienced a rapid rise and the market went through an active period during this period. However, the sudden drop in OI is noteworthy as prices fell sharply. It is a common scenario for such movements to create a domino effect, especially when leveraged positions come into play.
The relationship between price and OI also supports this. When the OI remains high while the price falls, it indicates that investors continue to enter the market but then unwind their positions. This usually indicates that the market may enter a period of consolidation or stabilization. However, if the price loses critical support levels, it could mean further selling pressure and loss of confidence.
In this situation, it is important for traders to be prepared for volatility and especially to closely monitor the impact of macroeconomic data on the market. It is important to remember that yesterday’s move was driven not only by BTC-specific factors, but also by global economic indicators. It will be critical to watch at what levels the price stabilizes to see BTC’s next move.
Fonlama Oranı
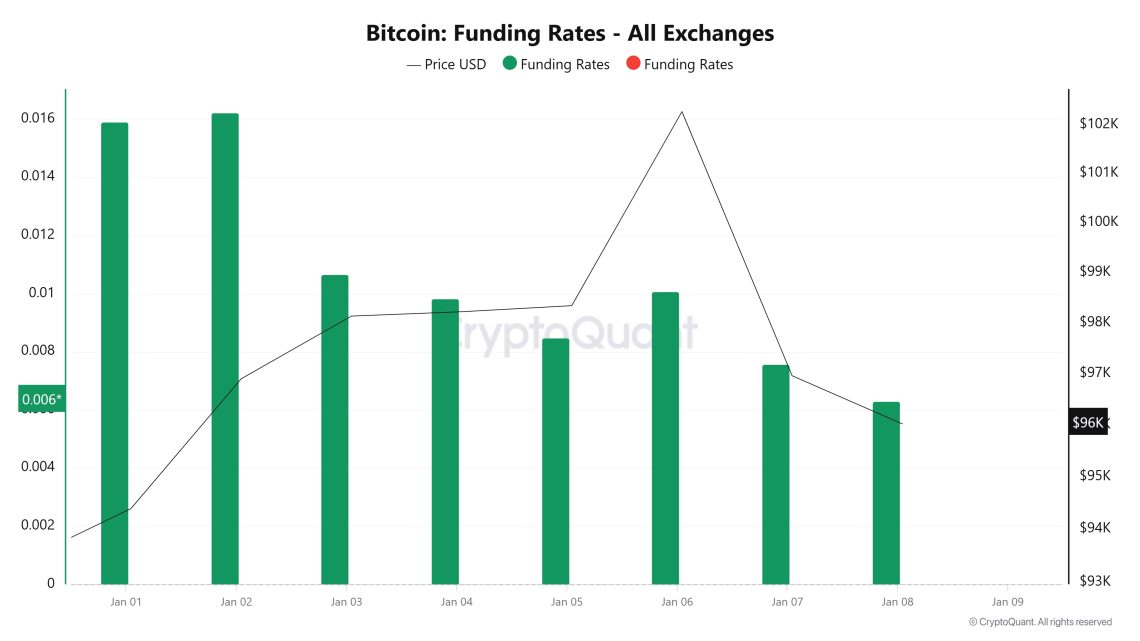
Funding rate data indicate that long positions are gaining weight in the market and investors generally expect BTC to appreciate. However, yesterday’s higher-than-expected PMI and JOLTS data put significant selling pressure on BTC, causing it to break critical support levels downwards. While the positive funded rate indicates that long positions are still active, these positions may face the risk of liquidation if the price continues its downtrend.
This suggests that the market has become over-leveraged and short positions may come into play and increase selling pressure. A positive funding rate may indicate that the market is trying to recover, but volatility is likely to remain high. On the other hand, if the funding rate declines, the market may enter a rebalancing process. For now, both volatility and liquidation risk seem quite high.
Uzun ve Kısa Tasfiyeler
After a very volatile week, Bitcoin first managed to surpass the $100,000 level, then quickly retreated to around $95,000. This sharp movement caused investors in both long and short positions to suffer significant liquidation.
As of Ocak 07, a total of USD 64.2 million worth of long positions were liquidated, while USD 57.09 million worth of short positions were liquidated. This data once again demonstrates the market’s vulnerability to high volatility and liquidity risk. In particular, such sudden price movements highlight the importance of careful risk management for leveraged traders.
| Tarih | Uzun Tutar (Milyon $) | Kısa Tutar (Milyon $) |
|---|---|---|
| 02 Ocak | 8.25 | 12.29 |
| 03 Ocak | 14.08 | 13.63 |
| 04 Ocak | 1.90 | 13.81 |
| 05 Ocak | 2.16 | 2.28 |
| 06 Ocak | 4.82 | 11.24 |
| 07 Ocak | 32.99 | 3.84 |
| Toplam | 64.20 | 57.09 |
Tedarik Dağıtımı
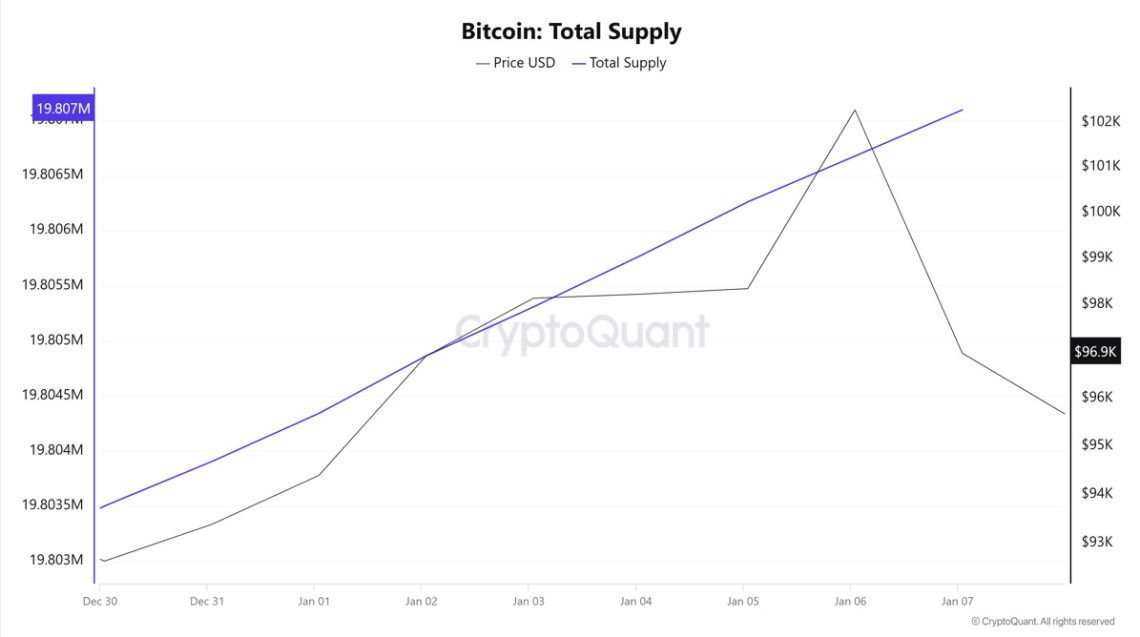
Total Supply: It reached 19,807,096 units, up about 0.0181% from last week.
New Supply: The amount of BTC produced this week was 3,576.
Velocity: Continued decline in the first week of the year.
| Cüzdan Kategorisi | 30.12.2024 | 07.01.2025 | Değişim (%) |
|---|---|---|---|
| < 0.1 BTC | 1.587% | 1.589% | 0.126% |
| 0.1 – 1 BTC | 5.415% | 5.417% | 0.0369% |
| 1 – 100 BTC | 32.299% | 32.285% | -0.0433% |
| 100 – 1k BTC | 22.491% | 22.609% | 0.5247% |
| 1k – 100k BTC | 34.915% | 34.824% | -0.2606% |
| > 100k BTC | 3.271% | 3.271% | 0.0% |
Evaluation
In particular, the slight increase in the proportion of small investors holding 0.1 BTC and below indicates continued optimism on the part of individual users, but the declines seen in wallets holding 1-100 BTC and 1k-100k BTC suggest that investors in these groups are realizing profits or reducing their positions due to price uncertainty.
In contrast, wallets in the 100-1k BTC range showed a significant increase, growing by 0.5247%. This may indicate that institutions are adopting a longer-term strategy and seizing market opportunities. Wallets holding >100k BTC remained unchanged, suggesting that large-scale investors tend to maintain their existing positions.
Velocity’s decline in the first week of the year suggests that the overall pace of trading in the market has slowed and investors are more cautiously reviewing their positions. While the year-end holidays may be one of the main reasons for this decline, a “wait-and-see” strategy may also be effective as the market searches for direction and short-term trading volumes decline.
Döviz Rezervi
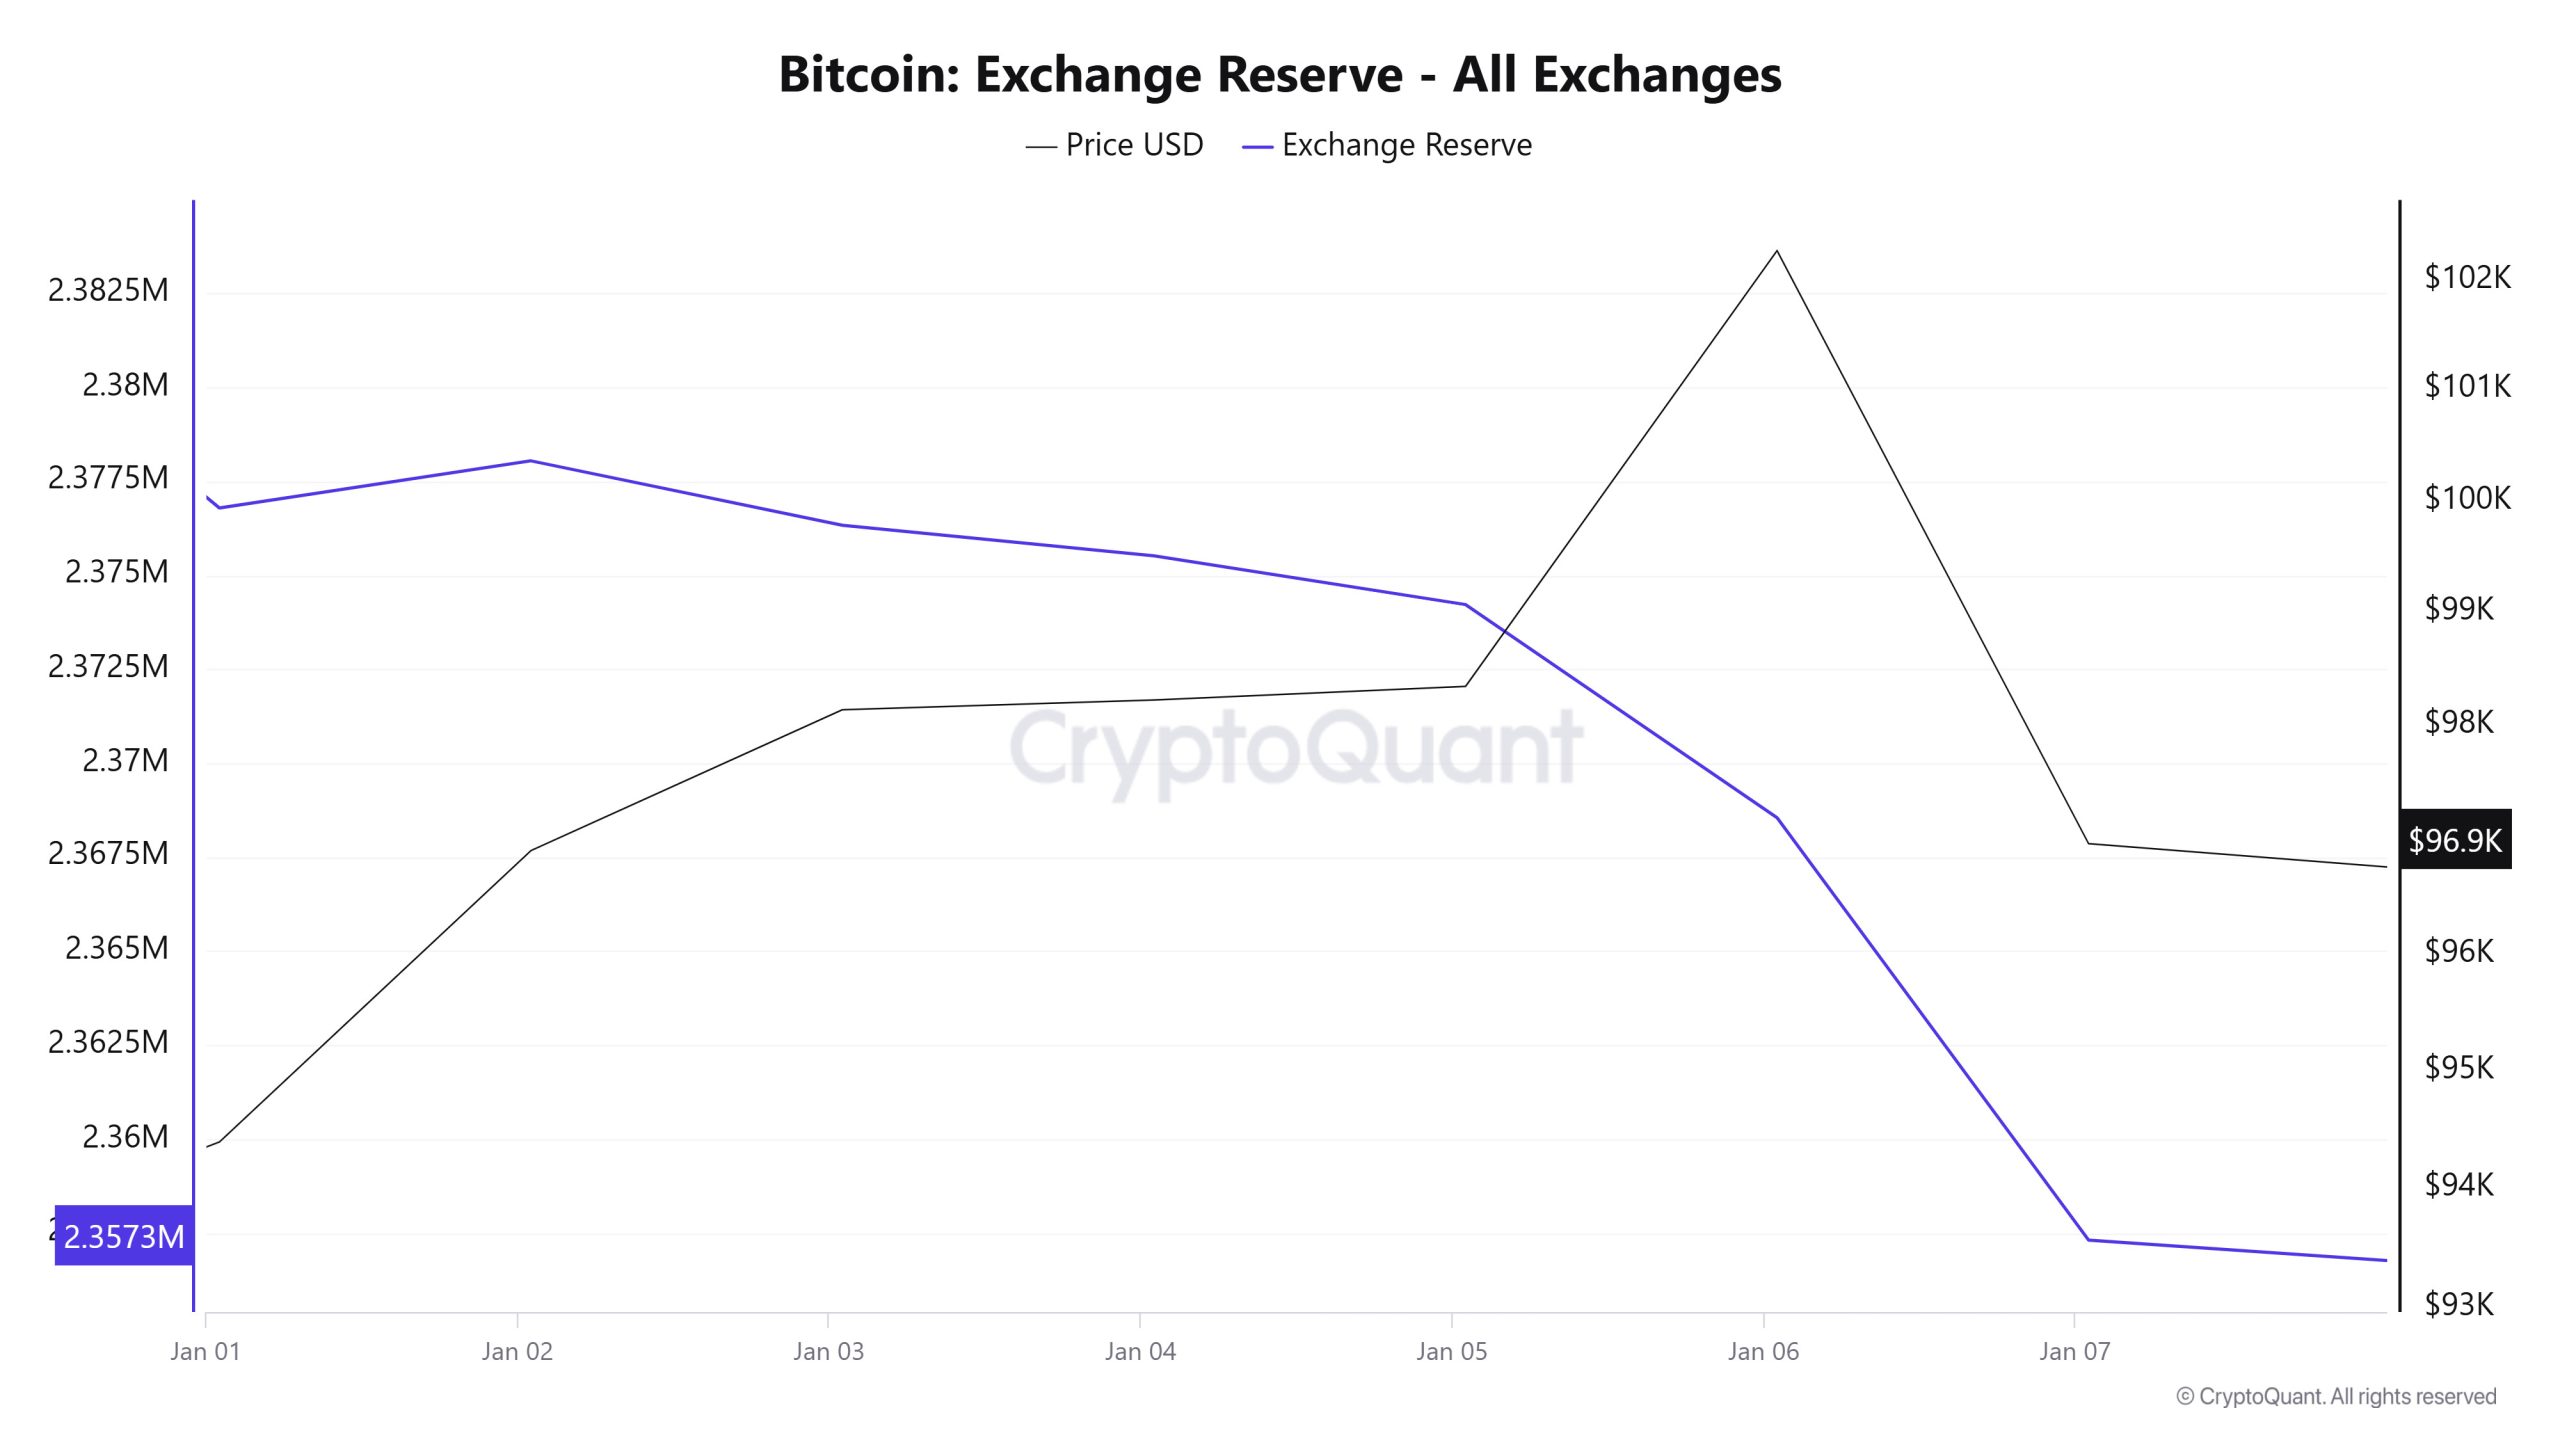
As of Ocak 07, 2025, total Bitcoin reserves on exchanges stood at 2,357,313 BTC, down 1.10% from a week ago, with a total net outflow of 26,323 BTC. On a weekly basis, there were particularly high net outflows on Ocak 06 (-5,670 BTC) and Ocak 07 (-11,236 BTC). During this period, Bitcoin’s daily close was $94,394 on Ocak 01, 2025, and rose throughout the week, reaching $102,276 on Ocak 06, 2025. However, on Ocak 07, 2025, the price dropped to a daily close of $96,961.
| Tarih | Exchange Inflow | Exchange Outflow | Exchange | Döviz Rezervi | BTC Price |
|---|---|---|---|---|---|
| 1-Jan | 28,901 | 35,749 | -6,848 | 2,376,788 | 94,394 |
| 2-Jan | 25,289 | 24,035 | 1,254 | 2,378,042 | 96,901 |
| 3-Jan | 30,842 | 32,556 | -1,714 | 2,376,328 | 98,137 |
| 4-Jan | 9,427 | 10,238 | -811 | 2,375,517 | 98,224 |
| 5-Jan | 10,259 | 11,556 | -1,298 | 2,374,219 | 98,344 |
| 6-Jan | 40,690 | 46,360 | -5,670 | 2,368,549 | 102,276 |
| 7-Jan | 40,584 | 51,820 | -11,236 | 2,357,313 | 96,961 |
Between Ocak 01-06, 2025, there was a significant increase in the Bitcoin price as Bitcoin reserves on exchanges decreased. This suggests that the decrease in reserves had a contractionary effect on the supply in the market and supported the price increase in the short term. In contrast, on Ocak 07, 2025, the Bitcoin price declined, but reserve outflows continued. This suggests that investors either took profit realizations based on market sentiment or increased selling pressure in anticipation of further price declines. In the long run, the decline in Bitcoin reserves on exchanges may limit the supply in circulation, providing a favorable backdrop for a potential price increase. However, in the short term, price movements continue to be more influenced by external factors such as market sentiment and selling pressure.
Ücretler ve Gelirler
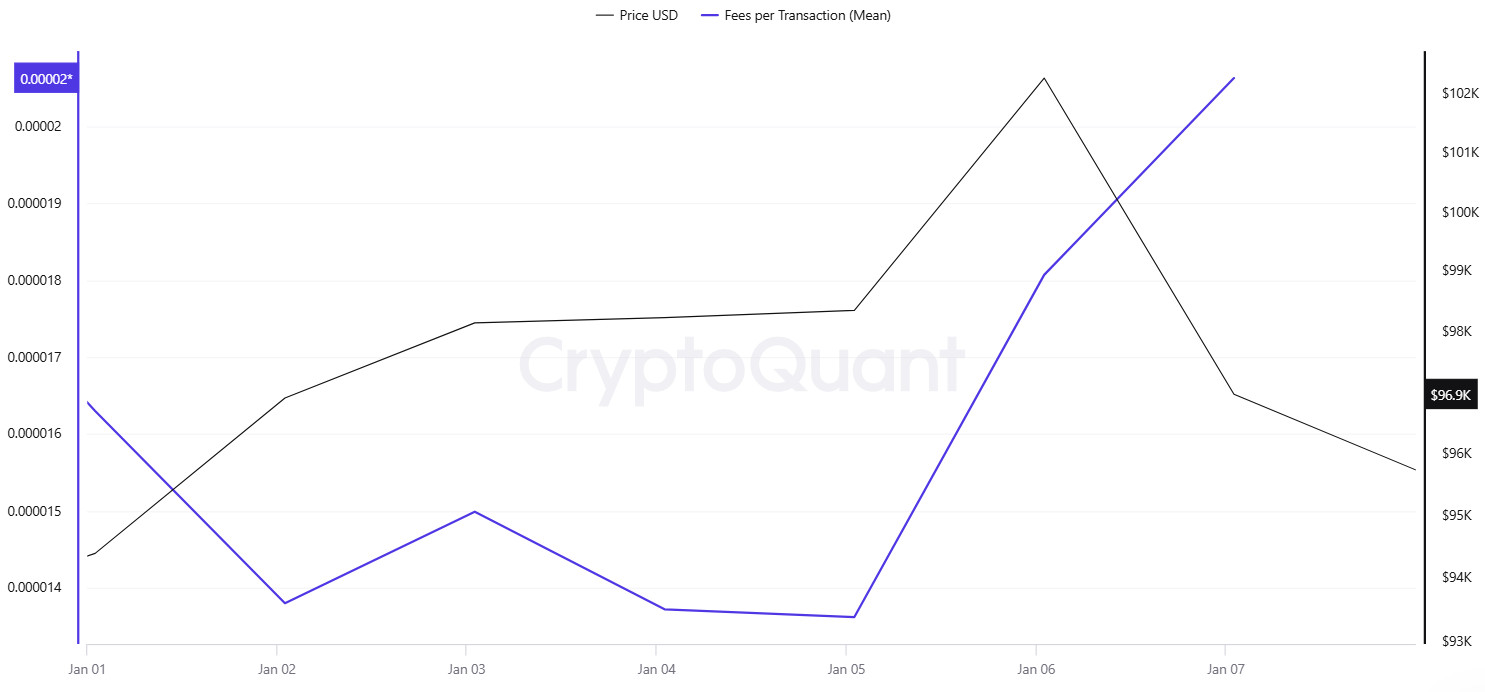
An analysis of Bitcoin Fees per Transaction (Mean) data between Ocak 01-07 shows that a calm course was observed in the first days of the week. In this context, Bitcoin Fees per Transaction (Mean) value was recorded as 0.0000163 on Ocak 01, the first day of the week.
On Ocak 05, the Fees per Transaction (Mean) value, which was at 0.00001362 on Ocak 05, increased and reached 0.00002063 on Ocak 07, the last day of the week, with the increased volatility following the accelerated positive movement in Bitcoin price. This level was also recorded as the highest value of the week.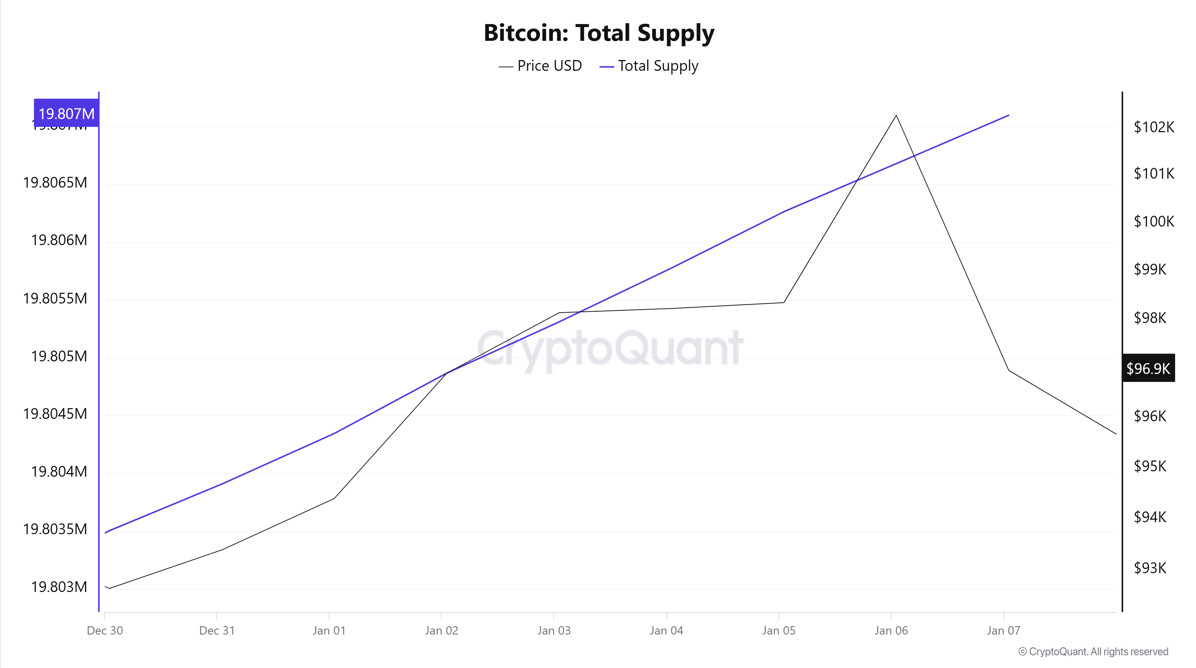
Similarly, when Bitcoin Fees (Total) data between Ocak 01-07 were analyzed, it was observed that a calm course was observed in the first days of the week in parallel with the Bitcoin price movement. Accordingly, on Ocak 01, the first day of the week, Bitcoin Fees (Total) was recorded as 4.75966146.
As of Ocak 05, Bitcoin Fees (Total) value also increased along with the volatile course that started in Bitcoin price. Accordingly, Bitcoin Fees (Total) value, which was at 5.90927713 on Ocak 05, increased and reached 7.26172212 on Ocak 07, the last day of the week. This level was also recorded as the highest value of the week.
Miner Flows
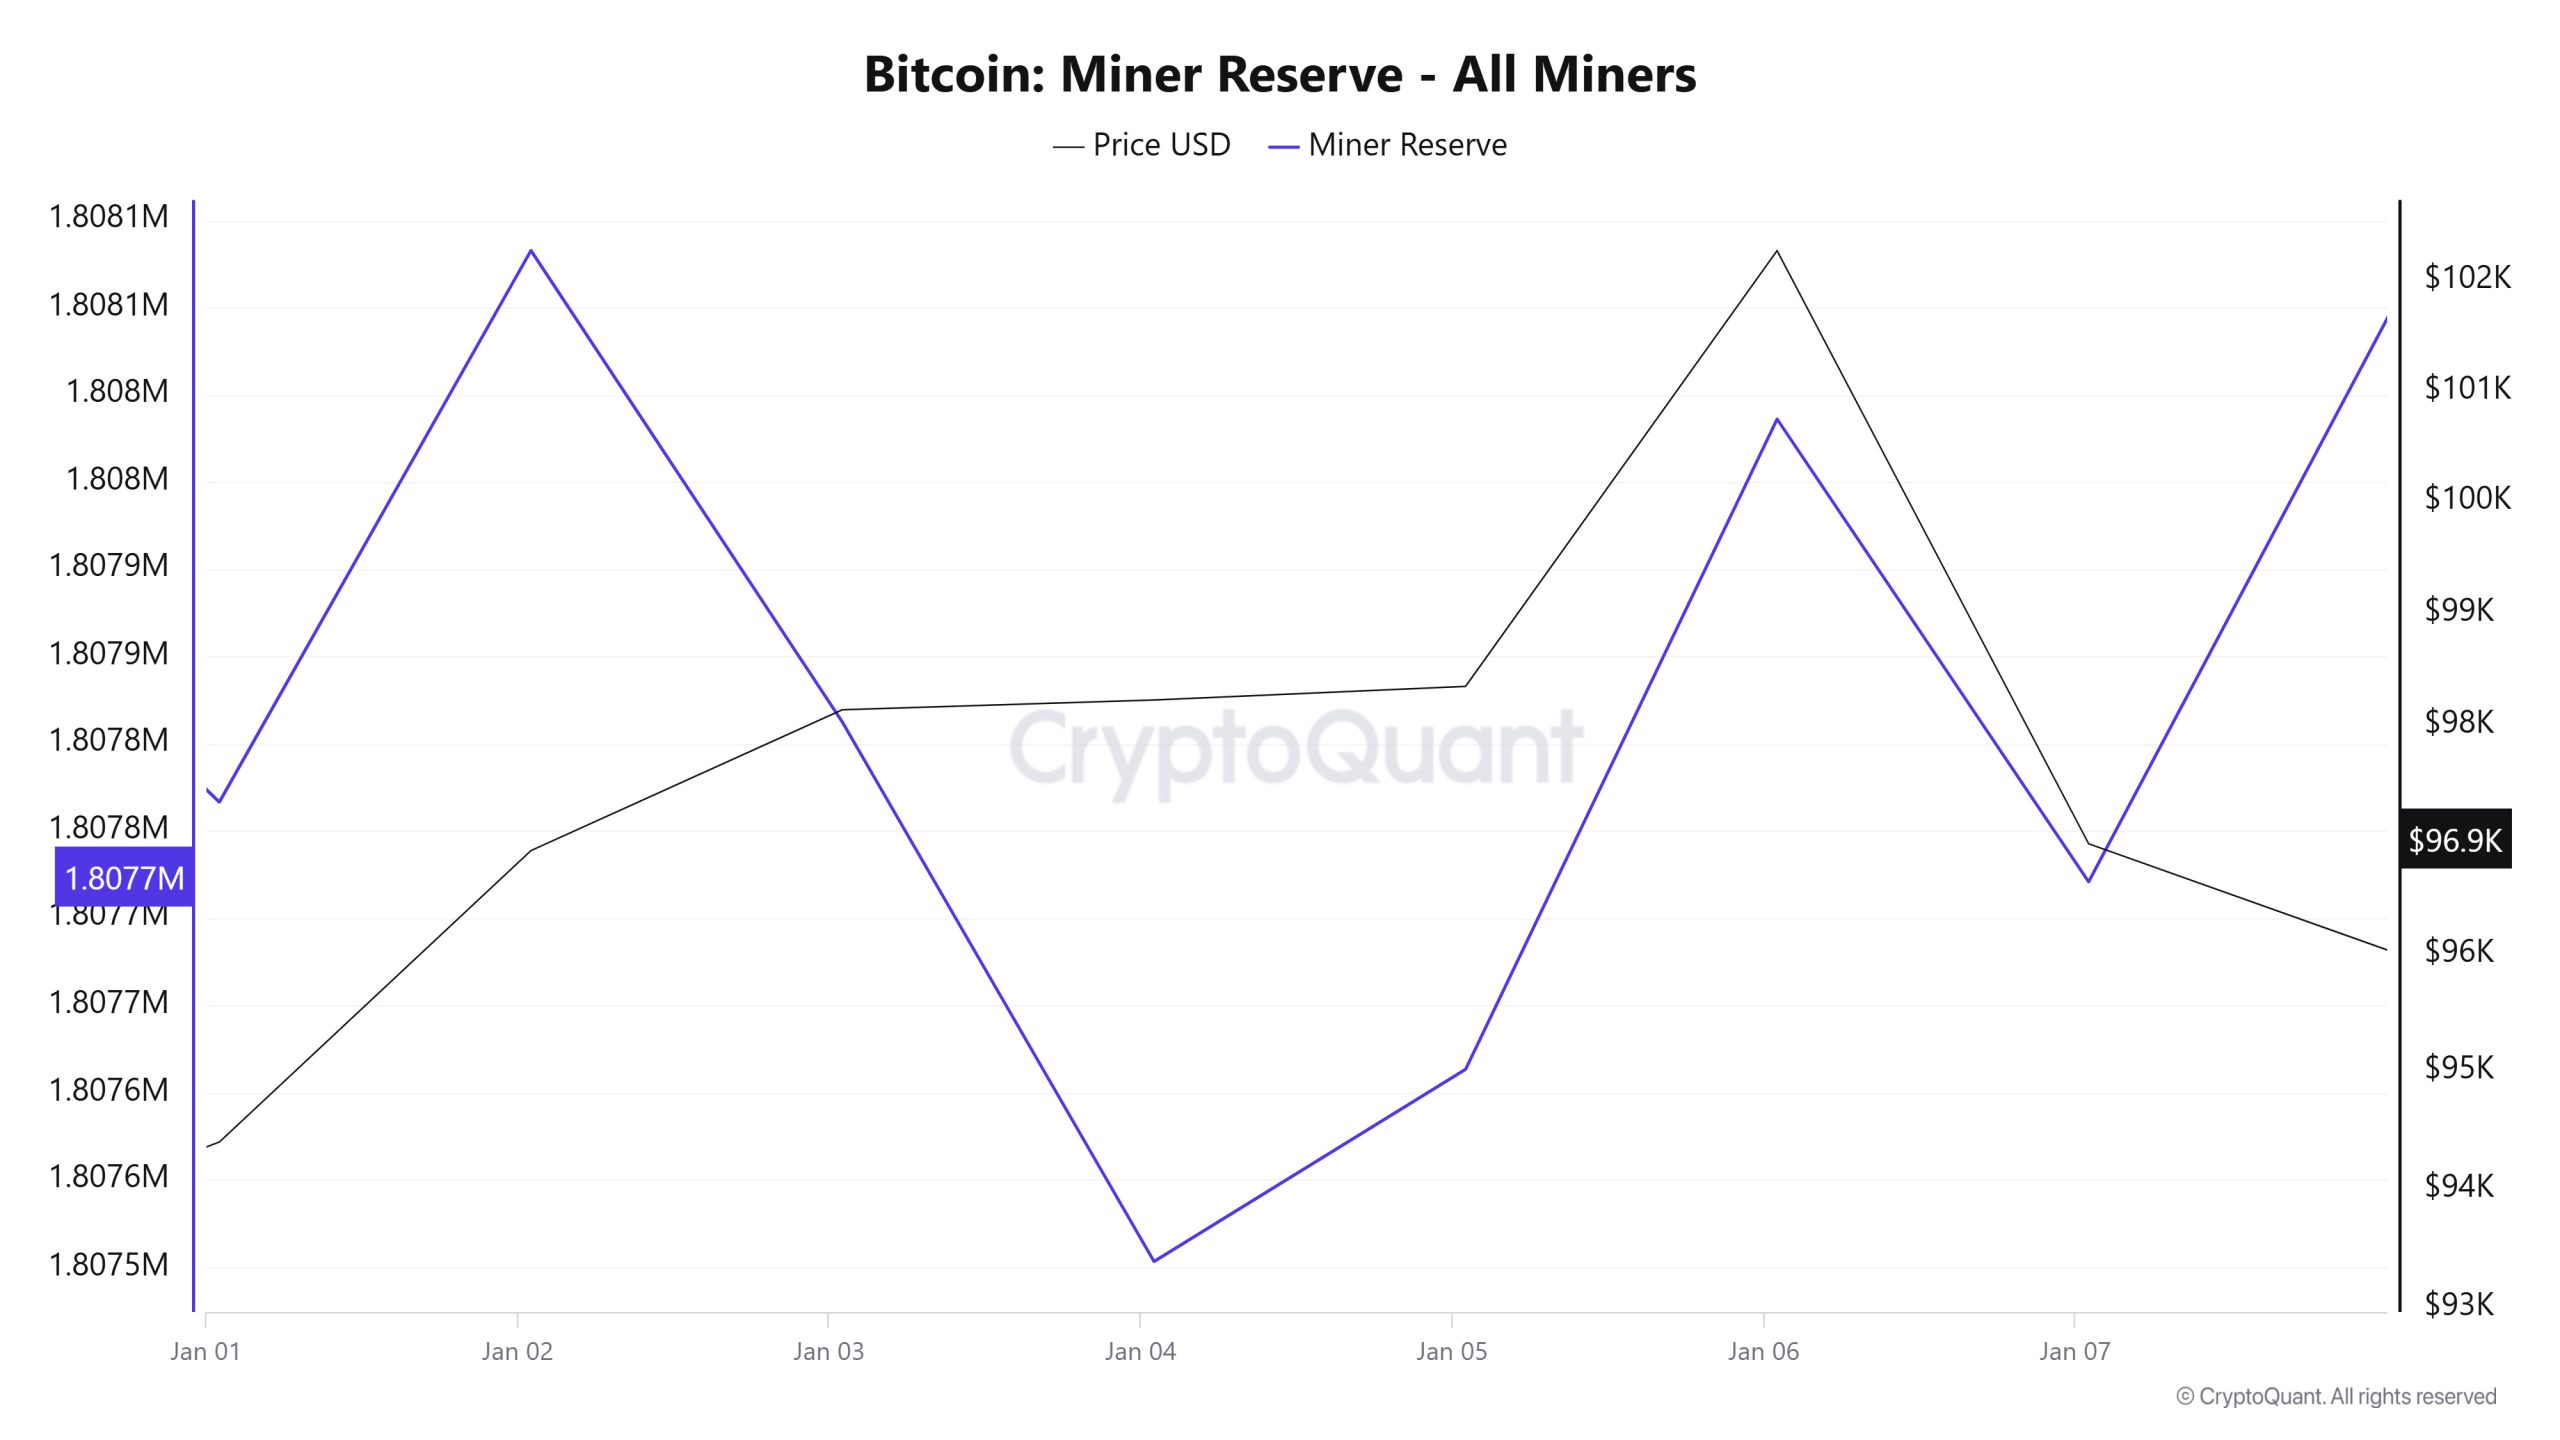
İşlem
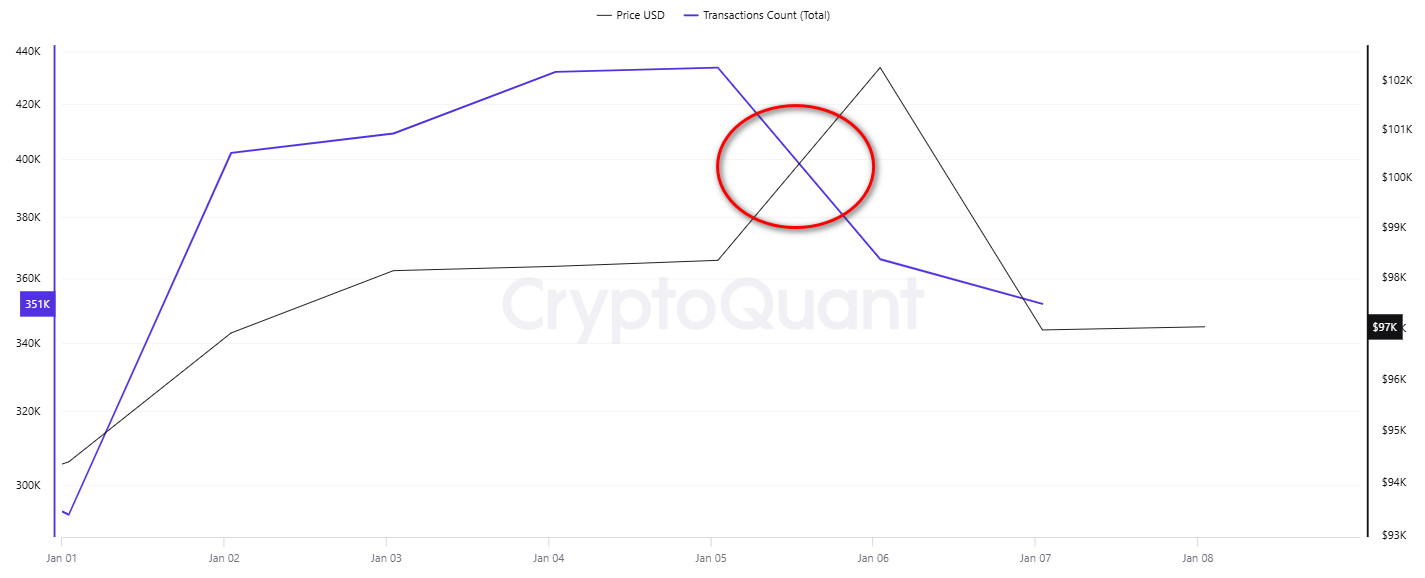
Transaction Count
On Ocak 1, BTC started the new year with the lowest number of daily transfers, and while it generally remained at low levels on weekends, it reached a peak in the number of transactions on the weekend of Ocak 4-5. While a positive correlation was observed between the number of transfers and Bitcoin price between Ocak 1-5, this relationship broke down as of Ocak 6. As can be seen from the price movements, the effect of the decrease in the number of transfers on the price was reflected as a decline on Ocak 7.
Tokens Transferred
Looking at the amount of BTC transferred, despite the peak in the number of transactions on the weekend, the lowest number of BTC transfers was observed on the weekend of Ocak 4-5. On the other hand, when the weekend-adjusted chart is analyzed, it is seen that the daily BTC transfer amount increased steadily from 539,516 to 808,212 between Ocak 1-7. In other words, although the number of transactions decreased on Ocak 6-7, it stands out as the two busiest days of the week in terms of the amount of BTC transferred. The increase in the amount of BTC transferred despite the decrease in the number of transactions may indicate that market participants are moving towards larger volume transactions. In addition, the steady increase in the amount of BTC transferred per day despite the decrease in the number of transactions may indicate that a large portion of Bitcoins circulating in the market have started to accumulate in bulk wallets.
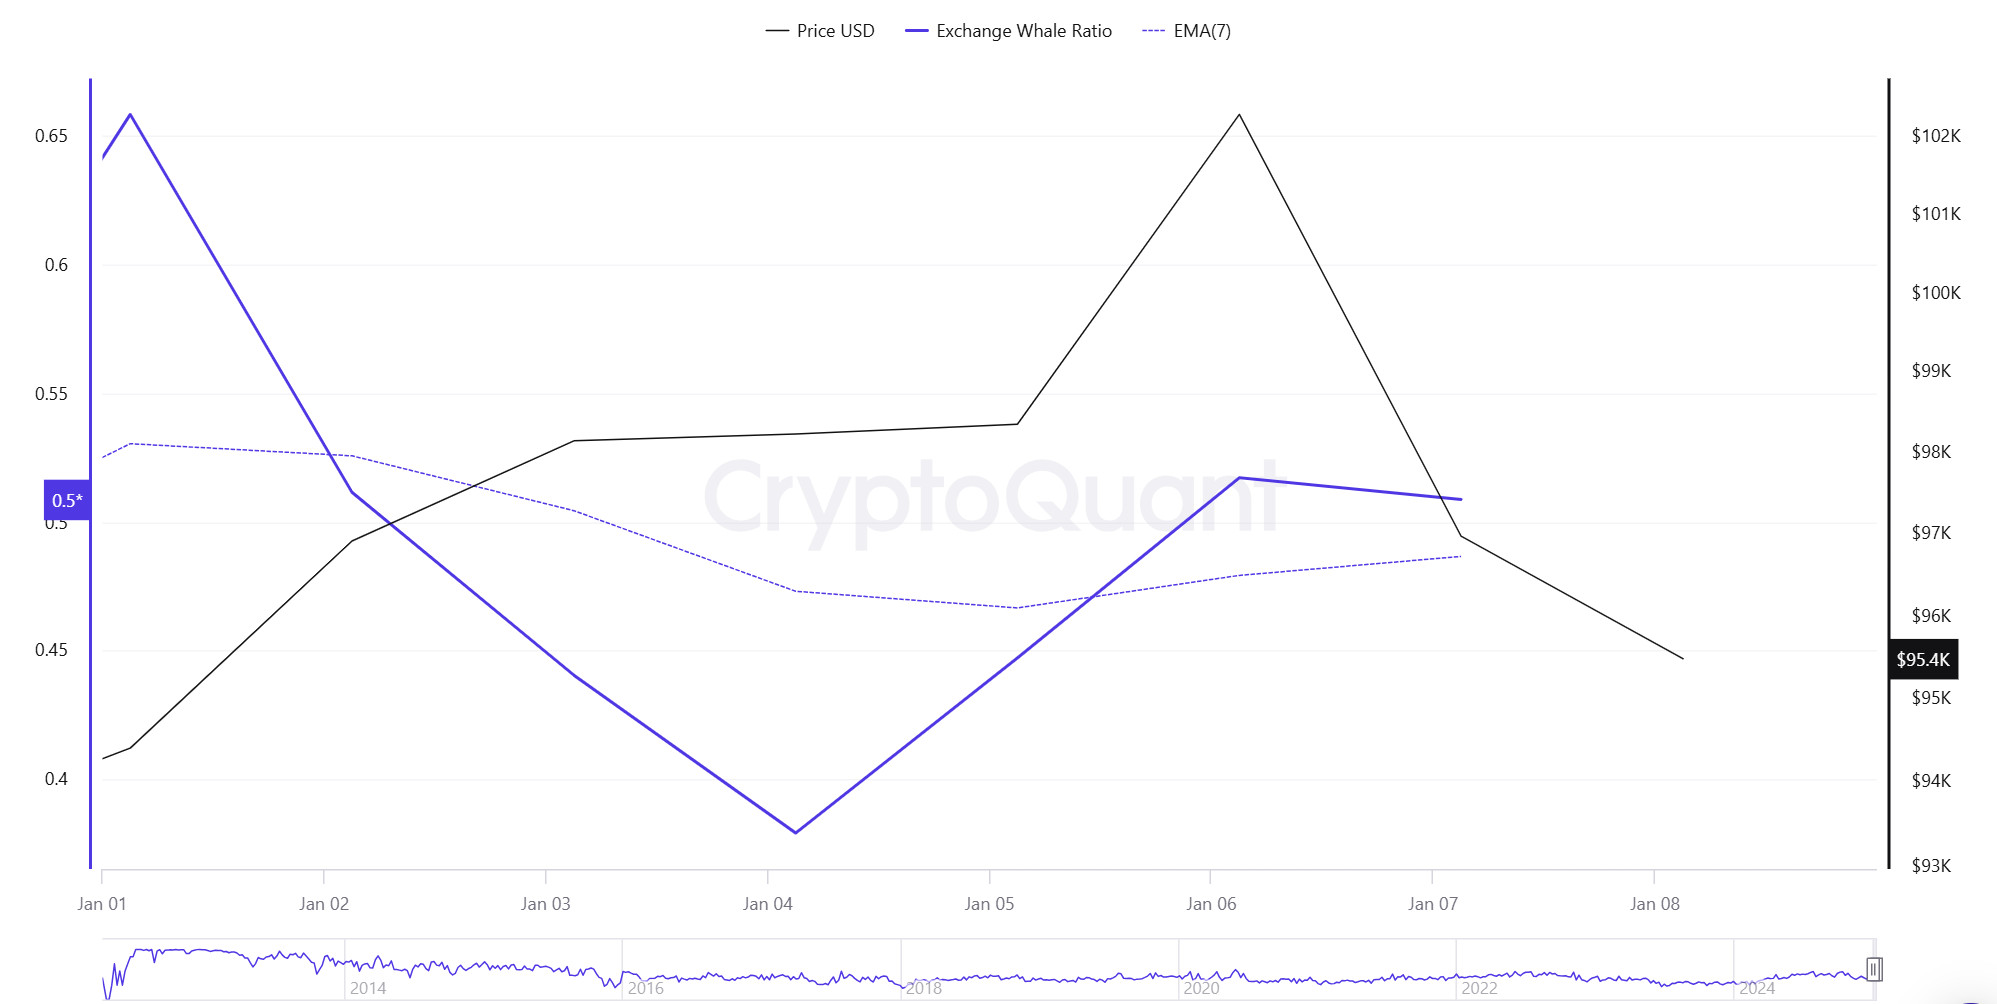
Whale Activities
If we look at its performance over the last 7 days, Bitcoin has increased by about 2.06%. The dynamics behind this rise shed light on the influence of major market players. Data shared by CryptoQuant analyst Axel Adler highlighted an interesting trend. The top 10 largest trades on exchanges now dominate 94.5% of total trading volume, dwarfing smaller trades. This figure is particularly noteworthy as it exceeds the 10-year average of 93.5% and underlines the increasing concentration of market power among the big players. It also shows that whales and institutional investors are playing a dominant role in shaping Bitcoin’s price movements. However, this dominance is not static and fluctuates with market cycles, providing insight into broader trends. Adler highlights a historical trend in whale behavior, where whales often sell their holdings and gradually reduce their market dominance as the cycle reaches a peak. This was clearly observed during Bitcoin’s movement between $35,000 and $70,000, when the whales’ dominance began to decline. On the other hand, Axel Adler shared valuable on-chain data revealing that the average purchase price for new Bitcoin whales is $81.2K, while the average purchase price for old whales is $30.1K. This data provides insight into the accumulation patterns of large investors, highlighting their position as critical indicators for Bitcoin’s price movement.
Whales Data:
When we look at the last 7 days of whale movements, it shows that centralized exchanges are used more by whales. When we look at this ratio, it is seen at a rate of 0.5, while central exchanges have been used less than the last 7 days. When this ratio is above 0.350, it usually means that whales often use central exchanges. This may mean that there may be selling pressure at any time. After the middle of this week, more BTC sellers used centralized exchanges. At the same time, when we look at the total BTC transfer, we see that approximately 4,317,167 BTC moved, down from last week.
YASAL BİLDİRİM
Bu dokümanda yer alan yatırım bilgi, yorum ve tavsiyeleri yatırım danışmanlığı hizmeti niteliği taşımamaktadır. Yatırım danışmanlığı hizmeti, yetkili kuruluşlar tarafından kişilerin risk ve getiri tercihleri dikkate alınarak kişiye özel olarak verilir. Bu dokümanda yer alan yorum ve tavsiyeler genel niteliktedir. Bu tavsiyeler mali durumunuz ile risk ve getiri tercihlerinize uygun olmayabilir. Bu nedenle, sadece bu dokümanda yer alan bilgilere dayanarak yatırım kararı vermeniz beklentilerinize uygun sonuçlar doğurmayabilir.
NOT: Bitcoin onchain analizinde kullanılan tüm veriler Cryptoqaunt'a dayanmaktadır.


