Technical Analysis
BTC/USDT
With the Senate approving the temporary funding bill, attention now turns to the House of Representatives today; following the vote, the government is expected to reopen this week. President Trump warned that a potential negative Supreme Court ruling on tariffs could create a refund burden exceeding $3 trillion. White House Economic Advisor Kevin Hassett predicted that GDP growth could rise to the 3–4% range by early 2026 following the shutdown. Meanwhile, “Fed Whisperer” reports revealed persistent differences between hawkish and dovish members regarding a December rate cut.
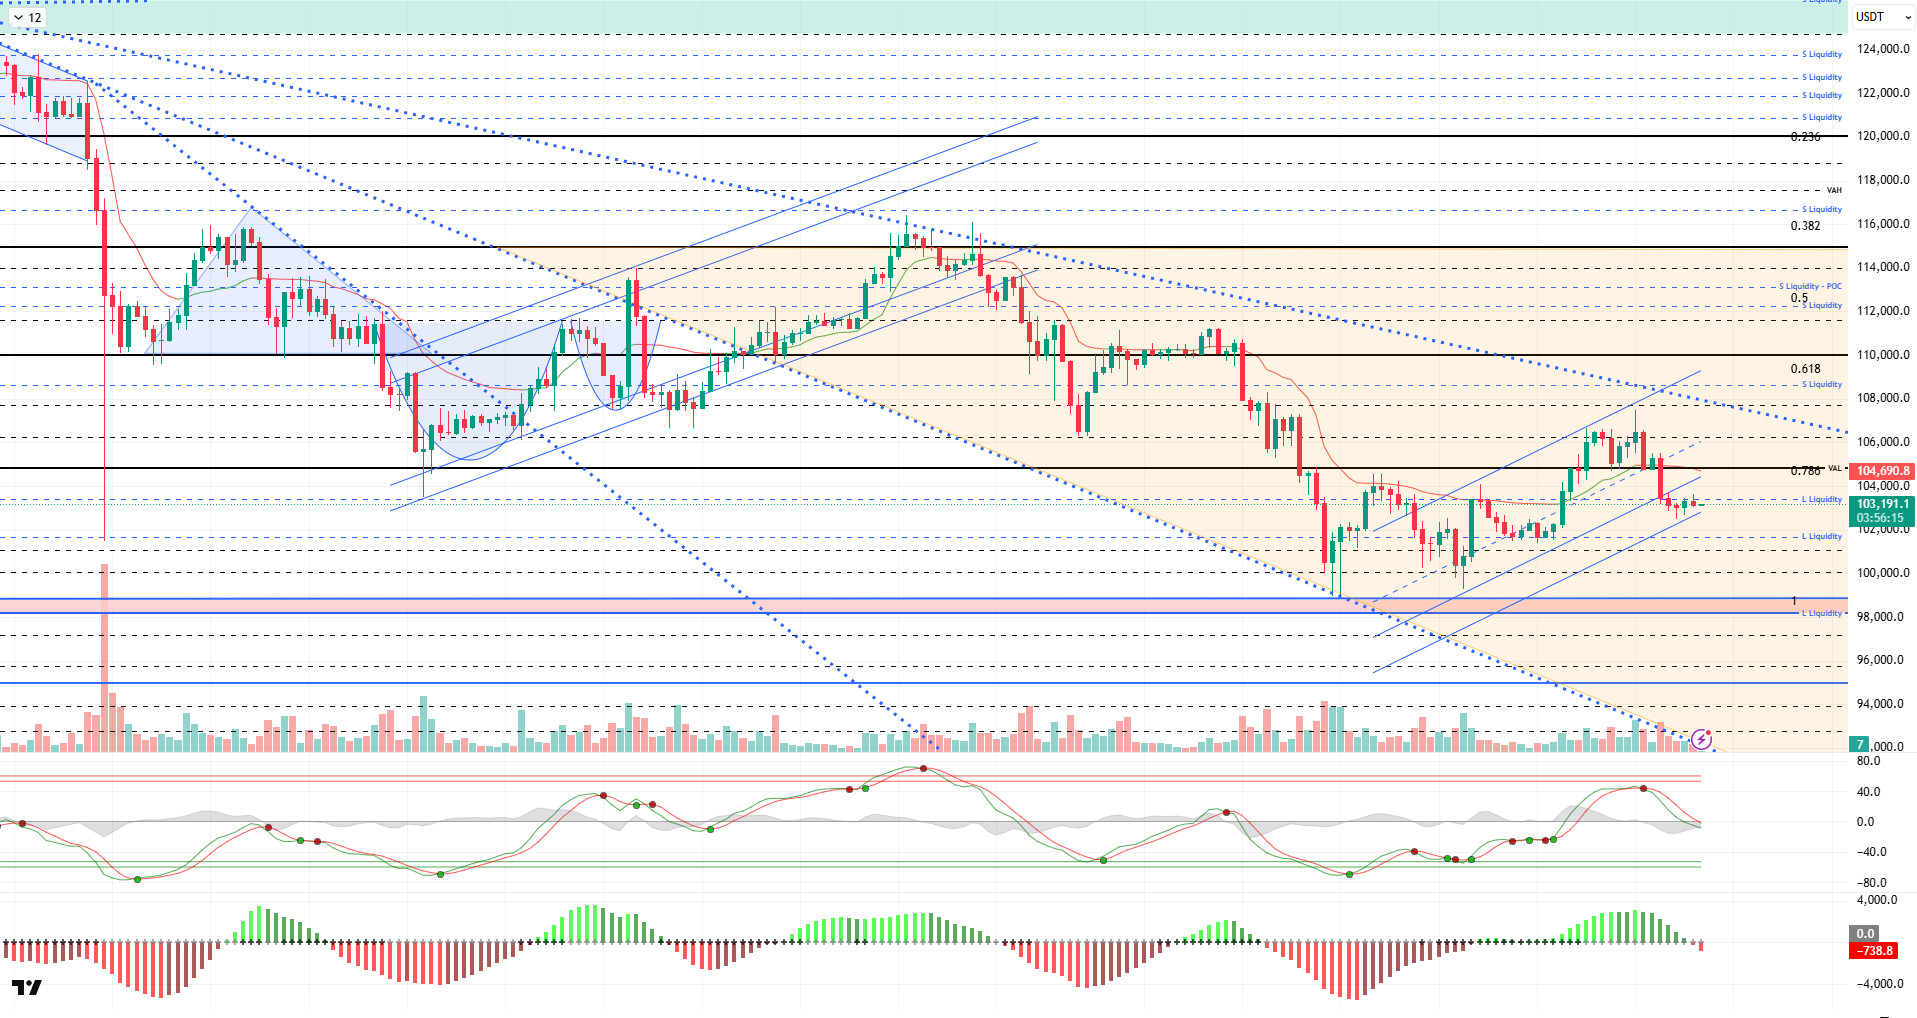
Technically speaking, BTC deepened its bearish outlook from the previous analysis by retreating to the 102,500 level. The price trend extension opened up after breaking below the 104,000 level, which is the lower line of the rising minor trend channel. At the time of writing, the price continues to test the 103,300 resistance level.
Technical indicators began to weaken, with the Wave Trend (WT) indicator reaching the middle band of the parallel channel, in line with the sell signal it gave in the overbought zone. The Squeeze Momentum (SM) indicator’s histogram reached maximum weakness in the positive zone. The Kaufman moving average (KAMA) is currently at $104,800, positioned just above the price.
According to liquidation data, the sell-off level formed at $107,400 with the recent rise has been liquidated. In a broader time frame, the 112,000 level appears to be the point where accumulation is maintained. In contrast, while the 104,000 band was liquidated in the buy level, it resulted in fragmented liquidation in the 102,000–104,000 range. With the latest decline, trading clusters formed at the 101,000–102,000 level. In a broader time frame, the buying level maintains its accumulation at the 98,000 level.
In summary, the Senate agreement on the US government reopening stood out as an optimistic development. While uncertainty about the Fed’s interest rate cuts persists, Trump’s statements on tariff revenues sparked renewed debate. In liquidity data, the dominance of the selling level was one of the main factors pushing the price up. Technically, the price continues to move within a minor upward channel extension for now, but the loss of the 105,000 reference level creates a bearish picture. The price’s potential to regain the 105,000 area with a new catalyst will continue to be monitored as a top priority. On the other hand, 101,800 emerges as another support level in the event of potential selling pressure.
Supports: 101,800 – 100,000 – 98,000
Resistances: 103,300 – 105,000 – 106,600
ETH/USDT
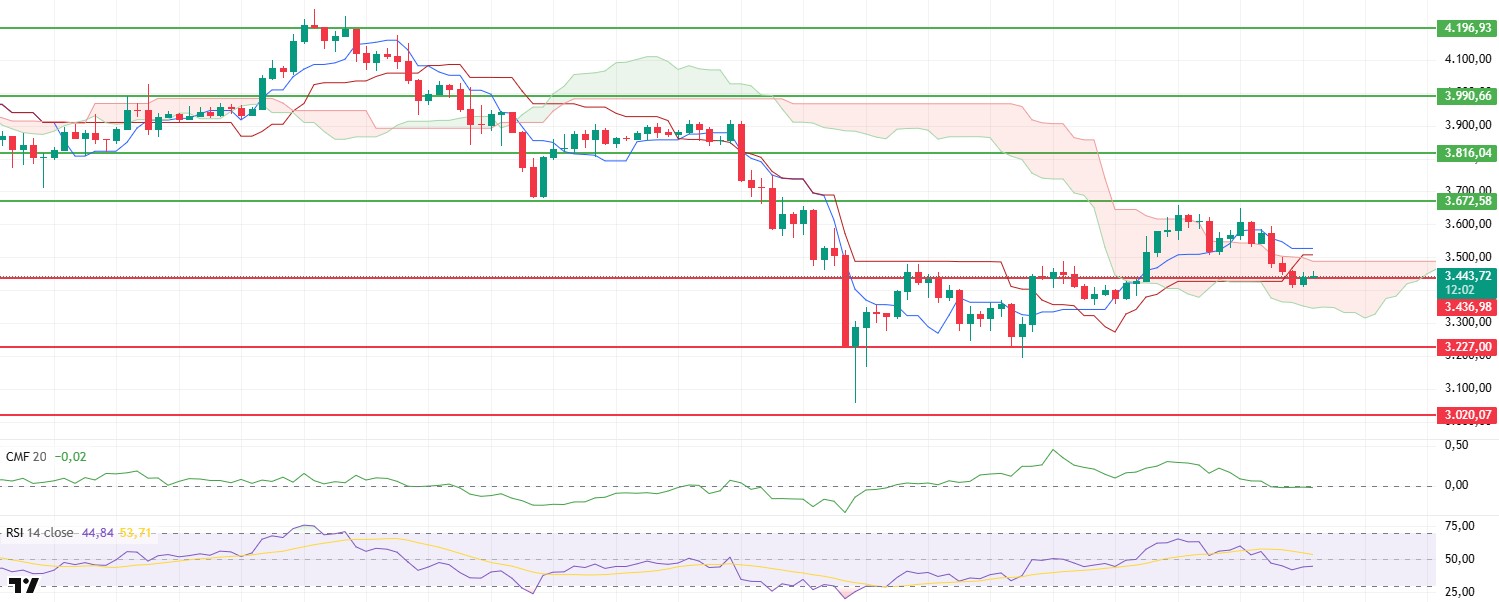
The Ethereum price fell below the 3,436-dollar support level yesterday evening, breaking through the upper band of the cloud due to selling pressure. This morning, the price rose to the 3,450 dollar level with buying activity from this area. This weak recovery in the daily outlook indicates that buyers are seeking to reestablish equilibrium, but selling pressure has not yet subsided.
The Chaikin Money Flow (CMF) indicator’s decline into negative territory indicates a significant increase in liquidity outflows from the market. This weakening of capital flows is limiting the price’s upward reactions. This CMF pattern signals that buyers have not yet gained the strength to support the market in the short term.
The Relative Strength Index (RSI) falling below both the base MA and the 50 level indicates that momentum loss has become clear and selling pressure has become dominant. This weakening in the RSI signals that the short-term correction movement is not yet complete.
The price falling below the upper band of the Kumo cloud and breaching the Tenkan and Kijun levels reinforces the short-term negative outlook. This technical breakdown in the Ichimoku indicator supports the possibility of the trend moving downward in the short term.
Given the weak structure of the indicators, if the $3,436 support level is lost, the decline could accelerate and continue down to the lower band of the cloud at $3,318. However, if the $3,436 support level is maintained and liquidity inflows are observed again in the CMF, the market may enter a new recovery phase, with the price expected to show a rebound towards the $3,540 level.
Below the Form
Supports: 3,436 – 3,227 – 3,020
Resistances: 3,672 – 3,816 – 3,990
XRP/USDT
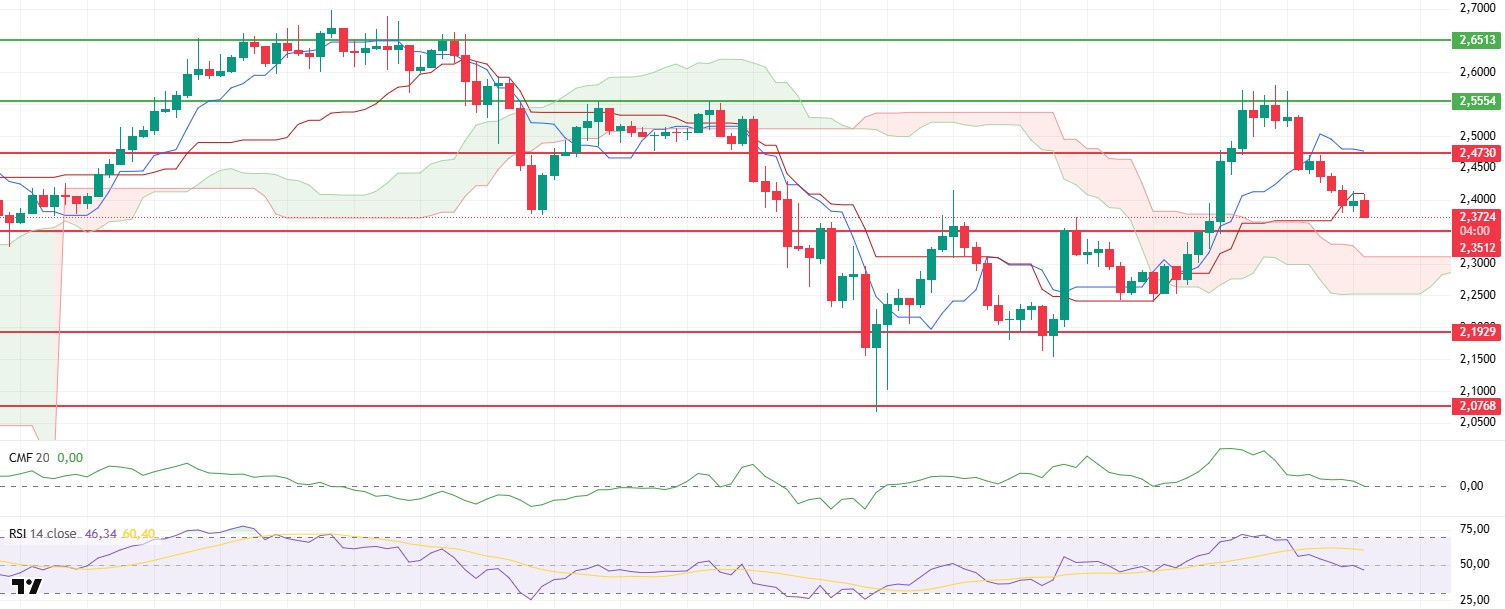
The XRP price fell to $2.38, losing the $2.47 level due to the impact of selling pressure that lasted throughout the day yesterday. Daily price movements indicate that buyers remain weak and that selling pressure continues to dominate in the short term. In particular, the failure to regain the $2.47 level reveals that the market is unable to find sufficient support for rebound rallies.
The downward trend in the Chaikin Money Flow (CMF) indicator continues, indicating that liquidity outflows from the market are ongoing. The CMF remaining in negative territory signals a decline in buyer influence and weak capital flows. This structure limits the likelihood of a price recovery in the short term.
The Relative Strength Index (RSI) falling below the 50 level signals a significant loss of momentum. This negative structure in the RSI supports the view that the market has not yet entered a bottoming process and that selling pressure continues.
According to the Ichimoku indicator, the price first losing the Tenkan level and then the Kijun level reinforces the short-term negative outlook. However, the fact that the upper band of the kumo cloud is still intact indicates that the overall trend has not completely lost its positive structure in the medium term. This stands out as a factor supporting the possibility of declines remaining limited.
As a result, the XRP price may retreat to the $2.35 level in the short term. A breach of this support could lead to deeper sell-offs. On the other hand, if the price rises above the $2.47 level again, the current negative outlook may weaken, and a new upward trend could begin.
Supports: 2.3512 – 2.1929 – 2.0768
Resistances: 2.4730 – 2.5554 – 2.6513
SOL/USDT
Bitwise’s Solana Staking ETF now offers options trading and provides derivatives to institutional investors just two weeks after the fund’s launch. Grayscale has launched options trading for the Solana Trust ETF (GSOL) with 0% commission and a 7% stake reward.
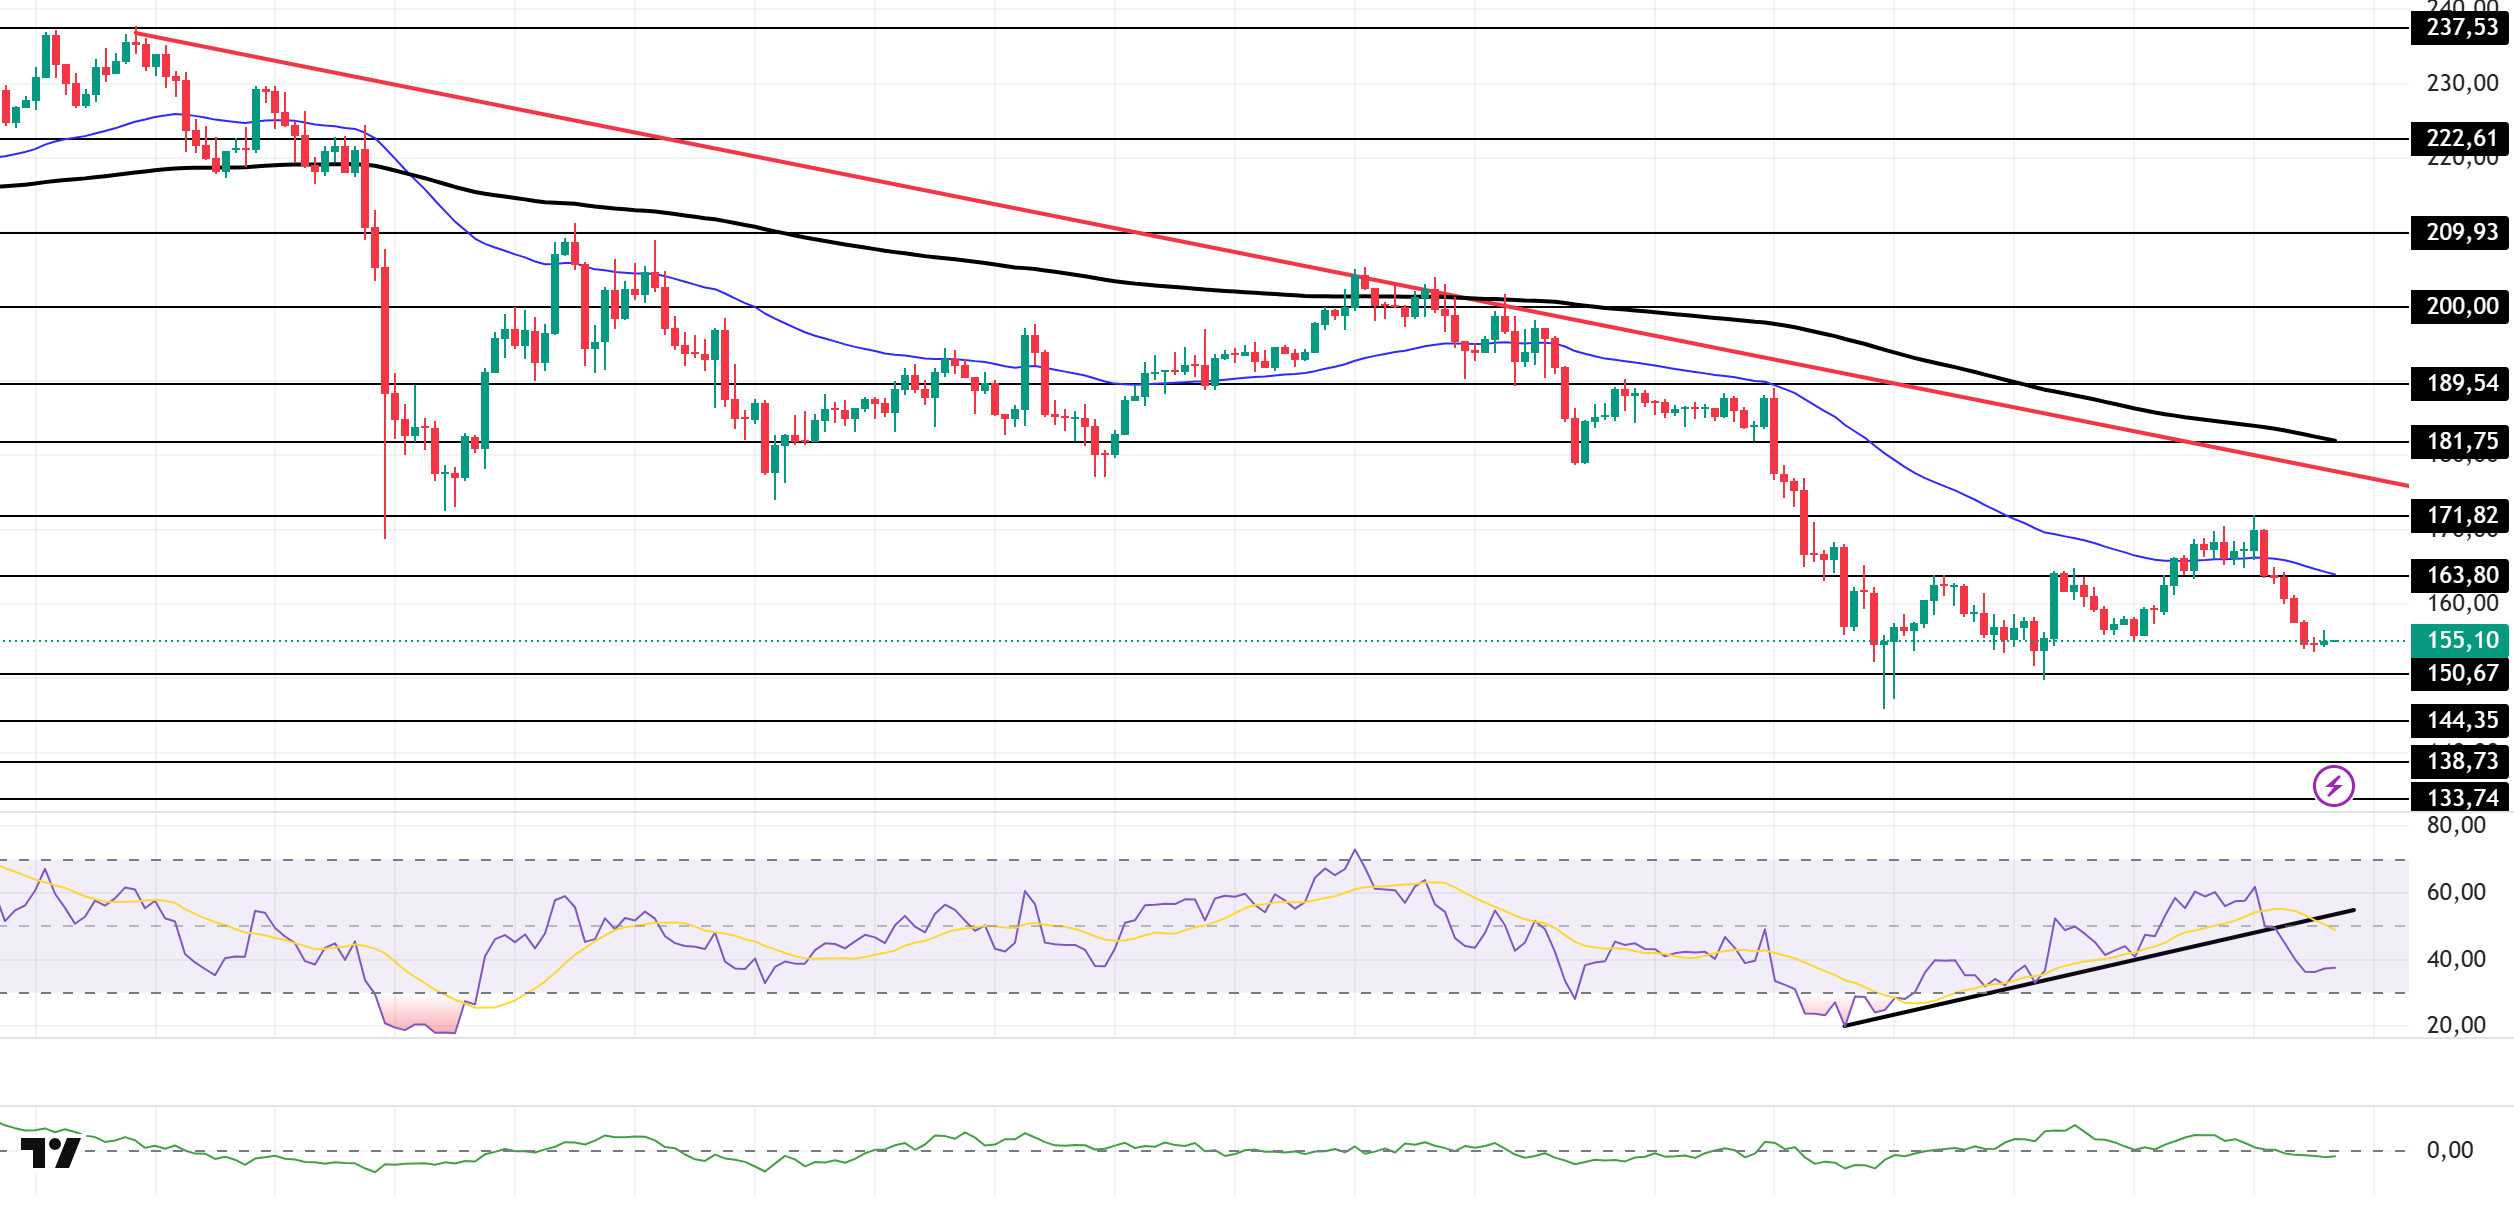
The SOL price experienced a decline. The asset remained in the lower region of the downward trend that began on October 6. The price deepened its decline by breaking below the 50 EMA (Blue Line) moving average. Currently preparing to test the strong support level at $150.67, the price could test the $138.73 level if it closes below this level. If an uptrend begins, it could test the 50 EMA moving average as resistance.
The price remained below the 50 EMA (Exponential Moving Average – Blue Line) and 200 EMA (Black Line) on the 4-hour chart. This indicates a potential downtrend in the medium term. Additionally, the price being below both moving averages suggests a downward trend in the short term. The Chaikin Money Flow (CMF-20) is at a neutral level. However, the decrease in money inflows could push the CMF into negative territory. The Relative Strength Index (RSI-14) has fallen to the middle of the negative zone. At the same time, it broke below the upward trend that began on November 4, signaling increased selling pressure. If there is an uptrend due to macroeconomic data or positive news related to the Solana ecosystem, the $171.82 level stands out as a strong resistance point. If this level is broken upwards, the uptrend is expected to continue. If there are pullbacks due to developments in the opposite direction or profit-taking, the $138.73 level may be tested. A decline to these support levels could increase buying momentum, presenting a potential opportunity for an upward move.
Supports: 150.67 – 144.35 – 138.73
Resistances: 163.80 – 171.82 – 181.75
DOGE/USDT
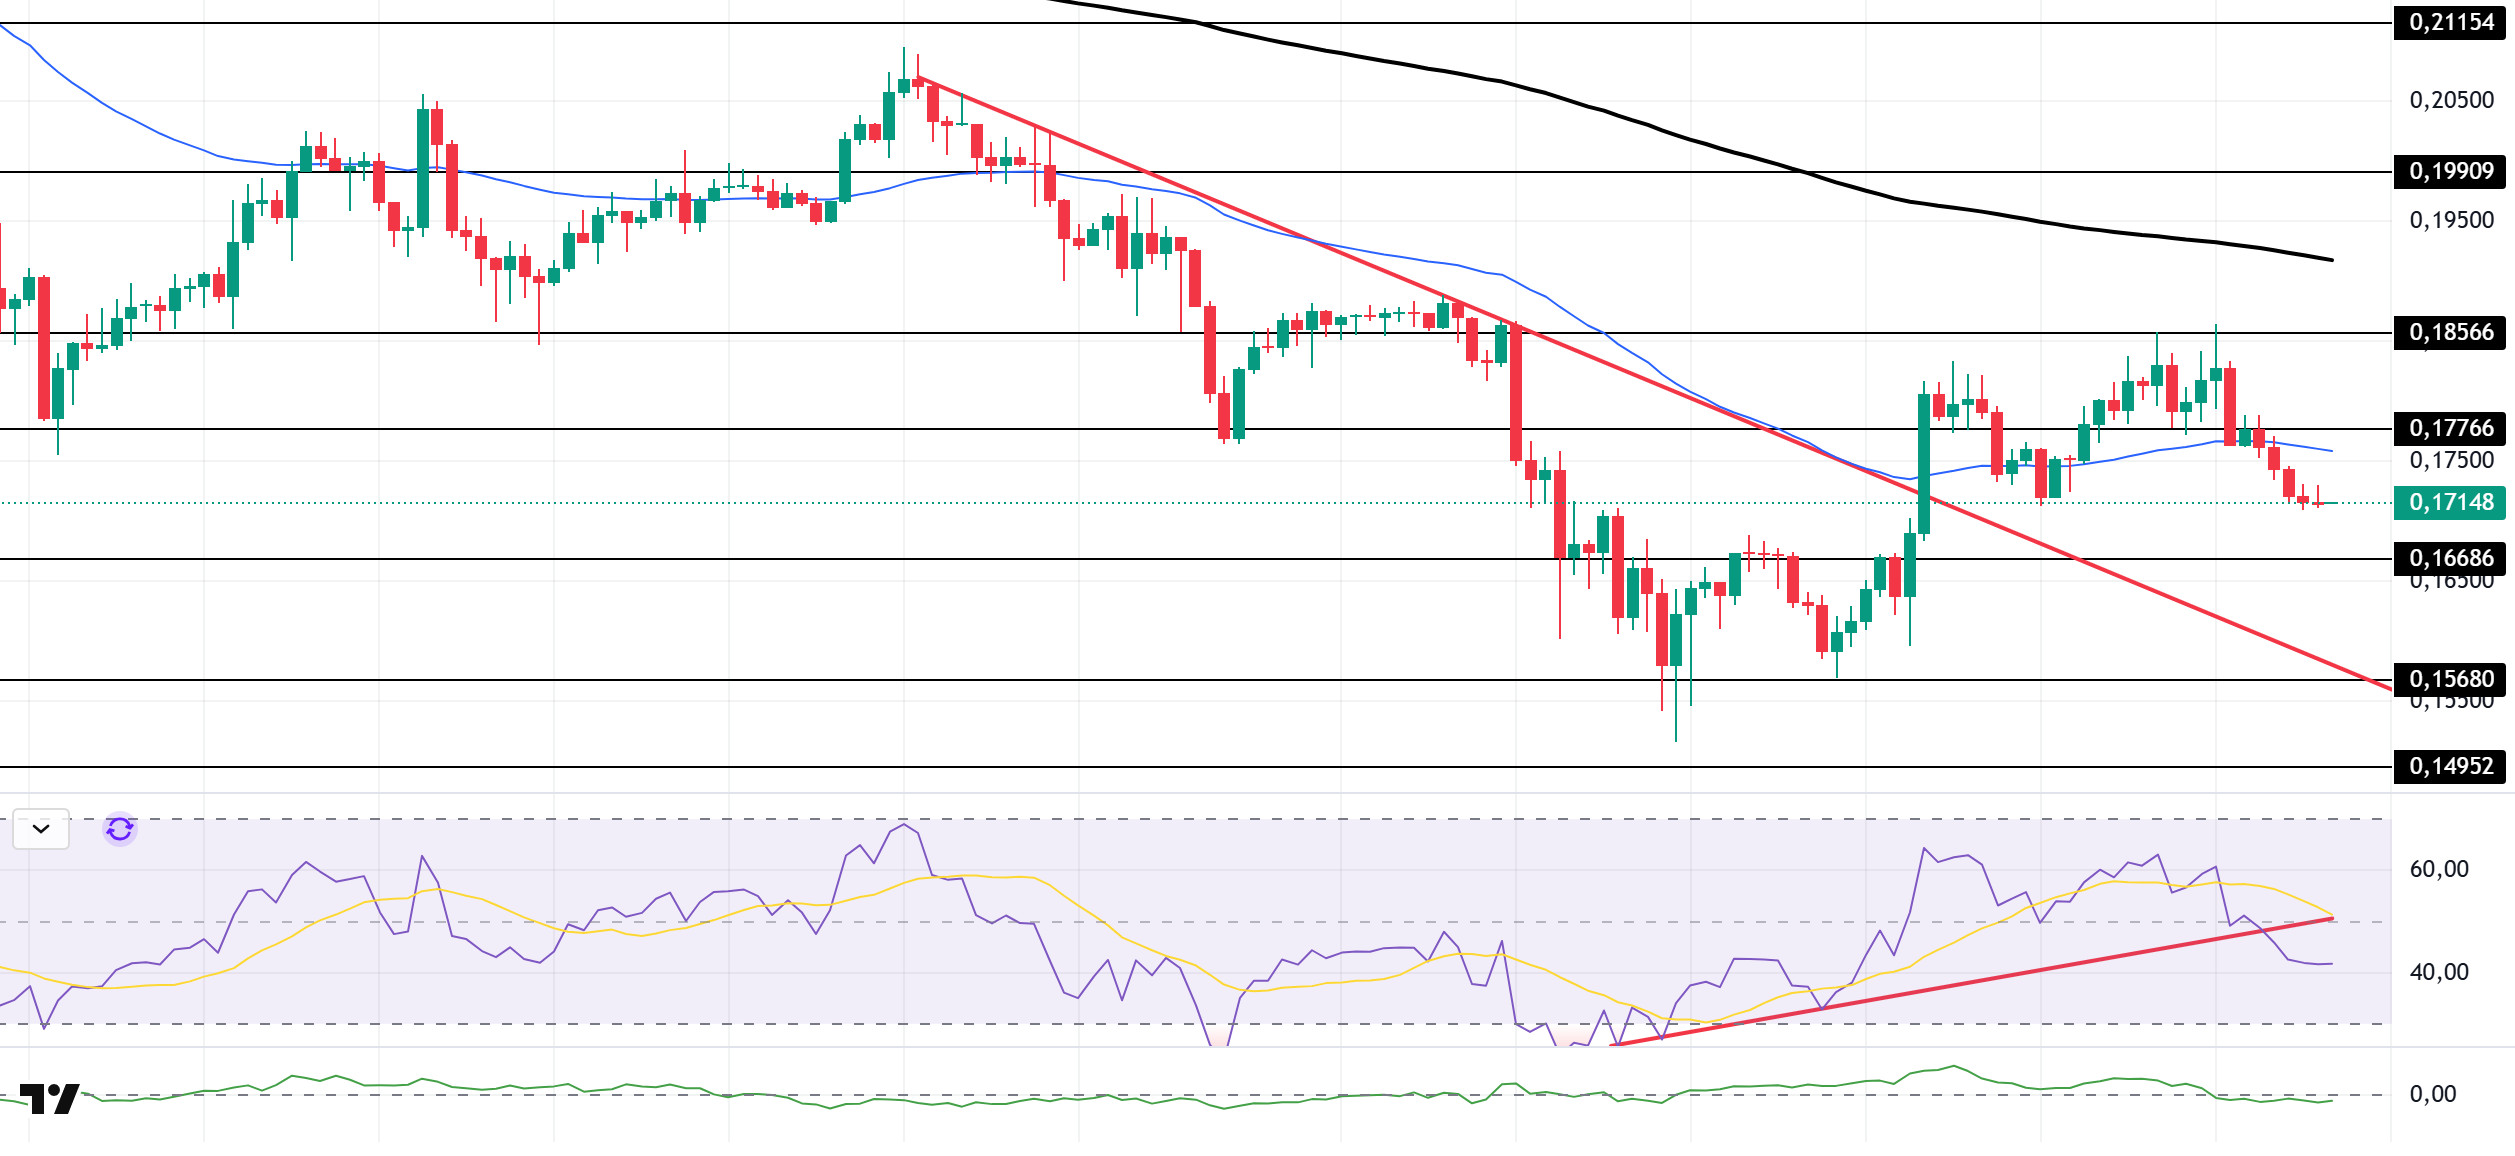
The DOGE price experienced a decline. The asset remained in the upper region of the downtrend that began on October 27. Testing the 50 EMA (Blue Line) moving average as support, the price broke below this level, deepening its decline. It is currently preparing to test the $0.16686 level. If it closes below this level, it could test the downward trend. If the upward movement begins, it could test the 200 EMA (Black Line) moving average as resistance.
On the 4-hour chart, the 50 EMA (Exponential Moving Average – Blue Line) remained below the 200 EMA (Black Line). This indicates that a downtrend may begin in the medium term. The price being below both moving averages indicates a downward trend in the short term. The Chaikin Money Flow (CMF-20) has started to move into the negative zone near the neutral zone. Additionally, a decrease in cash inflows could push the CMF deeper into negative territory. The Relative Strength Index (RSI-14) is near the middle of the negative zone. It also broke below the upward trend that began on November 3, signaling increased selling pressure. In the event of potential increases driven by political developments, macroeconomic data, or positive news flow within the DOGE ecosystem, the $0.18566 level stands out as a strong resistance zone. Conversely, in the event of negative news flow, the $0.15680 level could be triggered. A decline to these levels could increase momentum and initiate a new wave of growth.
Supports: 0.16686 – 0.15680 – 0.14952
Resistances: 0.17766 – 0.18566 – 0.19909
LTC/USDT
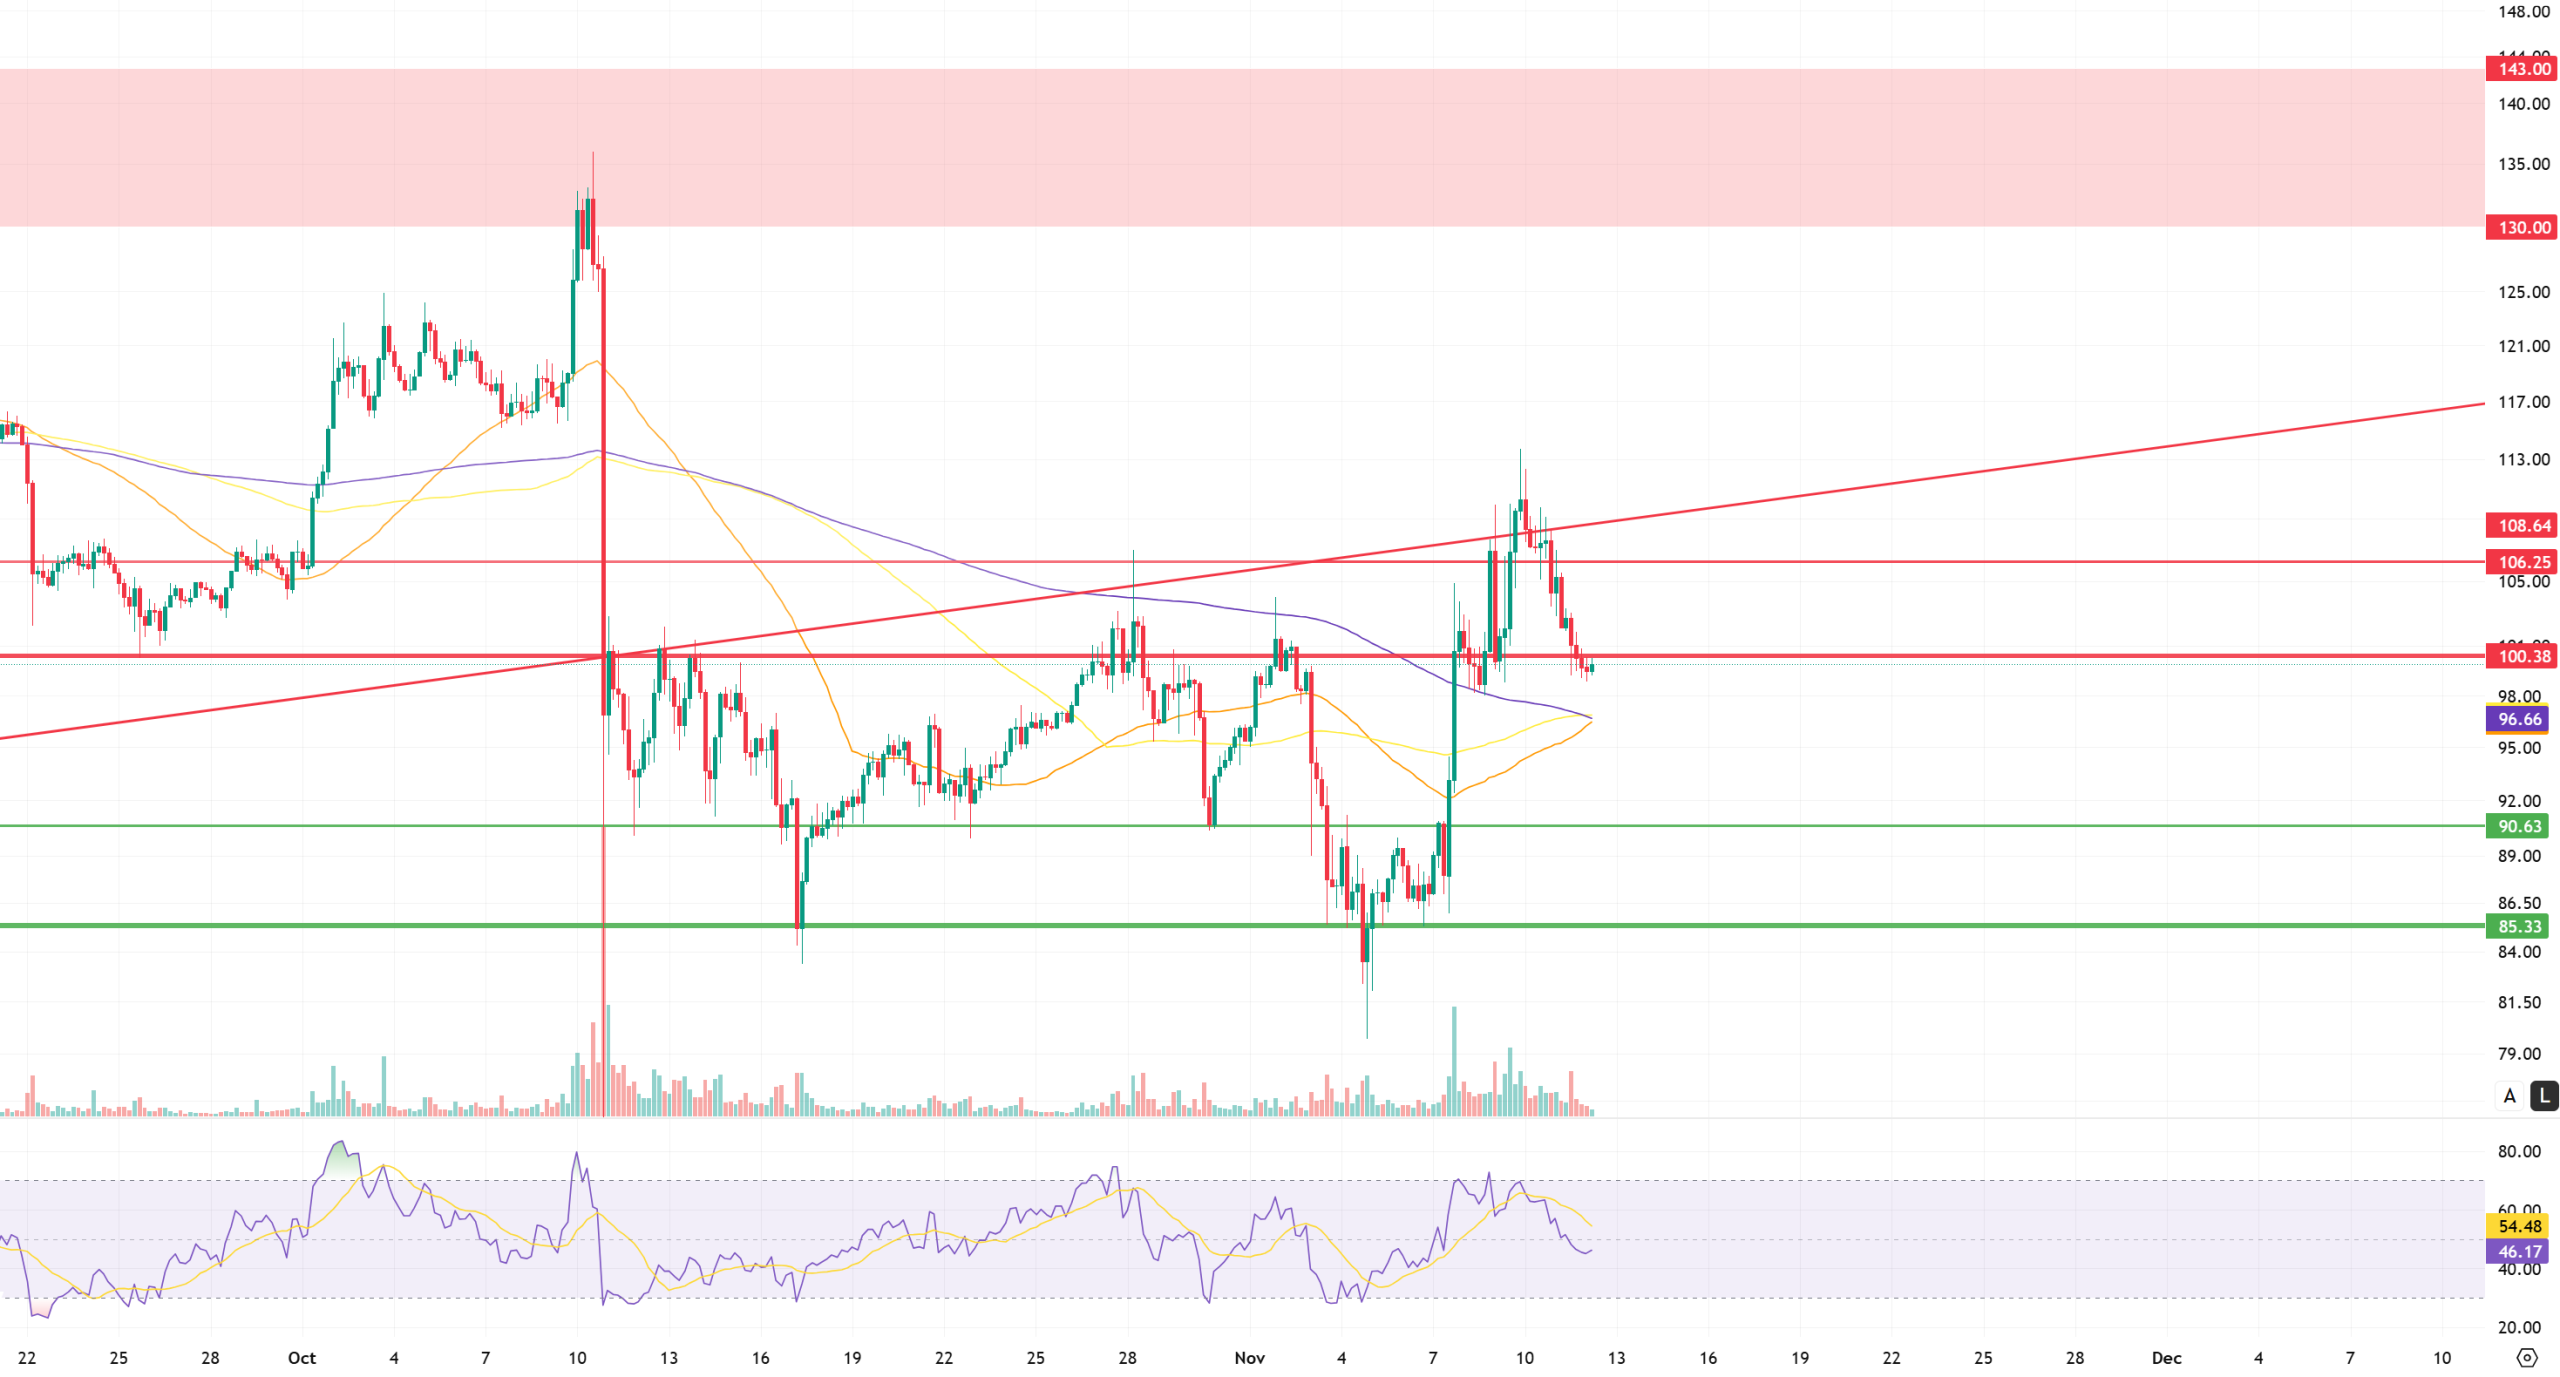
The price movements in the Litecoin (LTC) / USDT pair closed the previous day with a 4.38% loss in value. During the same period, LTC’s 1.53% loss compared to Bitcoin shows that Litecoin’s value decreased even more than Bitcoin’s movement. On the futures side, the long/short position ratio opened in the last 24 hours being at 0.9635 reveals that derivative market participants’ expectations for a decline are slightly heavier. However, funding rates have turned positive.
From a technical perspective, examining Litecoin’s 4-hour USDT pair chart reveals that its price action continues above all moving averages but below the rising trend. Considering the prevalence of short positions in the derivatives market, this suggests that yesterday’s anticipated downward movement has materialized and this expectation persists, albeit to a lesser extent. However, upward movements remain a possibility. If this possibility materializes, the first point where the upward movement could be suppressed is one of the old support levels at 100.38, followed by 106. 25 level, which is the last significant level that will create horizontal selling pressure. Finally, the upward movement may be halted at the lower band of the rising trend at 108.64, but potential rejections from the resistance point located in the middle (at the 106.25 level) seem more likely under current conditions.
If the decline occurs in line with expectations, the 200-100-50 period moving averages (Purple-Yellow-Orange) located close to the intersection on the chart may support price retention, but if a single level must be mentioned, the middle 200-period average can be considered as support at 96.66. Closes below the moving averages would pull the price towards the next support level at 90.63. At this point, selling pressure may decrease, but if it does not, the possibility of a move towards the recent intraday horizontal support at 85.33 should not be overlooked.
Supports: 96.66 – 90.63 – 85.33
Resistances: 100.39 – 106.25 – 108.64
BNB/USDT
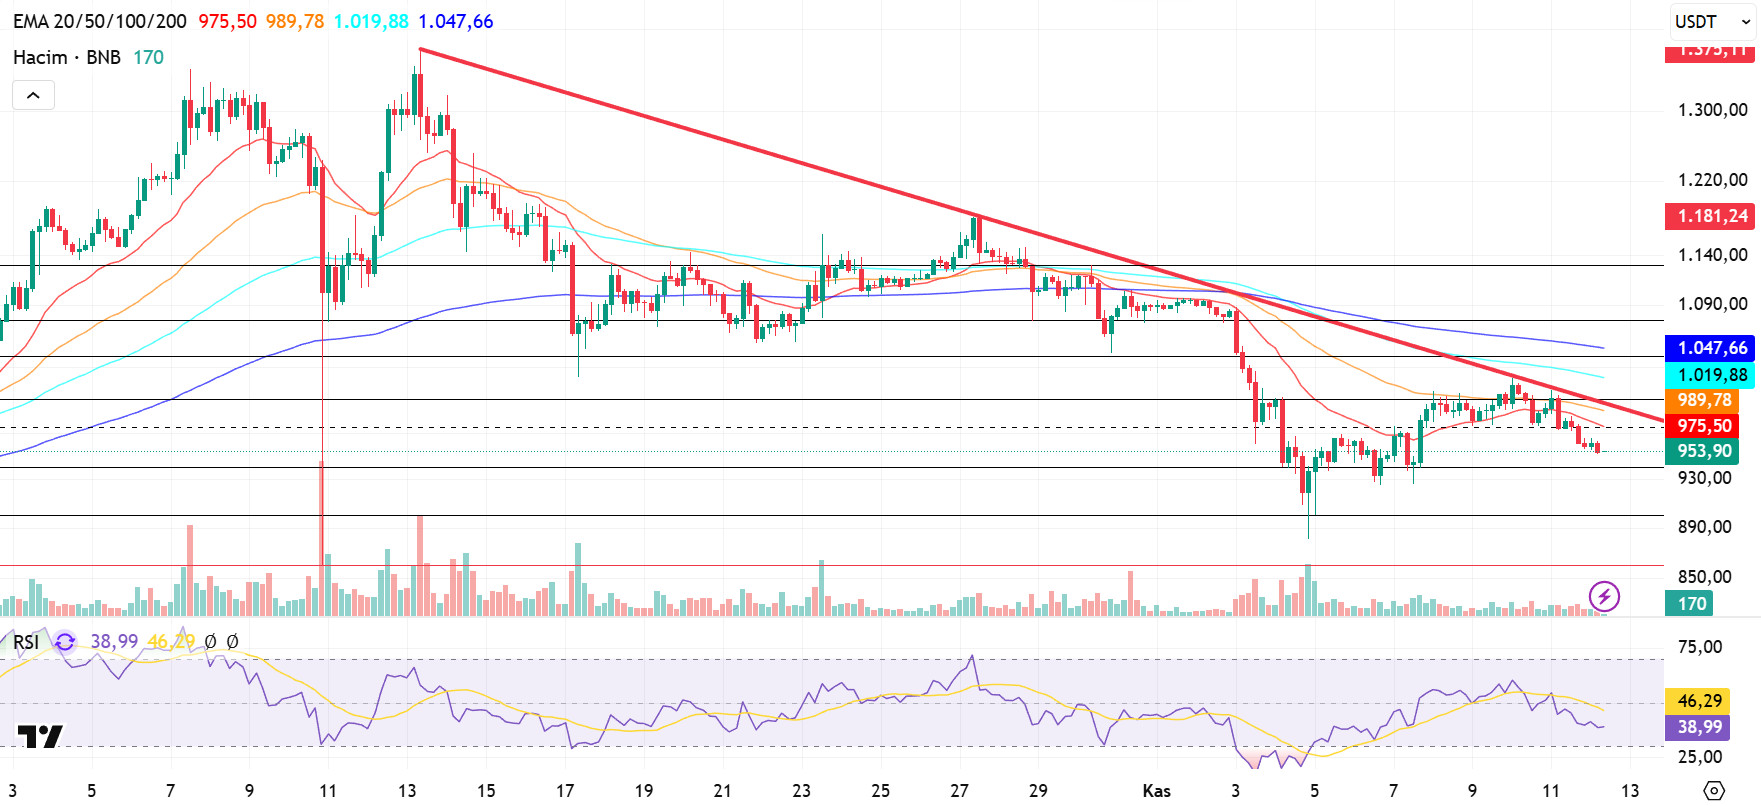
From a technical perspective, the correction that began after the all-time high (ATH) resulted in a pullback to the $900 support zone identified in previous technical analyses. After seeking support above these levels for a while, the asset ended its downward momentum with the new candles that formed and turned its direction upward again. With this rise, the price showed positive acceleration up to the falling trend zone.
Currently, the BNB/USDT pair is showing a positive outlook, but it has encountered resistance below the downtrend line and is searching for direction.
Technical indicators for BNB, currently trading in the $940–1,000 range, suggest that the positive trading volume observed in recent rallies has supported the upward momentum. However, this volume has been insufficient to break the downtrend. Furthermore, the Relative Strength Index (RSI) indicator, despite rising above the 50 level due to recent buying, has reversed direction downward again due to the weakness of positive momentum.
Based on the current technical picture, if selling pressure increases, the price is expected to test the $940 support level. If this level is broken downward, there is a possibility that the price will retreat to the $900 and $860 support zones, respectively.
On the other hand, if buying appetite is maintained and market momentum recovers, BNB is likely to retest the $1,000 resistance level in the first stage. If this level is broken, the price is expected to rise above the downtrend line. If the downward trend is broken upward and sustainability is achieved at this level, it is technically possible for the price to rise towards the $1,040 and $1,075 levels, respectively.
Supports: 940 – 900 – 860
Resistances: 1,000 – 1,040 – 1,075
ADA/USDT
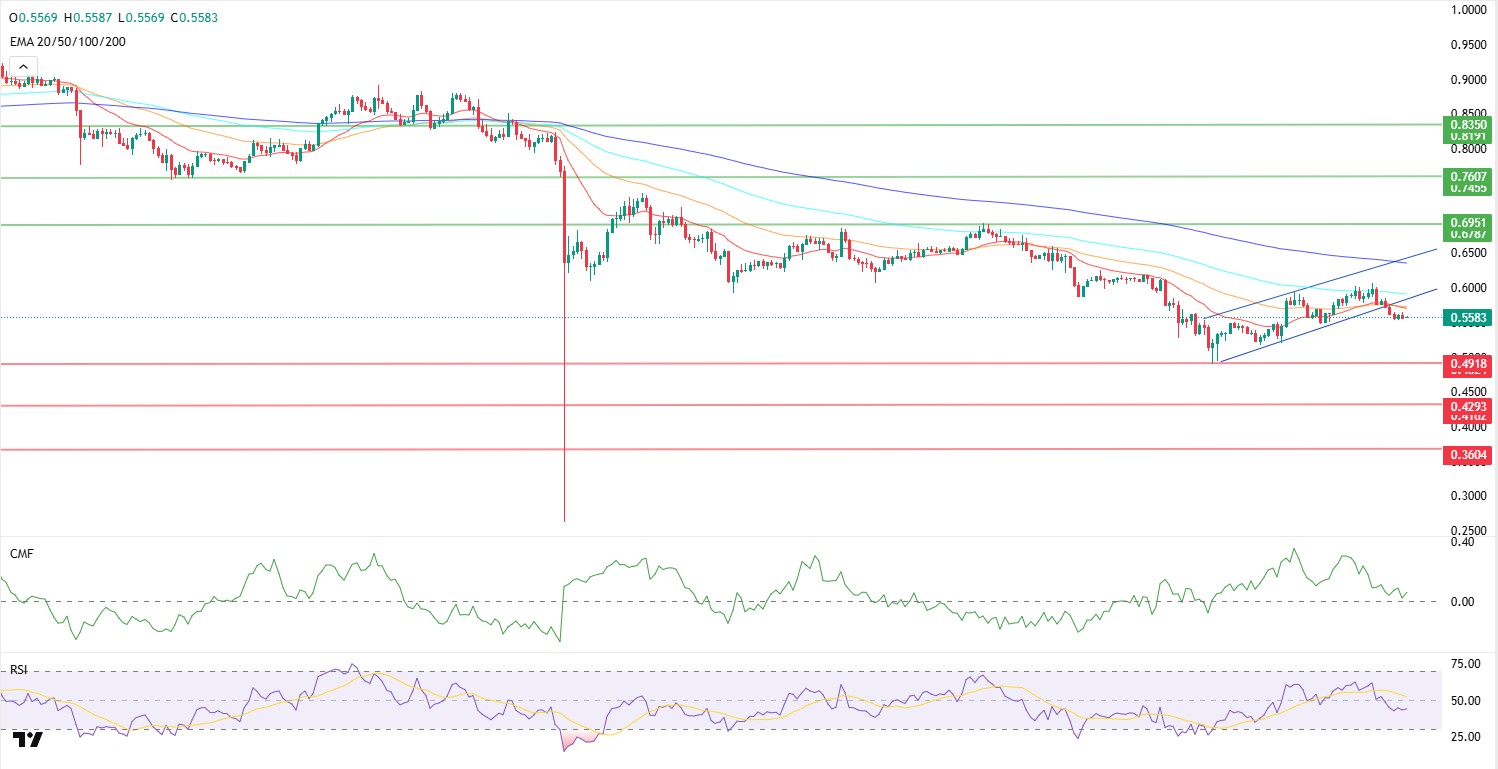
The Cardano Summit begins today. This event includes ecosystem announcements and technical roadmap updates. Members of the ADA community will be attending the Cardano Summit in Berlin today. The Cardano Foundation stated that this two-day event, first announced in June, will feature over 75 speakers exploring the future of the enterprise blockchain. Significant announcements or updates at this event could impact the ADA price. As of today, 362.58 ADA is waiting to be liquidated at the $0.5563 level.
Technically speaking, ADA has risen by nearly 3% in 24 hours until Wednesday and is trading at $0.5578 as of today. The ADA price fell below the $0.5668 level, breaking out of the rising channel trend in the first half of the day. The Relative Strength Index (RSI-14) fell to 44 levels, hovering close to the sell zone, while the Chaikin Money Flow (CMF-20) is not giving sufficient positive signals for purchases. This correlation may indicate a limited increase in cash inflows and may keep the CMF in negative territory. Should the price approach the peak of the uptrend at $0.6414 during the day, the first resistance level we will monitor is $0.6951. This could signal a continuation of the uptrend in the short term. In the event of a decline due to the release of negative macroeconomic data or news related to the Cardano ecosystem, the bottom point of the upward trend at $0.4918 could emerge as our first support point. A break below this level could lead to a continuation of the decline.
Supports: 0.3604 – 0.4293 – 0.4918
Resistances: 0.6414 – 0.6951 – 0.7607
Legal Notice
The investment information, comments, and recommendations contained herein do not constitute investment advice. Investment advisory services are provided individually by authorized institutions taking into account the risk and return preferences of individuals. The comments and recommendations contained herein are of a general nature. These recommendations may not be suitable for your financial situation and risk and return preferences. Therefore, making an investment decision based solely on the information contained herein may not produce results in line with your expectations.