Technical Analysis
BTC/USDT
U.S. jobless claims came in below expectations at 216K, while durable goods orders rose 0.5% in September, in line with forecasts. On the regulatory front, the US Senate is preparing to pass the crypto market structure bill through committees in December for a final vote in early 2026, while the SEC Investor Advisory Committee kept the digital assets and financial innovation agenda alive on December 4 by discussing the impact of tokenization and artificial intelligence disclosures on market structure and investor protection.
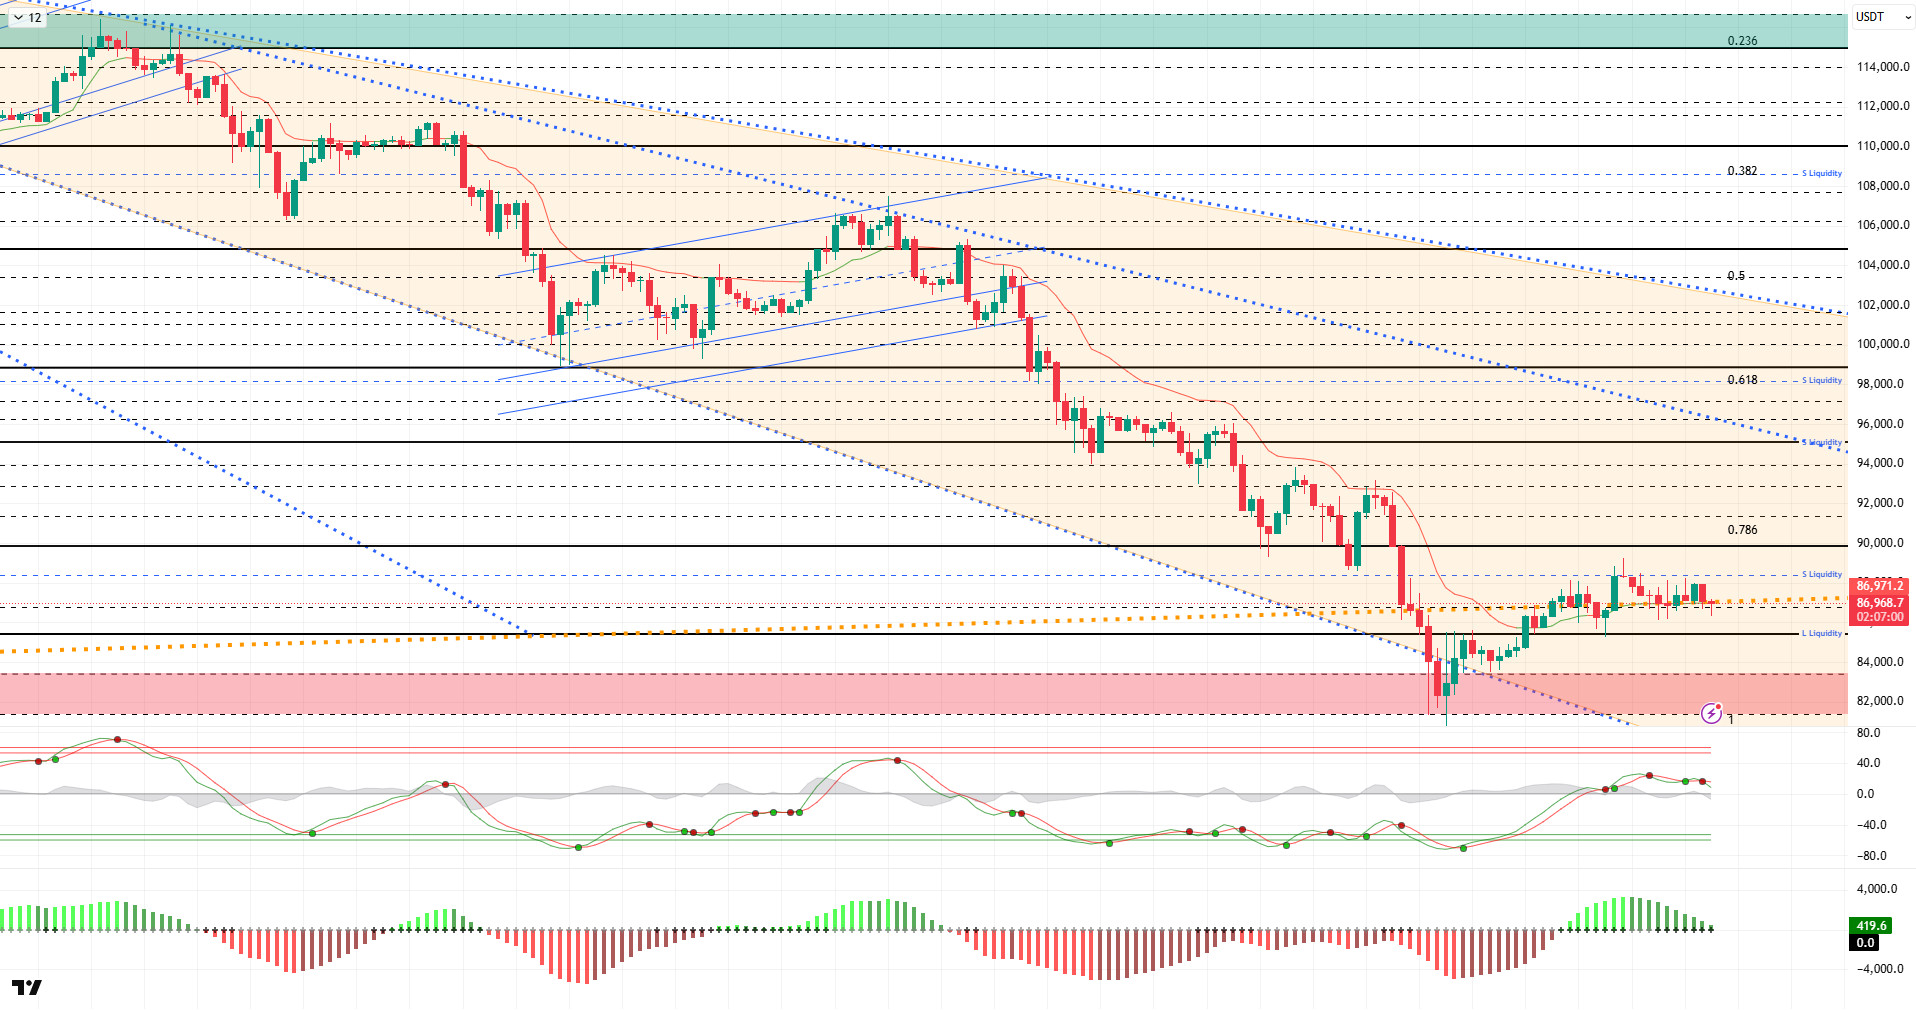
From a technical perspective, the price occasionally dips below the major trend line but generally manages to stay above it. After the rebound, BTC, which has been trading sideways above the 87,000 level, is looking to regain momentum. At the time of writing, BTC is trading around the 87,000 level. If rebound buying continues, it could maintain its upward channel and reduce the possibility of a double bottom forming at the 80,000 level for now.
Technical indicators show the Wave Trend (WT) oscillator giving an indecisive buy/sell signal above the channel midband this time, before switching back to a sell signal once again. The histogram on the Squeeze Momentum (SM) indicator is weakening after gaining momentum within the positive zone.The Kaufman Moving Average (KAMA) is currently at $86,900, positioned below the price.
According to liquidation data, investors are repositioning themselves on the buy side with the latest rise, with 85,000 emerging as the short-term congestion level. The partial short-term sell-off level has accumulated again at this point following the liquidation at the 89,000 level.
In summary, following the rise in BTC driven by expectations of interest rate cuts, positive developments on the Russia-Ukraine front reduced selling pressure, supporting the price by pushing it into a consolidation phase. Technically, the price is attempting to form an upward channel with upward momentum, recovering from the 80,500 bottom region. Liquidity data indicates that target zones are regaining importance and that the market is entering a partial stabilization process. For the rally to gain a solid footing in the coming period, closes above the 87,000 level, where the major uptrend line passes, will be critical. Should demand increase again and potential catalysts come into play, the 90,000 level could be monitored as the main reference zone. Conversely, if selling pressure intensifies, the 85,000 level will emerge as the new reference and liquidity zone.
Supports: 86,700 – 85,000 – 83,300
Resistances: 88,300 – 90,000 – 91,500
ETH/USDT
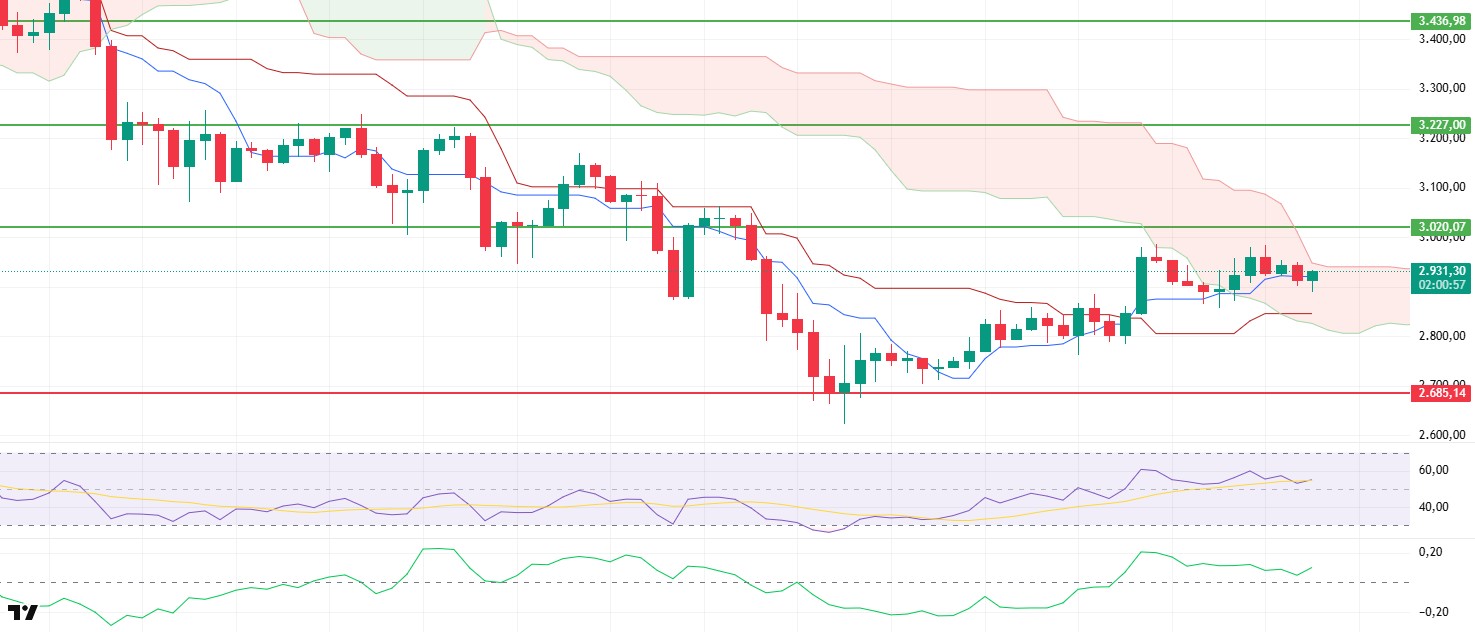
After retreating to the $2,880 support zone during the day, the Ethereum price rebounded from this level and settled back above $2,930. It is currently continuing its sideways movement within a narrow range. The fact that selling pressure was met around $2,880 indicates that the market is continuing to stabilize in the short term.
The Chaikin Money Flow (CMF) indicator reacted slightly and moved up a bit compared to the morning hours. Although liquidity outflows have slowed down, there has not been a strong capital inflow yet. The CMF’s attempt to recover slightly in this way shows that buyers have not completely withdrawn from the field but are still cautious. While the weak structure in CVD data persists on the spot side, a clearer strengthening in liquidity is needed for the uptrend to gain traction.
The Relative Strength Index (RSI) indicator continues to move sideways above the 50 level. Momentum remaining in positive territory indicates that buyers are still present in the market but have not been able to establish a decisive advantage. If the RSI breaks upward in this region, short-term new upward attempts may be seen; otherwise, a continued volatile and directionless movement pattern is expected.
The price managing to stay above the Tenkan level in the Ichimoku indicator shows that the short-term positive structure is maintained. On the other hand, the price still being stuck within the kumo cloud reminds us that the trend reversal process is not complete. Unless there is a strong close above the cloud, there is a risk that the increases will remain more tentative in nature.
Looking at the overall picture, if the $2,880 level holds, the price has the potential to test the $2,980 level and then the $3,020 level. However, if there are potential sell-offs in the resistance zone, it would not be surprising for the price to retest the $2,880 support level. Losing this support could accelerate the downward movement and lead to more severe pullbacks.
Supports: 2,880 – 2,685 – 2,550
Resistances: 3,020 – 3,227 – 3,436
XRP/USDT
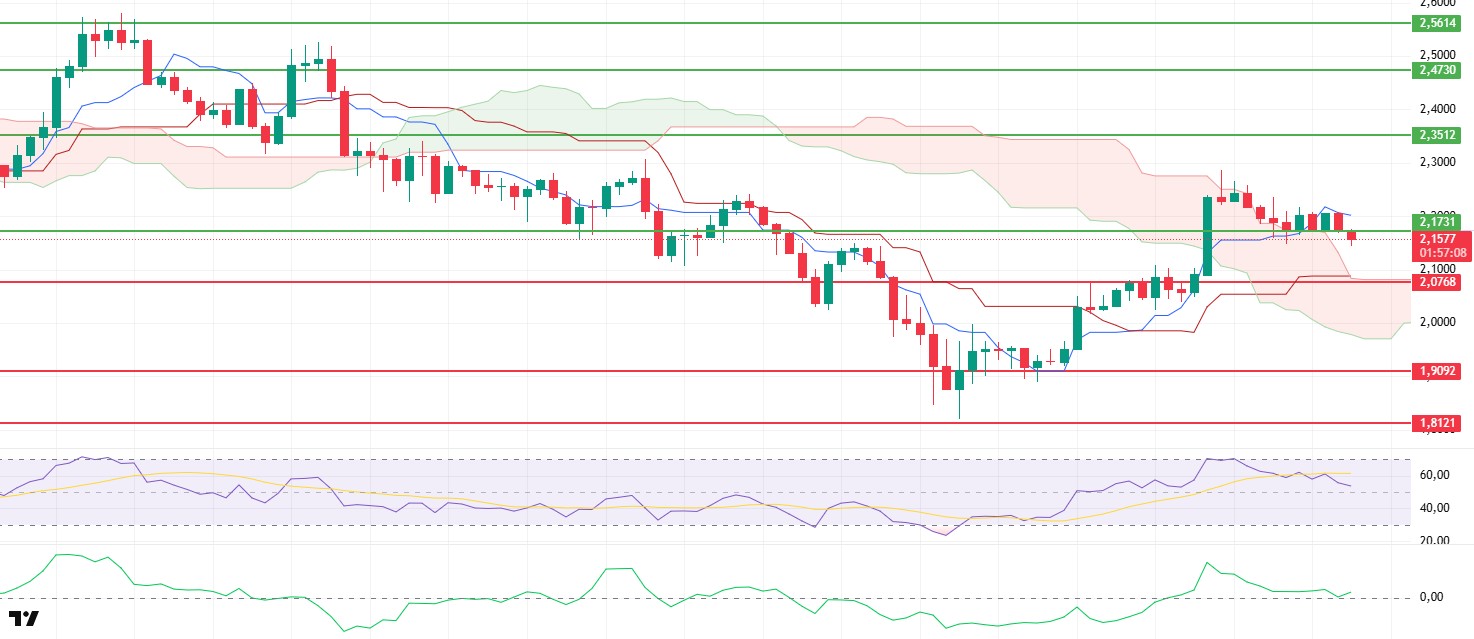
The XRP price dipped below the $2.17 intermediate support level during the day, falling to the $2.14 region. This decline indicated that buyers had weakened in the short term and that the price was still searching for direction. However, the rebound seen at the $2.14 level suggests that selling pressure has eased somewhat.
The Chaikin Money Flow (CMF) indicator retreated to the zero line before finding support there and starting to move slightly upward. The resumption of liquidity inflows, albeit limited, indicates that buyers have not completely withdrawn from the market. However, the fact that the CMF is not in strong positive territory suggests that upward movements may struggle at resistance levels.
The Relative Strength Index (RSI) indicator continues its downward trend. This weakness in momentum confirms that the price is losing strength in its upward movement. The RSI returning above the 50 level would be an important signal for a short-term recovery.
The loss of the Tenkan level in the Ichimoku indicator stands out as a short-term negative signal. However, the price remaining above the kumo cloud indicates that the overall positive structure has not yet been broken and that the trend reversal in the market continues. As long as it remains above the cloud, medium-term optimism can be maintained.
The $2.17 level continues to be critically important for the evening hours. If this level is regained, the price may rebound and move towards the $2.21 and $2.24 resistance levels. However, if the price remains below the $2.17 level, downward pressure may continue, and a new pullback towards the $2.14 and $2.11 levels may come into play.
Supports: 2.0768 – 1.9092 – 1.8121
Resistances: 2.1731 – 2.3512 – 2.4730
SOL/USDT
Franklin Templeton has submitted its spot Solana ETF 8-A form to the U.S. Securities and Exchange Commission.
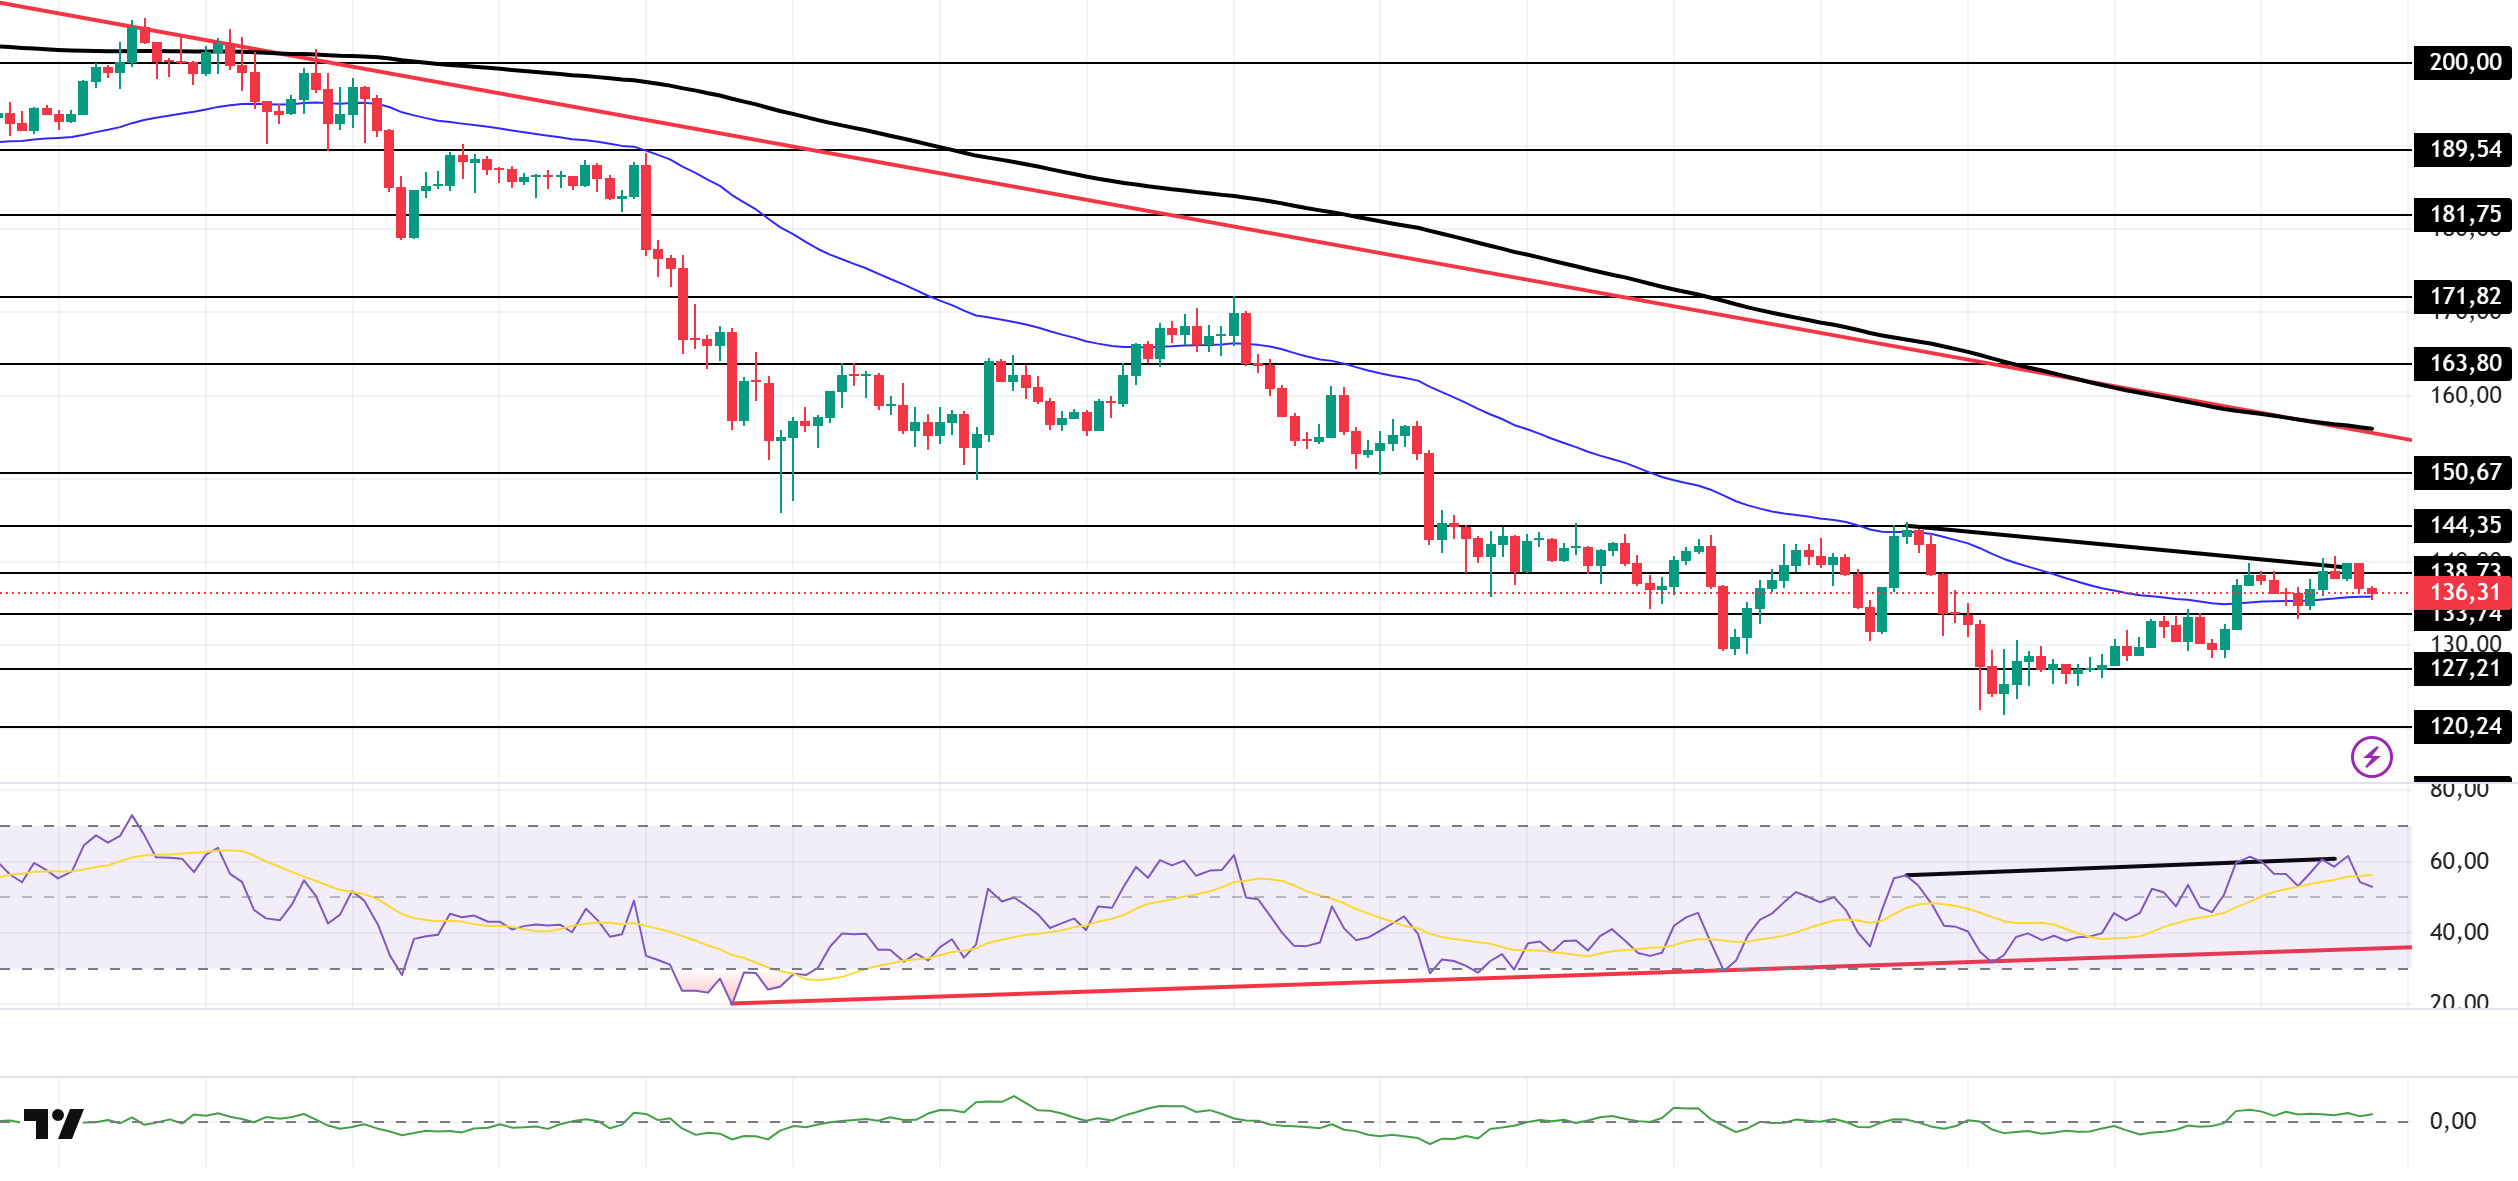
SOL experienced a slight pullback during the day. The asset remained in the lower region of the downtrend that began on October 6. Breaking above the strong resistance level of $133.74 and the 50 EMA (Blue Line) moving average with a strong candle, the asset is currently testing the 50 EMA moving average as support after experiencing a pullback. If the uptrend continues, it could test the $150.67 level. If the pullback deepens, it could test the $127.21 level as support.
On the 4-hour chart, it continues to remain below the 50 EMA (Exponential Moving Average – Blue Line) and 200 EMA (Black Line). This indicates that it may be in a downtrend in the medium term. At the same time, the price being between the two moving averages shows us that the asset is in a decision phase in the short term. The Chaikin Money Flow (CMF-20) remained in positive territory. However, an increase in money outflows could push the CMF into negative territory. The Relative Strength Index (RSI-14) fell back to neutral levels. However, it remained above the upward trend that began on November 4. On the other hand, there is a negative divergence. This indicates that selling pressure may occur. If there is an uptrend due to macroeconomic data or positive news related to the Solana ecosystem, the $150.67 level stands out as a strong resistance point. If this level is broken upwards, the uptrend is expected to continue. If there are pullbacks due to developments in the opposite direction or profit-taking, the $120.24 level could be tested. If the price falls to these support levels, an increase in buying momentum could present a potential upside opportunity.
Supports: 133.74 – 127.21 – 120.24
Resistances: 138.73 – 144.35 – 150.67
DOGE/USDT
Bitwise is launching its Dogecoin ETF (BWOW) on the New York Stock Exchange.
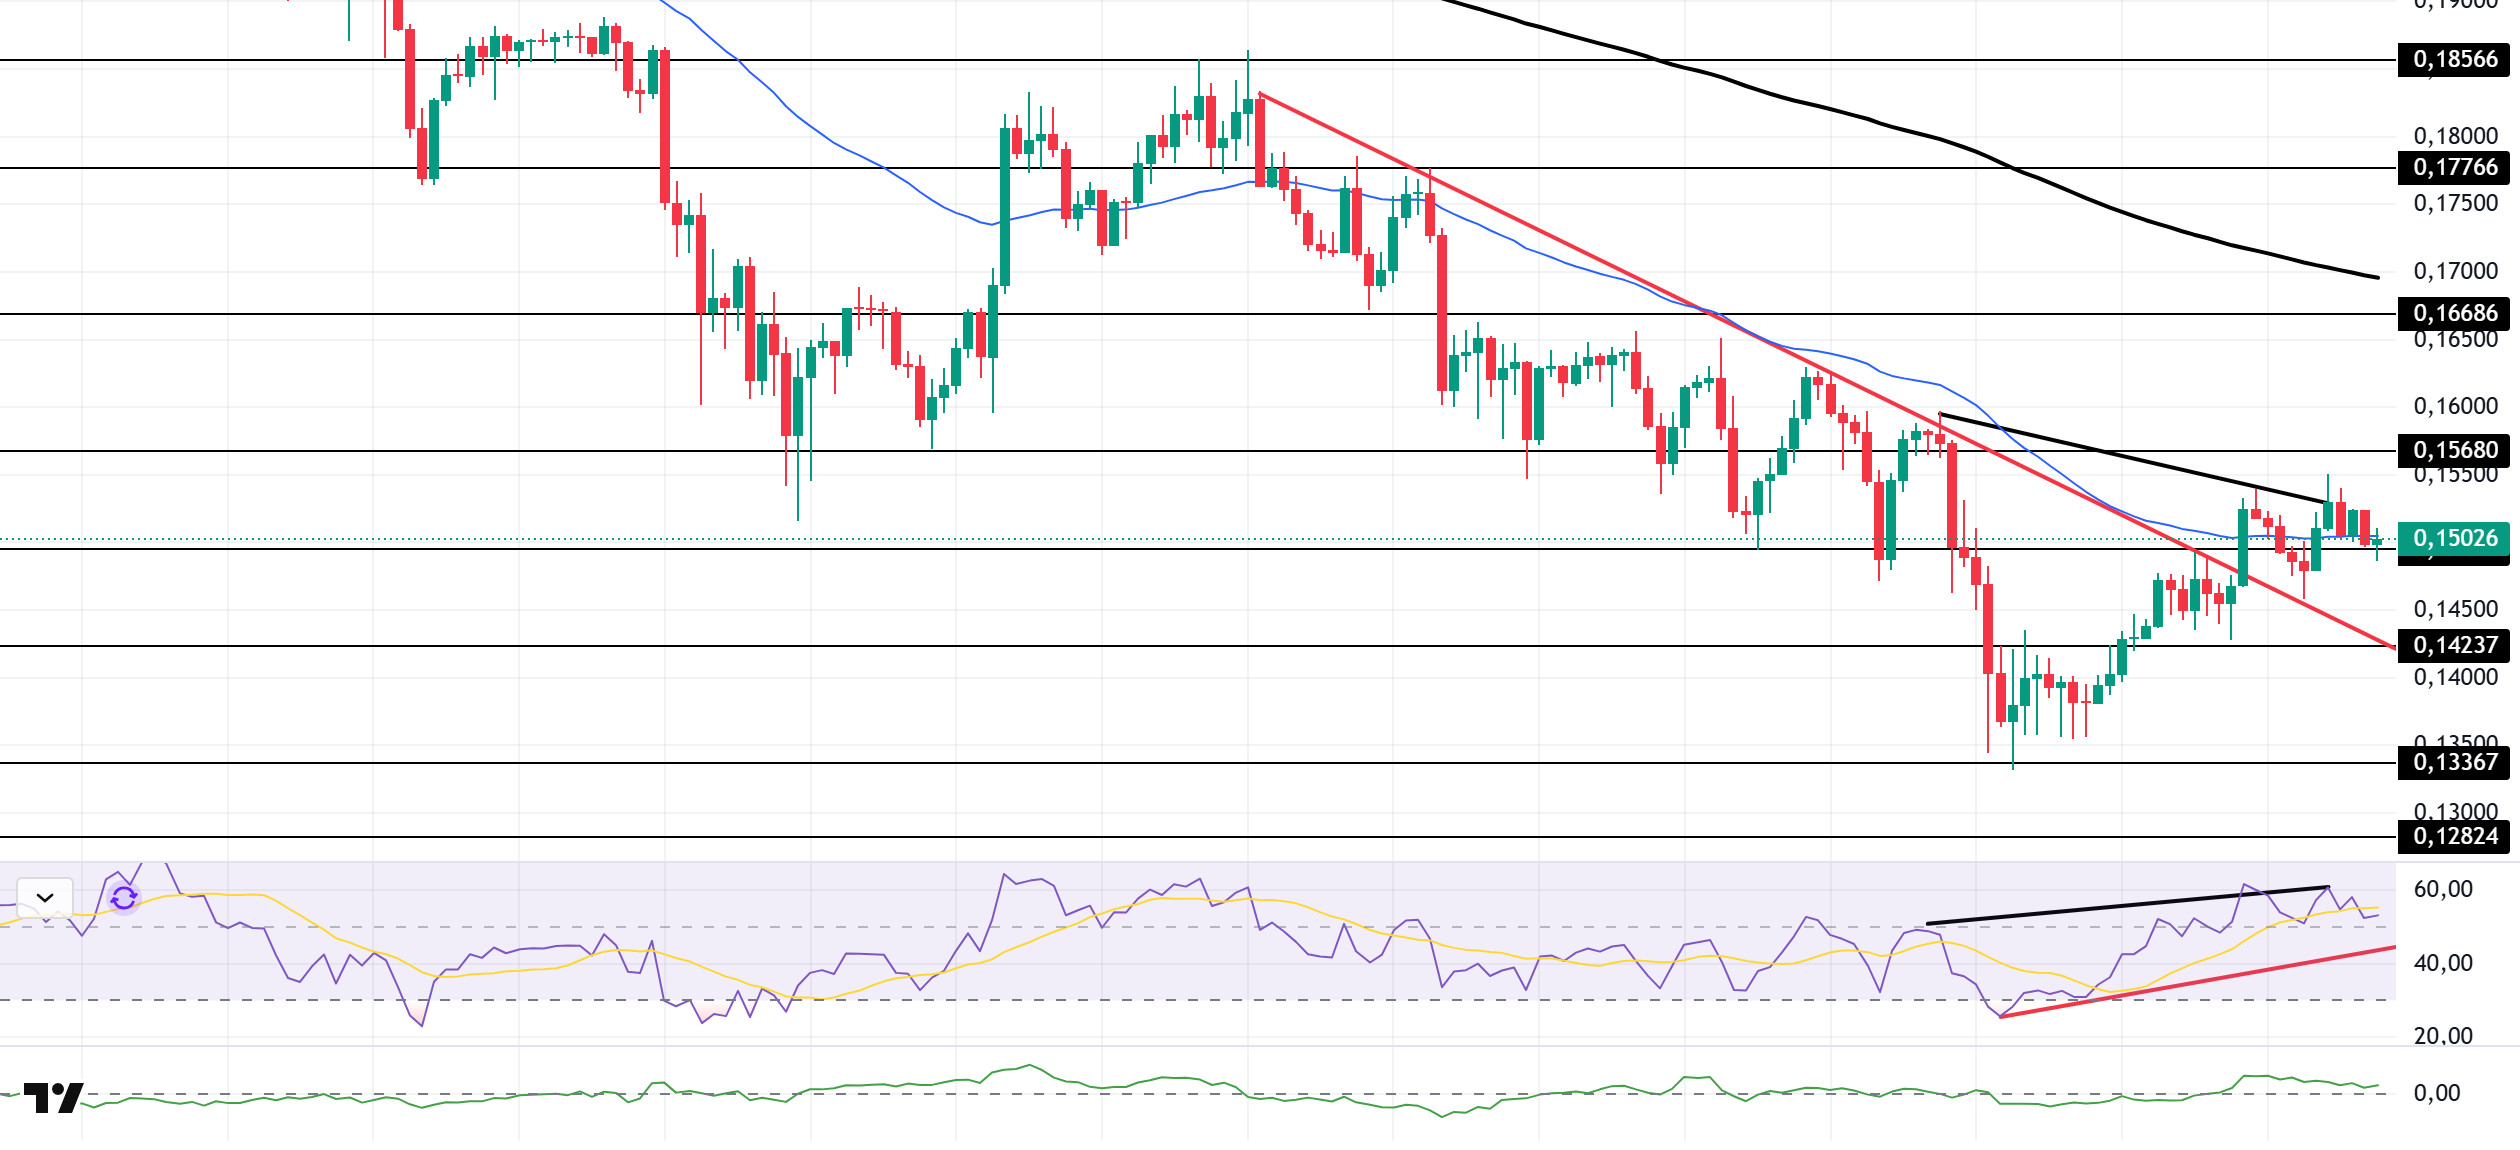
The DOGE price traded sideways during the day. The asset remained in the upper region of the downtrend that began on November 11. The price, which continues to stay above the $0.14952 level, is currently testing the 50 EMA (Blue Line) moving average as resistance. If it fails to break above the 50 EMA moving average, it may test the downward trend line as support. If it experiences an uptrend, it may test the 200 EMA (Black Line) moving average as resistance.
On the 4-hour chart, the 50 EMA (Exponential Moving Average – Blue Line) remained below the 200 EMA (Black Line). This indicates that a downtrend may begin in the medium term. The price being below both moving averages indicates a downward trend in the short term. On the other hand, the large difference between the two moving averages increases the potential for the asset to move sideways or upward. The Chaikin Money Flow (CMF-20) remained in positive territory. Additionally, a decrease in cash inflows could push the CMF into negative territory. The Relative Strength Index (RSI-14) remained in positive territory. It also continued to trade in the upper region of the upward trend that began on November 21. This increased buying pressure. However, negative divergence should be monitored. In the event of an uptrend driven by political developments, macroeconomic data, or positive news flow in the DOGE ecosystem, the $0.16686 level stands out as a strong resistance zone. Conversely, in the event of negative news flow, the $0.13367 level could be triggered. A decline to these levels could increase momentum and initiate a new wave of growth.
Supports: 0.14952 – 0.14237 – 0.13367
Resistances: 0.15680 – 0.16686 – 0.17766
SHIB/USDT
The most notable development in the Shiba Inu ecosystem in recent days has been the decrease in SHIB balances on exchanges. According to CryptoQuant data, reserves on centralized exchanges have declined by hundreds of billions of tokens in a few days, indicating an outflow of approximately 600 billion; this suggests that a significant portion has been moved to cold wallets or private wallets for long-term storage. This picture suggests that selling pressure has eased somewhat in the short term and that some investors have shifted back to accumulation. On the other hand, it is important to note that these outflows alone should not be considered a strong signal of recovery, as overall market risk appetite remains weak and aggressive spot demand has not yet kicked in. In other words, while the decline in exchange reserves for Shiba Inu may indicate a potential medium-term accumulation process, for the ecosystem as a whole to experience a sustained strengthening, both these outflows must continue and market participants’ appetite must clearly recover.
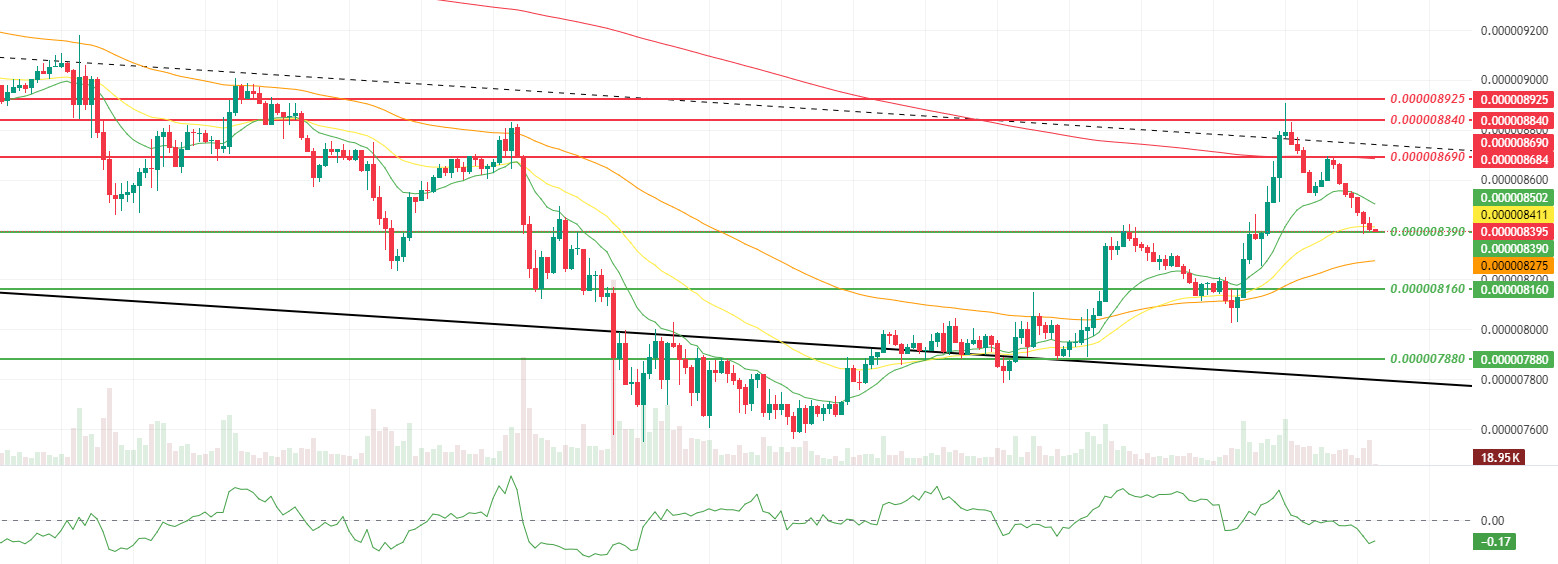
Looking at the technical picture, the dynamic reaction structure highlighted in the previous analysis now appears to be entering a distinct slowdown phase. The observed declines in momentum, volume, and volatility compared to the previous report suggest that the reaction movement has lost momentum and buyers have shifted to a more cautious, rather than aggressive, position. The Chaikin Money Flow (CMF) indicator’s retreat back into negative territory signals that the capital inflows accompanying the latest upward attempt have returned to a weakening phase, revealing that structural liquidity support has been significantly eroded in the short term.
Although the positive crossover created by the 9-period and 21-period Smoothed Moving Averages (SMMA) crossing above the 50-period SMMA some time ago in favor of the short-term trend remains valid, the price pulling back after reaching the 200-period SMMA indicates that the reaction structure is beginning to struggle at the critical resistance threshold. Within this pullback, the reaction from the first support level at $0.000008390 reveals that the short-term bullish defense has not completely collapsed. If the price manages to stay above the support band passing through $0.000008390 and $0.000008160, the resistances passing through $0.000008690, $0.000008840, and $0.000008925 will continue to be the main target zone in the short term. Conversely, if the price falls below the support level of $0.000008160 and retreats towards the level of $0.000007880 ( ), the recent upward attempt around the SMMA 200 will be reinterpreted as a limited respite within the medium-term main downtrend. On the other hand, if the price manages to settle above the SMMA 200 period again in the coming period and the CMF indicator supports it with a structure expanding from the negative zone to the neutral and positive zone, the possibility of a more structured and gradual recovery within the falling channel will regain strength. (SMMA9: Green Line, SMMA21: Yellow Line, SMMA50: Orange Line, SMMA 200: Red Line)
Supports: 0.000008390 – 0.000008160 – 0.000007880
Resistances: 0.000008690 – 0.000008840 – 0.000008925
LEGAL NOTICE
The investment information, comments, and recommendations contained herein do not constitute investment advice. Investment advisory services are provided individually by authorized institutions taking into account the risk and return preferences of individuals. The comments and recommendations contained herein are of a general nature. These recommendations may not be suitable for your financial situation and risk and return preferences. Therefore, making an investment decision based solely on the information contained herein may not produce results in line with your expectations.