Technical Analysis
BTC/USDT
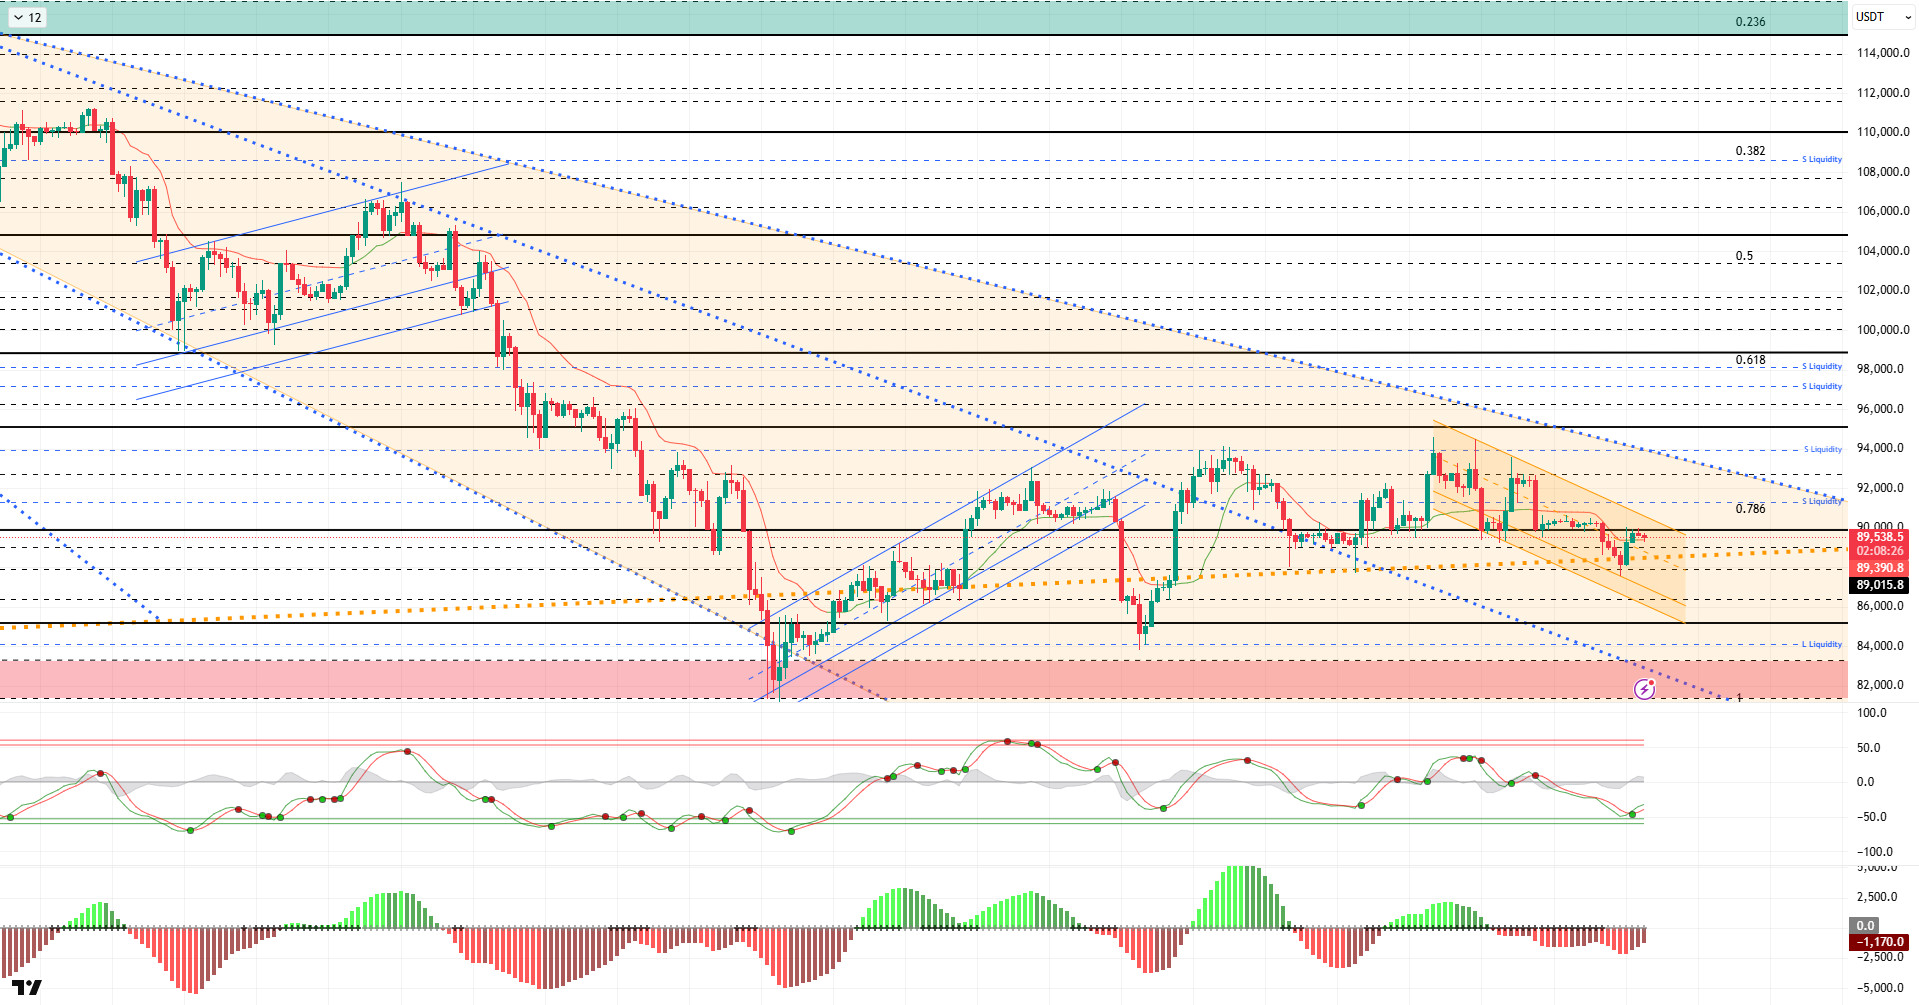
While strong fund inflows into crypto investment products continued, large-scale companies such as Strategy continuing to increase their Bitcoin reserves provided an up-to-date picture of the trend in institutional demand. On the other hand, the judicial process regarding customs duties in the US and the Bank of Japan’s plans for ETF assets were developments closely watched in the global financial outlook. With the US macro data set to guide the week, increased volatility in the market is expected.
From a technical perspective, BTC lost its consolidation process in the horizontal band range and re-engaged with the major uptrend, retreating to the 87,600 level. Following the consolidation process, the price is trading at a slightly bearish 89,500 level at the time of writing, following the downward channel it formed.
Technical indicators show that the Wave Trend (WT) oscillator has returned to the oversold zone after the recent decline, generating a buy signal. The histogram on the Squeeze Momentum (SM) indicator is attempting to gain momentum within the negative zone. The Kaufman Moving Average (KAMA) is currently trading below the price at the $89,390 level.
Upon examining the liquidation data, it is observed that all positions accumulated in the short-term buy levels at and below the 89,000 level have been liquidated following the recent pullback. Following this process, the 87,500 level stands out as an area where fragmented purchases have re-entered the market. Short-term sell-side transactions are concentrated mainly at the 91,100 level, while in the upper region, a significant liquidation and position clustering in the 94,500 – 95,800 band is noteworthy. From a monthly perspective, the 97,000–98,000 range stands out as the main resistance zone where the intensity of sell-side positions is maintained.
In summary, statements from Fed members following the Fed meeting revealed differences of opinion on the policy front, while Trump appears to be evaluating the selection process for the new Fed chair. In this context, Hassett’s name stands out, and his statements emphasize the Fed’s independence, preparing markets for possible scenarios. Meanwhile, the BOJ continues to signal its intention to implement the highest interest rate hike in nearly 30 years. Technically, BTC, which retreated to the 80,500 level following the downtrend that formed after the ATH, rebounded strongly from this region. Subsequently, the price settled above the 90,000 level and entered a consolidation phase for a while, then pulled back again to test the major uptrend line and managed to hold on with support from this area. When liquidity data is examined, it is seen that areas with concentrated short-term trading are being targeted, while long-term sell orders have not yet been tested. This structure indicates that the liquidity accumulated in the market could trigger a sharp and directional price movement in the coming period. After this stage, 90,000 has become a critical point again for the price to maintain its momentum. Closings and pricing above this level are an important indicator for regaining momentum. In this context, 95,000 stands out as the next target area, and if it is passed, liquidity areas will be monitored again. In the event of a possible selling pressure, the 88,500 level, which is the point where the major uptrend passed, will be monitored.
Supports: 90,000 – 89,000 – 88,000
Resistances: 91,400 – 92,600 – 94,000
ETH/USDT
The ETH price attempted an upward move during the day, rising to the $3,177 level, which corresponds to the lower band of the cloud, but it lost momentum with the selling pressure from this area and the price fell back to the $3,130 level. Despite the rebound seen in the morning, the failure to maintain stability in the resistance zone indicates that the market is still progressing on weak technical ground.
Liquidity issues persist. The Chaikin Money Flow (CMF) indicator failing to accompany the upward movement and trending toward negative territory indicates that capital inflows into the market remain limited. Low liquidity conditions clearly explain why the price faces rapid selling pressure during upward moves. Breaking through resistance levels appears challenging unless liquidity improves.
Momentum is also showing signs of weakening. The Relative Strength Index (RSI) moved slightly downward with the latest pullback, indicating that buyers are losing momentum. The RSI’s failure to regain strength suggests that upward attempts may be limited in the short term.
The technical structure continues to produce negative signals on the Ichimoku indicator side. The price’s clear rejection from the lower band of the kumo cloud and the loss of the Kijun level indicate that the downward trend may continue. Pricing remaining below the cloud confirms that the medium-term trend is still in favor of sellers.
In the intraday view, the main determining level continues to be the $3,227 region near the lower band of the Kumo cloud. Unless this level is breached, downward pressure is likely to persist. On the downside, the $3,074 level is a critical support position. If this region is lost, it would not be surprising to see sales accelerate and a deeper pullback come into play. Unless there is a clear recovery in liquidity and momentum, the likelihood of a bearish trend continuing for ETH remains higher.
Supports: 3,074 – 3,020 – 2,910
Resistances: 3,227 – 3,368 – 3,478

XRP/USDT
As evening approached, selling pressure intensified on the XRP side. The weak trend continued throughout the day, and the price gradually retreated to the $1.96 level. The downward movement that dominated in the morning hours remained unchanged throughout the day, and the inability of buyers to generate a meaningful response clearly demonstrated that the market maintained its downward trend.
The liquidity flow outlook has weakened further as of this evening. The Chaikin Money Flow (CMF) indicator continues to decline in negative territory, indicating increased capital outflows from the market and a significant decline in risk appetite. The continuation of liquidity outflows explains why attempts at limited recovery during the day have failed to be sustained.
The picture remains unchanged on the momentum front. Although the Relative Strength Index (RSI) produced small reactions at times during the day, it failed to recover its overall structure and maintains its weak appearance. The RSI’s persistence at low levels confirms that sellers have not relinquished control and that the price is struggling to make upward moves.
The technical structure also indicates that pressure persists on the Ichimoku indicator. The price remains below the Kumo cloud, and the Tenkan and Kijun levels have not yet been breached. This outlook reveals that the trend is still clearly downward and that upward attempts are not technically supported.
The key level for a change in direction has not changed in the current pricing structure. Unless the $2.05 level is regained, the downward trend is likely to continue, and the price is likely to face pressure towards the $1.90 region. Conversely, a strong break above $2.05 could break the current weak structure and pave the way for a more meaningful recovery. As of this evening, both the technical and liquidity outlooks indicate that the downward scenario remains dominant.
Supports: 1.9092 – 1.8121 – 1.6224
Resistances: 2.0543 – 2.1731 – 2.2729

SOL/USDT
JPMorgan launched USCP, a Solana-based token, in the Galaxy debt agreement.
The SOL price continued to trade sideways during the day. The asset maintained its price above the downward trend that began on October 6. Currently holding its position, the price is testing the 50 EMA (Blue Line) moving average and the $133.74 level as resistance. If the price closes above this moving average and above the level, it may test the 200 EMA (Black Line) moving average as resistance. In the event of a pullback, it may retest the downward trend as support.
On the 4-hour chart, it continues to remain below the 50 EMA (Exponential Moving Average – Blue Line) and 200 EMA (Black Line). This indicates that it may be in a downtrend in the medium term. At the same time, the price being below both moving averages indicates that the asset is trending downward in the short term. The Chaikin Money Flow (CMF-20) is in negative territory. However, an increase in money outflows could push the CMF deeper into negative territory. The Relative Strength Index (RSI-14) remained at the neutral level in negative territory. It also continued to trade below the downward trend line that began on December 3. This signaled selling pressure. In the event of an uptrend driven by macroeconomic data or positive news related to the Solana ecosystem, the $150.67 level stands out as a strong resistance point. If this level is broken upwards, the uptrend is expected to continue. In the event of pullbacks due to developments in the opposite direction or profit-taking, the $120.24 level could be tested. A decline to these support levels could increase buying momentum, presenting a potential opportunity for an upward move.
Supports: 127.21 – 120.24 – 112.26
Resistances: 133.74 – 138.73 – 144.35

DOGE/USDT
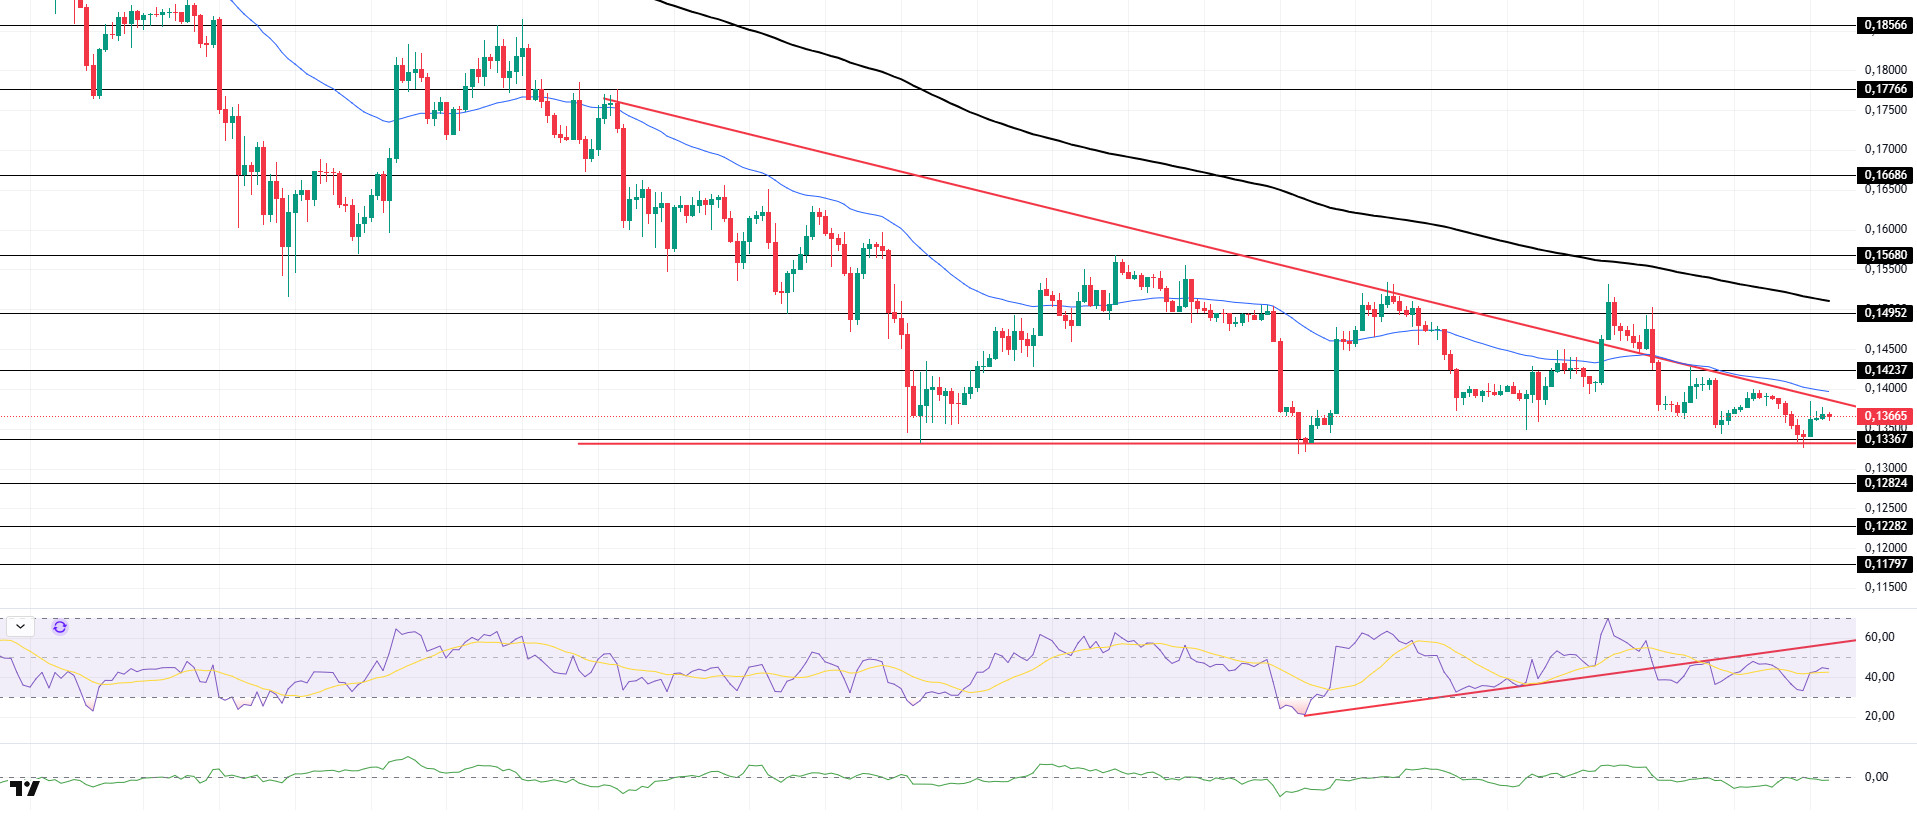
The DOGE price continued its sideways movement during the day. The asset gained slight momentum by finding support at the base level of the descending triangle formation that began on November 13. Currently preparing to test the ceiling level of the descending triangle formation and the 50 EMA (Blue Line) moving average as resistance, the price may test the 200 EMA (Black Line) moving average as resistance if the uptrend continues. If a pullback begins, it may retest the base level of the descending triangle formation.
On the 4-hour chart, the 50 EMA (Exponential Moving Average – Blue Line) remained below the 200 EMA (Black Line). This indicates that the downtrend may continue in the medium term. The price being below both moving averages suggests a downward trend in the short term. The Chaikin Money Flow (CMF-20) has moved from neutral to negative territory. Additionally, the balance of money inflows and outflows may keep the CMF in negative territory. The Relative Strength Index (RSI-14) is in the middle of negative territory. It also remained below the upward trend that began on December 1. If it breaks above this level, buying pressure may increase. In the event of an upward movement driven by political developments, macroeconomic data, or positive news flow in the DOGE ecosystem, the $0.15680 level stands out as a strong resistance zone. Conversely, in the event of negative news flow, the $0.13367 level could be triggered. A decline to these levels could increase momentum and initiate a new wave of upward movement.
Supports: 0.13367 – 0.12824 – 0.12282
Resistances: 0.14237 – 0.14952 – 0.15680
LTC/USDT
The price movements in the Litecoin (LTC) / USDT pair advanced to the 81.06 level with a 2.65% increase in value during the day. At the same time, LTC’s 1.01% increase compared to Bitcoin shows that Litecoin increased its own value independently of Bitcoin, in addition to the movement experienced on the Bitcoin side. In the futures market, the ratio of long/short positions opened in the last 24 hours increased from 0.9209 to 0.9489, revealing that although bearish expectations among derivatives market participants remain dominant, they have decreased compared to the morning. Funding rates are positive.
From a technical perspective, examining Litecoin’s 4-hour USDT pair reveals that the price continues to remain below the 200, 100, and 50-period (purple, yellow, and orange) moving averages. This structure, coupled with the prevalence of short positions in the derivatives market, supports the primary expectation of a downward trend. However, upward reaction movements remain within the realm of possibility. If this scenario materializes, the uptrend is expected to encounter resistance at the 82.00 level first. This level stands out as a critical zone where selling pressure could intensify, given the proximity of the 50 and 100-period moving averages and their expected convergence over time. If the 82.00 level is breached, the 84.17 level will be monitored as another important intraday horizontal resistance. If the upward movement continues and the price reaches the region currently at 87.72, which corresponds to the highest value seen after the big drop, it should not be overlooked that short positions may increase again as the price rises above all moving averages.
In the event of a pullback in line with expectations, the first support level to watch is 80.32. If the downward movement continues, the support levels of 79.29 and 77.21 will come into play. The aforementioned 79.29 and 77.21 levels are technically strong support zones, as they correspond to the Fibonacci 0.618 and 0.786 retracement levels on the 4-hour chart. Although the reaction previously observed from this area (yellow zone) was clearly strong and healthy, it should be noted that if the price returns to the same zone in the short term, the reaction may not be as strong as before.
Supports: 80.32 – 79.29 – 77.21
Resistances: 82.00 – 84.17 – 87.72

Legal Notice
The investment information, comments, and recommendations contained herein do not constitute investment advice. Investment advisory services are provided individually by authorized institutions taking into account the risk and return preferences of individuals. The comments and recommendations contained herein are of a general nature. These recommendations may not be suitable for your financial situation and risk and return preferences. Therefore, making an investment decision based solely on the information contained herein may not produce results in line with your expectations.