
BTC/USDT
It was a week of intense diplomatic and economic developments in the US in the areas of cryptocurrency regulation, monetary policy and foreign trade. Ahead of the August 1 tariffs, President Trump’s trade strategy, relations with the Fed and interest rate policy were back at the center of the agenda. Topics such as the European Central Bank’s interest rate decision and the SEC budget were followed by the markets. On the other hand, while institutional interest in digital assets continued to increase, high-volume Bitcoin purchases, on-chain transfers, bond issuances and fundraising announcements by US, European and Asian companies attracted attention. Statements on trade agreements, international energy investments and artificial intelligence policies also continue to shape expectations in global markets. In the new week, the White House’s first official cryptocurrency policy report, Fed rate decision, inflation data, Powell’s messages on interest rate policy will be followed.
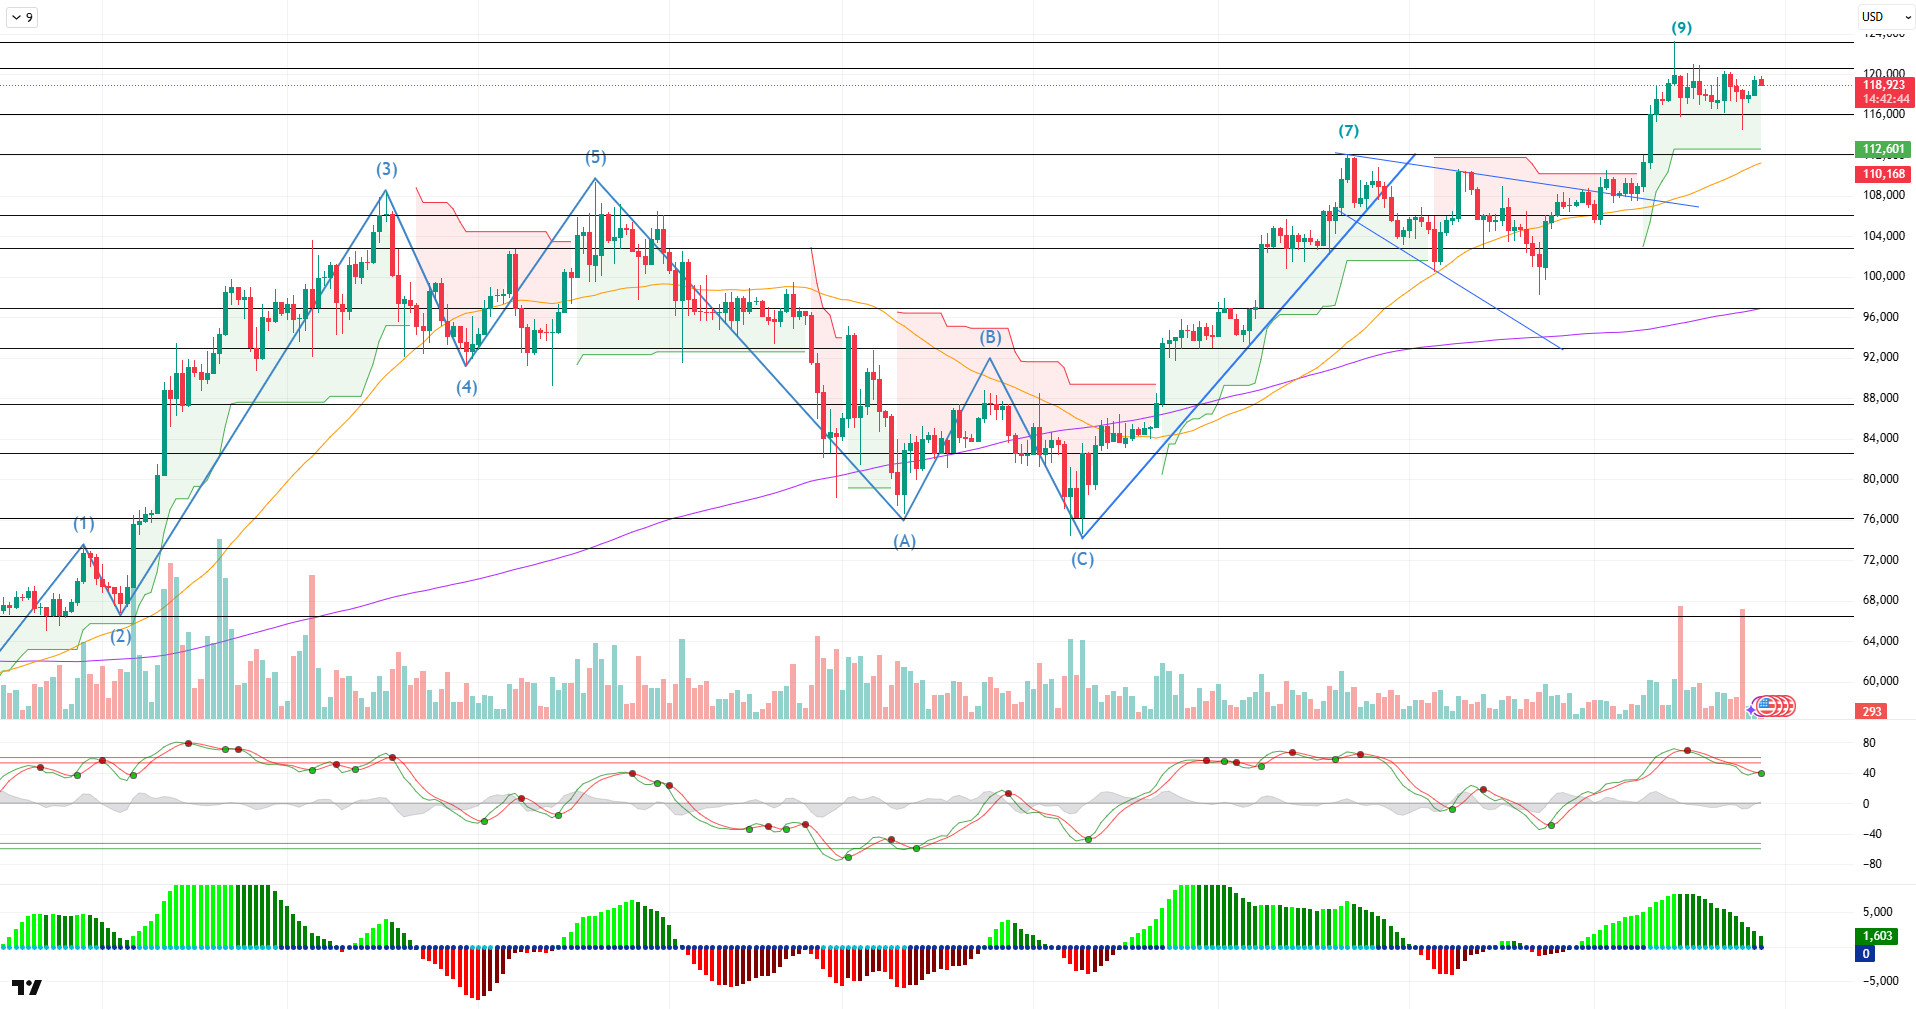
After all these developments, when we look at the daily technical outlook, it is seen that BTC entered the consolidation phase close to the ATH level after the peak at the 9th point reached with the golden cross structure. BTC, which carried the ATH level to 123,300, fell to 115,000 but started the week at 119,000 levels.
Looking at the technical indicators, the WT oscillator continues to move in the overbought zone on a daily basis, while the histogram in the SM indicator shows weakening momentum support in the positive zone. On the other hand, in the moving averages, the golden cross structure continues as the 50-day SMA cuts the 200-day SMA upwards.
When the weekly liquidity data is analyzed, it is seen that while the buying positions at the 115,000 level were liquidated with the recent decline, the selling phase continues above the 120,000 level.
In summary, while fundamental developments continue to create a driving force on the price, the technique has reached its saturation point with the recent rise. In liquidity data, it is seen that the weight of selling positions continues. In case the price regains momentum, 120,000 stands out as critical resistance, while crossing this level may bring a rise towards the ATH level. On the other hand, 116,000 will be followed as a support zone in a possible new selling pressure. Closures below it will bring the 112,000 – 115,000 area, which is determined as the “Gap” zone, back to the agenda.
Supports: 117,400 – 115,000 – 112,000
Resistances 120,000 – 123,300 – 125,000
ETH/USDT
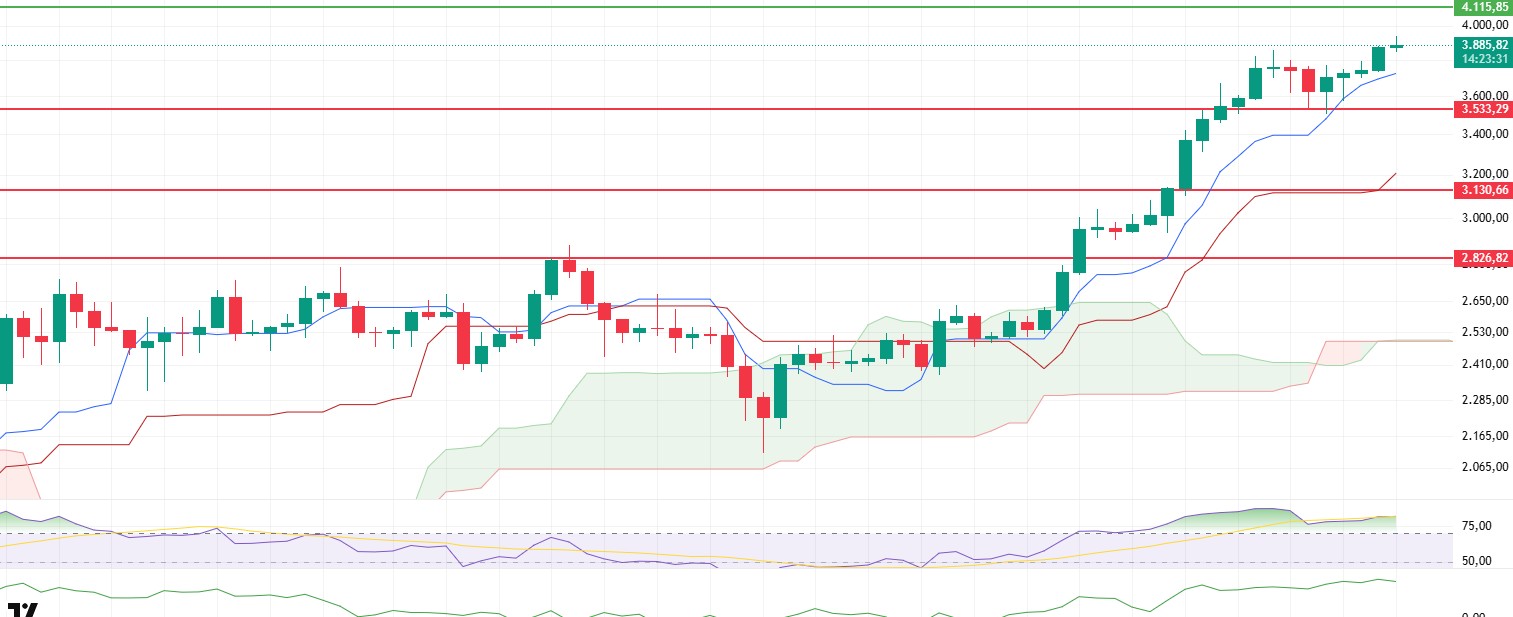
Ethereum managed to accelerate its upward movement to above the $3,900 level after a technical retest of its main support zone at $3,533 last week. This rise seems to be supported not only by technical but also fundamental and on-chain dynamics. Between July 18-25, 2025, Spot Ethereum ETFs saw a total net inflow of $2.248 billion. During this period, the daily net inflow of 533.8 million dollars, especially on July 22, reveals that institutional demand for Ethereum has strengthened significantly. The total net inflows of Spot Ethereum ETFs at the end of 253 trading days reached $9.3 billion. This data shows that the interest of institutional investors in the US in Ethereum continues to grow and provides a fundamental support to price movements.
There has also been a notable increase in the total amount of ETH staked on the Ethereum network. Last week, total staking increased from 35.44 million ETH to 36.15 million ETH. This shows that investors’ long-term expectations are positive and they are locking more ETH assets, reducing supply pressure on the price.
On the futures front, both the increase in the funding rate to 0.0141% and the open interest amount reaching the $28 billion limit reveal that there is a serious long accumulation in the positioning of investors. This indicates that bullish expectations are high and the price is supported, but at the same time, it should not be forgotten that overcrowded long positions pave the way for a possible correction. Heavy long positions may trigger liquidations and rapid pullbacks in an unexpected decline.
When technical indicators are analyzed, the fact that the price continues to stay above both tenkan and kijun levels in the ichimoku indicator and at the same time moves above the kumo cloud confirms that the positive trend continues in technical terms. However, within this technical structure, the fact that the price has hung too high and moved away from the support levels brings the possibility of a correction.
The Relative Strength Index (RSI) indicator is still moving in the overbought zone. Although this pattern of the RSI confirms that the bullish momentum is strong, the fact that it remains at these levels may indicate that the price is tired in the short term and a correction is imminent. Likewise, the Chaikin Money Flow (CMF) indicator remains in positive territory and its continued upward trend suggests that liquidity is entering the market. This suggests that the price continues to be supported and the selling pressure has not yet become evident.
When all these data are evaluated together, it is seen that Ethereum has encountered strong support at current price levels, but the concentration, especially on the futures side, brings risks. In a possible correction in the short term, the price is likely to retreat towards the $3,533 support zone. If this level is broken, selling pressure may deepen and the price may turn to lower support levels. On the other hand, if the price breaks the resistance zone at $4,115, the uptrend may regain momentum and the negative scenario may become invalid.
Supports 3,533 – 3,130 – 2,826
Resistances 4,115 – 4,369 – 4,890
XRP/USDT
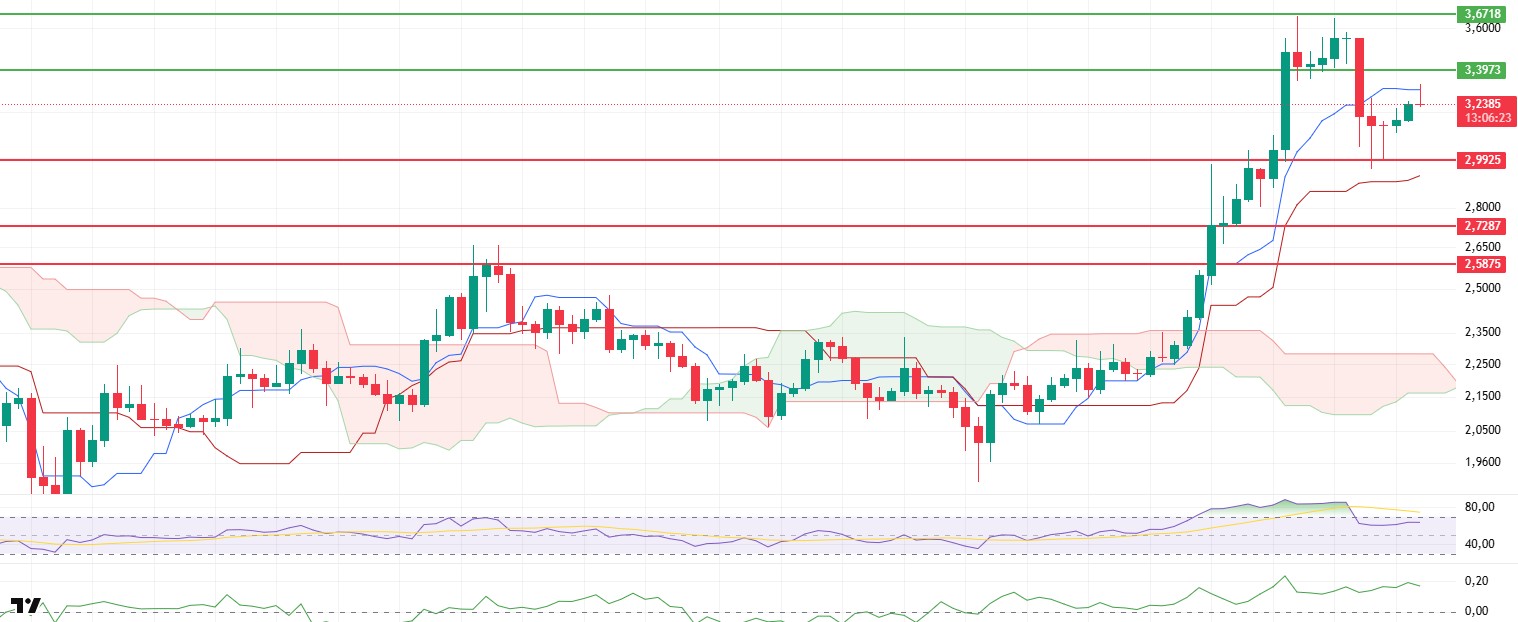
XRP has faced severe selling pressure over the past week and retreated to a key support point at $2.99. While this area has historically stood out as a strong buying zone, a limited upward recovery was observed as the price found support from this level. In particular, the price retested the tenkan level on the ichimoku indicator, indicating that buyers are looking for a signal to return to the market. However, not only technical dynamics but also some remarkable on-chain developments played a role in this uptrend.
The transfer of 50 million units of XRP from a wallet confirmed to belong to Ripple CEO Chris Larsen and the fact that this transfer was directed to major exchange addresses was perceived by the market as a potential sale. While this sale news caused a serious selling pressure on XRP, the fact that Larsen still holds more than 2.5 billion XRP raises concerns among investors . The supply potential of this size poses a serious risk that possible new sales could put pressure on the price.
Looking at the technical indicators, the ichimoku indicator shows that the price continues to remain below the tenkan level, indicating that the selling pressure is not yet over in terms of the short-term technical outlook. However, the fact that the price continues to be positioned above the kumo cloud confirms that the medium-term trend is still in positive territory. This structure suggests that although the correction pressure continues in the short term, the price retains the potential to rise on a larger scale as long as it finds support.
When the Chaikin Money Flow (CMF) indicator is analyzed, it is seen that a horizontal trend is observed in the positive zone. This means that the liquidity flowing into the market does not show a significant outflow or inflow for the time being, thus trying to maintain the balance of buyers and sellers. Such horizontal CMF movements usually indicate periods of accumulation or indecision, which may be followed by stronger directional movements.
The Relative Strength Index (RSI) indicator, on the other hand, does not enter the overbought zone, but continues its horizontal course at levels close to this zone. The fact that the RSI remains in balance at this level provides a positive structure regarding momentum and indicates that a potential uptrend is still on the table. However, the lack of a transition to the overbought zone suggests that the price has encountered resistance in its rises and that buyers remain cautious.
Overall, XRP is likely to exhibit volatile price action in the short term, with the price likely to fluctuate between $2.99 and $3.39. Technical and on-chain data show that price movements within this range are critical for determining the direction. Especially if it sags below the $2.99 support, the selling pressure may deepen further, while the upward momentum may regain strength if the $3.39 resistance is exceeded. Therefore, it is critical for investors to closely monitor the price behavior between these two technical levels. Top of the Form Bottom of the Form
Supports 2.9925 – 2.7287 – 2.5875
Resistances 3.3973 – 3.6718- 4.1848
SOL/USDT
Last week in the Solana ecosystem.
- Upexi announced the acquisition of 100,000 Solana (SOL) tokens for $17.7 million. The acquisition brings the company’s total holdings to 1.82 million SOLs worth $331 million.
- Solana SSK ETF surpasses $100 million.
- Mercurity Fintech Holding Inc (Nasdaq: MFH) announced that it has received a strategic $200 million line of credit from Solana Ventures Ltd.
- Franklin submitted an updated version of its filed spot solana ETF S-1 application.
- VanEck Solana is listed on the DTCC under the ticker $VSOL.
- Accelerate aims to build large Solana treasury with a fundraising of $1.51 billion.
- Under SIMD-0286, Solana plans to increase block capacity from 60 million to 100 million computing units and increase throughput by 66% to reduce congestion.
- The Solana Foundation’s 2027 roadmap characterizes market microstructures as “Solana’s most important challenge today.”
- Solana’s DeFi Development has partnered with Mayan for advanced cross-chain exchange.
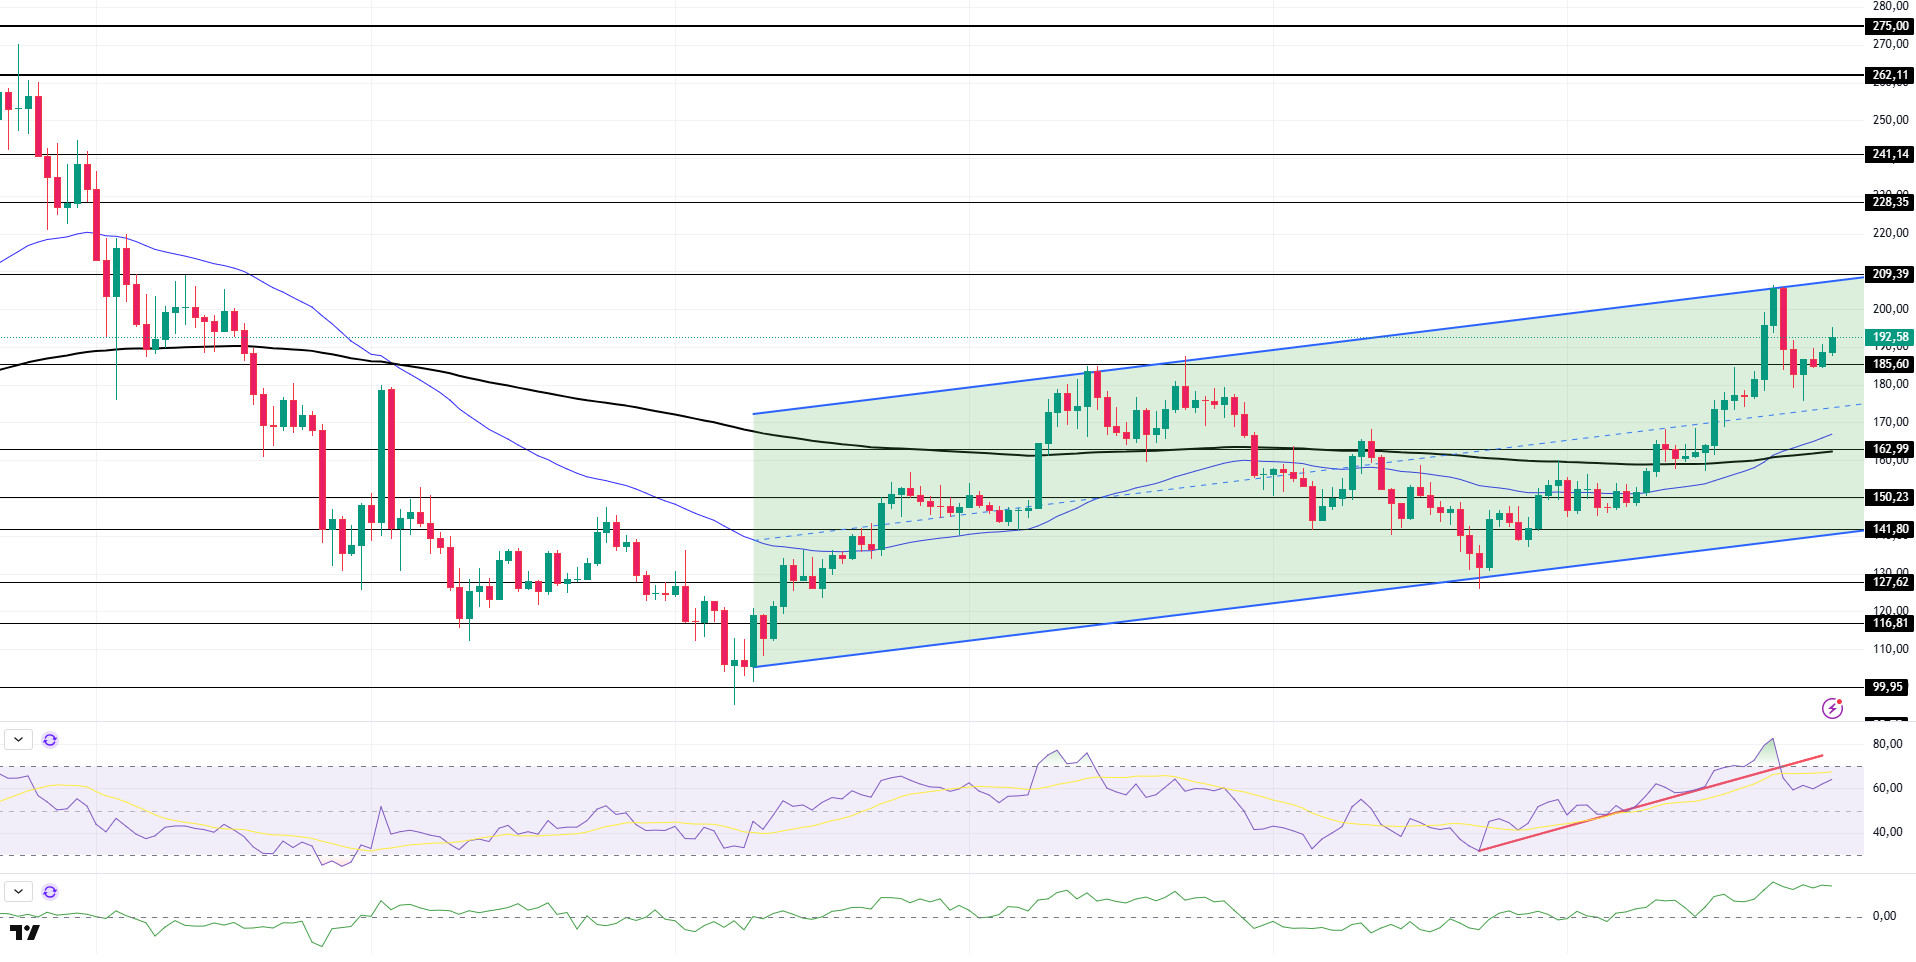
The SOL price was flat this week. The asset declined, hitting resistance at the ceiling of the uptrend that started on April 9, and was slightly higher, hitting support at $185.60. The $ 228.35 level can be followed on candle closures above the ceiling of the uptrend. Otherwise, the $162.99 level and the 50 EMA (Blue Line) can be followed in retracements.
The asset is trading above its 50 EMA (Blue Line) and 200 EMA (Black Line) moving averages, indicating a bullish bias. Moreover, the 50 EMA crossing above the 200 EMA signals the start of a “golden cross” formation from a technical perspective. This suggests upside potential in the medium term. RSI (14) is in positive territory and buying pressure continues. However, the metric has crossed the bottom of the uptrend that started on June 22. This may bring a decline. Chaikin Money Flow (CMF-20) remained in positive territory; also, a decrease in money inflows may move the CMF-20 indicator into negative territory. If macroeconomic data remains positive and ecosystem developments remain positive, the first major resistance point at $209.39 could be retested. Conversely, in case of possible negative news flow or deterioration in macro data, the $162.99 level can be monitored as a potential buying opportunity.
Supports: 185.60 – 162.99 – 150.23
Resistances: 209.39 – 228.35 – 241.14
DOGE/USDT
21shares has filed an amended form S-1 for the Dogecoin ETF.
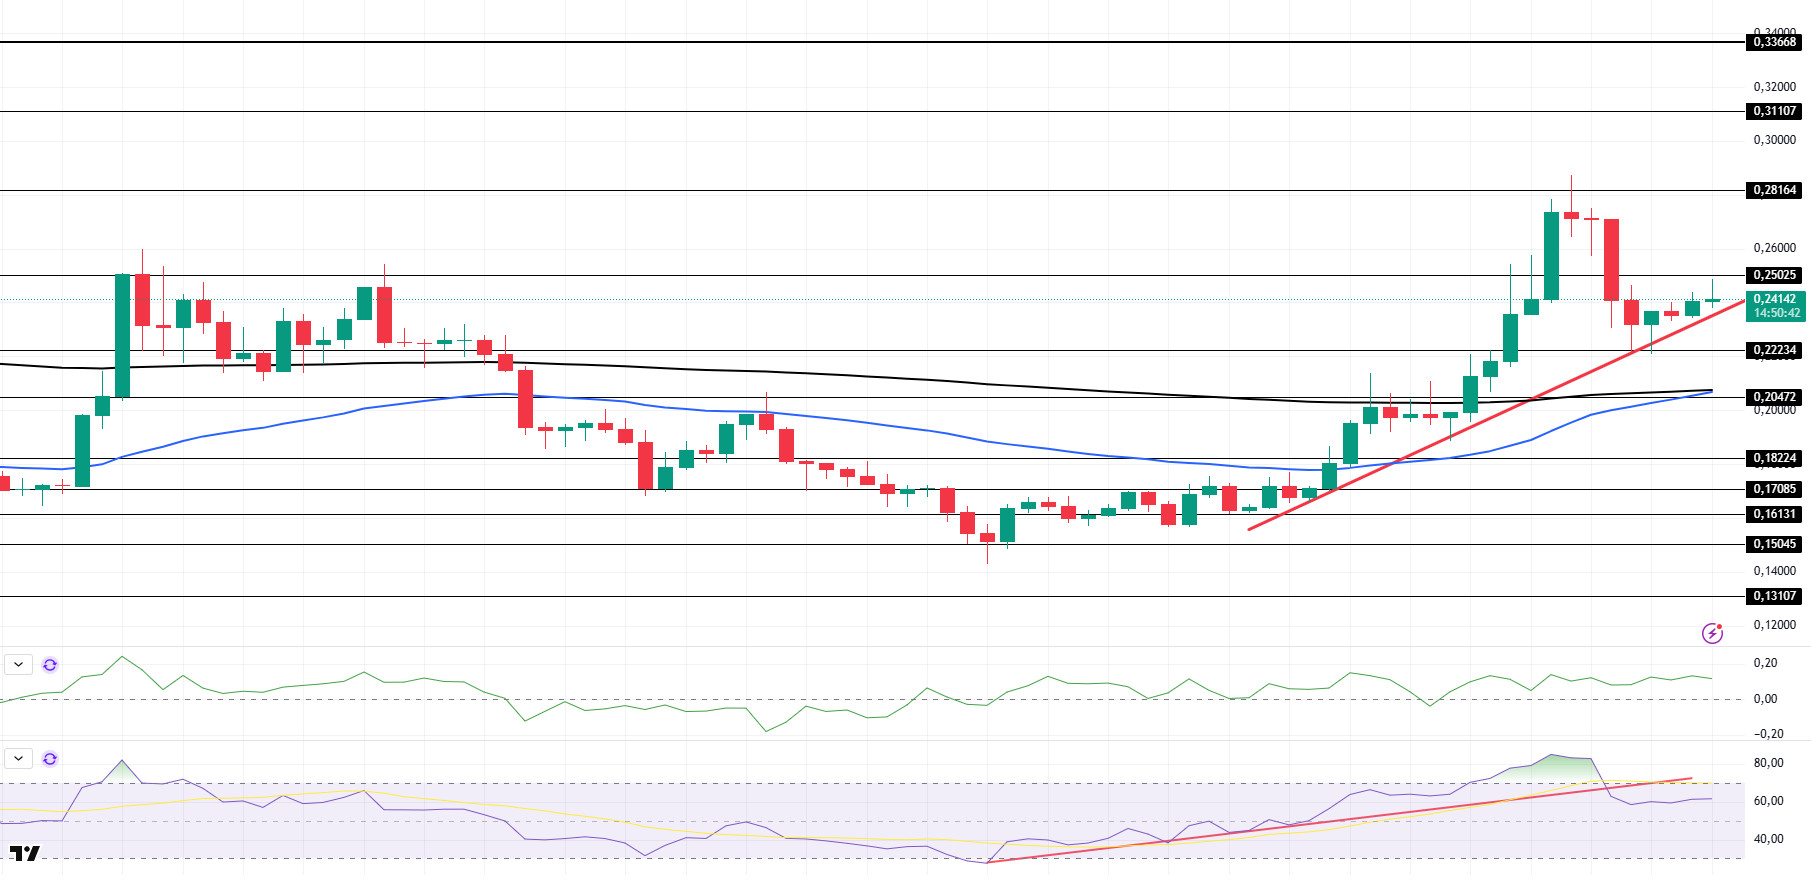
On the daily chart, DOGE is down about 11% since last week. The price tested the $0.28164 level as resistance, failed to break it and tested the lower zone of the uptrend that started on July 5 as support once again, and then rebounded with slight momentum. As of now, the price, which managed to hold above the uptrend, lost its momentum by failing to break the strong resistance level of $ 0.25025. If the rises continue, it may test the $ 0.28164 level. If the retracement begins, it may test the 50 EMA (Blue Line) moving average as support.
The asset is trading above the 50 EMA and 200 EMA moving averages. This signals that the asset is in an uptrend. On the other hand, the 50 EMA continued to be below the 200 EMA, suggesting that the death cross pattern remains valid. This suggests that bearish pressure may continue in the medium term. The Chaikin Money Flow (CMF-20) indicator remained in positive territory. Money inflows continue to decline. This may move the CMF-20 into negative territory. When we look at the Relative Strength Index (RSI-14) indicator, it failed to hold at the overbought level and started to be below the uptrend that has been going on since June 22. This could have a negative impact. In case of macroeconomic risks or negative news from the ecosystem, the $0.22234 level can be monitored as a strong support. On the other hand, the $0.28164 level stands out as the first strong resistance level if the upward movement gains strength.
Supports: 0.22234 – 0.20472 – 0.18224
Resistances: 0.25025 – 0.28164 – 0.31107
TRX/USDT
SRM Entertainment officially changed its company name to ‘Tron Inc.’ and began trading under the new name on the Nasdaq exchange on Thursday. The opening session was kicked off with the traditional opening bell rung by Tron founder Justin Sun, symbolizing the company’s strategic repositioning. The move is part of a broader strategic transformation of Tron’s corporate structure, focusing on digital asset management and blockchain-based financial products.
During the week of July 21 – 27, 2025, a total of 42.2 million TRX were burned on the TRON network. Thus, the circulating supply decreased by 14.9 million. The decrease in circulating supply continues to put deflationary pressure on TRX. In addition, the total number of addresses increased by 1.2 million to 322 million in the same week.
Over the past week, the TRON network generated a total of $89.3 million in revenue, making it the highest revenue-generating ecosystem among all blockchain networks. This revenue is important in terms of showing that TRON’s transaction fees earned through DeFi protocols and stablecoin transfers have been steadily increasing.
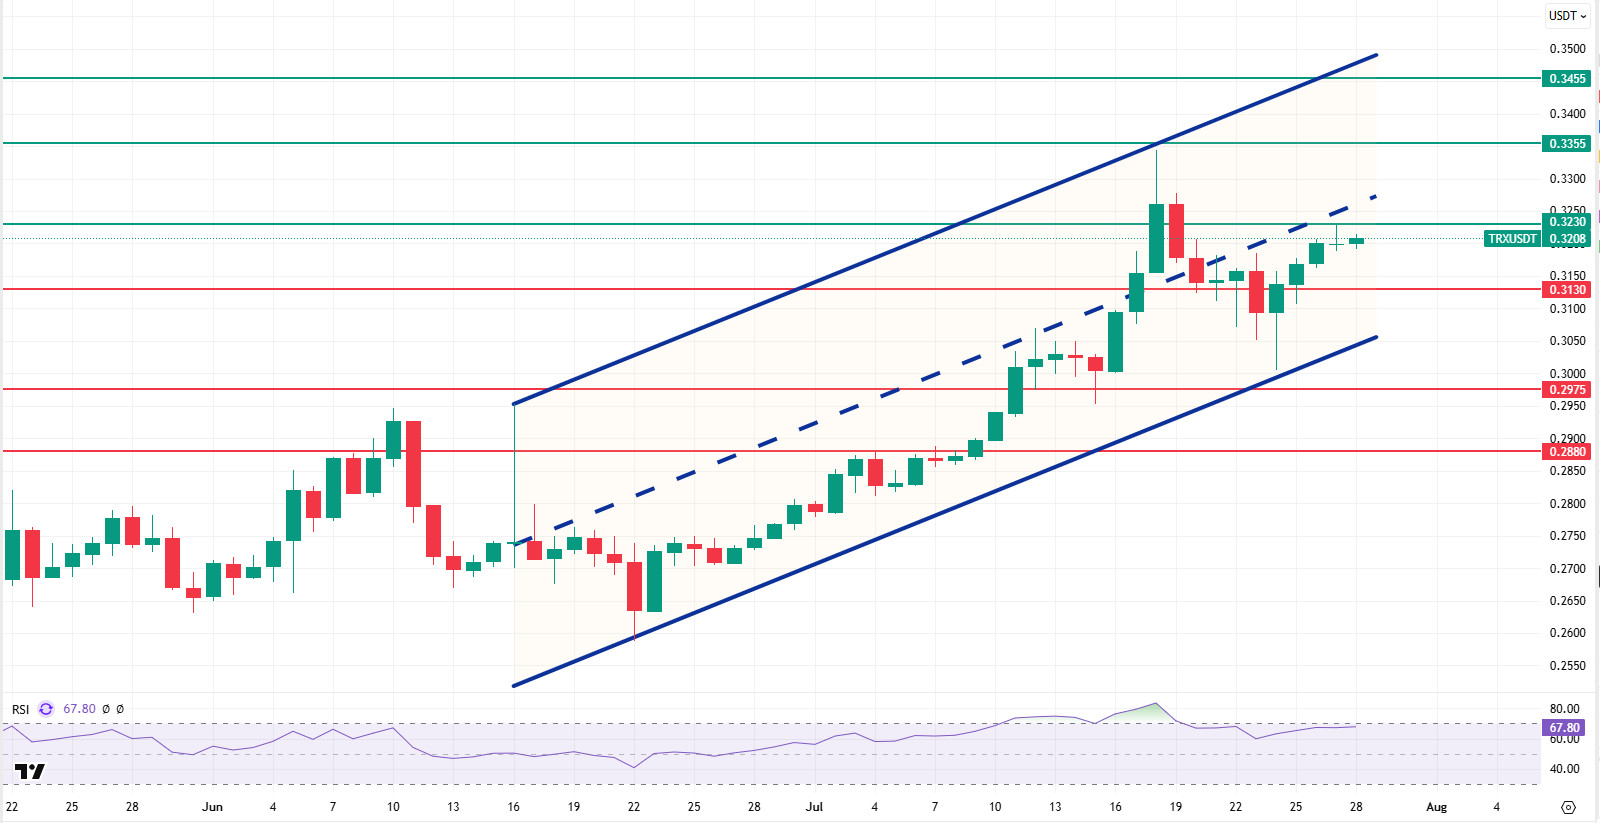
TRX, which started last week at 0.3140, rose by about 2% during the week and closed the week at 0.3199. Thus, it closed the fifth consecutive week with a rise. TRX, which is currently trading at 0.3208, is in the bullish channel middle band on the daily chart. The Relative Strength Index (RSI) value is very close to the overbought zone at 67. TRX price can be expected to fall from these levels and move towards the lower band of the bullish channel. In such a case, it may test the 0.3130 and 0.2975 supports respectively. If it closes daily below the 0.2975 support, it may want to test the 0.2880 support. If it fails to close daily below 0.3130 support and the positive mood in the market continues, it can be expected to continue its rise with the purchases that may occur in this region. In such a case, it may move to the upper band of the bullish channel and test the 0.3230 and 0.3355 resistances. On the daily chart, 0.2975 is an important support and as long as it stays above it, bullish appetite can be expected to continue. If this support is broken, selling pressure may increase.
Supports 0.3130 – 0.2975 – 0.2880
Resistances 0.3230 – 0.3355 – 0.3455
AVAX/USDT
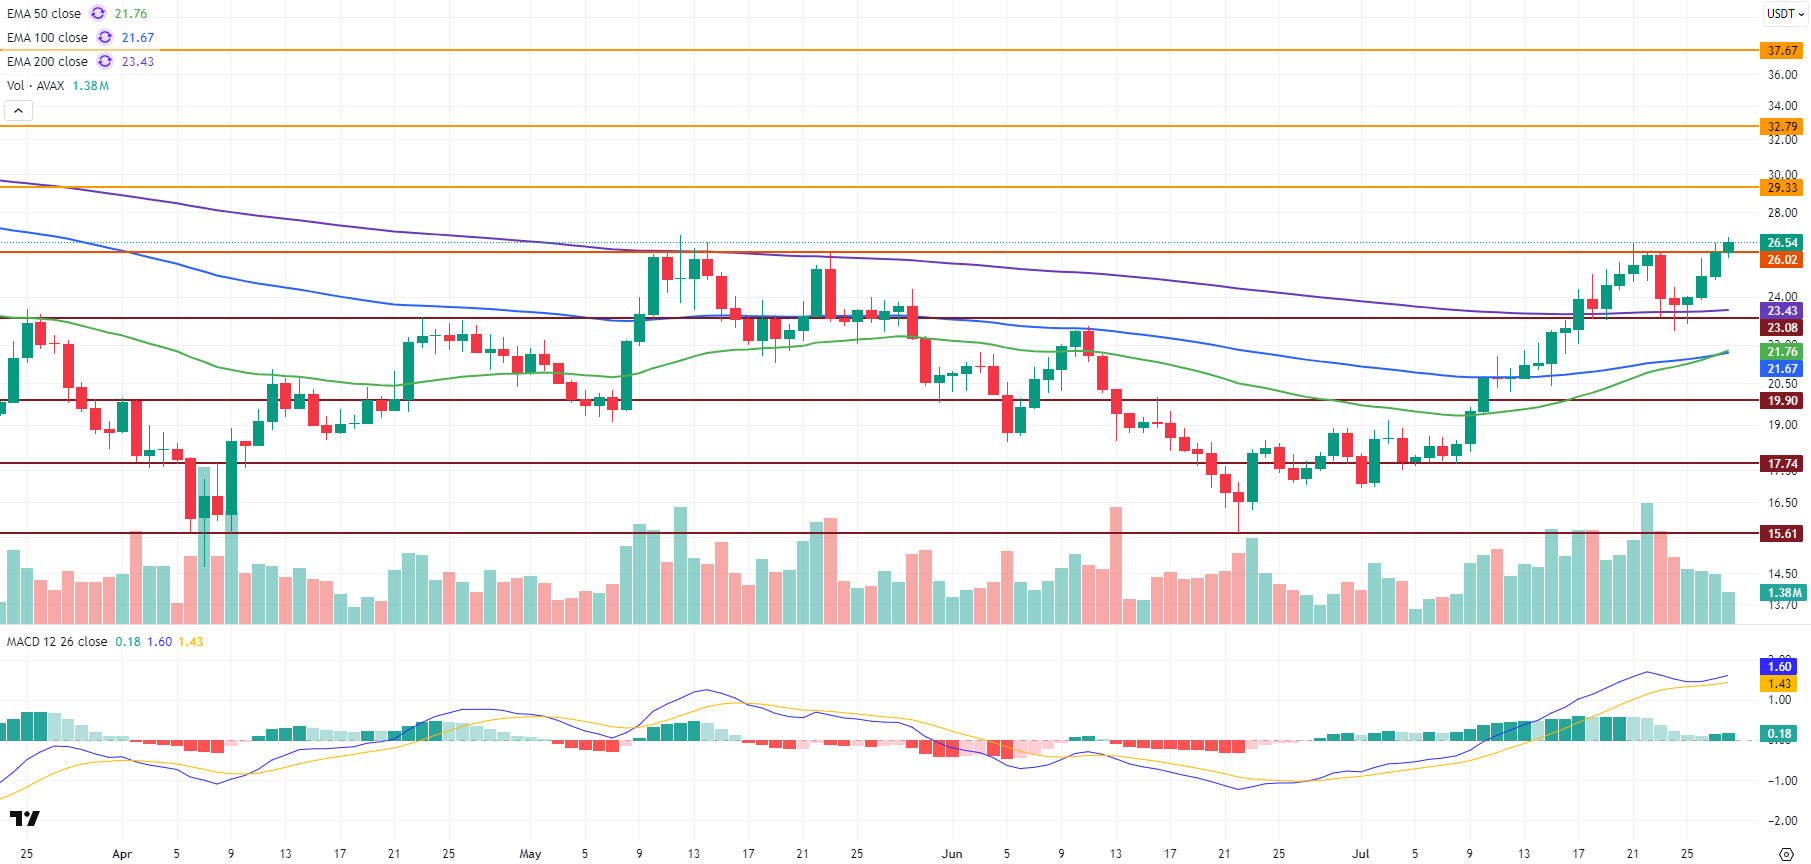
The Avalanche (AVAX) ecosystem continues to grow significantly in terms of volume and activity. In the positive atmosphere created by these positive developments, AVAX price has caught an upward momentum. AVAX, which started last week at $ 25.04, closed at $ 26.06 with an increase of approximately 4% on a weekly basis. It closed above the $ 26.02 level, which has been tested many times before in the upward process but could not be broken. AVAX, which started the new week above this level, maintains its positive technical outlook. Especially the persistence above the $ 26.02 level stands out as an important threshold for the continuation of the rise.
On the daily chart, the Moving Average Convergence/Divergence (MACD) line remains above the signal line and in the positive zone. This is one of the strongest technical indicators supporting price action as it signals the continuation of positive momentum. However, AVAX continues to exhibit a technically positive structure by trading above all of the critical Exponential Moving Average (EMA) levels on the daily chart.
In the coming period, if AVAX’s permanence above the $ 26.02 level is achieved, the $ 29.33 level may come to the agenda as the first target. If this level is broken upwards, resistance levels of $ 32.79 and $ 37.67 can be tested respectively. If the positive momentum continues, exceeding these levels may pave the way for the rise to evolve into a wider trend. On the contrary, if the $26.02 level breaks down again, the EMA200 and $23.08 level stand out as the first critical support zone. In case of persistence below this zone, the probability of deepening the decline increases and in this scenario, the $ 19.90 and $ 17.74 levels may come to the agenda as the next support zone. Overall, failure to sustain above the $26.02 level could lead to short-term selling pressure.
(EMA50: Green Line, EMA100: Blue Line, EMA200: Purple Line)
Supports 23.08 – 19.90 – 17.74
Resistances 29.33 – 32.79 – 37.67
SHIB/USDT
This week, the Shiba Inu (SHIB) ecosystem experienced a period of increased effectiveness of supply-shrinking mechanisms, accelerated whale accumulation, and remarkable steps on the infrastructure side. Seventy percent of transaction fees on the Shibarium network continued to be converted to SHIB and incinerated. With the increase in usage on the network, the burn rate jumped to about three hundred and sixty percent, and a total of over one hundred and thirty-five million SHIBs were taken out of circulation during the week. In addition, six comma three million SHIBs were burned in one day, an increase of two thousand seven hundred forty-two percent, one of the highest daily burns of the year. While this deflationary move directly reduced supply, it created a noticeable vibrancy in the community. Meanwhile, on-chain data showed that large investors continued to increase their positions. A total of seven hundred and twenty-eight billion SHIBs were transferred to large wallets in a short period of time, indicating that the whales continued their strategic accumulation process. SHIB reserves on centralized exchanges fell to eighty-three comma eight trillion, the lowest levels of the year. This trend pointed to investors’ strategy of holding their assets for the long term. As prices rose, the number of loss-making addresses decreased significantly, while the proportion of profitable addresses increased significantly. One of the notable developments of the week was the rise of Shiba Inu to the eighteenth largest cryptocurrency in the world, briefly surpassing Litecoin by market capitalization. Although this was temporary, it showed that confidence in the ecosystem is growing. On the technological side, the Shibarium developer portal received a comprehensive update. Documentation on the validator node setup and inter-network bridging processes was made available to developers. In addition, ShibaSwap integration, Hardhat support and new customizable tools called Alpha Layer were launched. The Shib Paymaster feature enables apps to pay for gas on behalf of users. In addition, the Bury 2.0 update increased staking rewards and strengthened community engagement. The number of daily transactions on the Shibarium network has steadily exceeded three million, and total user wallets have continued to grow. All these developments showed that Shiba Inu continues to strengthen as a multi-layered and sustainable ecosystem, going beyond being just a token and moving step by step towards decentralized artificial intelligence integration in line with the Shib Paper vision announced last week.
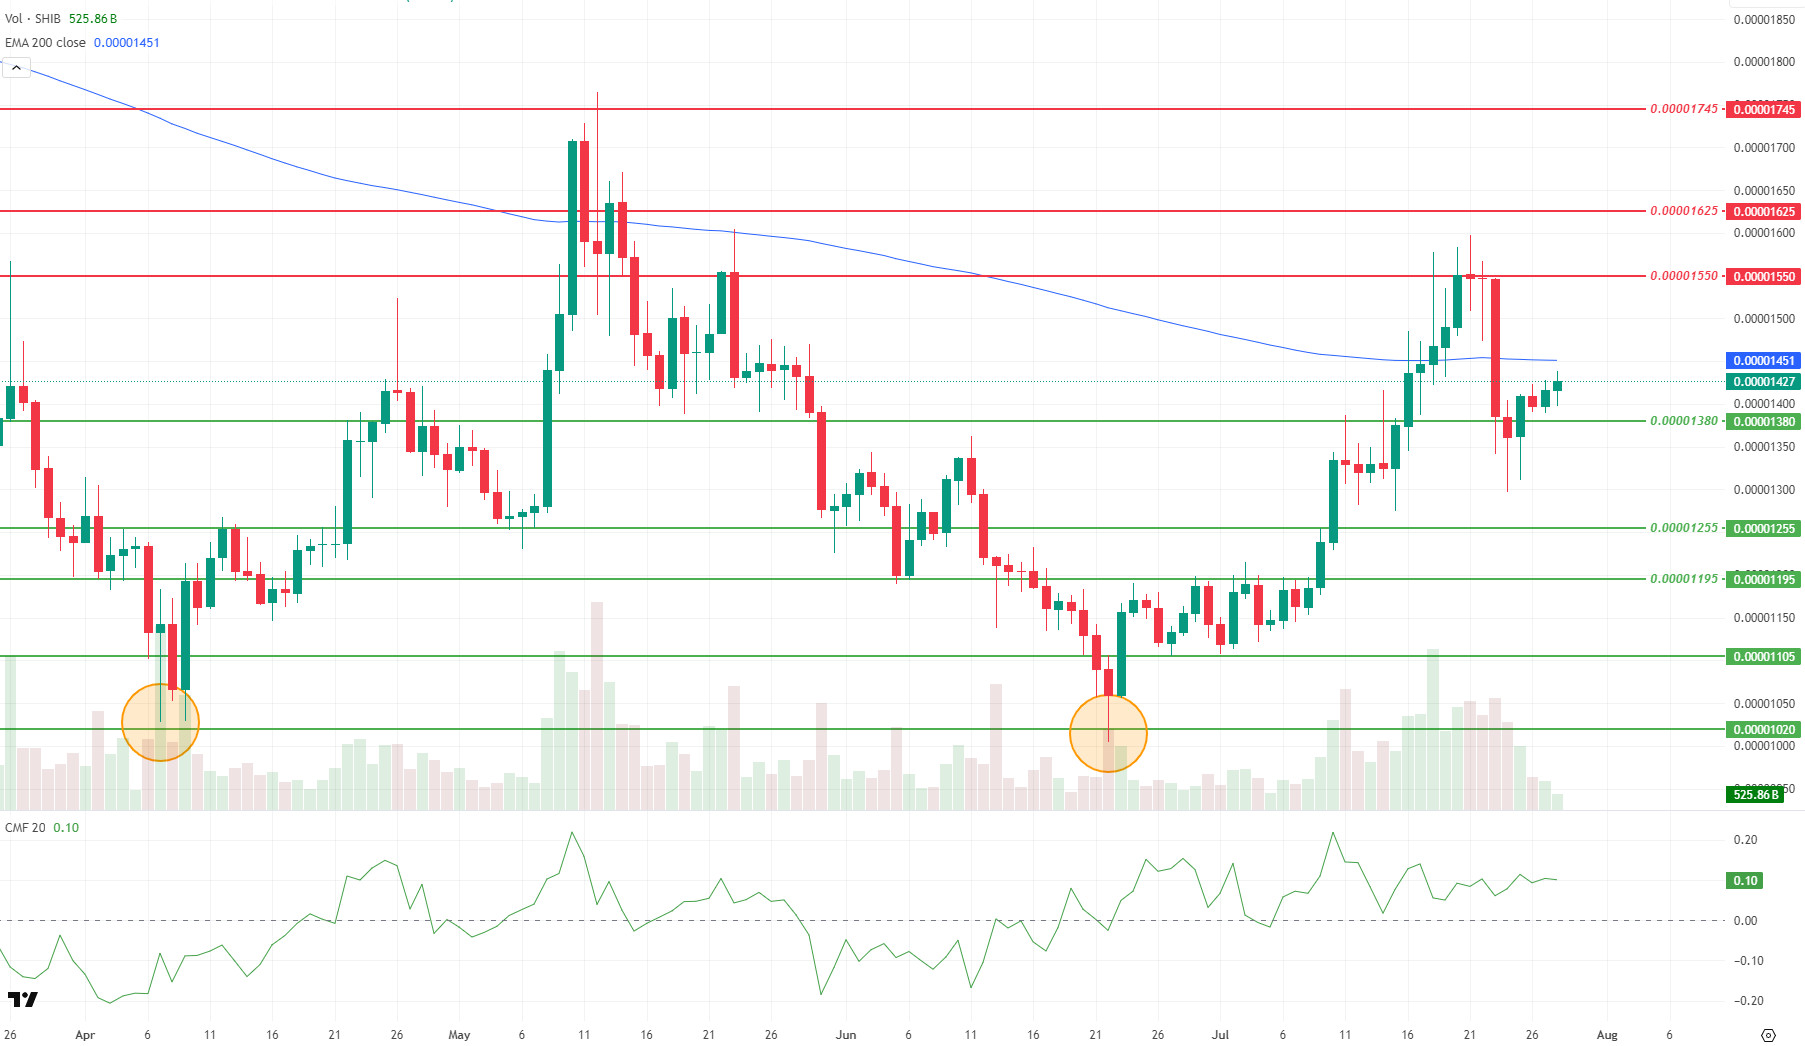
On the technical side, Shiba Inu’s price action showed a weakening of buyers and a significant slowdown in indicators compared to the previous week. The decrease in momentum, trading volume and volatility indicates that the buy side’s influence in the market has weakened and the bullish momentum has been interrupted. The price encountered sharp sales from the resistance level of 0.00001550 dollars, which caused the upward movement to remain limited in the short term. As a result of this pressure, the price retreated to the $0.00001380 level, which is an important support, and is currently stabilized at $0.00001415. In the meantime, the Chaikin Money Flow (CMF) oscillator remains in positive territory, confirming that capital flows are still predominantly buying. However, the price falling below the EMA200 (Blue Line) level again stands out as a signal of weakening in the medium-term technical outlook. As long as the current structure can be maintained, 0.00001380 dollar support will remain important in the short term. Below this level, 0.00001255 and 0.00001195 dollar levels will be followed as support respectively. Above, 0.00001480 and then 0.00001550 dollar levels must be exceeded in order for the price to regain strength
Supports 0.00001380 – 0.00001255 – 0.00001195
Resistances 0.00001550 – 0.00001625 – 0.00001745
LTC/USDT
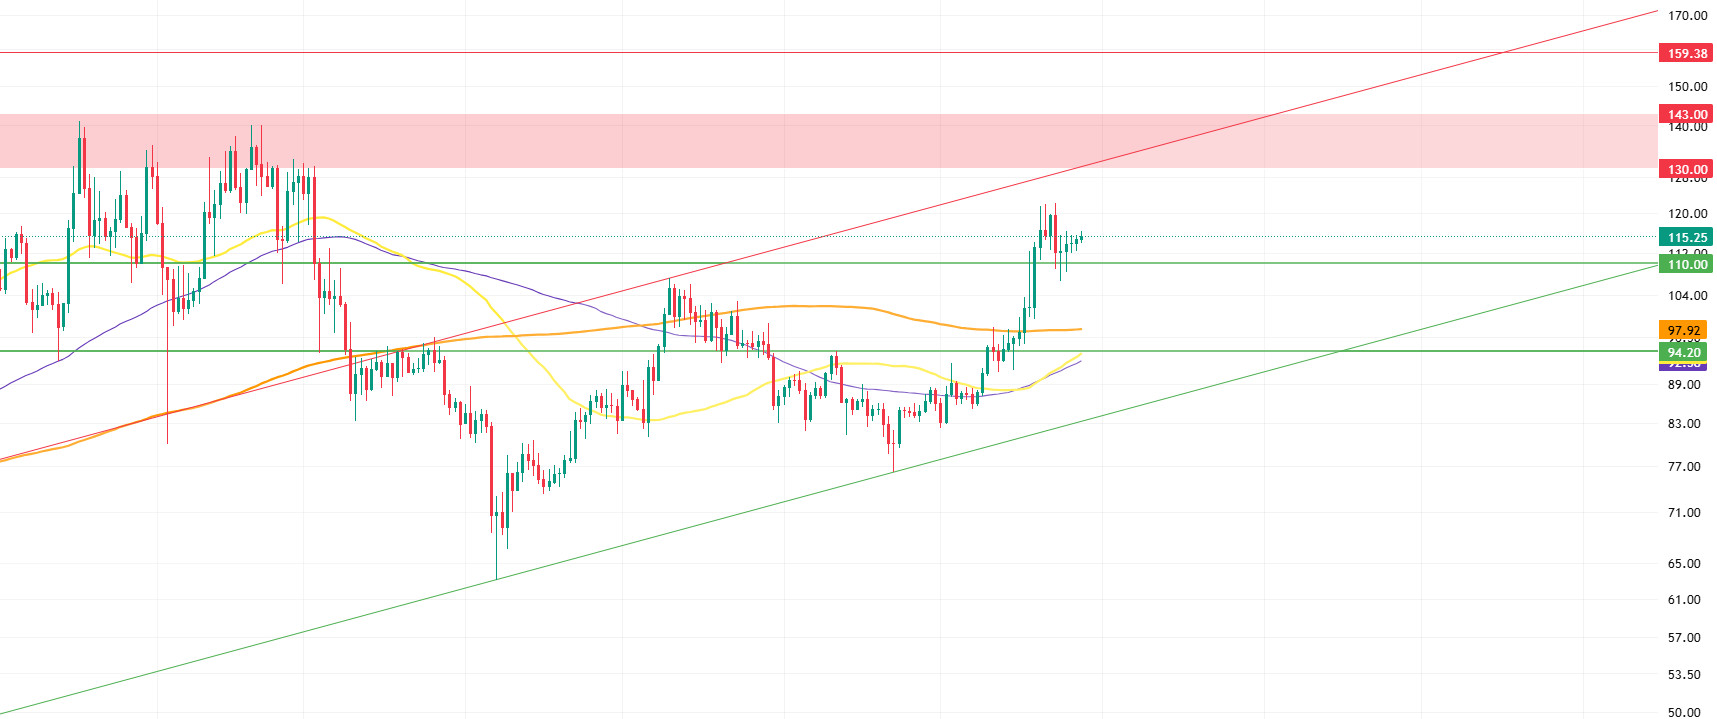
Litecoin (LTC) started the new week at 115.11, down 1.55% from last week. LTC, which also lost 3.32% against Bitcoin in this process, has a market capitalization of approximately $8.78 billion and jumped 1 place to 18th place in the market rankings. On the futures side, open positions decreased by about 14% compared to last week and funding rates remain positive.
As of this week, Litecoin (LTC) is pricing above all major short, intermediate and long term moving averages. There are no moving averages forming dynamic resistance above the price, indicating that the upside momentum continues. The first resistance zone that stands out is the 130.00 – 143.00 range. This band is notable both for being an important resistance zone that has been tested for about 8 weeks in the past and for intersecting the upper band of the rising channel at 130.00. Short-term selling reactions may be seen on the approach to this area, but in case of a breakout, the technical outlook will clearly turn bullish. If this resistance zone is overcome on the upside, there is no barrier to the price except the horizontal resistance at 159.38. With confirmations from RSI, volume and trend indicators, price movements can be expected to gain momentum after the breakout.
In possible pullbacks, the 110.00 level is the first strong support, which is expected to work as support as of this week. Below this level, the 200-day moving average at 97.92 can be followed as intermediate support. In deeper correction scenarios, the 50 and 100-day moving averages, which are located very close to each other, along with the horizontal support at 94.20, can be considered as the strongest support zone. This area forms a strong line of defense in both technical and psychological terms.
Resistances 130.00 – 143.00 – 159.38
Supports 110.00 – 97.82 – 94.20
LINK/USDT
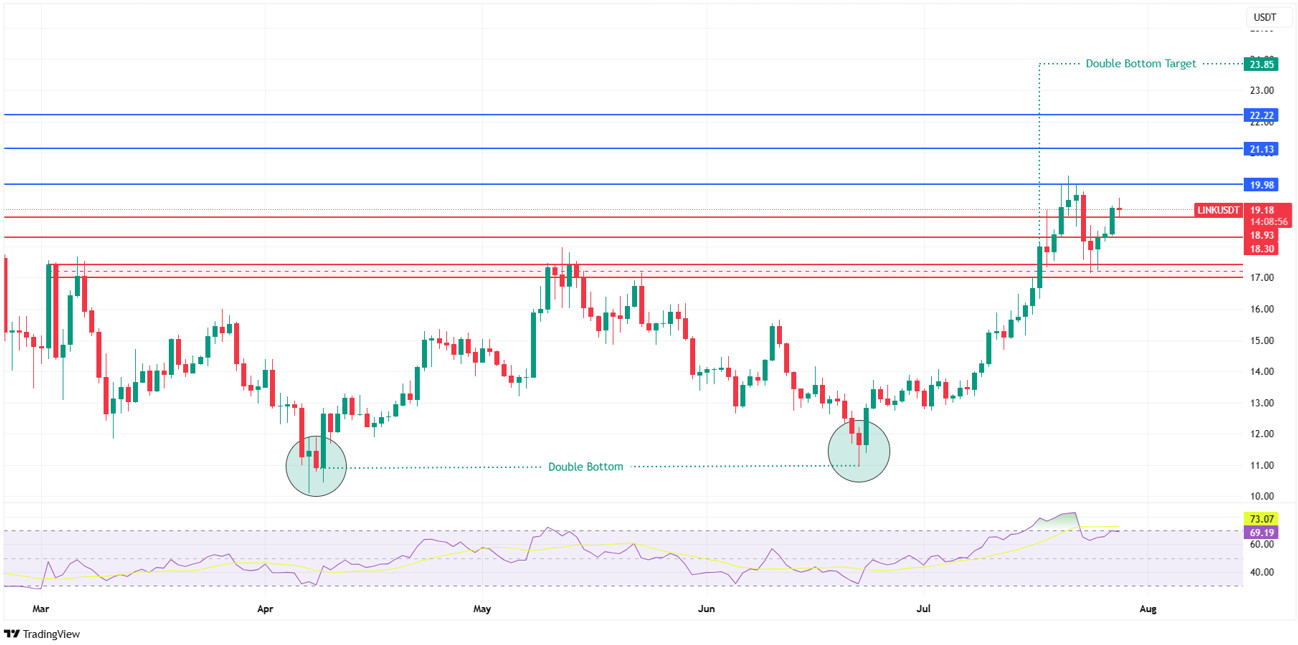
Last week, we drew attention to the double bottom formation that stands out in the technical outlook, and we stated that this pattern will become active if it is maintained above $ 17 and the technical target may be $ 23.85. Indeed, in this process, the price rose up to $ 19.98 resistance. However, this rise was met with profit sales, especially with the RSI indicator entering the overbought zone, causing the price to retreat to the $ 17 region. This once again showed how critical the support levels we pointed out in our previous analysis are.
Looking at the current technical outlook, we see that the price is trying to hold above the 18.93 support. In case of persistence above this level, the $ 19.98 and $ 21.13 resistances can be retested. In particular, exceeding the 21.13 resistance could trigger a move towards $ 23.85, the technical target of the pattern, and strengthen the market perception upwards.
On the other hand, the Relative Strength Index (RSI) indicator is still moving above the 70 level, indicating that the uptrend still has a strong momentum, but caution should be exercised in the short term. At this point, we can read possible pullbacks back to the $17 level as a risk potential that can be realized within the expectation, not as an extraordinary movement. Price sags below this level may cause deterioration in the pattern structure and increased selling pressure.
Supports 18.93 – 18.30 – 17.40
Resistances 19.98 – 21.13 – 22.22
BNB/USDT
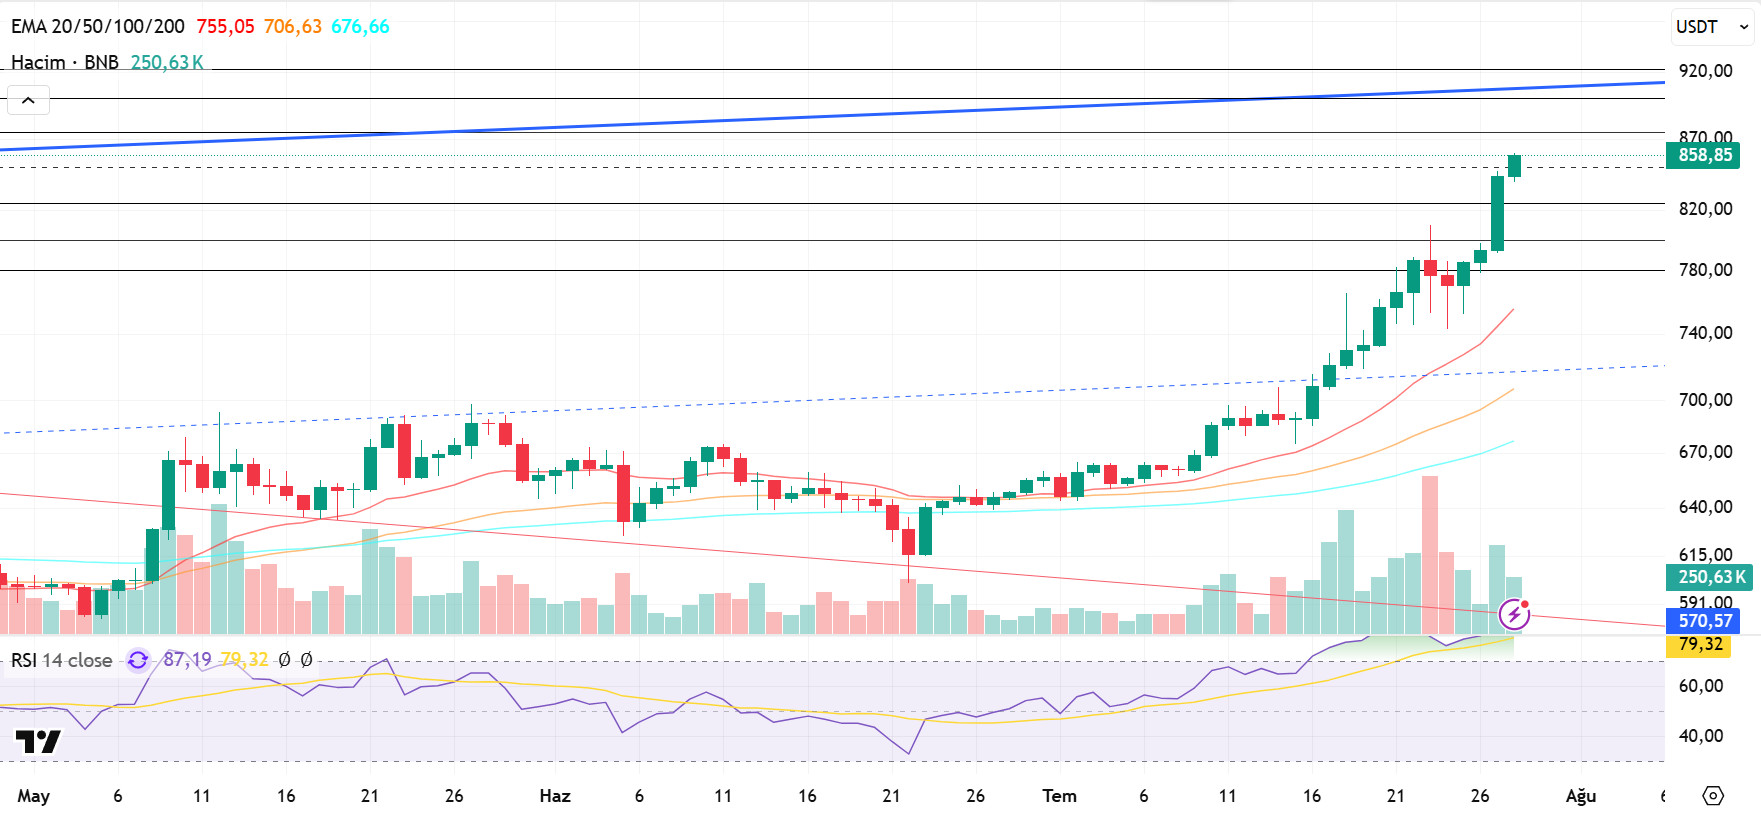
Windtree Therapeutics strengthened its decision to create a BNB-based treasury and announced its plan to create a crypto asset treasury totaling 520 million dollars. Following this development, an accelerated and positive movement was observed in the BNB price, which is already on an upward trend.
From a technical point of view, the ongoing upward process in the BNB/USDT pair, supported by fundamental developments, contributed to the acceleration of the price to the $ 850 level. With the surpassing of this resistance entering the new week, BNB made a positive start to the week, priced above the $ 850 level and displayed an upward outlook.
In the BNB/USDT pair, which is currently trading in the range of $825-875, technical indicators show that a strong and positive trend in trading volume has come to the fore in the last one-week period. This outlook indicates that the buying appetite has increased across the market. On the other hand, the Relative Strength Index (RSI) has trended upwards on the back of the recent rebound, rising above both its average value and the 70 level. This technical structure suggests that positive trends are at the forefront in the short term, but selling pressures may also be on the agenda at certain resistance levels.
Within the framework of the current technical outlook, if the positive momentum continues, the BNB price is expected to test the $ 875 resistance level in the first place. If this level is exceeded upwards, the $ 900 and $ 920 levels stand out as the next strong resistance zones. On the other hand, if the $ 875 level cannot be exceeded and selling pressure increases, the price is likely to head towards the $ 825 support level again. If this support is broken downwards, the $800 and $780 levels should be followed as the next critical support points, respectively.
Supports 825 – 800 – 780
Resistances 875 – 900 – 920
SUI/USDT
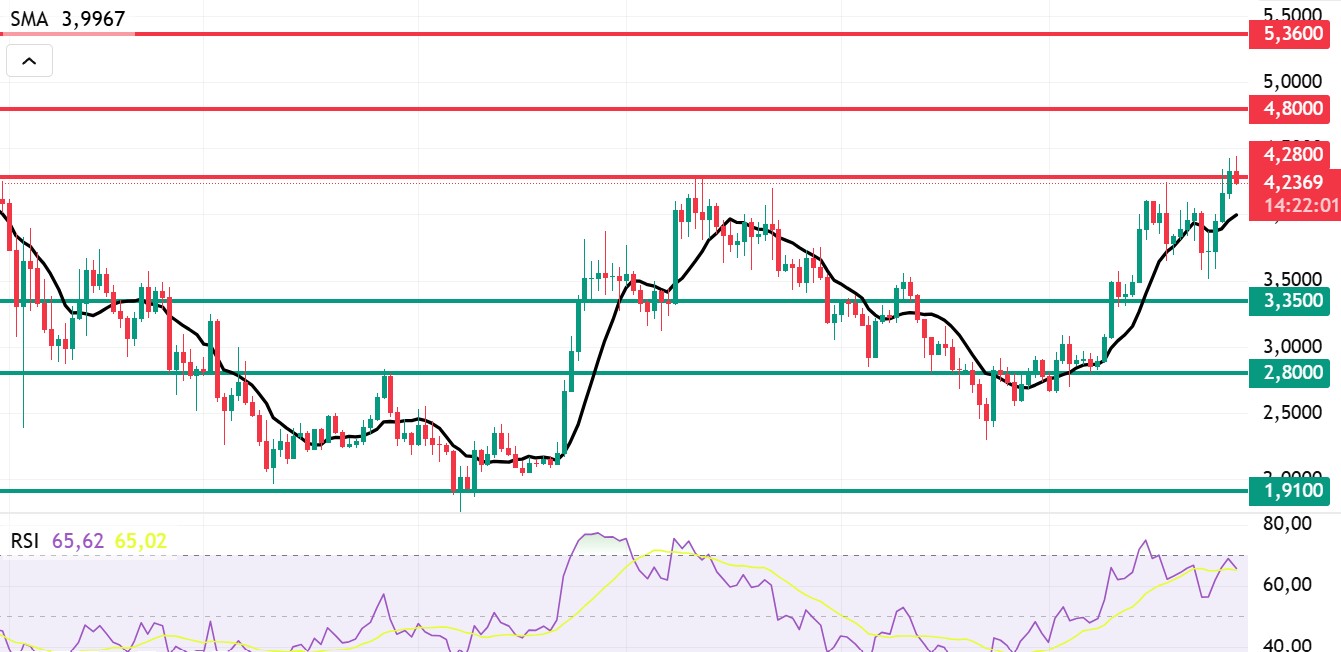
The SUI network started the new week on a strong note, supported by both technological upgrades and stabilizing factors in supply dynamics. Increased intra-network activity and the rapidly expanding infrastructure of the ecosystem are making SUI’s medium-term potential more and more visible. These developments are fueling optimism among investors and market analysts about the project’s future. SUI’s price has attracted attention in recent days with a notable daily increase of around 16%. This has been driven by the project’s solid fundamentals and increasing adoption rates. In particular, Grayscale’s announcement of a new Sui Trust has previously boosted SUI’s price by more than 16%, demonstrating the strong interest of institutional investors in the project. Another closely watched development is the Sui Foundation’s big token unlock on August 1st. On this date, approximately $239.4 million worth of SUI tokens will be unlocked. This amounts to 1.27% of the total circulating SUI supply . Usually token unlocks of this magnitude can create potential selling pressure in the market. However, Sui’s current strong market momentum, increased network activity and the overall positive sentiment surrounding the project could mitigate the effects of this potential pressure.
When we look at Sui’s technical outlook following the recent developments, it is seen that the price has risen sharply on a weekly basis to around $4.28 on the back of fundamental developments. The Relative Strength Index (RSI) is currently in the range of 65.62 – 65.02. While this value range indicates that the market is close to the selling zone, a weakening of the RSI to the range of 35.00 – 50.00 may indicate a potential buying point. If the price moves upwards, the levels of 4.28 – 4.80 – 5.36 dollars can be followed as resistance points, respectively. However, if the price falls to new lows, it may indicate that selling pressure may deepen. In this case, the $3.35 and $2.80 levels stand out as strong support zones. Especially based on the trend line, the possibility of a pullback to $ 2.58 seems technically possible. According to Simple Moving Averages (SMA) data, Sui’s average price is currently at $3.99. If the price stays above this level, the current uptrend could technically continue. This is also supported by the upward trend of the SMA.
Supports 1.91 – 2.80 – 3.35
Resistances 4.28 – 4.80 – 5.36
ADA/USDT
Over the past week, on-chain activity on the Cardano network has increased significantly, making a noticeable difference in daily trading volume. The Cardano network currently has approximately 1,300-1,400 active projects and a strong community engagement with 4.8 million staking wallets. The project transaction volume averages 2.6 million transactions per day and the total number of transactions is approximately 112 million, keeping the network constantly alive. Institutional and individual users are showing strong interest in ADA staking, with a total of 24 billion ADA staked and a staking rate of 67%.
At the same time, the Cardano Foundation has gained attention in the ecosystem with the launch last week of Reeve, a tool designed for enterprise-level auditable financial reporting. By announcing that the entire codebase will be made open source, it could increase developer interest and accelerate DeFi innovation.
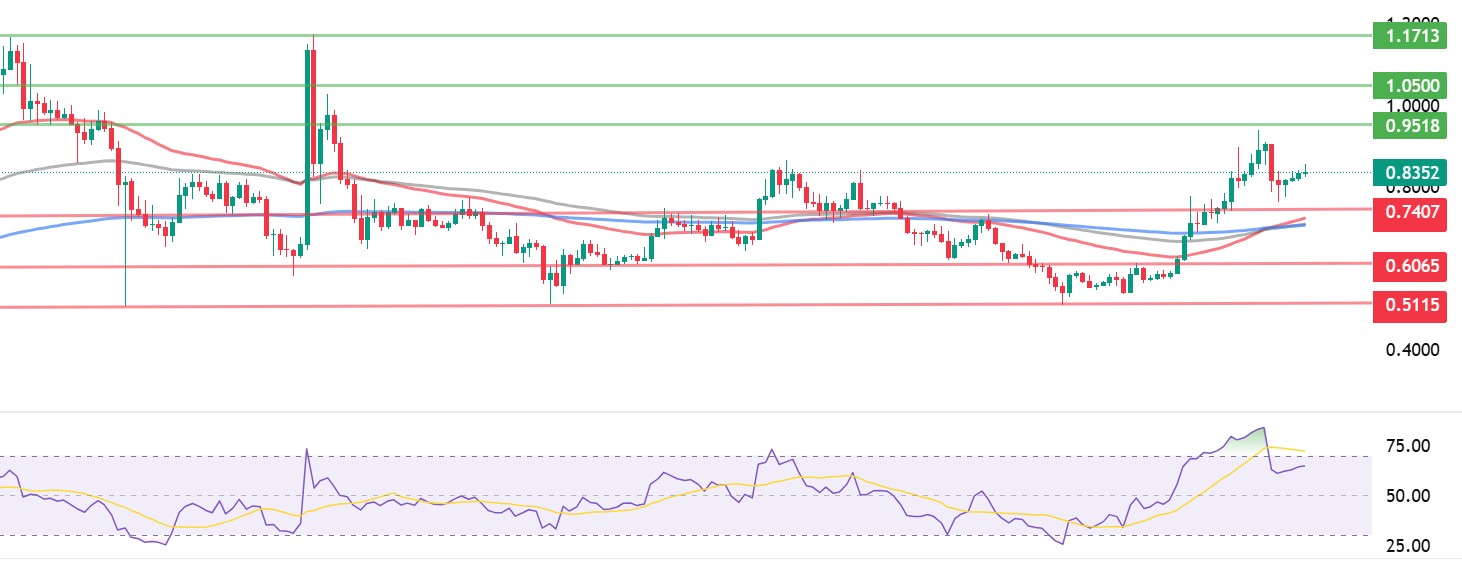
Technically, it has gained about 1.79% since last week, leaving the “death cross” concerns on the technical chart behind. The RSI (Relative Strength Index) has risen by 0.15% in the last 24 hours, settling at around 53 and the observed signals point to positive momentum. This week, ADA’s price is consolidating around the $0.8200 – $0.8400 band and is trading inside the rising trend channel. While the 0.7407 – 0.6065 dollar level stands out as the support zone, the 0.9518 – 1.0500 dollar band draws attention as the resistance zone.
Supports 0.7407 – 0.6065 – 0.5115
Resistances 0.9518 – 1.0500 – 1.1713
Legal Notice
The investment information, comments and recommendations contained in this document do not constitute investment advisory services. Investment advisory services are provided by authorized institutions on a personal basis, taking into account the risk and return preferences of individuals. The comments and recommendations contained in this document are of a general type. These recommendations may not be suitable for your financial situation and risk and return preferences. Therefore, making an investment decision based solely on the information contained in this document may not result in results that are in line with your expectations.