
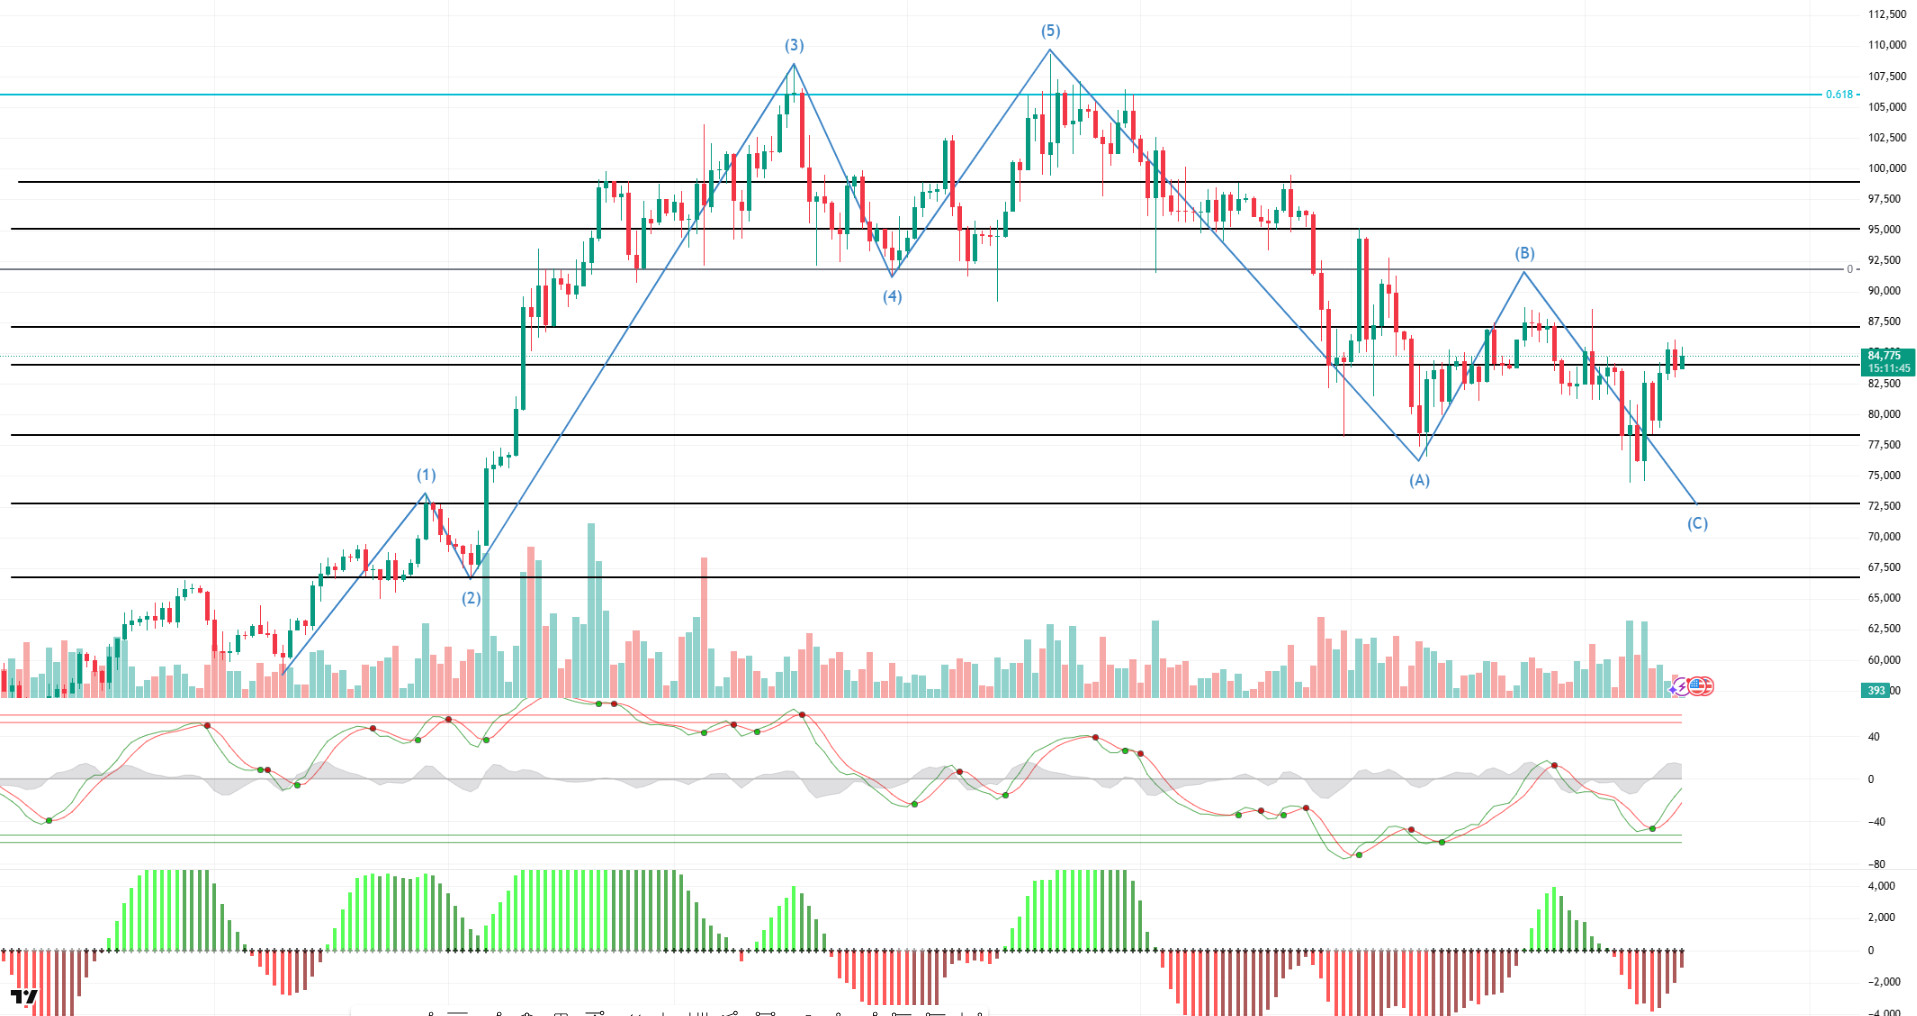
BTC/USDT
Trade wars, which played a decisive role in global markets last week, took a new dimension with US President Donald Trump’s decisive stance. Trump stated that tariffs against China, the European Union and other major trading partners will continue and that these policies provide significant income to the US. As of April 9, the reciprocal tariffs officially went into effect, causing a contraction in global trade and a nearly $10 trillion meltdown in capital markets. China has retaliated harshly by raising tariffs on US imports to 125%, while the EU has opted for a conciliatory stance with a “zero-to-zero” tariff proposal. Recent statements from the White House signaled that negotiations have started with most countries and that tariffs will be temporarily reduced to 10% and postponed for 90 days, signaling a de-escalation of tensions. With the improvement in inflation data, the Fed minutes emphasized that trade wars may put upward pressure on inflation but monetary policy will remain flexible. On the other hand, Trump’s crypto-friendly moves also attracted attention. The dissolution of the National Cryptocurrency Enforcement Unit, the appointment of Paul Atkins as SEC chairman and the signing of the law abolishing DeFi taxes stood out as positive developments for digital asset markets.
Looking at the technical outlook, we left behind another week of high volatility and sharp price movements. BTC started the week at 79,000 and tested the 74,600 level twice during the week. With the purchases coming from this region, BTC turned its direction upwards and rose to 86,000. However, with the increasing selling pressure towards the end of the week, the price retreated a little and is currently trading at 84,500. Thus, BTC is preparing to close the week with an increase of about 7.94%. According to the Elliott Wave theory on the daily chart, which we analyzed in the previous weeks, BTC, which completed its movement towards point C, tested the 74,600 level in accordance with the pattern. With the support from this level, the price turned its direction upwards, confirming that the technical structure is working. Analysing the technical indicators on the daily chart, it is seen that the Wave Trend Oscillator maintains its buy signal. Momentum indicators, on the other hand, support the bullish outlook by showing a tendency to transition to the positive zone. When we look at the weekly data on the liquidation side, it is noteworthy that short positions are largely closed while long transactions are gaining weight. In the monthly data, short trades above 89,000 are still concentrated, indicating that this region may be a strong resistance level. While the overall technical outlook remains positive on a weekly basis, the possibility that fundamental developments may disrupt this structure should not be ignored. Especially in the ongoing tariff tensions between the US and China, the environment of uncertainty may suppress prices unless conciliatory steps are taken. In conclusion, although technical indicators suggest that the uptrend may continue, the direction of prices will continue to be shaped in the short-term depending on news flows and especially developments in tariff policies.
Supports 84,000 – 78,600 – 72,700
Resistances 87,000 – 91,800 – 95,000
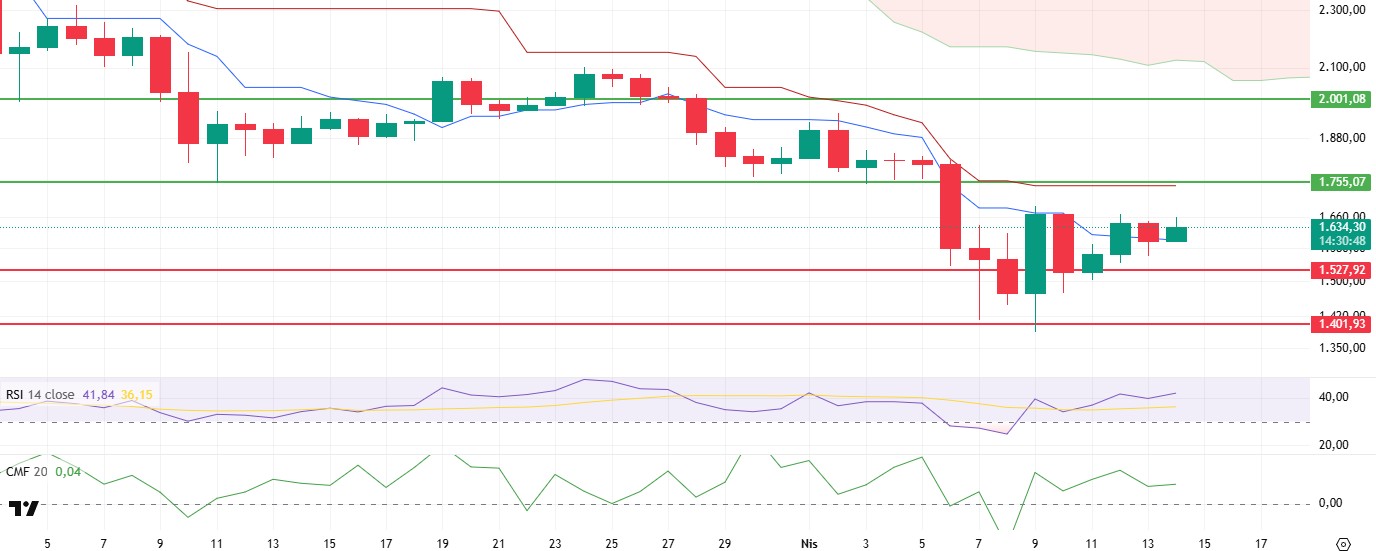
ETH/USDT
One of the most important developments in global markets last week was the renewed trade war between the US and China. Both countries raised their tariffs sharply in response to each other, creating significant uncertainty and volatility in the markets. The US administration announced an increase in tariffs on China to 145%. In response, China retaliated by raising tariffs on US goods to 125%. Following these developments, risk aversion increased in the markets and volatility in the cryptocurrency market increased significantly. ETH exhibited wide-band price movements during this period. By the weekend, the market atmosphere had changed somewhat. US President Donald Trump’s statements reassuring the technology sector increased risk appetite again. Trump stated that smartphones, computers and chips would be exempted from the new tariffs, providing relief especially for technology stocks. This development was felt not only in traditional markets but also in cryptocurrencies. Especially for crypto investors, who make up a significant part of the technology-oriented investor profile, this statement served as a positive catalyst and ETH price moved above the $1,600 level, breaking the psychological resistance. In parallel with this price movement, there were also remarkable developments in on-chain data. The amount of ETH staked, which has been on a downward trend for a long time, is on the rise again. This shows that investors have increased their confidence in Ethereum in the medium-long term perspective and are taking positions again. The strengthening of passive return strategies through staking, especially when uncertainties persist in the spot market, is a positive signal for the fundamental outlook of the market. This trend signals a strengthening optimism towards Ethereum, not only technically but also structurally.
When technical indicators are analyzed, it was noteworthy that ETH fell below the $1,400 level last week. During this decline, the Chaikin Money Flow (CMF) indicator also fell sharply into negative territory, revealing a rapid outflow of liquidity from the market. However, as liquidity re-entered the system after Trump’s statements, the CMF indicator also recovered rapidly and returned to the positive zone. CMF, which currently maintains its strong stance in the positive area, shows that investor interest is increasing again and that the capital flow to ETH in the short term is developing in a supportive direction. On the Ichimoku indicator side, ETH has been pricing below the tenkan level for a while. With the recent rise, it has risen above the tenkan level again. While this development is a positive signal for short-term momentum, the fact that ETH price has not yet broken through the kijun level and is also well below the kumo cloud suggests that it still displays a weak outlook in terms of the overall trend. This suggests that the market has not yet entered a full trend reversal and that price movements are shaped more by macro developments. On the momentum side, the Relative Strength Index (RSI) had fallen to oversold territory with the recent declines. The upward movement that started from this point continues its upward momentum, accompanied by the RSI. However, the negative divergence observed in the RSI is remarkable. Although there is an upward trend in the general outlook, this movement suggests that there may be a loss of strength below the price increases and a potential correction is at the door. This divergence in the RSI stands out as an important technical signal that emphasizes the need for caution in the short term.
Taking all these technical and fundamental developments together, the current outlook for ETH is full of uncertainties, but it retains upside potential. While the CMF indicator confirms the money entering the market, the negative divergence on the RSI keeps the risk of a correction alive. The Ichimoku structure is still weak, supporting the indecisive nature of the market. In this context, price reactions at tenkan and kijun levels are critical for the short-term direction of ETH. Especially if the positive news flow continues globally and ETH exceeds the kijun resistance at $1,755, it will be possible for the price to re-enter a strong uptrend. However, daily closes below the $1,527 level will confirm that the downtrend continues.
Supports 1,527 – 1,401 – 1,202
Resistances 1,755 – 2,001 – 2,589
XRP/USDT
XRP has faced significant selling pressure over the past week in the shadow of global macroeconomic developments, especially the re-escalating trade war and tariff tensions between the US and China. This selling pressure caused the price to retreat to the strong technical support at the $1.62 level. However, the short-term recovery process started with purchases in the bottom zone formed at this level. While uncertainties persisted across the market, corporate news flow from the Ripple front clearly reflected positively on pricing. The company’s acquisition of the brokerage firm Hidden Road, which offers international digital asset trading infrastructure, for $1.25 billion, created a serious divergence in XRP and the air of confidence in the market triggered prices to move upwards again. Following this development, XRP managed to exceed $1.98, a critical resistance level in technical terms. With the crossing of this level, the buying appetite strengthened further and the price movement, supported by technical indicators, continued with an uptrend that lasted until the $2.24 resistance towards the end of the week. However, this region was an area where strong sales came again, as it was a level that had been tested before and created intense selling pressure. As a result of these sales, the XRP price entered a correction process, albeit limited.
When technical indicators are analyzed in detail, it is noteworthy that there has been a significant change in XRP’s short-term outlook. The fact that it has regained the tenkan level, under which it has been priced for a long time, shows that the price has moved into a positive zone in terms of short-term momentum. On top of that, the re-breaking of the kijun level, which is an important reference point in wider time frames, can be considered as a signal of an important transformation in the technical structure. This structure formed by the Ichimoku indicator on the daily timeframe reveals that the market has started to generate upward signals in the direction of the trend and that a positive pricing structure has started in general terms. The Chaikin Money Flow (CMF) indicator, on the other hand, attracts attention by following a horizontal course in the positive zone. This indicates that the balance of buyers and sellers has been achieved at the levels where the price is located, that is, the amount of liquidity entering and leaving the market is balanced. Although this horizontal outlook does not pose a risk for the continuation of the uptrend, it indicates that the liquidity flow needs to strengthen again in order for the trend to accelerate. This state of balance in CMF can be seen as a stabilizing factor in maintaining the current positive structure. On the momentum side, it can be said that the Relative Strength Index (RSI) indicator gives a very healthy picture. The RSI, which rises in parallel with the price, continues its upward trend without showing any negative divergence. This is an important signal that momentum-based buying pressure continues, and the rise is based on technical fundamentals. The fact that the RSI is approaching the overbought zone, but has not yet reached it, suggests that the price may have more upside potential.
In light of all this technical data, the outlook on XRP has turned positive again. The improvement in the Ichimoku structure, the momentum increases in the RSI and the balanced liquidity outlook on CMF suggest that the uptrend is technically supported. In this context, if the $2.24 resistance level is broken during the week, the continuation of the uptrend may be on the agenda and in this scenario, the possibility of testing the $2.59 level as the next target is strengthened. However, in possible pullbacks, the $1.98 level stands out as the most critical support. If this level is broken downwards and daily closures occur below this region, the positive outlook may weaken, and a downward correction process may begin again. For this reason, price reactions in the band of $1.98 – $2.24 in the coming days for XRP will be a very critical threshold in terms of determining the short-term direction.
Supports 1.9867 – 1.7826 – 1.6294
Resistances 2.2436 – 2.5925 – 2.8251

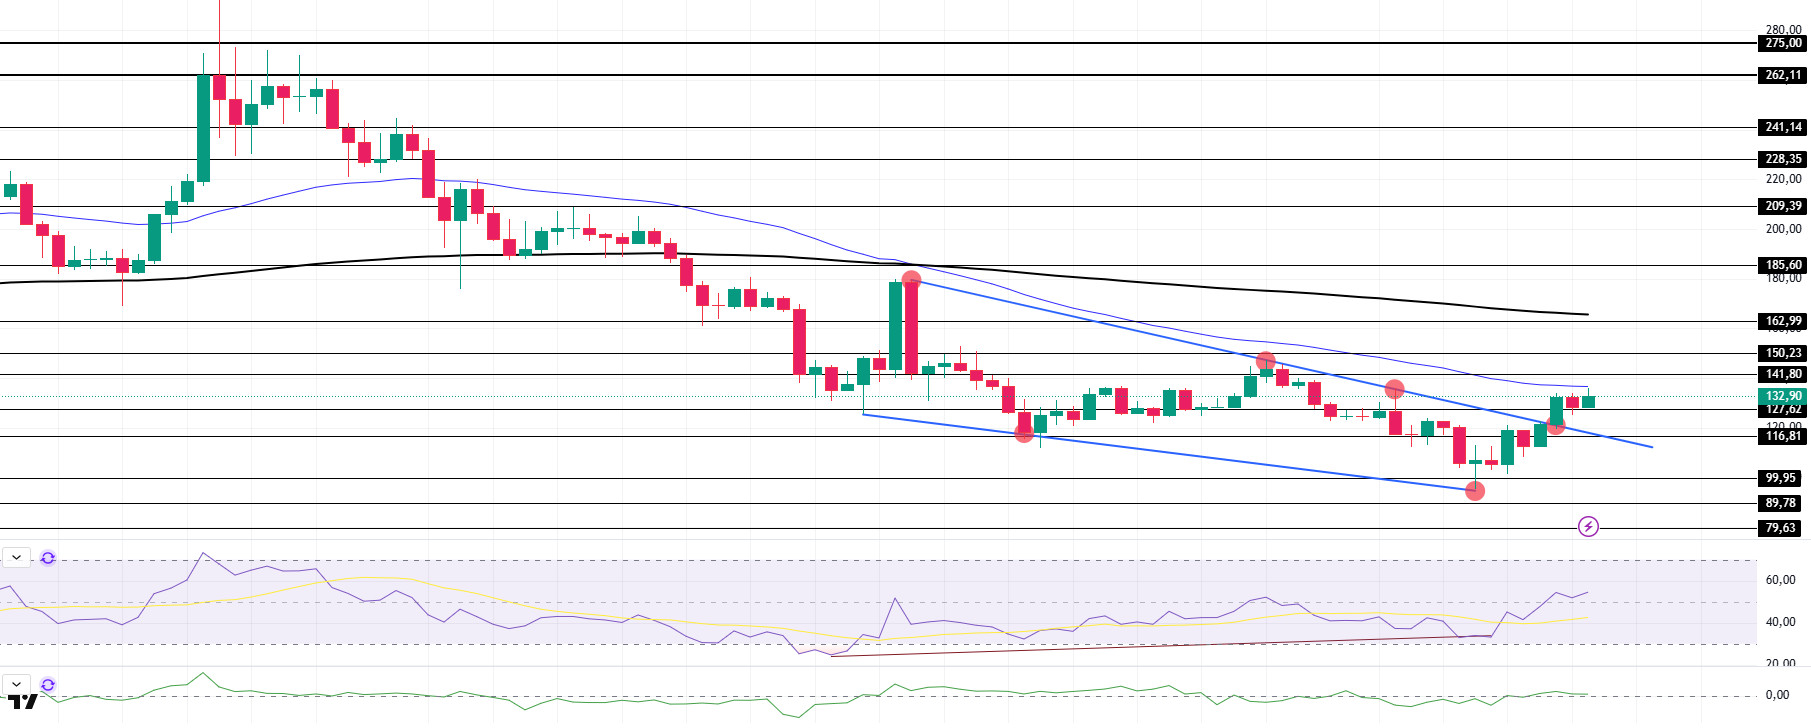
SOL/USDT
Last week in the Solana ecosystem.
- The SEC accepted the application of Fidelity Solana Fund.
- Solana developers have introduced “Confidential Balances”, a set of zero-knowledge token extensions to protect balances confidentially, transfer tokens and mint or burn assets.
- Grayscale Investments filed an S-1 form with the SEC to convert the Grayscale Solana Trust into an exchange-traded fund (ETF), now called the Grayscale Solana Trust ETF.
- fun is reintroducing live streaming to 5% of its users with a new moderation policy.
- Janover made its first $4.6 million SOL purchase under a new crypto treasury strategy and plans to start staking immediately to generate returns and support the network.
On the onchain side;
- The SOL price fell below $100, hitting a 14-month low.
- One whale address has staked 71,318 SOL stakes worth more than $7.63 million.
- Last week, more than $50 million worth of SOL tokens were unlocked.
- KAST launched the first M^0 Stablecoin in Solana.
- Stablecoins on Solana mostly increased after the minting of USDC in January.
With these developments, when we look technically at SOL, the local token of the network, it has risen by about 41% since last week. Breaking the downtrend that formed on March 3 on our daily chart, the asset is currently testing the 50 EMA (Blue Line) as resistance. If it breaks here, it may test the $162.99 level, which is a strong resistance. Otherwise, the $116.81 level should be followed. The asset is below the 50 EMA (Blue Line) and the 200 EMA, while the 50 EMA (Blue Line) continues to be below the 200 EMA (Black Line). With the death cross, the downward momentum may continue and cause the asset to fall further in the medium term. Relative Strength Index (RSI)14 has moved into positive territory. There is also a bullish mismatch. This may cause the price to rise further. When we examine the Chaikin Money Flow (CMF)20 indicator, it is close to the neutral level of the positive zone. Positive daily volume may push CMF higher. If the positive results in macroeconomic data and positive developments in the ecosystem continue, it may test the first major resistance level of $162.99. In case of negative macroeconomic data or negative news in the Solana ecosystem, the $116.81 level can be followed and a buying point can be determined.
Supports 127.62 – 116.81 – 99.95
Resistances 141.80 – 150.23 – 162.99
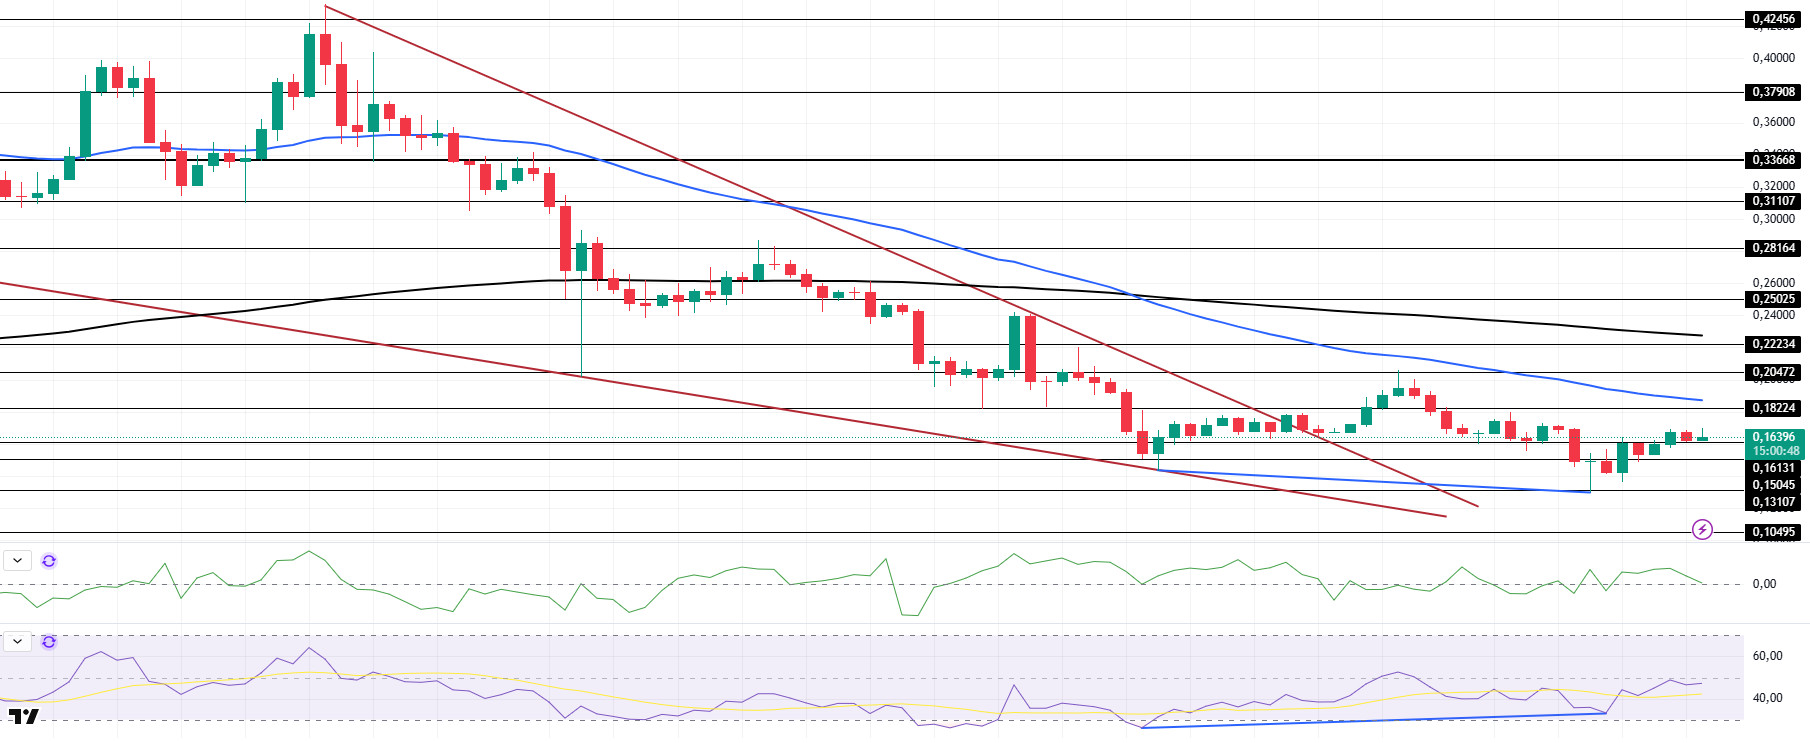
DOGE/USDT
- 21Shares has filed an S-1 application with the US SEC for the Dogecoin ETF. The asset manager is the third company to file for the DOGE ETF after Grayscale and Bitwise.
- Mark Uyeda examines the SEC’s digital asset frameworks affecting DOGE.
- 21Shares has listed the Dogecoin ETP backed by the Dogecoin Foundation on the SIX Swiss Exchange.
- House of Doge and 21Shares have partnered to launch Dogecoin ETPs globally. The Dogecoin Foundation’s partnership with 21Shares aims to transform Dogecoin into a trusted financial instrument for global investors.
On the onchain side;
- DOGE trades fell more than 94% in just one month, from 374,700 to 20,000.
- Whale wallets added DOGE 750 million in dips.
If we examine DOGE technically in the focus of all these developments, it showed an increase of about 24% when we look at the daily chart. Although the downtrend that started on March 3 continued on our daily chart, the asset, which tested the support level of $ 0.13107, accelerated from here and rose. It is currently struggling with selling pressure by managing to stay above the strong resistance level of $ 0.16131. The wedge pattern formed remains valid. On the other hand, the 50 EMA (Blue Line) remained below the 200 EMA (Black Line). In addition, the death cross pattern shows us that the downtrend continues. When we look at the Chaikin Money Flow (CMF)20 indicator, money outflows caused it to fall from the positive zone to the neutral level. Positive money inflows during the day indicate that price increases may start and CMF may move into the positive zone. Relative Strength Index (RSI), on the other hand, accelerated from the oversold level of 14 and found itself close to the neutral level. There is also a positive divergence. This could be a bullish start. In case of possible macroeconomic conditions and negative developments in the ecosystem, the $0.13107 level can be followed as a strong support. In case the retracement ends and the rises begin, the 0.20472 dollar level should be followed as a strong resistance place.
Supports: 0.16131 – 0.15045 – 0.13107
Resistances: 0.18224 – 0.20472 – 0.22234
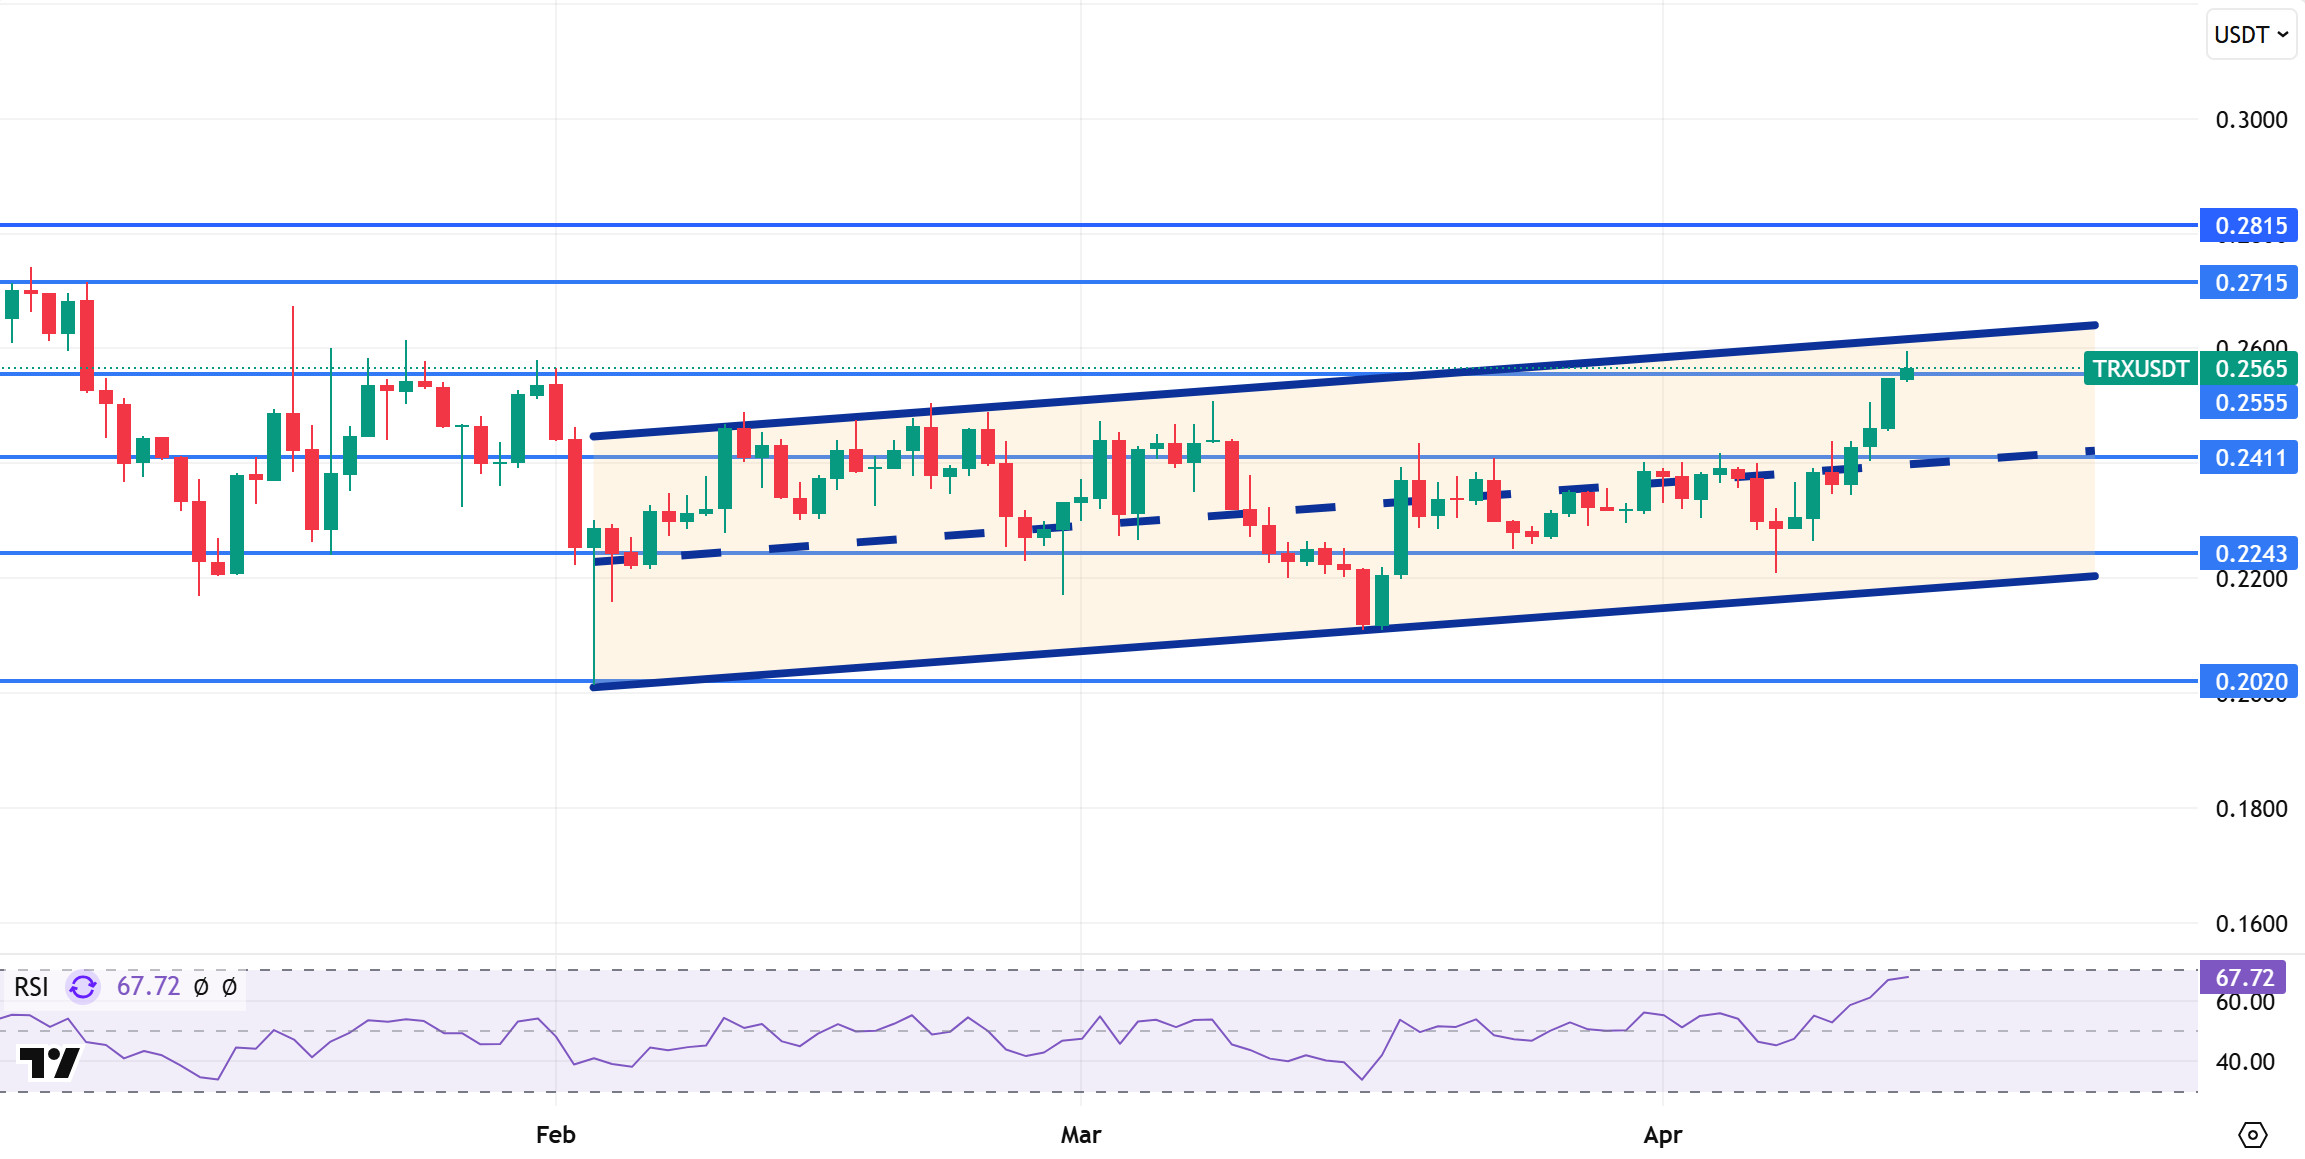
TRX/USDT
Last week, another 2 billion USDT was minted on the Tron network, bringing the amount of USDT in circulation on the network to $68.7 billion. Tron founder Justin Sun announced that the total number of accounts on the Tron network has reached 300 million and this is just the beginning. In addition, the Tron network’s 7-day total revenue last week was $ 14.03 million, and with this revenue, it continued to rank first among all networks. All these positive developments had a positive impact on the TRX price and thus TRX closed the week without loss.
TRX, which started last week at 0.2300, rose about 11% during the week and closed the week at 0.2548. TRX, which is currently trading at 0.2565, is in the upper band of the bullish channel on the daily chart. The Relative Strength Index has approached the overbought level with a value of 67 and can be expected to move towards the middle band of the channel by falling slightly from its current level. In such a case, it can be expected to test 0.2411 support. If it closes daily below 0.2411 support, it may continue its decline and may want to test 0.2243 support. If it fails to close daily below 0.2411 support, it may rise with the buying reaction that may occur. In such a case, it may test the 0.2555 and 0.2715 resistances. As long as it stays above 0.2020 support on the daily chart, the bullish demand can be expected to continue. If this support is broken, selling pressure may increase.
Supports 0.2411 – 0.2243 – 0.2020
Resistances: 0.2555 – 0.2715 – 0.2815
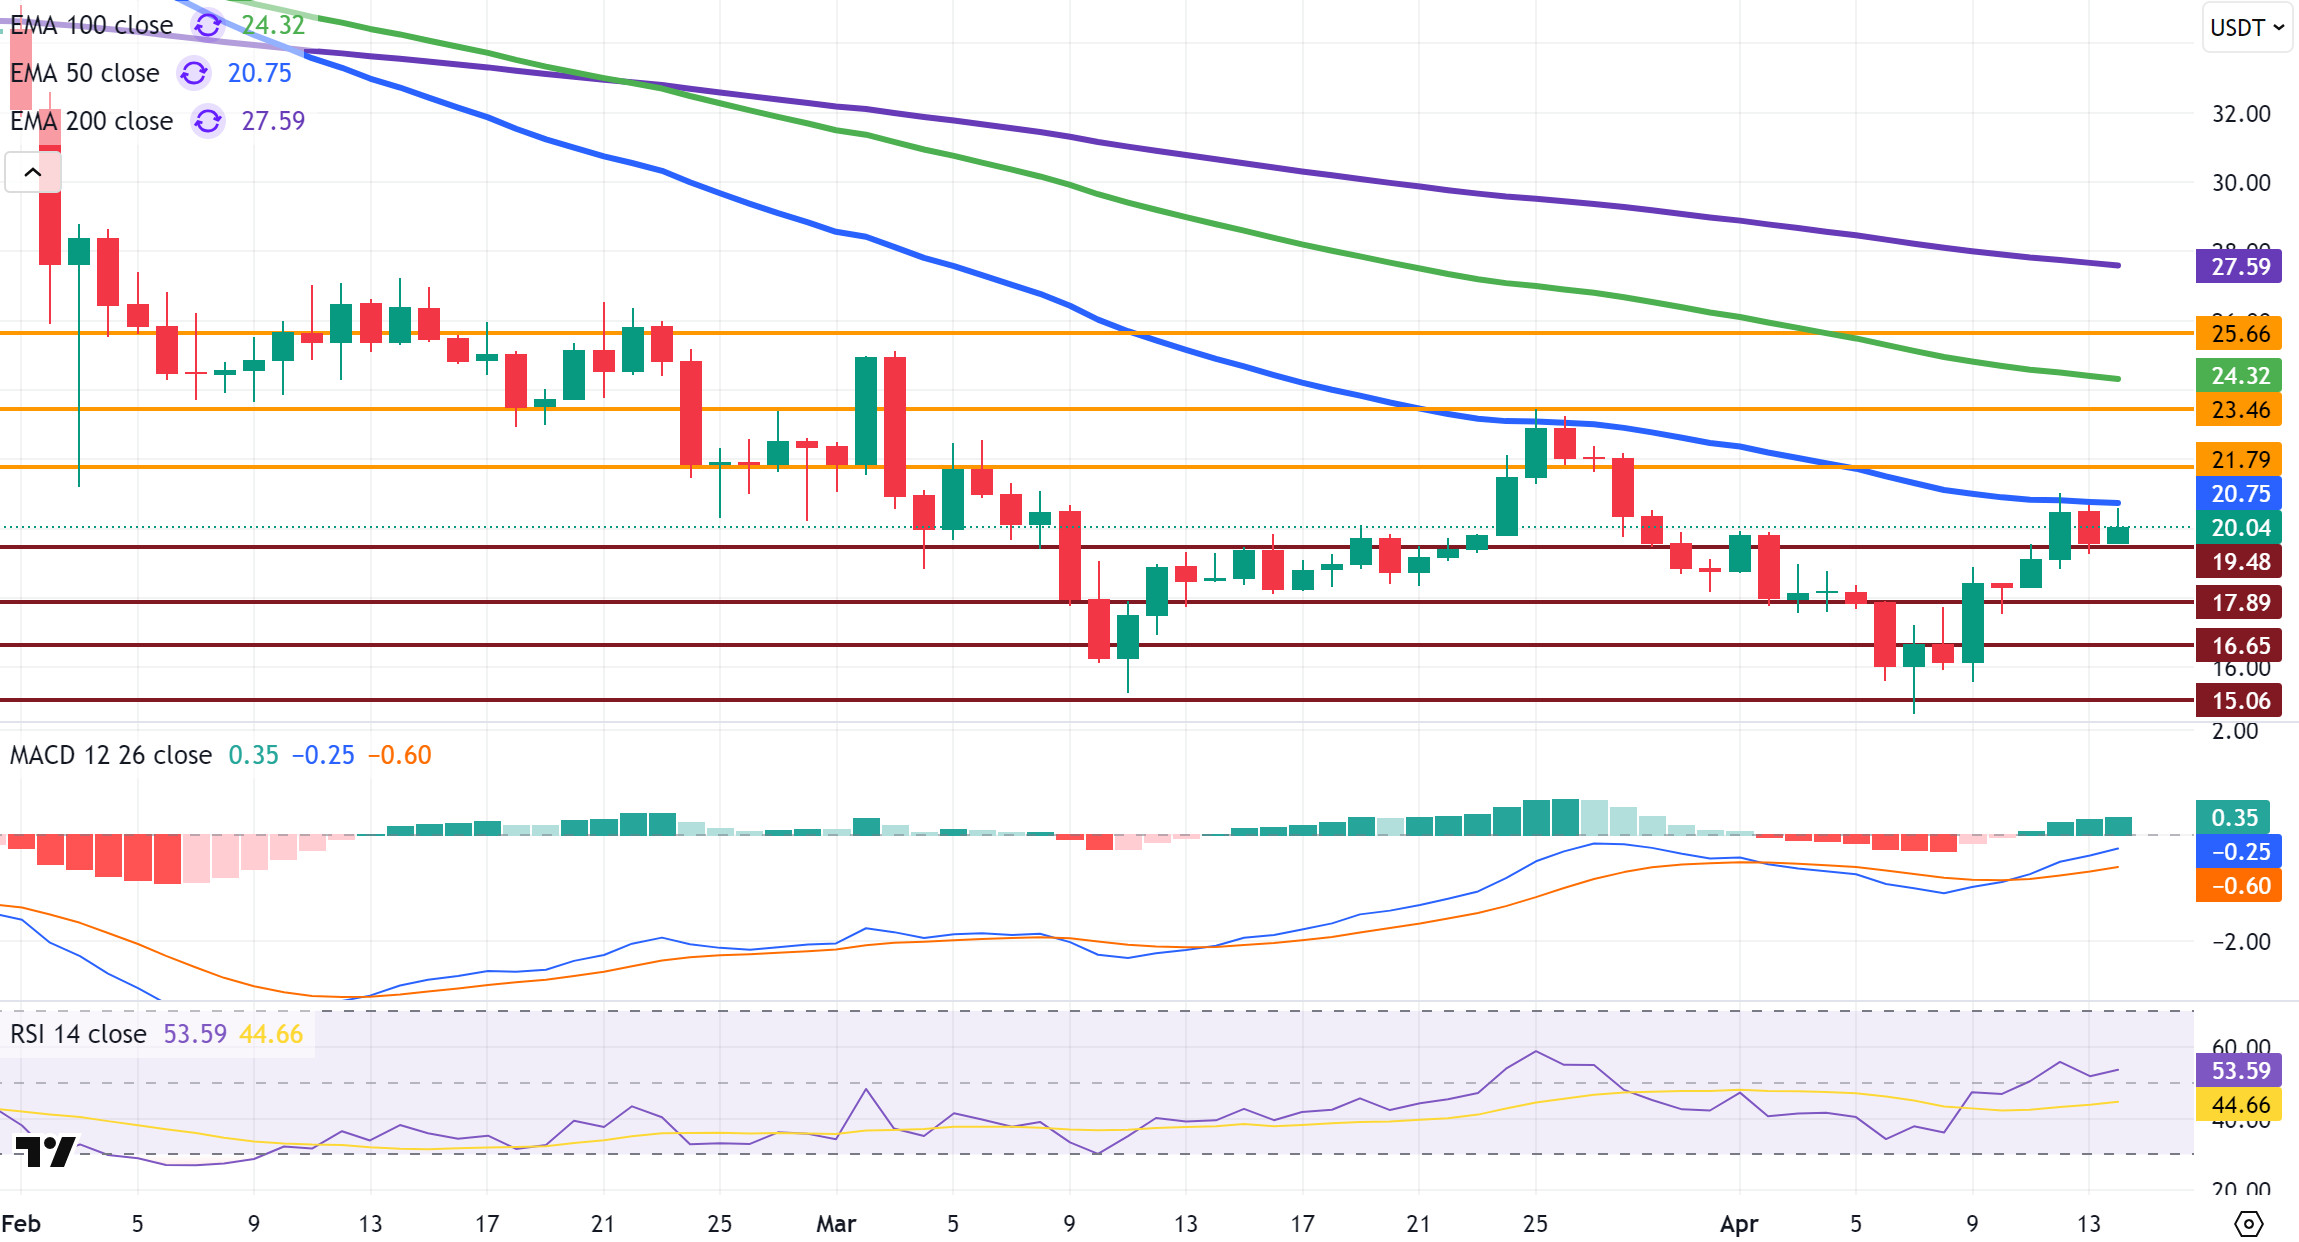
AVAX/USDT
After starting last week at $16.03, AVAX rose as high as $21.00 thanks to the positive atmosphere created by macroeconomic developments. AVAX, which tested the 50-period Exponential Moving Average (EMA50) level during this rise, failed to break this resistance and fell, and the weekly close was realized at $ 19.57. Starting the new week with a rise, momentum in AVAX maintains its positive outlook. However, attention is focused on the macroeconomic developments between the US and China this week. These developments may play a decisive role on the direction.
On the daily chart, the MACD (Moving Average Convergence/Divergence) line has produced a positive signal by crossing the signal line upwards. This intersection can be considered as a recovery signal. The Relative Strength Index (RSI 14) is currently slightly above the neutral zone at 53.59, signaling positive momentum. However, AVAX is still trading below all EMA levels. However, it is consolidating just below the EMA50 level. A daily close above this level could lead to bullish momentum in the short term. In terms of the overall technical outlook, momentum is positive on AVAX.
In AVAX, which started the new week with a rise, if the positive news flow continues and a daily close above the EMA50 level is made, it may break the $ 21.79 resistance and rise to $ 23.46 and $ 25.66 levels, respectively. Positive technical signals on MACD and RSI support this scenario. However, if AVAX is negatively affected by macroeconomic developments and continues to stay below the EMA50 level, the $19.48 support may be retested first. In case of a downside break below this level, a retracement to $17.89 and then to $16.65 may occur as selling pressure increases.
(EMA50: Blue Line, EMA100: Green Line, EMA200: Purple Line)
Supports 19.48 – 17.89 – 16.65
Resistances 21.79 – 23.46 – 25.66
SHIB/USDT
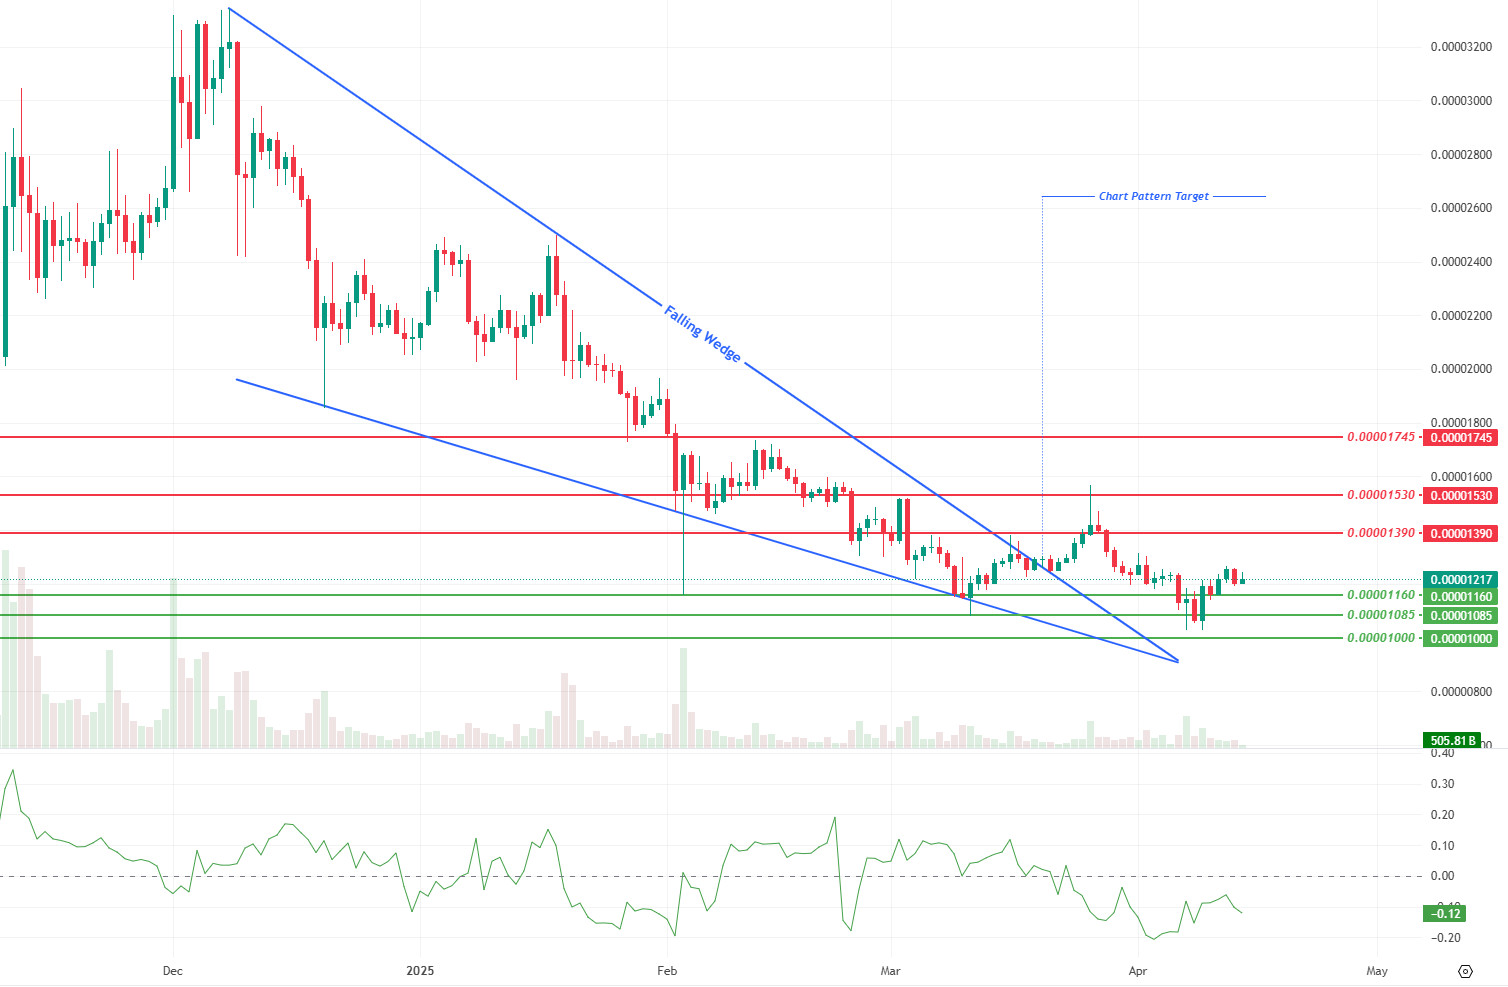
Shiba Inu’s daily burn rate increased by 984%, with 16.94 million SHIB tokens removed from circulation, bringing the total burn to 410.74 trillion. Developer Kaal Dhairya announced that rollup technology will be deployed to increase scalability in the new phase of the project, while FHE (Fully Homomorphic Encryption) infrastructure, which provides advanced encryption on the privacy side, will be evaluated. On the other hand, regulatory clarity is still waited for the stablecoin SHI, which is planned to be included in the SHIB ecosystem.
The Shiba Inu (SHIB) price rebounded from the support level of $0.00001085 this week and has been sustained above the $0.00001160 level. While there has been a noticeable increase in volume and momentum, volatility has decreased. This shows that buyers are entering the market in a controlled manner and the price is in search of stability. However, as the CMF (Chaikin Money Flow) is still in the negative zone, it is seen that the inflow of money into the market remains limited and investor confidence has not been fully achieved. In the short term, maintaining the 0.00001160-dollar level is critical for the continuation of the rise. If the persistence above this level continues, the 0.00001390-dollar level may come back to the agenda as the next resistance. Otherwise, if downward pressures increase again, the 0.00001085-dollar level will again be monitored as critical support.
Supports 0.00001160 – 0.00001085 – 0.00001000
Resistances 0.00001390 – 0.00001530 – 0.00001745
LTC/USDT
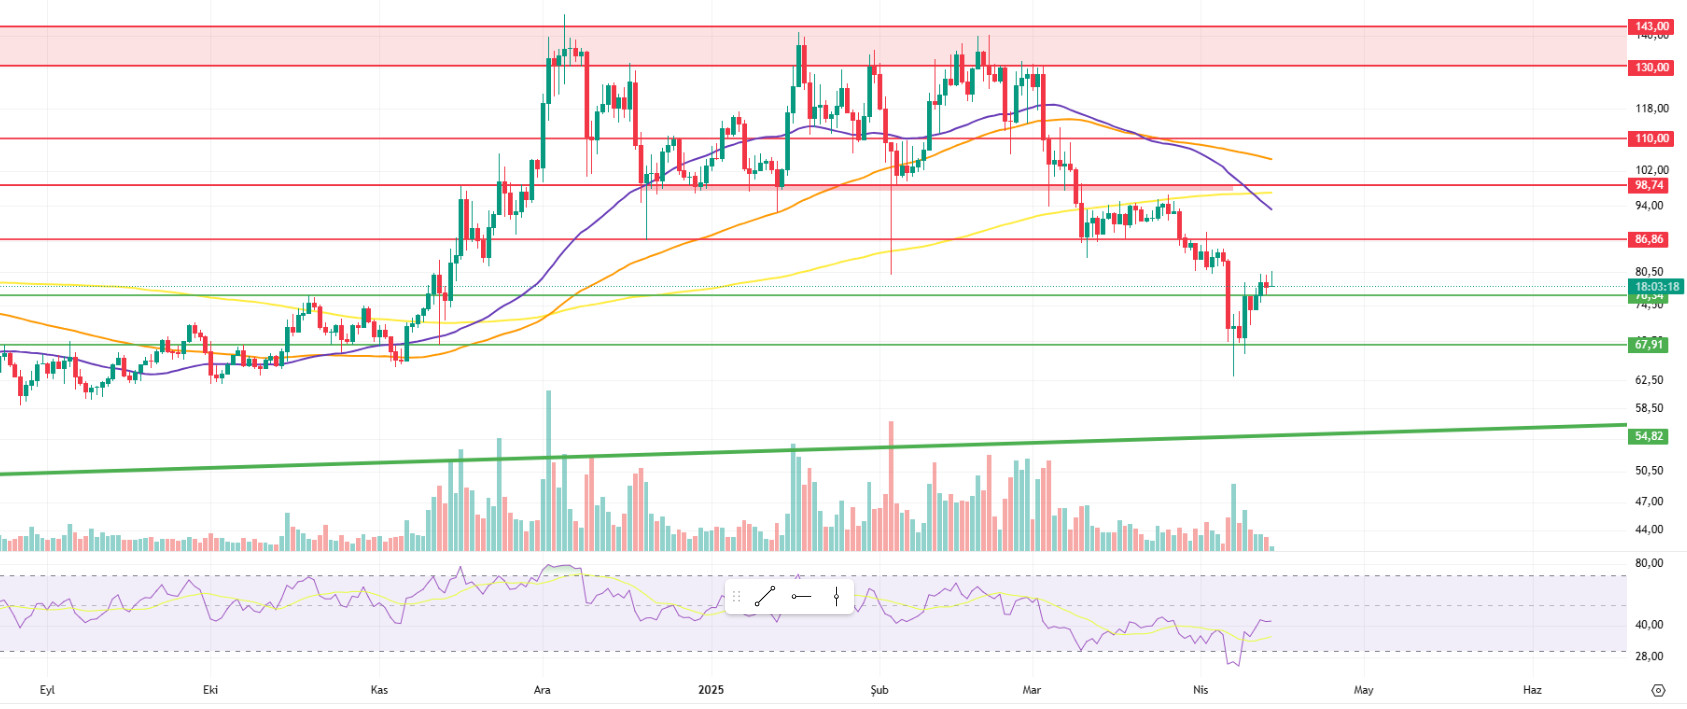
Litecoin started this week at 77.85, up 10.24% over the past week. In this process, LTC gained 3.11% compared to Bitcoin. With a market capitalization of $5.90 billion, Litecoin moved up 4 places to 20th place in the market rankings. Futures open interest increased by $16 million to $205 million earlier this week, while funding rates remain positive.
On Litecoin’s daily chart, the price continues to remain below the 50-period moving average (purple line / MA50), 100-period moving average (orange line / MA100) and 200-period moving average (yellow line / MA200), while continuing below the 50-period moving average on the weekly chart indicates the continuation of the downward trend. On the other hand, the appreciation against Bitcoins last week and moving higher in the market stand out as positive signals.
With the negative pressure not being able to be overcome and the pullbacks in Bitcoin continuing, the first of the important support levels for Litecoin is located at 76.34. Then another horizontal support at 67.91 is our local bottom from the last decline, which is likely to become a point where we can find support in the possible declines ahead. Finally, it should not be missed that the uptrend passes through 54.95 and this is an area that is likely to receive a reaction in possible sharp declines.
In the event of a rebound in Bitcoin, Litecoin is likely to follow suit. In this scenario, the broken support at 86.86 can be expected to work as resistance. Subsequently, the major resistance at 98.74 is expected to be a level where selling pressure will increase in upward movements. In the continuation of the rise, the position at 110.00 can be expected to face very high selling pressure.
Resistances 86.86 – 98.74 – 110.00
Supports 76.34 – 67.91 – 54.95
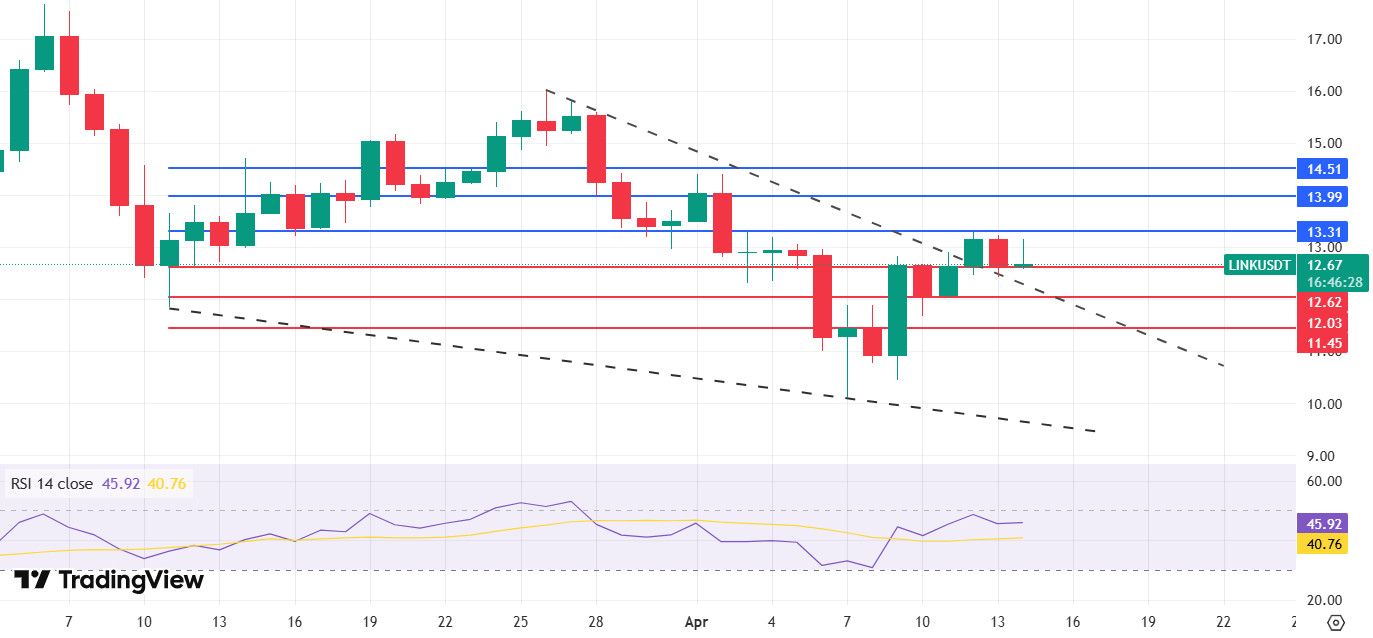
LINK/USDT
LINK broke the resistance zone of the descending wedge pattern on April 12, testing the 13.31 level, then retreated and is currently holding just above the 12.62 support. If the 12.62 support is broken, selling pressure may increase and the price may retreat towards the 12.03 and 11.45 support zones respectively.
On the other hand, in the event of a reaction from current levels, the price is likely to test the 13.00 psychological resistance first. If LINK holds above this level, the upside momentum could gain strength and take the price to the pattern target of $16. However, there are sequential targets that need to be crossed first, namely the 13.31, 13.99 and 14.51 resistance zones. The RSI (Relative Strength Index) indicator is at 45.92. This indicates that the market is close to the neutral zone. In the general outlook, the price staying above the pattern structure will strengthen the positive expectation, while retracing back into this structure may intensify the selling pressure.
Supports 12.62 – 12.03 – 11.45
Resistances 13.31 – 13.99 – 14.51
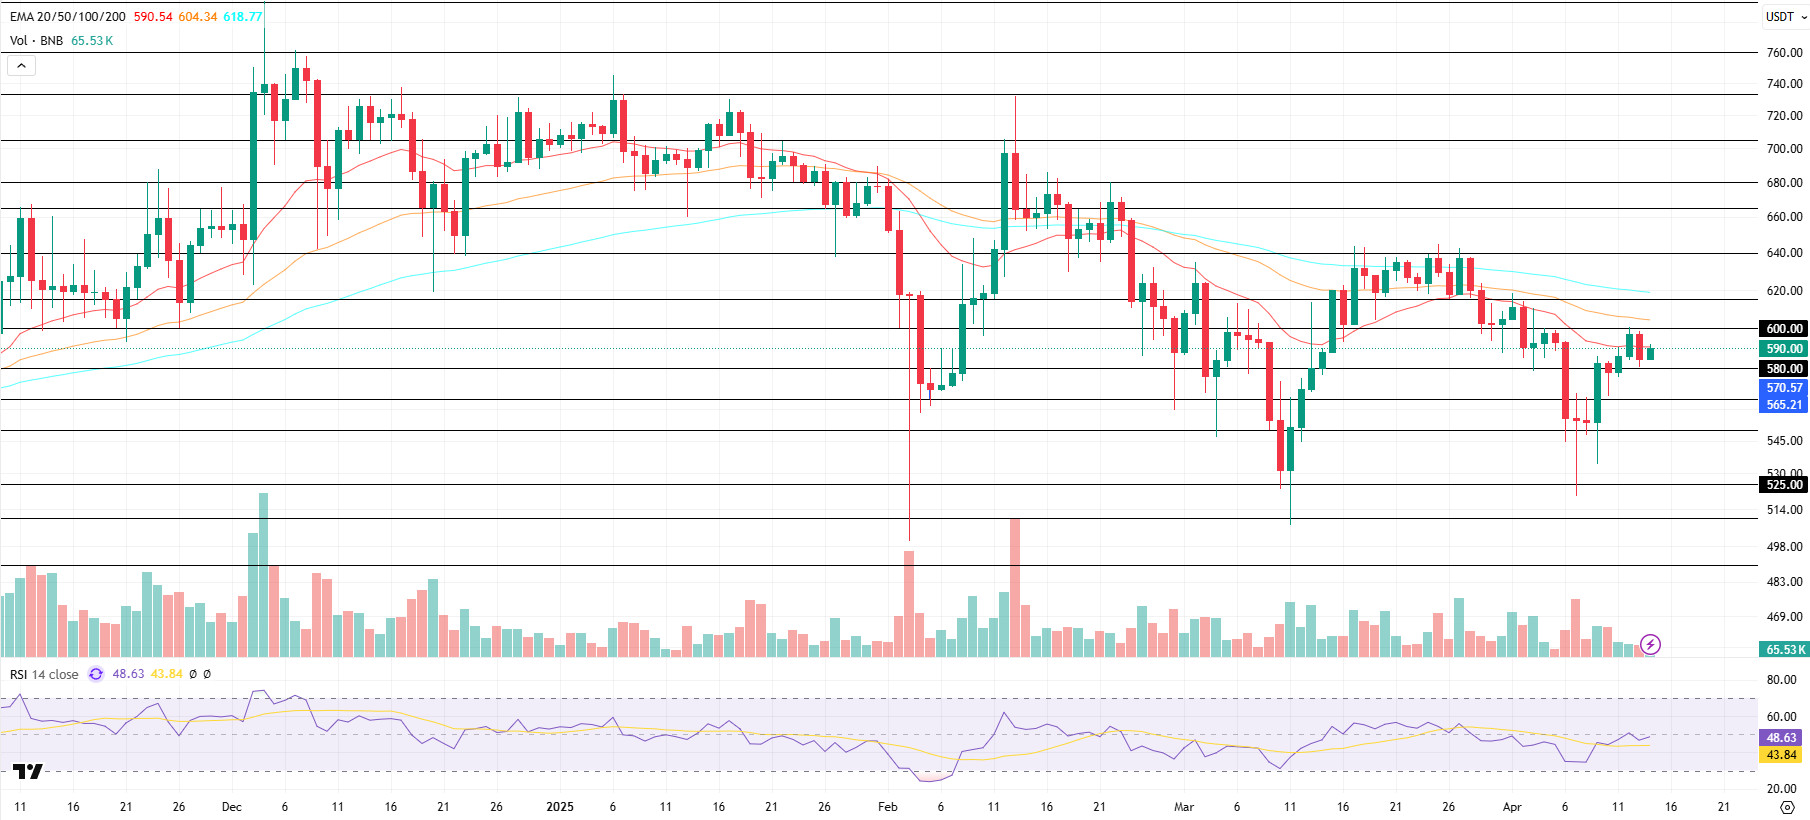
BNB/USDT
New projects are planned to be listed in the BNB ecosystem this week. These listings can be expected to have an overall positive impact on the BNB price as they increase the demand for BNB used in transaction fees and create supply constraints with the increase in the BNB stake ratio.
Technically, at the beginning of last week (Monday, April 7), BNB/USDT, which rose to $ 600 with the support it received from the $525 level, entered a retracement process with the pressure it saw from these levels. So much so that in the last two days, it started to retreat with increasing selling pressure at the $ 600 level and continued to be priced below (EMA 20: Red line, EMA 50: Orange line, EMA 100: Blue line).
BNB/USDT, which showed a positive trend at the start of the new week, is currently trading in the $580-$600 band. In terms of technical indicators, the break below the EMA 20 (red line), EMA 50 (orange line) and EMA 100 (blue line) levels indicates that the overall negative outlook continues. Volume indicators, on the other hand, have displayed a generally weak outlook, especially in the last four days. This suggests that some selling pressure on the asset continues. On the other hand, the RSI indicator has also fallen below the 50 level in line with the price movements and continues to remain below this level. The continuation of the RSI at these levels indicates that downward pressure may continue.
Within the framework of the current technical outlook, if the positive momentum at the beginning of the new week continues, the price is expected to rise to the $ 600 level first. If this level is broken upwards, the $615 and $640 levels stand out as the next resistance zones. On the other hand, if a strong resistance is encountered at the $ 600 level, it is possible that the price may fall back to the $ 580 level. If the $580 support breaks downwards, the $565 and $550 levels will be followed as the next support areas.
Supports 580 – 565 – 550
Resistances 600 – 615 – 640
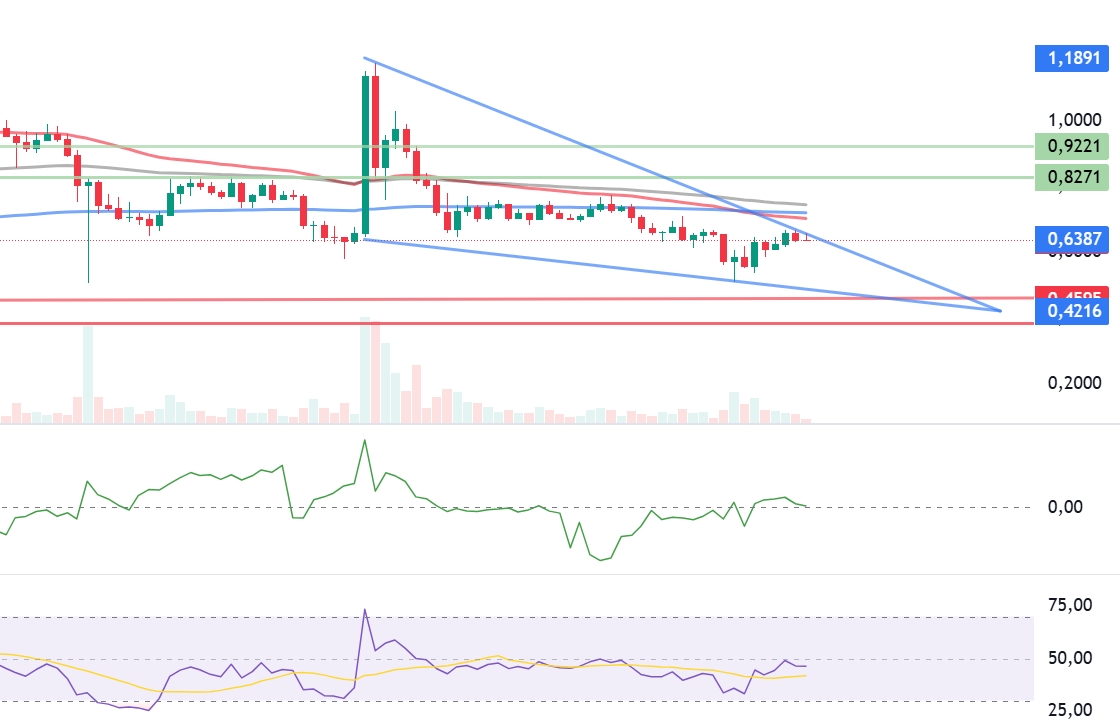
ADA/USDT
Since the beginning of the week, retaliatory tariffs between the US and China have caused volatility in the market, leading the price of ADA to rise. US tariffs on China reached 145% with the latest hike. Cardano gained 17.74% in a week to 0.6425.
When we look at the technical chart, ADA recovered with the reaction it received with the announcement of tariffs on April 9. Since the beginning of the week, it shows that buyers have entered the market in a controlled manner and the price is looking for stability. However, it remains in the blue zone of the falling channel trend and the 200 EMA (Blue line) remains below the 100 EMA (Black line). CMF (Chaikin Money Flow) is close to negative territory, indicating that money inflows to the market remain limited and investor confidence is not fully restored. However, the Relative Strength Index (RSI)14 rose to the upper level of the negative zone. If the uncertainty in the markets increases and risk appetite decreases, it may retest the $0.4654 support level and the $0.4216 support level. If these support levels are broken, the decline could deepen. Cardano founder Charles Hoskinson announced plans for a major airdrop of the Midnight sidechain project during Paris Blockchain Week on April 9. On this date, the trend reversal with the Death Cross began, with the 200 EMA (Blue Line) and 50 EMA (Red Line) staying above the $0.6673 level, testing the resistance level of $0.6538. The price continued the week with a noticeable increase in momentum, holding above the $0.6350 level. If this uptrend continues, 0.7134 and 0.8271 levels may be tested. If the price reaches these resistance levels, a potential bullish opportunity may arise if momentum increases.
Supports: 0.4595 – 0.4216 – 0.3707
Resistances 0.7134 – 0.8271 – 0.9221
LEGAL NOTICE
The investment information, comments and recommendations contained in this document do not constitute investment advisory services. Investment advisory services are provided by authorized institutions on a personal basis, taking into account the risk and return preferences of individuals. The comments and recommendations contained in this document are of a general type. These recommendations may not be suitable for your financial situation and risk and return preferences. Therefore, making an investment decision based solely on the information contained in this document may not result in results that are in line with your expectations.
