
Weekly Technical Analysis Report
BTC/USDT
It was a relatively quiet week for the markets. After the tension between Israel and Iran, eyes turned to legislative work, while the Trump-backed “Great and Beautiful” bill passed the parliament. While Elon Musk’s “Party of America” initiatives signaled a crypto-friendly approach, Trump’s stance on this issue has begun to harden. On the institutional investor front, companies such as Strategy, Metaplanet, Smarter Web Company and The Blockchain Group continue to purchase Bitcoin regularly. In mid-July, the House of Representatives will take up three important crypto bills, and we will follow important developments for the markets during the month.
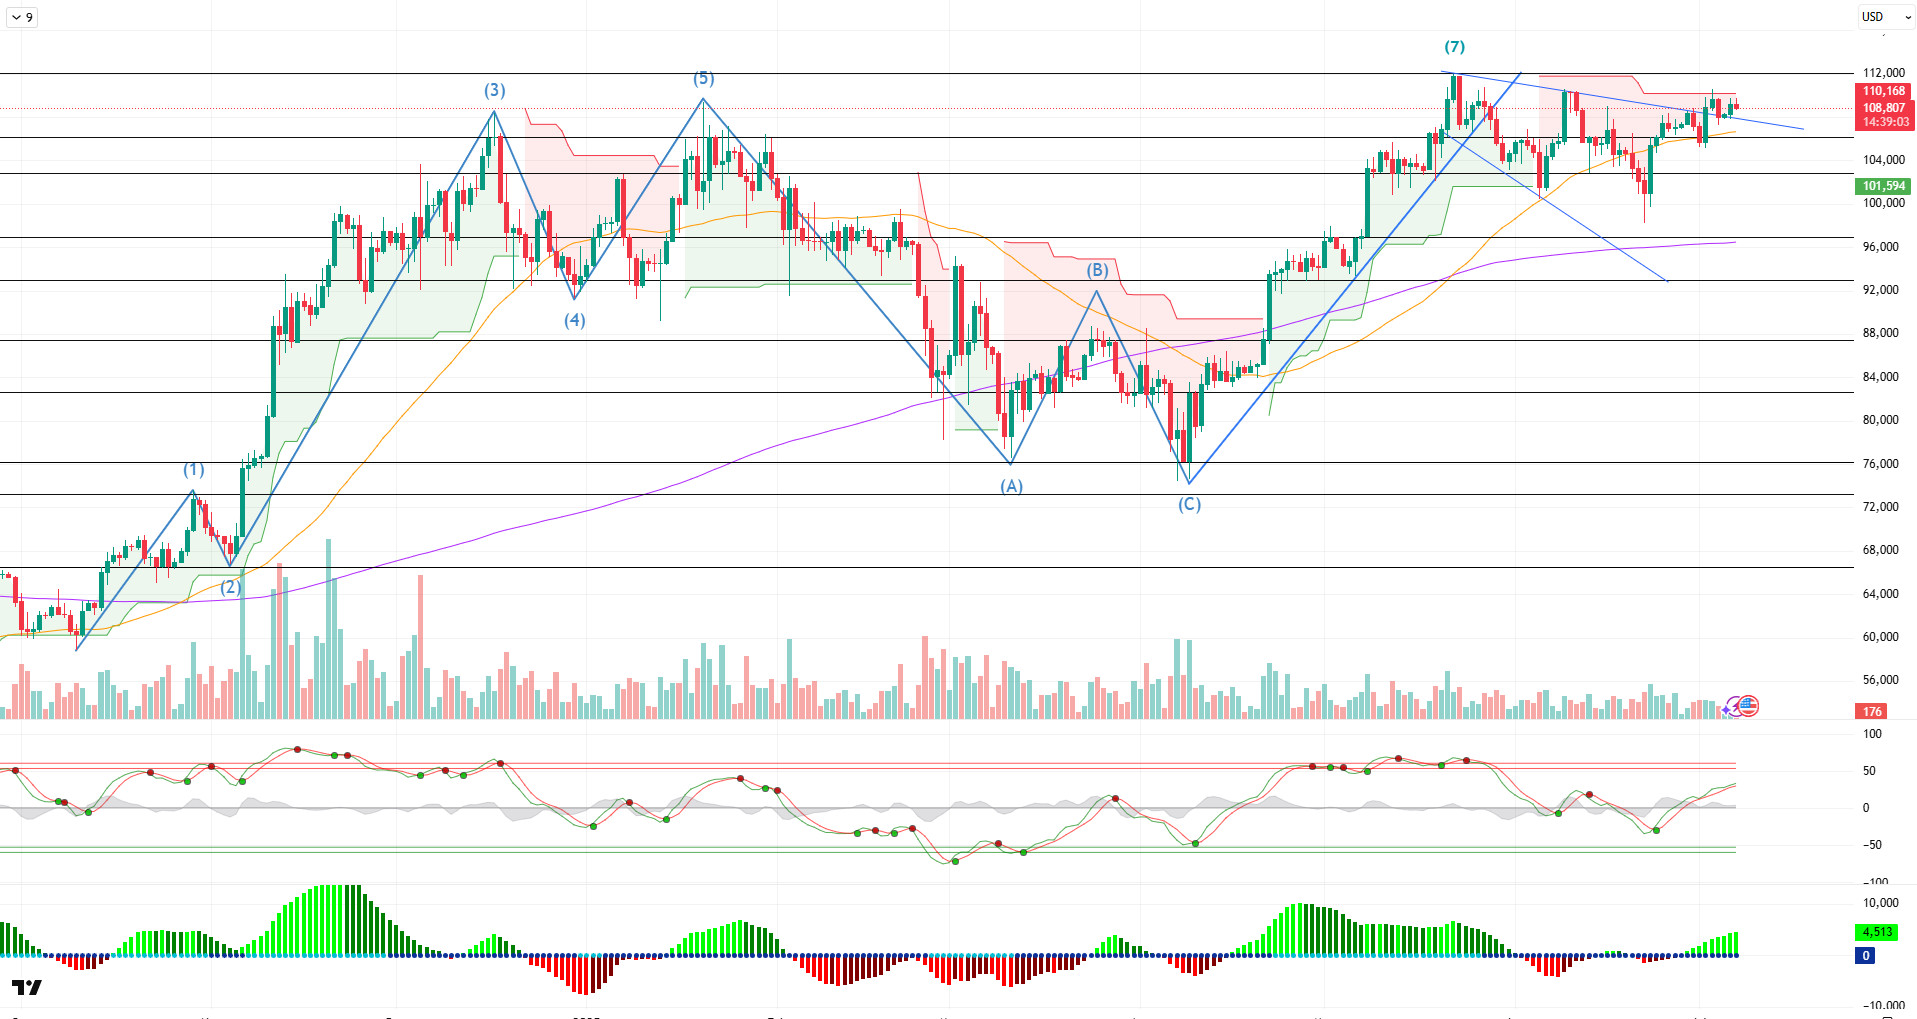
After all these developments, when we look at the daily technical outlook, it is seen that BTC entered into a falling wedge pattern after the peak at the 7th point it reached with the golden cross structure, and after declining within this structure, it recovered again and crossed the upper line of the formation. BTC, which started the week at 107,000 levels, recorded a cumulative increase and reached 109,000 levels. With this rise, it is preparing to close around 2%.
Looking at the technical indicators, the WT oscillator is moving towards the overbought zone on the daily, while the SM indicator is providing momentum support in the positive zone. On the other hand, the moving averages show that the golden cross structure continues as the 50-day SMA crosses the 200-day SMA upwards.
When the weekly liquidity data are analyzed, the sparseness of buy and sell positions is noteworthy, and although it is seen that some sell-side transactions were liquidated with the bullish movement, it is seen that the accumulation continues at 110,600. The 106,000-107,000 band stands out as the area where buying positions are accumulated.
In general, while the technical structure continues in line with the favorable ground created for the rise, fundamental developments continue to support pricing. Liquidity data may show that short-term volatility and the wavelength of the market may continue in the 106,000 – 110,000 band. While the lack of new catalysts continues in the continuation of the rise, legislative work in the coming days may pave the way for the ATH level in terms of pricing. In a possible bearish scenario, the 105,000 level will continue to be followed as a reference point.
Supports: 105,000 – 102,800 – 100,000
Resistances 109,000 – 110,000 – 111,970
ETH/USDT
The passage of the “Great and Beautiful” bill in the US last week and the emergence of Elon Musk’s attempts to establish a new political party called the “American Party” in the same period were among the developments that attracted attention, especially in the cryptocurrency markets. Musk’s announcement that this new party would adopt a crypto-friendly approach created a positive atmosphere in the market, albeit short-term, and this paved the way for slight increases in ETH prices.
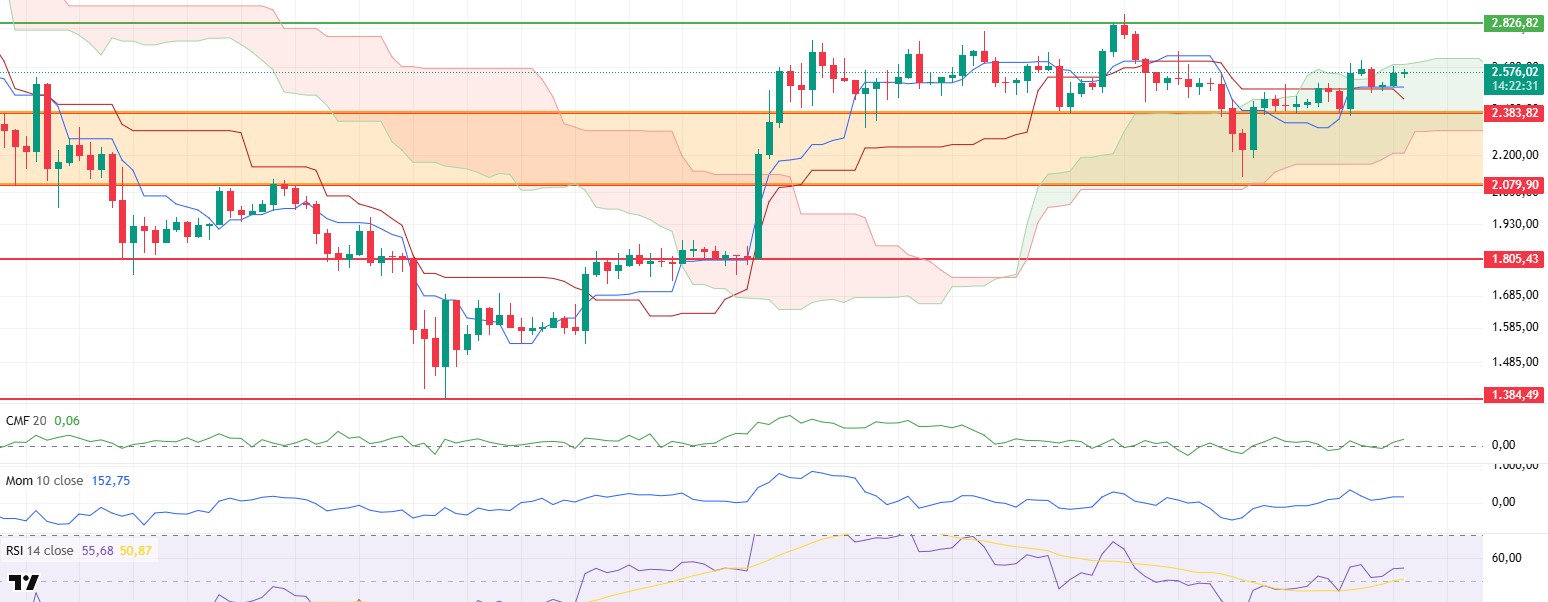
Analyzing the price action, it can be seen that last week, ETH retreated to the supply zone marked by the orange zone on the chart and fell as low as $2,375. However, with buying from this support zone, the price rallied to the upper band of the kumo cloud on the daily timeframe. Simultaneously with this technical reaction, the fundamental data of the Ethereum ecosystem also showed an upward trend. In particular, Ethereum’s staking metrics experienced a remarkable increase in this process. Total Value Staked data continued its upward trend in recent weeks, reaching 35.80 million ETH from 35.52 million ETH. This increase stands out as important data in terms of showing that investors continue to lock their assets on the network and have a positive long-term expectation. At the same time, upward movements are observed in both open interest and funding rate indicators. The increase in these two metrics reveals that investors and short-term traders are focusing on bullish positioning in ETH and that the market is expecting an upward breakout.
On the technical indicators side, one of the most striking elements was the structure of the Chaikin Money Flow (CMF) indicator. The fact that CMF moved back into positive territory and maintained its upward trend in this region indicates that liquidity inflows to the market have increased significantly and this may put upward pressure on price movements. This outlook supports that investor confidence is strengthening and buying activity is gaining momentum.
On the momentum side, Relative Strength Index (RSI) and other momentum indicators show a horizontal – positive structure. In particular, the RSI’s persistence above both the 50 threshold value and the based MA line can be considered as a technical signal indicating that the upside potential is strengthening.
Technical readings on the Ichimoku indicator also highlight the general positive structure. The fact that the price is moving above both the tenkan and kijun levels, and especially the tenkan line cutting the kijun level upwards, supports the current bullish trend. However, in order for this positive structure to gain confirmation, the upper band of the kumo cloud at $ 2,615 must be broken upwards. This level stands out as a critical resistance point in the short term. Daily closures above this level may lead to the start of a new uptrend.
In general terms, both technical indicators and on-chain data strengthen the possibility of an upward movement in the ETH price. If the current structure is maintained, it seems possible that the price may rise to the level of $ 2,826 in the coming days. However, in order for this scenario to remain valid, the $2,383 level must be maintained. A daily close below this level may weaken the technical structure and pave the way for sharp downward movements.
Supports 2,383 – 2,079 – 1,805
Resistances 2,826 – 3,130 – 3,533
XRP/USDT
Ripple Labs CEO Brad Garlinghouse recently announced on social media platform X that the company has officially applied to the US Office of the Comptroller of the Currency (OCC) for a “national bank charter”. Garlinghouse emphasized that if this license is approved, Ripple will be subject to regulatory oversight at both federal and state levels and will contribute to strengthening the trust environment, especially in the field of stable cryptocurrencies. This development is very important as it could directly affect the perception of institutional investors towards XRP.
On the market pricing side, XRP has been on a gradual positive trend over the past week, breaking through the critical resistance threshold at $2.24. With this move, the price entered the kumo cloud of the ichimoku indicator and started testing the area that previously served as resistance. This technical breakout can be considered as one of the first signals that the upward trend is gaining strength.
A closer look at the technical indicators shows that the Chaikin Money Flow (CMF) indicator not only crossed into positive territory but also rose sharply. This activity indicates that the amount of liquidity entering the market has increased significantly and the buying volume has strengthened. This structure of CMF is supported by the upward momentum in the Cumulative Volume Delta (CVD) spot data. This increase in CVD is an important element that confirms that buyers have become dominant and that there is real volume behind the rise.
On the Ichimoku indicator side, the daily closing of the price above the lower band of the cloud and the tenkan line cutting the kijun level sharply upwards indicate that the short-term downtrend has ended and has been replaced by a recovery trend. However, in order for this positive structure to gain confirmation, it is critical to exceed the upper band of the kumo cloud at the level of $ 2.35. Daily closes above this level will show that the uptrend has clearly started.
It is also seen that the rise in the Relative Strength Index (RSI) indicator accompanies the price movement. The fact that the RSI is moving towards the overbought zone and does not show any negative divergence in this process reveals that the price increase has a healthy structure and the short-term rise is technically supported. However, the increase in momentum is another indicator that confirms that this positive structure is sustainable.
In general terms, if the price breaks both the upper band of the ichimoku cloud and the falling trend line shown in dark blue on the chart to the upside, there is a strong possibility that the positive trend will officially start and the price will rise to the $2.60 level. In order for this scenario to remain valid, the $ 2.24 level remains important. If this level is broken down, it is likely that the bullish structure will be disrupted and sharp retracements will be experienced.Top of the FormBottom of the Form
Supports 2.2436 – 2.0196 – 1.7826
Resistances 2.3576 – 2.5925- 3.1969

SOL/USDT
Last week in the Solana ecosystem;
- Firedancer started transferring shares to Solana validators.
- REX Shares launched the first US Solana staking ETF ($SSK), promising returns through on-chain staking, which is about to receive SEC approval if no further objections are raised.
- Some centralized exchanges have launched tokenized Coinbase and Nvidia stocks on Solana.
- PancakeSwap launched v3 liquidity pools on Solana.
- DeFi Development launched a $100 million private convertible bond offering to acquire Solana. It also announced the purchase of an additional 17,760 SOL tokens. It increased its convertible bond offering to $112 million.
- The Jito Foundation made a live upgrade to its TipRouter program, enabling Solana validators to distribute priority fees directly to shareholders.
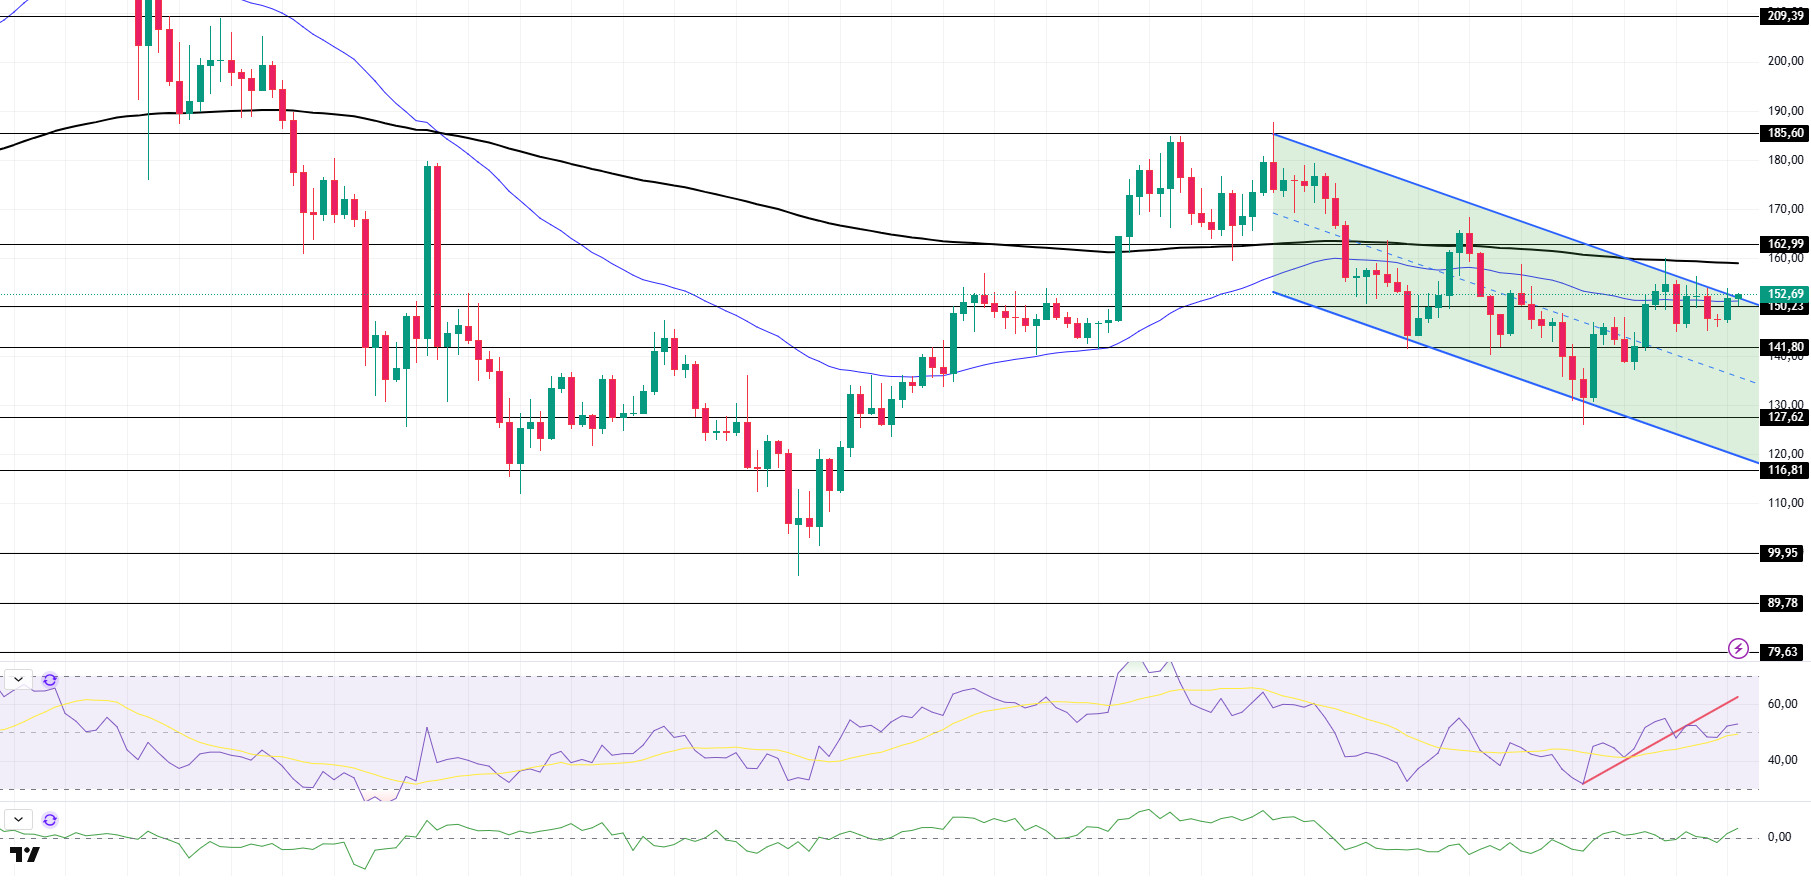
SOL price moved sideways this week. It accelerated to the top of the downtrend that began on May 23 and is currently testing the 50 EMA (Blue Line) moving average as resistance and the 50 EMA (Blue Line) as support. It may rise up to $ 162.99 price levels on above-trend candle closures. If it fails to break the trend ceiling and continues its in-trend movement, the $ 127.62 level should be followed.
The asset is trading between the 50 EMA (Blue Line) and 200 EMA (Black Line) moving averages, indicating that the asset is in the decision phase. Moreover, the fact that the 50 EMA continues to remain below the 200 EMA indicates that a “death cross” formation continues from a technical perspective. This suggests that bearish potential remains in the medium term. Although the RSI (14) is in positive territory, selling pressure is building. In addition, it is now below the uptrend that started on June 22. This may mean that the decline may begin. Chaikin Money Flow (CMF-20) moved back into positive territory; the increase in money inflows may push the CMF-20 indicator to the upper levels of the positive zone. If the macroeconomic data remains positive and the developments in the ecosystem remain positive, the first major resistance point of $162.99 may be retested. Conversely, in case of possible negative news flow or deterioration in macro data, the $127.62 level can be monitored as a potential buying opportunity.
Supports: 150.23 – 141.80 – 127.62
Resistances: 162.99 – 185.60 – 209.39
DOGE/USDT
SEC postpones decision on 21Shares spot Dogecoin ETF.
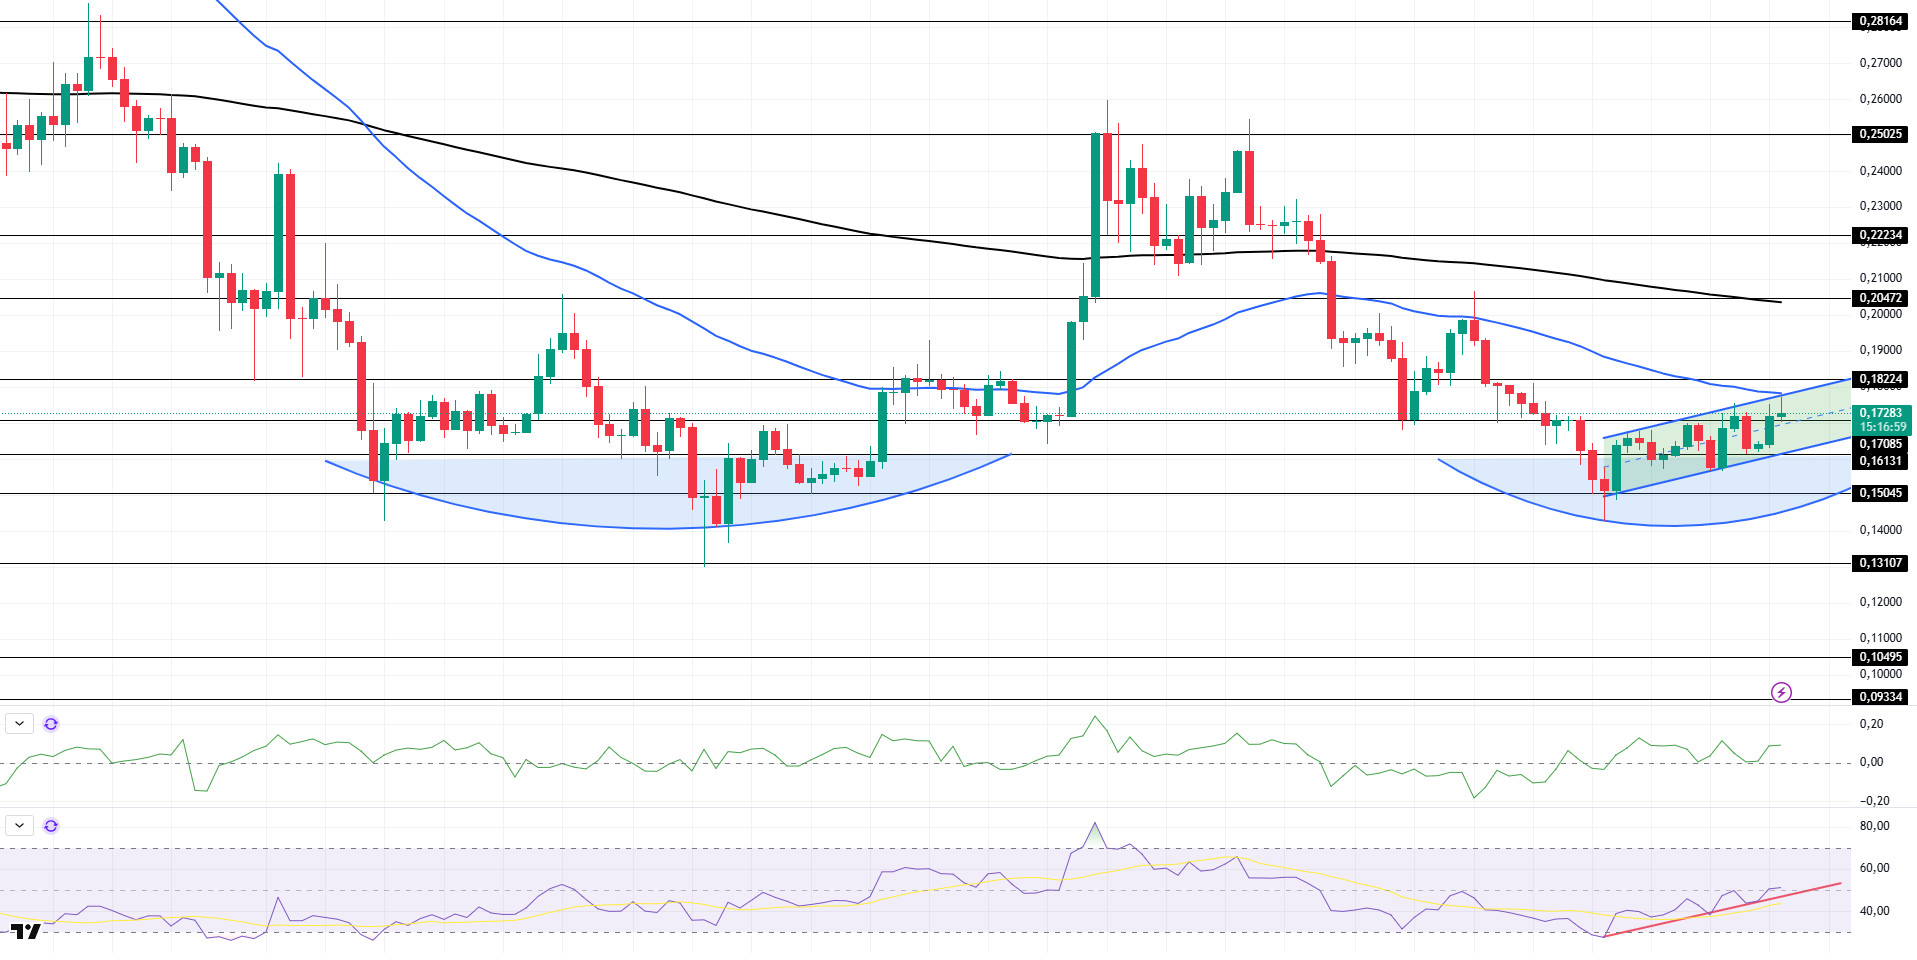
DOGE has moved sideways on the daily chart since last week. Starting on June 22, the asset remains within the uptrend and is currently testing the top of the trend and the 50 EMA (Blue Line) as resistance. In addition, a double bottom formation has formed. If the uptrend continues, it may test the 200 EMA (Black Line) as resistance. On the other hand, there is a falling pennant pattern. This may trigger a pullback. In case a pullback starts, the ceiling level of the uptrend may work as support.
The asset continued to remain below the 50 EMA and 200 EMA (Black Line), suggesting that the death cross pattern remains valid. This suggests that bearish pressure may continue in the medium term. The Chaikin Money Flow (CMF-20) indicator rose to neutral. Money inflows continue to increase. This may move the CMF-20 into positive territory. The Relative Strength Index (RSI-14) indicator is at the neutral level and has remained above the uptrend since June 22. This could mean that the uptrend could continue. In case of macroeconomic risks or negative news from the ecosystem, the $0.15045 level can be monitored as a strong support. On the other hand, the $0.18224 level stands out as the first strong resistance level if the upward movement gains strength.
Supports: 0.17085 – 0.16131 – 0.15045
Resistances: 0.18224 – 0.20472 – 0.22234
TRX/USDT
There was a development that can be considered as an indication that institutional interest in Tron has started to increase. SRM Entertainment completed its $100 million TRON treasury launch and staked 365 million TRX.
During the week of June 30 – July 6, 2025, a total of 47.2 million TRX was burned on the TRON network. Thus, the circulating supply decreased by 19.9 million. The decrease in circulating supply continues to put deflationary pressure on TRX. In addition, the total number of addresses increased by 1.22 million to 318.1 million in the same week.
Over the past week, the TRON network generated a total revenue of $81.7 million, making it the highest revenue-generating ecosystem among all blockchain networks. This level of revenue is directly correlated with the high transaction volume observed on the TRON network, the increase in total locked assets (TVL), the continuity in the number of daily active addresses, and the intensity of user transactions on DeFi protocols.
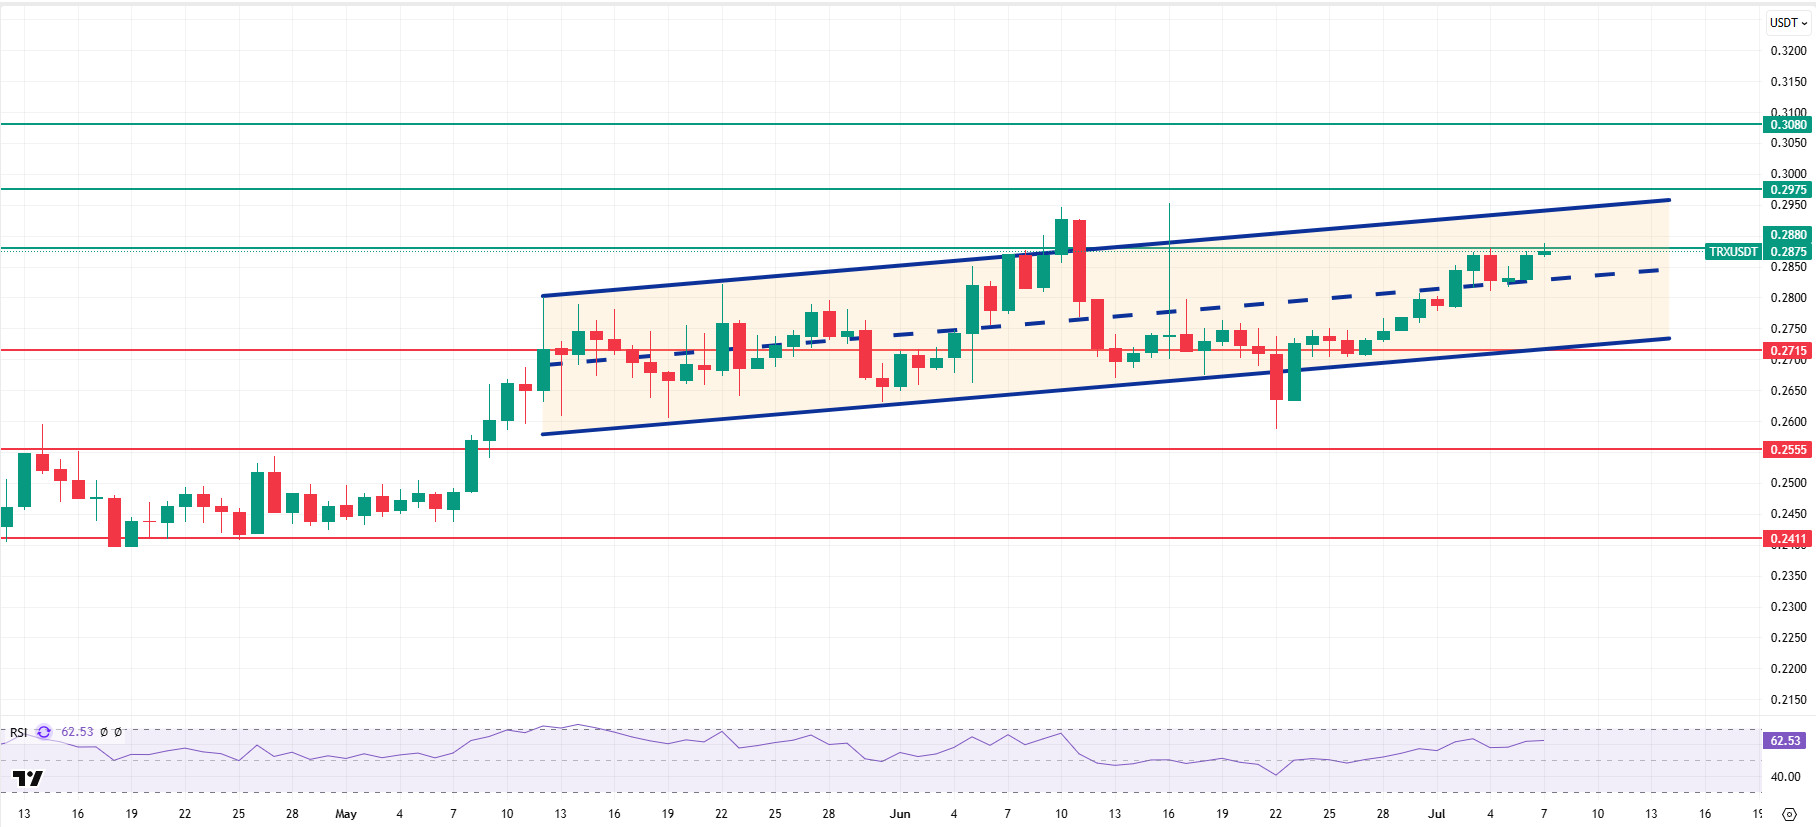
TRX, which started last week at 0.2769, rose about 3.5% during the week and closed the week at 0.2869. TRX, which is currently trading at 0.2875, is in the bullish channel on the daily chart and is just above the middle band of the channel. The Relative Strength Index (RSI) value has approached the overbought zone at 62 and TRX price can be expected to move slightly higher from these levels and move towards the upper band of the bullish channel. In such a case, it may test 0.2975 resistance. If it closes above 0.2880 resistance on a daily basis, it may test 0.2975 resistance and break the bullish channel upwards. If it fails to close daily above 0.2880 resistance, it can be expected to decline with the selling pressure that may occur in this region. In such a case, it may test 0.2715 support. On the daily chart, 0.2411 is an important support and as long as it stays above it, bullish appetite can be expected to continue. If this support is broken, selling pressure may increase.
Supports 0.2715 – 0.2555 – 0.2411
Resistances 0.2880 – 0.2975 – 0.3080
AVAX/USDT
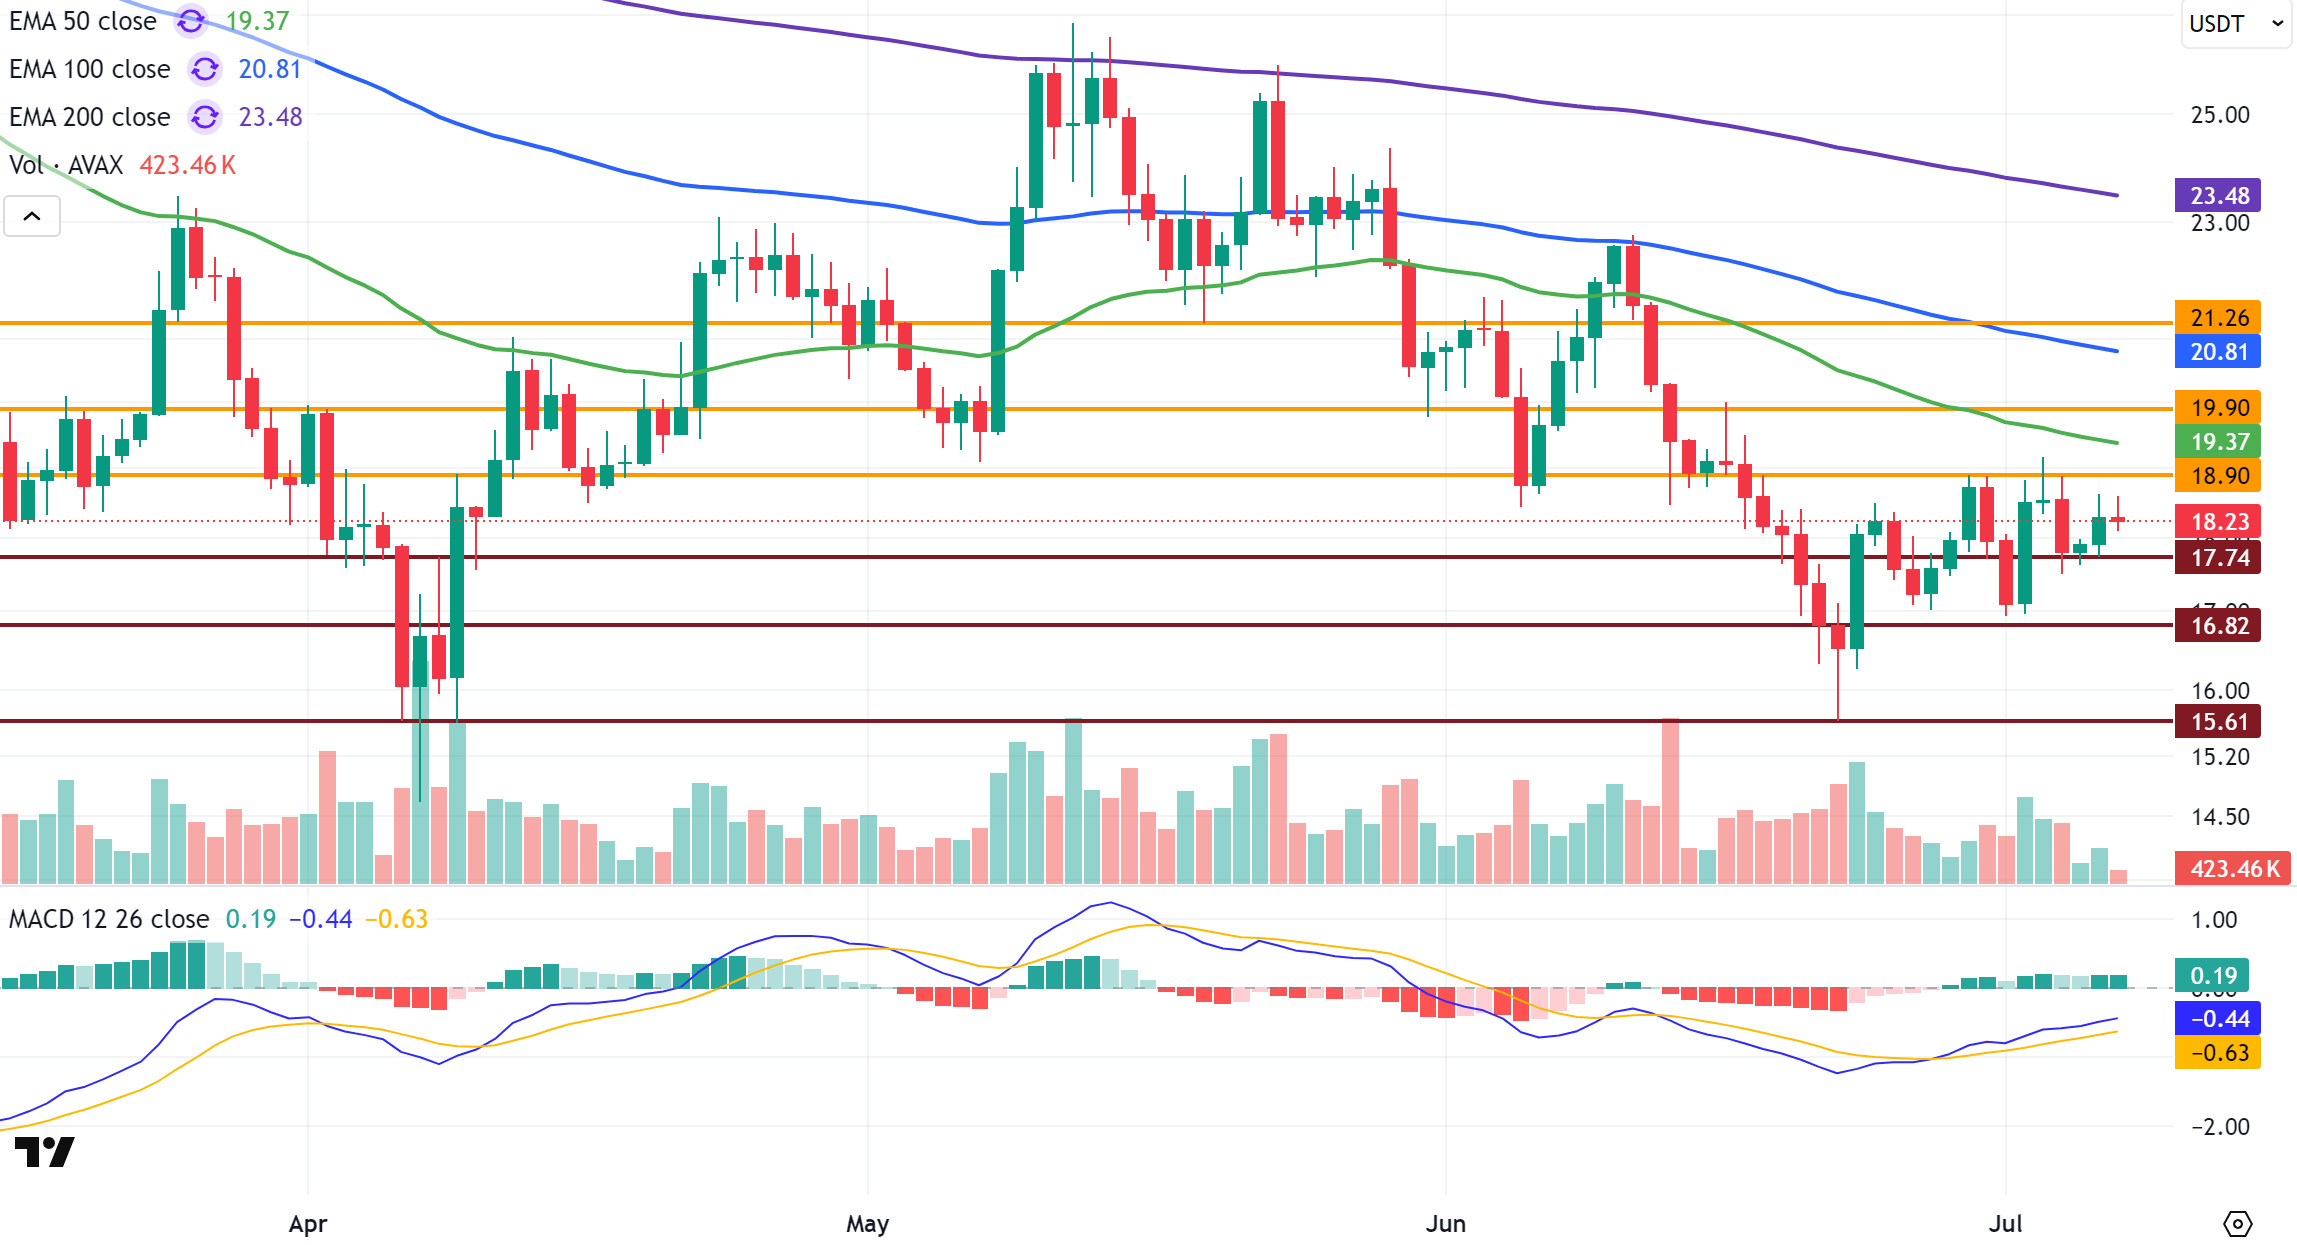
AVAX, which started last week at $ 18.73, closed the week at $ 18.28. It lost about 2.4% of its value on a weekly basis. During the week, AVAX tested the $ 18.90 resistance level several times in its rise, but could not break this level in its rise. AVAX’s inability to find sufficient volume and momentum support in its rise caused the rise to remain limited, while AVAX fell with the subsequent sales and fell to the support level of $ 16.82. AVAX, which recovered again with purchases in this region, closed last week in a band that can be considered horizontal. Although the easing of geopolitical pressure on global markets and crypto assets has started a recovery trend in the markets in general, persistence above Exponential Moving Average (EMA) levels seems to be essential for AVAX to sustain upward movements. Especially the EMA50 level is very critical for the short-term outlook.
On the daily chart, the Moving Average Convergence/Divergence (MACD) indicator continues to trade above the signal line but is in negative territory. This suggests that positive momentum is gradually building but is not yet strong enough to support the upside. If momentum remains weak, upside movements in AVAX risk remaining limited as it was last week.
AVAX’s upward break of the EMA50 level and the $ 19.90 resistance in the coming period and the persistence above these levels may turn the technical outlook in a positive direction. Especially for a positive outlook, persistence above the EMA50 level is required. If this scenario is realized, EMA100 and then EMA200 levels will come to the agenda as the first target. However, if AVAX continues to stay below these levels, downward pressure may occur again. In this case, if the downward breakout continues after the $ 17.74 support level, the $ 16.82 and $ 15.61 levels may be retested.
(EMA50: Green Line, EMA100: Blue Line, EMA200: Purple Line)
Supports 17.74 – 16.82 – 15.61
Resistances 18.90 – 19.90 – 21.26
SHIB/USDT
Attempts to reduce the total supply of Shiba Inu accelerated significantly this week. In recent days, the burn rate has increased by 10.786%, leading to the permanent removal of approximately 9.5 million SHIB tokens from circulation. This acceleration in the burn process, combined with the high rates recorded in recent weeks, has had a significant constraining effect on the total supply. The project’s deflationary approach, coupled with the gradual reduction in supply, has reinforced the perception of long-term scarcity among investors. On-chain data reveals that despite this, the majority of investors continue to hold their positions at a loss. The fact that about 88% of investors are still holding their purchases in negative territory indicates that there is no large-scale profit-selling pressure at this stage. This contributes to a relatively stable outlook in price movements and balanced liquidity. On the other hand, expectations within the community regarding the impact of the increase in burn rates on prices have increased. If these developments on the supply side become permanent, it is likely to create a more positive perception in market psychology and strengthen the value recommendation of the project.
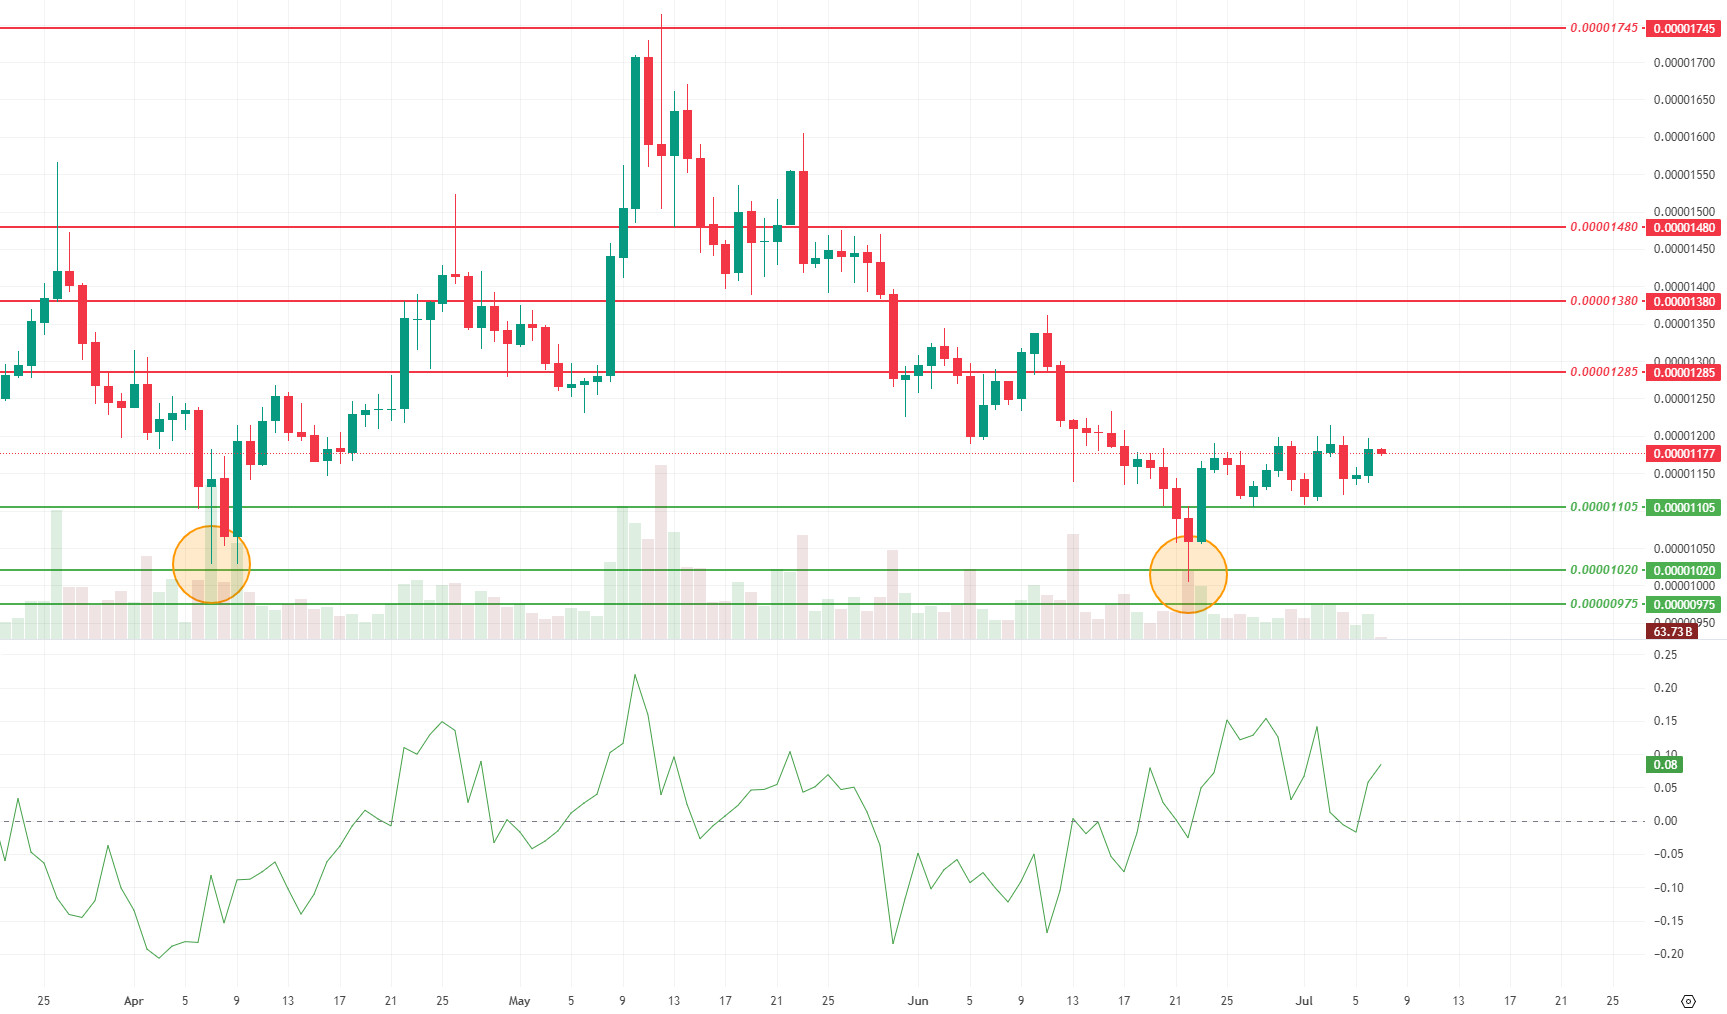
When we analyze the technical side, it is seen that the indicators that support the buying trend in the Shiba Inu price movement this week stand out. The increase in momentum and trading volume reveals that the buy side has gained significant strength in the market, while low volatility paves the way for the price to move in a more stable upward trend. This outlook indicates that buyer interest remains alive at current levels and the price is reacting upwards from support zones. Although the price’s recovery from the $0.00001105 level to around $0.00001170 is considered a positive signal in the short term, the possibility that the upward movement may remain limited if volatility remains low should not be ignored. The fact that the Chainkin Money Flow (CMF) indicator is in the positive zone confirms that capital flows continue to be predominantly in the direction of buying. If this trend is maintained, it seems possible that the price will gradually gain strength and develop a movement towards the first resistance level of $ 0.00001285.
On the other hand, if momentum weakens and trading volume declines, selling pressure may increase. In such a scenario, the price may retreat again and test the 0.00001105 dollar zone, which stands out as the first support level. As of the general outlook, the trading volume and the sustainability of buyer interest continue to be the main factors that will determine whether the price can maintain its balanced structure.
Supports 0.00001105 – 0.00001020 – 0.00000975
Resistances 0.00001285 – 0.00001380 – 0.00001480
LTC/USDT
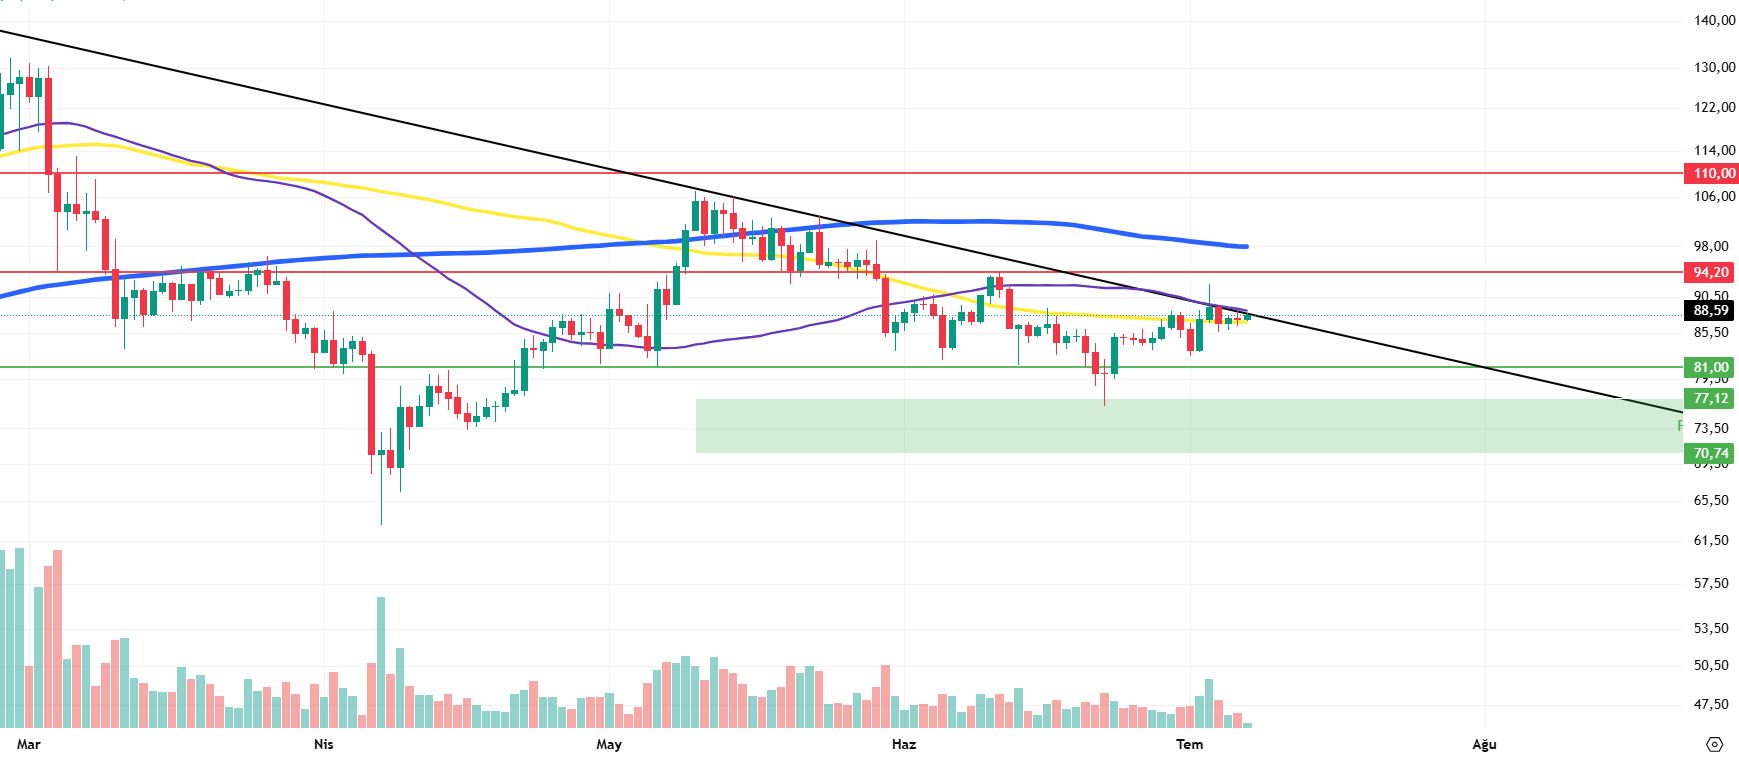
Litecoin (LTC) started the new week at 87.35, closing last week with a 0.69% decline. The market capitalization of LTC, which also lost 1.6% against Bitcoin in this process, continues to hover around $6.68 billion and is ranked 21st in the crypto market, down 1 place. This shows that Litecoin is keeping pace with the general market movements. On the futures side, there was an increase of about 10 million dollars in open positions compared to last week, and the total amount of open positions increased from 264 million dollars to 274 million dollars. Funding rates, on the other hand, remain positive.
As of this week, Litecoin is trading below the 50-period moving average (purple) and 200-period moving average (blue) and above the 100-period moving average (yellow). This technical structure suggests that the price continues to remain under pressure, but this pressure has been partially pierced . If the price succumbs to pressure again, the first stop can be expected at 81.00. Then there is the first potential support point of the fibonacci support zone at 77.12 and the last support level at 70.74. A reaction can be expected from this (green area) depending on the speed of the decline.
On the upside, the first resistance level can be expected as the horizontal downtrend at 88.59 and the 50-day moving average near the same level. In case this downtrend ends, the first upside target can be expected at 94.20. If this level is exceeded quickly, the expectation that the movement to the 110.00 level will begin will strengthen. In this process, it should not be neglected that the 200-day moving average between the two levels is likely to create selling pressure.
Resistances 88.59 – 94.20 – 110.00
Supports 81.00 – 77.12 – 70.74
LINK/USDT
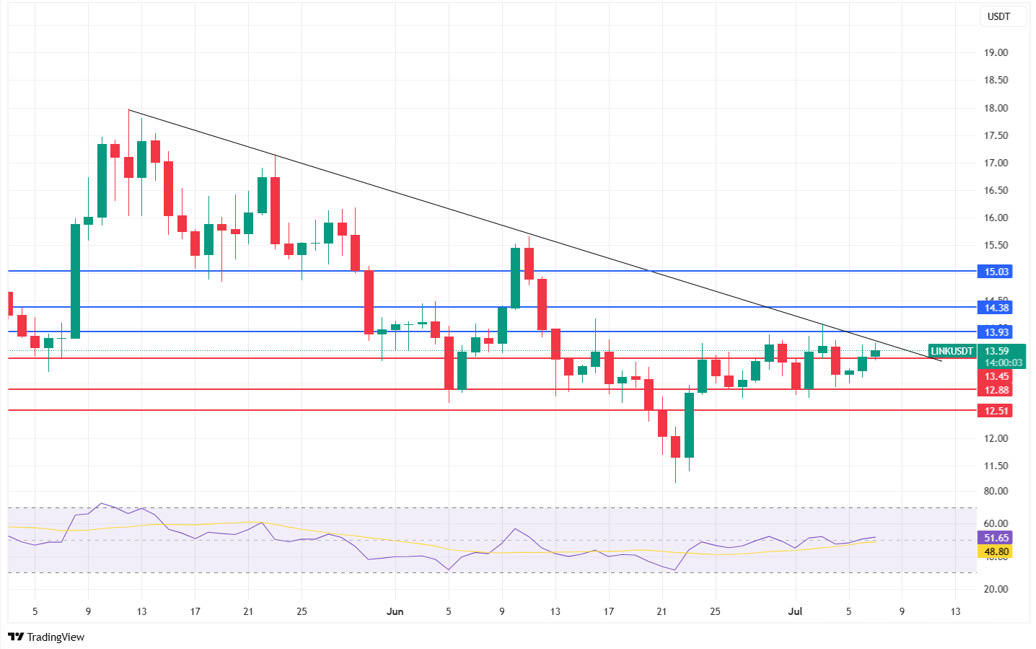
While LINK has been moving under the pressure of the downtrend since May 12, we see that it has started to give signs of recovery with the bottom it made on June 22. The current price action is very close to both the falling trend line and the horizontal resistance of $ 13.93, which is a technically and psychologically important level. This area stands out as a critical breakout zone in terms of the direction of the price.
One of the important technical structures on the chart is the bull flag pattern, which becomes more prominent, especially on the 4-hour charts. This pattern suggests that the uptrend may continue if an upside breakout comes. The increase in volume along with the squeeze experienced by the price at these levels may herald a new upward movement. In this movement, the first level to be exceeded is 13.93 dollars. If this level is exceeded, $ 14.38 and $ 15.03 levels may become targets, respectively. In possible downward scenarios, the $ 13.45 and $ 12.88 levels can be monitored as short-term support. However, the most critical technical support point is $12.51, which is both horizontal support and the Fibonacci 0.618 retracement level. The price retracement to this level can be considered as a healthy correction. However, if it sags below $12.51, there may be a risk of deepening the decline.
We also started to see positive signals on the momentum side. The Relative Strength Index (RSI) indicator moved above the 50 level and moved into positive territory. This can be interpreted as a development that supports the momentum on the buy side. If the RSI continues its upward trend, it will technically strengthen the bullish scenario.
Supports 13.45 – 12.88 – 12.51
Resistances 13.93 – 14.38 – 15.03
BNB/USDT
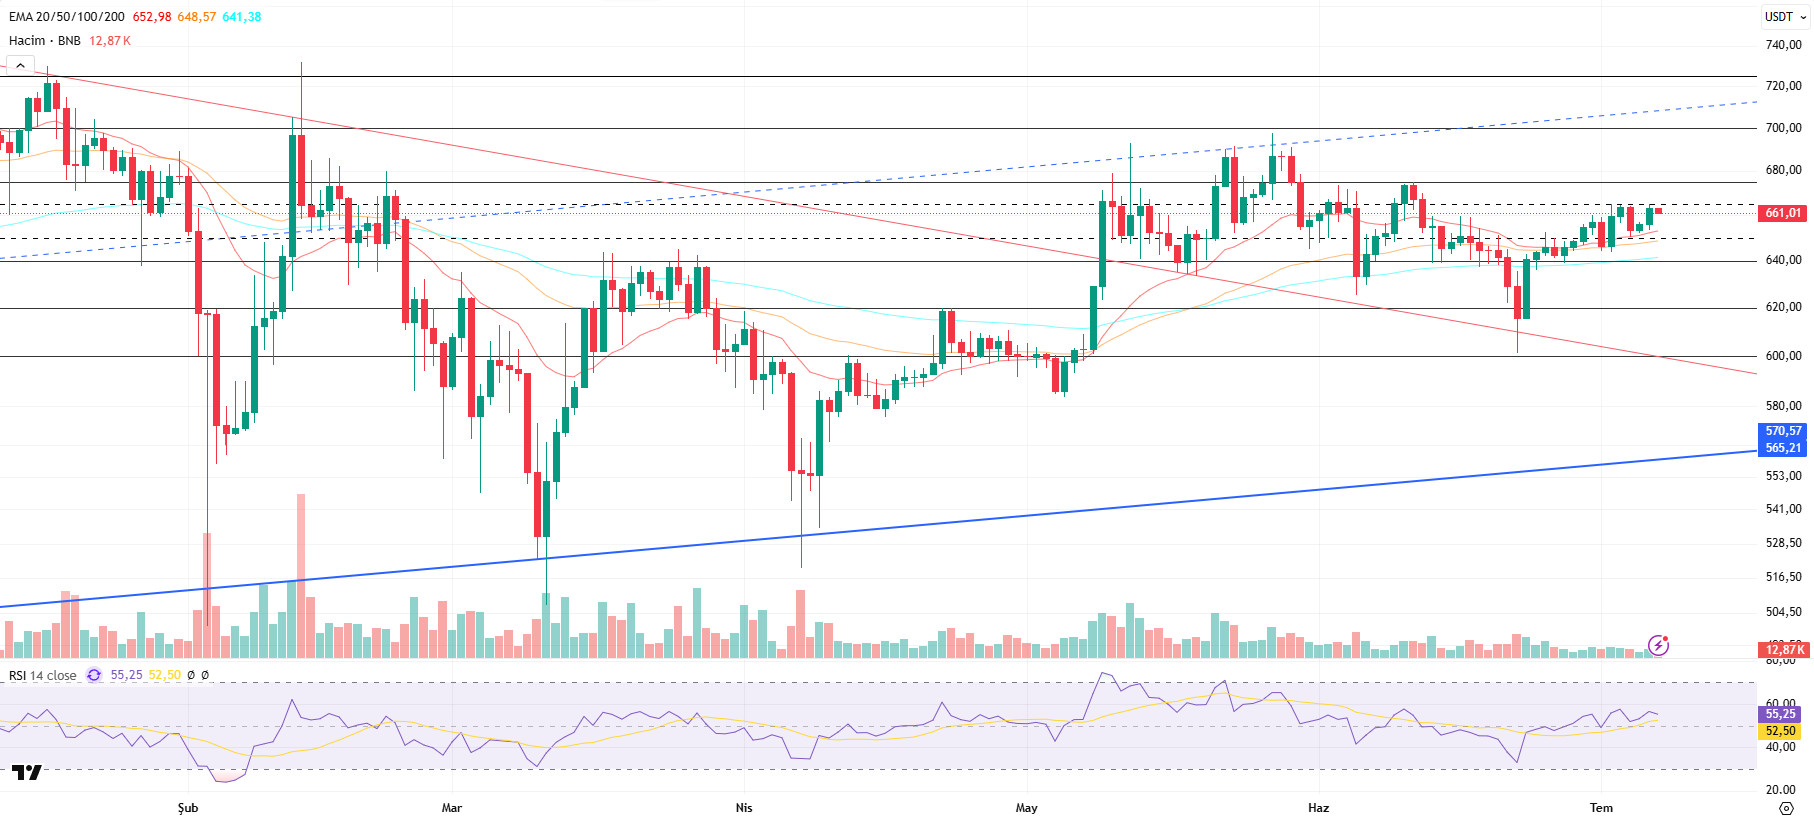
This week, there was an important development that supported the BNB ecosystem on the fundamental side. Hong Kong-based chipmaker Nano Labs announced that it will issue $500 million of interest-free convertible bonds to raise $1 billion in BNB. The company’s target is to add 5% to 10% of the circulating BNB supply to its portfolio. This announcement sends a positive signal for the ecosystem by showing that institutional interest is turning towards BNB.
From a technical point of view, the ongoing upward process in the BNB/USDT parity with the effect of these fundamental developments contributed to the positive acceleration of the price up to the $ 665 level. However, BNB, which encountered resistance at this level, remained under pressure and made a negative start to the week. In the new week, the asset exhibited a negative outlook by pricing below the $ 665 level.
In the BNB/USDT pair, which is currently trading between $ 640- $ 675, a weak but positive trend in trading volume in the last one-week period is noteworthy when technical indicators are analyzed. This indicates a moderate increase in the market’s buying appetite. On the other hand, the Relative Strength Index (RSI) followed an upward trend due to the recovery in recent days and rose above both the average value and the 50 level. This technical outlook suggests that positive, albeit limited, trends are effective in the short term.
Within the framework of the current technical structure, if the negative momentum continues, the BNB price is expected to test the $ 640 support level in the first place. If this level is broken downwards, the 620 and 600 dollar levels stand out as the next strong support zones, respectively. On the other hand, if the $ 640 level is maintained and the buying appetite increases, the price is likely to head towards the $ 675 resistance level again. If this resistance is overcome upwards, the $700 and $725 levels should be monitored as the next critical resistance points.
Supports 640 – 620 – 600
Resistances 675 – 700 – 725
SUI/USDT
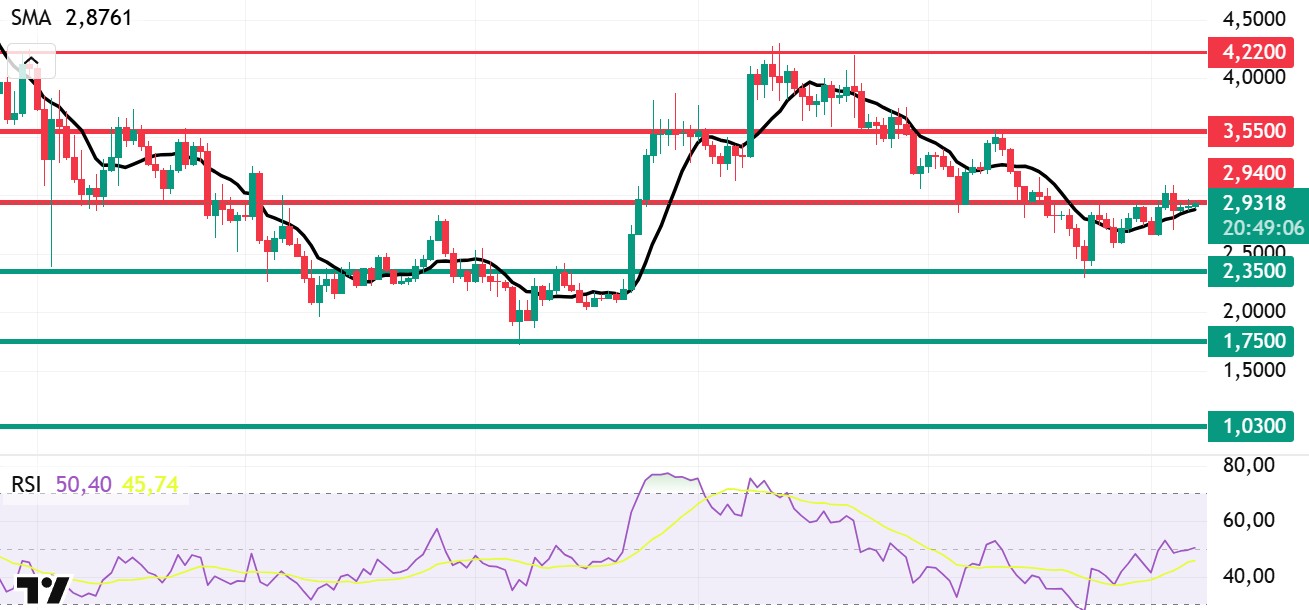
The Sui network started the week on a strong note, supported by updates and supply dynamics. Developer activity in the ecosystem maintained its momentum this week, with new decentralized application (dApp) announcements and developer-focused events once again demonstrating Sui’s innovation potential. One of the highlights of the week was that the Sui team continued to forge important partnerships in the fast-growing Bitcoin-powered DeFi (BTCfi) space. In addition, the Web3-based game project XOCIETY will start working on the Sui blockchain, further strengthening the network’s presence in the gaming industry. As previously announced, the Sui blockchain has completed its integration with Backpack, a global cryptocurrency exchange and wallet platform. This integration increases both accessibility and liquidity for projects in the Sui ecosystem, demonstrating the network’s continued commitment to its growth strategy. Another notable development of the week was the announcement made by Lion Group. On June 26, the company announced a comprehensive $600 million crypto asset plan, including SUI tokens. Following this announcement, the SUI price gained about 15% on a weekly basis, reaching the $3 level. An increase of around 4% was also observed on a daily basis.
When we look at the technical outlook of Sui after the latest developments, it is seen that the price is balanced at $ 2.93 on a weekly basis due to fundamental developments. Relative Strength Index (RSI) is currently in the range of 50.40 – 45.74. While this value range indicates that the market is close to the selling zone, a rise in the RSI to the range of 55.00 – 60.00 may indicate a potential buying opportunity. If the price moves upwards, the levels of 2.94 – 3.55 – 4.22 dollars can be followed as resistance points, respectively. However, if the price falls to new lows, the RSI falling to the 20.00 – 30.00 band may indicate that selling pressure may deepen. In this case, the $2.35 and $1.75 levels stand out as strong support zones. Especially based on the trend line, a pullback to $1.75 seems technically possible. According to Simple Moving Averages (SMA) data, Sui’s SMA is currently at $2.87. If the price maintains above this level and crosses the SMA line upwards, the uptrend may regain strength.
Supports 1.03 – 1.75 – 2.35
Resistances 2.94 – 3.55 – 4.22
ADA/USDT
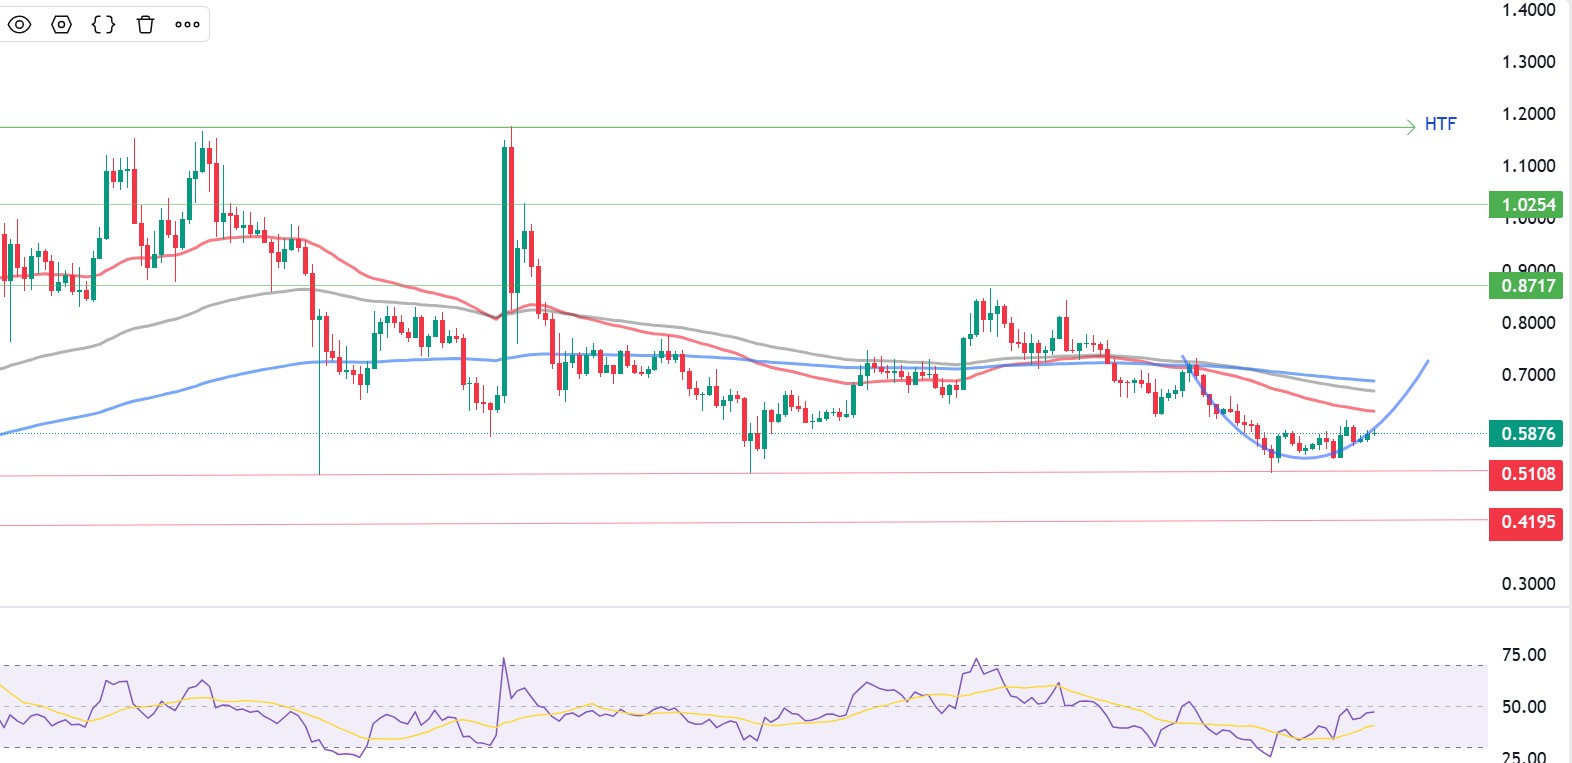
Cardano (ADA) was trading at $0.5876 as of July 7, 2025. A combination of price action and on-chain data suggests cautious optimism in the medium-term outlook. Cardano’s on-chain data points to a strong foundation despite the uncertainty on the technical side. During the week in question, 45.6 million ADA tokens were burned, resulting in a net decrease of ADA 17.3 million in circulating supply. This had a limiting effect on the supply side and put positive pressure on the price. In the same period, the staking ratio rose to 62.4%, indicating that around ADA 22.3 billion was locked out of circulation. This shows that investors continue to hold their assets on the ADA network instead of short-term sales and that confidence in the project continues. The number of active addresses on the Cardano network increased by 1.15 million to a total of 319.2 million. This increase shows that the interaction on the network is rising sustainably. At the same time, network revenue peaked at $84.1 million, placing Cardano among the highest revenue-generating blockchain projects. Transaction volume also increased by 3.1% to more than $114 million, reaching $111 million on a weekly basis, a growth of 0.2%. This on-chain growth is reflected in the increase in total locked assets (TVL) and user density on DeFi protocols.
Overall, while there is no clear technical directional confirmation in the Cardano price, on-chain data provides a strong bullish foundation. The price chart suggests the possibility of a reversal, with the formation of an inverted bowl pattern after the downtrend and gradual rising lows. This structure suggests that buyers are slowly taking control. However, the price is still below the 50, 100 and 200-day exponential moving averages. This suggests that the uptrend is yet to be confirmed in technical terms. The RSI indicator is nearing the 45 level, indicating that momentum tends to pick up. Especially in the market analysis circulating on social media, attention is drawn to signals such as seller exhaustion and bullish divergence. Such signs may herald a short-term upward movement. At the critical levels, daily closes above the 0.6170 and 0.6500 resistances will strengthen a scenario where the price may move towards 0.7000 and then 0.8717. On the other hand, 0.5108, 0.4837 and finally 0.4195 levels should be monitored as possible support areas in case the upward movement fails.
Supports 0.5108 – 0.4837 – 0.4198
Resistances 0.7000 – 0.6500 – 0.6170
Legal Notice
The investment information, comments and recommendations contained in this document do not constitute investment advisory services. Investment advisory services are provided by authorized institutions on a personal basis, taking into account the risk and return preferences of individuals. The comments and recommendations contained in this document are of a general type. These recommendations may not be suitable for your financial situation and risk and return preferences. Therefore, making an investment decision based solely on the information contained in this document may not result in results that are in line with your expectations.