
Weekly Technical Analysis Report
BTC/USDT
We left behind a busy agenda last week. While a ceasefire was implemented in the tension between Israel and Iran, US President Trump announced that the ceasefire was in effect, saying “Israel will not hit Iran”. US Federal Reserve Chairman Jerome Powell’s remarks in Congress postponed interest rate cut expectations in the markets until September. Powell emphasized that inflation is close to the 2% target but still above it and emphasized that more data is needed. On the institutional side, Bitcoin investments continue unabated. Following Strategy, Metaplanet and small European-based companies made new BTC purchases last week.
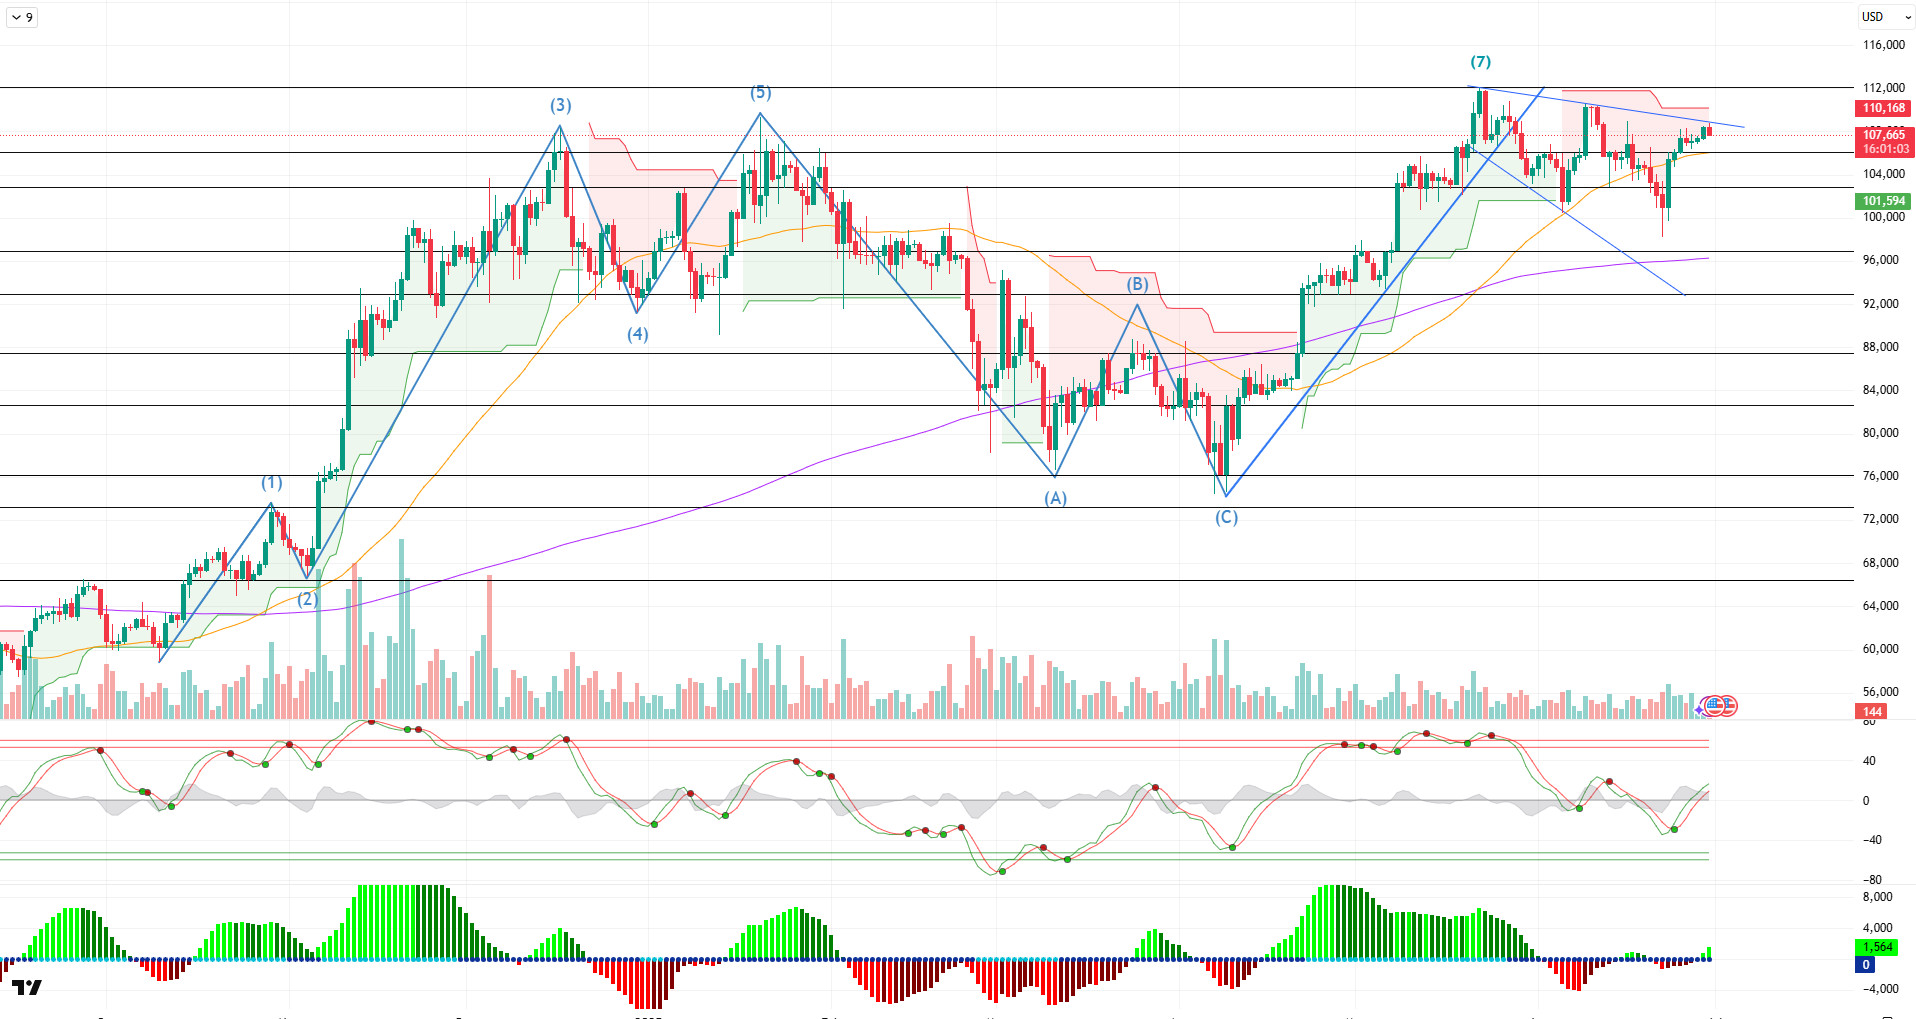
When we look at the daily technical outlook after all these developments, it is seen that BTC entered into a falling wedge pattern after the peak at the 7th point it reached with the golden cross structure, and after declining within this structure, it recovered again and touched the upper line of the formation. BTC, which started the week at 104,000 levels, recorded a cumulative increase and reached 109,000 levels. The price then retreated a bit and is set to close the week at 107,700 with a return of close to 5%.
Looking at the technical indicators, the WT oscillator is seen to have turned upwards after approaching the ovelsold zone on the daily, while the SM indicator is seen providing low momentum support in the positive zone. On the other hand, the moving averages showed that the golden cross structure continued as the 50-day SMA crossed the 200-day SMA upwards.
When the weekly liquidity data are analyzed, a balanced distribution of buy and sell positions stands out, while some sell trades were liquidated with the recent upward movement. On the other hand, the 106,000-107,000 band stands out as the area where buying positions are accumulated.
In general, while the technical structure continued in line with the favorable ground created for the rise, fundamental developments did not pose a negative obstacle to the price. Liquidity data may indicate an increase in short-term volatility. In a possible bearish scenario, the 105,000 level is followed as a reference point, while crossing the ATH level in the continuation of the rise may bring new highs.
Supports 105,000 – 102,800 – 100,000
Resistances 109,000 – 110,000 – 111,970
ETH/USDT
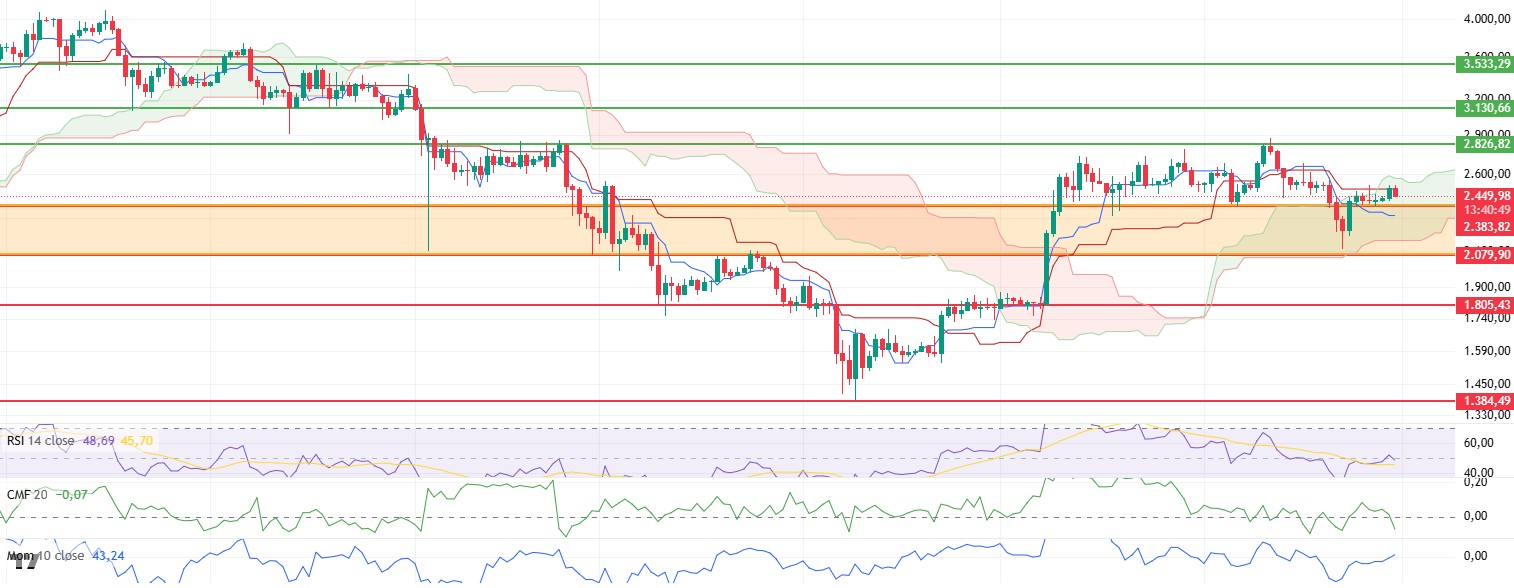
Last week, the optimistic mood in the global markets with the end of the conflicts between Iran and Israel was reflected in crypto assets. With this development, the ETH price showed a significant recovery, breaking through the resistance point at $2,383 and rising to the kijun level on the ichimoku indicator on the daily timeframe. Meanwhile, on-chain data also revealed an increase in interest in the Ethereum network. In particular, the increase in the Ethereum Total Value Staked ratio from 35.25 million ETH to 35.48 million ETH shows that long-term investor confidence continues and the network’s foundation is strengthening.
On the other hand, the concept of “pluralistic IDs” proposed by Ethereum founder Vitalik Buterin aims to offer more privacy and flexibility in decentralized identity management. This structure, which is based on users protecting their privacy by using different digital identities on different platforms, aims to reduce the privacy risks inherent in centralized digital identities. This approach may lead to new investments in the Ethereum network from privacy-focused L1 projects in the coming period.
When technical and on-chain indicators are analyzed together, some important divergences stand out. Cumulative Volume Delta (CVD) data reveals a weakening on the buy side in both spot and futures markets. In particular, the decline in spot CVD reveals that there is no strong liquidity flow supporting the upside and there are uncertainties about the sustainability of the uptrend. On the other hand, the funding rate rebounded after the recent decline, indicating an increase in long positions and traders still expecting upside.
The Chaikin Money Flow (CMF) indicator, on the other hand, produces a remarkable signal by moving into negative territory despite the recent price increase. This outlook indicates that liquidity outflows from the market have started and short-term risks are still alive. The fact that CMF remains in negative territory is among the factors that weaken confidence in the uptrend.
However, Relative Strength Index (RSI) and momentum indicators show a more positive picture. Both indicators continue their upward trend, indicating that the price is still technically strong and buyers are active in the market. In particular, the preservation of momentum supports the potential for a rebound in possible pullbacks.
In terms of the Ichimoku indicator, the fact that the price rebounded and rose to the kijun level without falling under the kumo cloud shows that the technical structure remains positive. However, at this point, it should be noted that the kijun level starts to work as a strong resistance in the short term. If the price fails to hold at this level and starts to retreat, it may bring technical weakening signals.
In conclusion, the current outlook for ETH is both promising and cautious. Technical and on-chain data are generally open to short-term pullbacks. However, it should not be ignored that such pullbacks can turn into buying opportunities and rapid recoveries may come. In this context, the $2,382 level is a critical threshold as intermediate support. If this level is lost, selling pressure may increase and the price may face deeper corrections. On the other hand, exceeding the $2,826 level may ensure that the upward trend in the ETH price continues to gain strength.
Supports 2,383 – 2,079 – 1,805
Resistances 2,826 – 3,130 – 3,533
XRP/USDT
There have been remarkable developments in the XRP market in recent days. In particular, according to various sources, the long-running legal battle between Ripple and the US Securities and Exchange Commission (SEC) has finally come to an end and the case has been closed with Ripple withdrawing its appeal, and expectations that BlackRock will apply for an XRP-based ETF and that this application may be approved by the US Securities and Exchange Commission (SEC) in the near future. This development, which has not yet been officially confirmed, may be speculative, but its potential impact on the market cannot be ignored. Such expectations can lead to strong pricing, especially in periods of relatively tight liquidity.
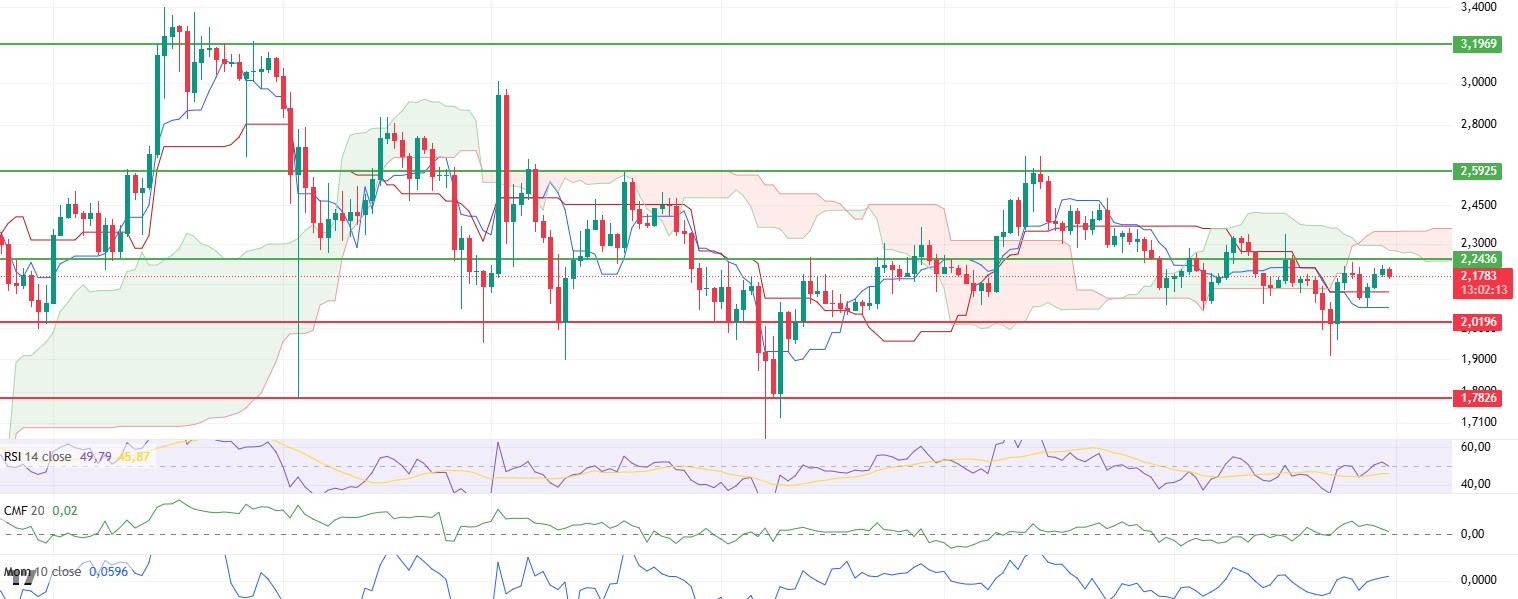
Last week, the end of the conflicts between Iran and Israel on the geopolitical front created a relief effect on crypto assets as well as global markets. Following this improvement, the XRP price briefly dipped below the $2.01 level, but recovered and climbed sharply to the strong resistance point at $2.24. While this rise enabled the price to reach important technical barriers, a certain acceleration was also observed in the indicators.
On the momentum side, Relative Strength Index (RSI) and overall momentum indicators continue their upward trend, accompanying the price increase. This outlook suggests that buyers are still influential in the short-term technical outlook and bullish potential is preserved. However, this positive outlook is accompanied by some signals of weakness that should be taken into consideration.
The Chaikin Money Flow (CMF) indicator has moved down to the zero line despite the price rally. This suggests that liquidity outflows in the market are accelerating and the rally may be structurally weak. Cumulative Volume Delta (CVD) data paint a similar picture. The continued decline in trading volumes in the spot and futures markets suggests that the demand on the buy side is not strong enough and the upside sustainability of the price is questionable.
Looking at the Ichimoku indicator, although the price breaking above the kijun level indicates short-term positivity, the price is still positioned below the kumo cloud. This emphasizes that the medium-term trend has not yet turned clearly positive and caution should be exercised in the market. Price movements below the kumo cloud are usually associated with periods of trend weakness.
Overall, while some of the technical indicators support the short-term positive outlook, on-chain data and volume indicators create uncertainty about the price’s sustainability at these levels. In this context, exceeding the lower band of the kumo cloud at the level of $2.24 in the coming week may pave the way for the acceleration of the buying movement and the start of a new uptrend. However, it should be kept in mind that if this level cannot be exceeded, the pressure on the price may increase and the upward momentum may remain limited.Top of the FormBottom of the Form
Supports 2.0196 – 1.7826 – 1.6140
Resistances 2.2436 – 2.5925- 3.1969
SOL/USDT
Last week in the Solana ecosystem;
- Upexi CEO and CSO Solana announced their treasury strategy.
- fun token auction postponed to mid-July.
- Byreal, the ultimate onchain liquidity layer for real assets, officially announced its brand launch today.
- The Solana Foundation has partnered with Kazakhstan to launch a Solana Economic Zone targeting tokenized capital markets and talent development.
- Fortune 500 firm Fiserv will launch stablecoin on Solana using Paxos and Circle infrastructure.
- Data from Glassnode shows that trading volume of SOL CME futures reached an all-time high with 1.75 million contracts traded.
- Invesco and Galaxy filed the S-1 form for the Solana ETF.
- Solana treasury company Upexi plans to tokenize public shares through Superstate’s opening bell.
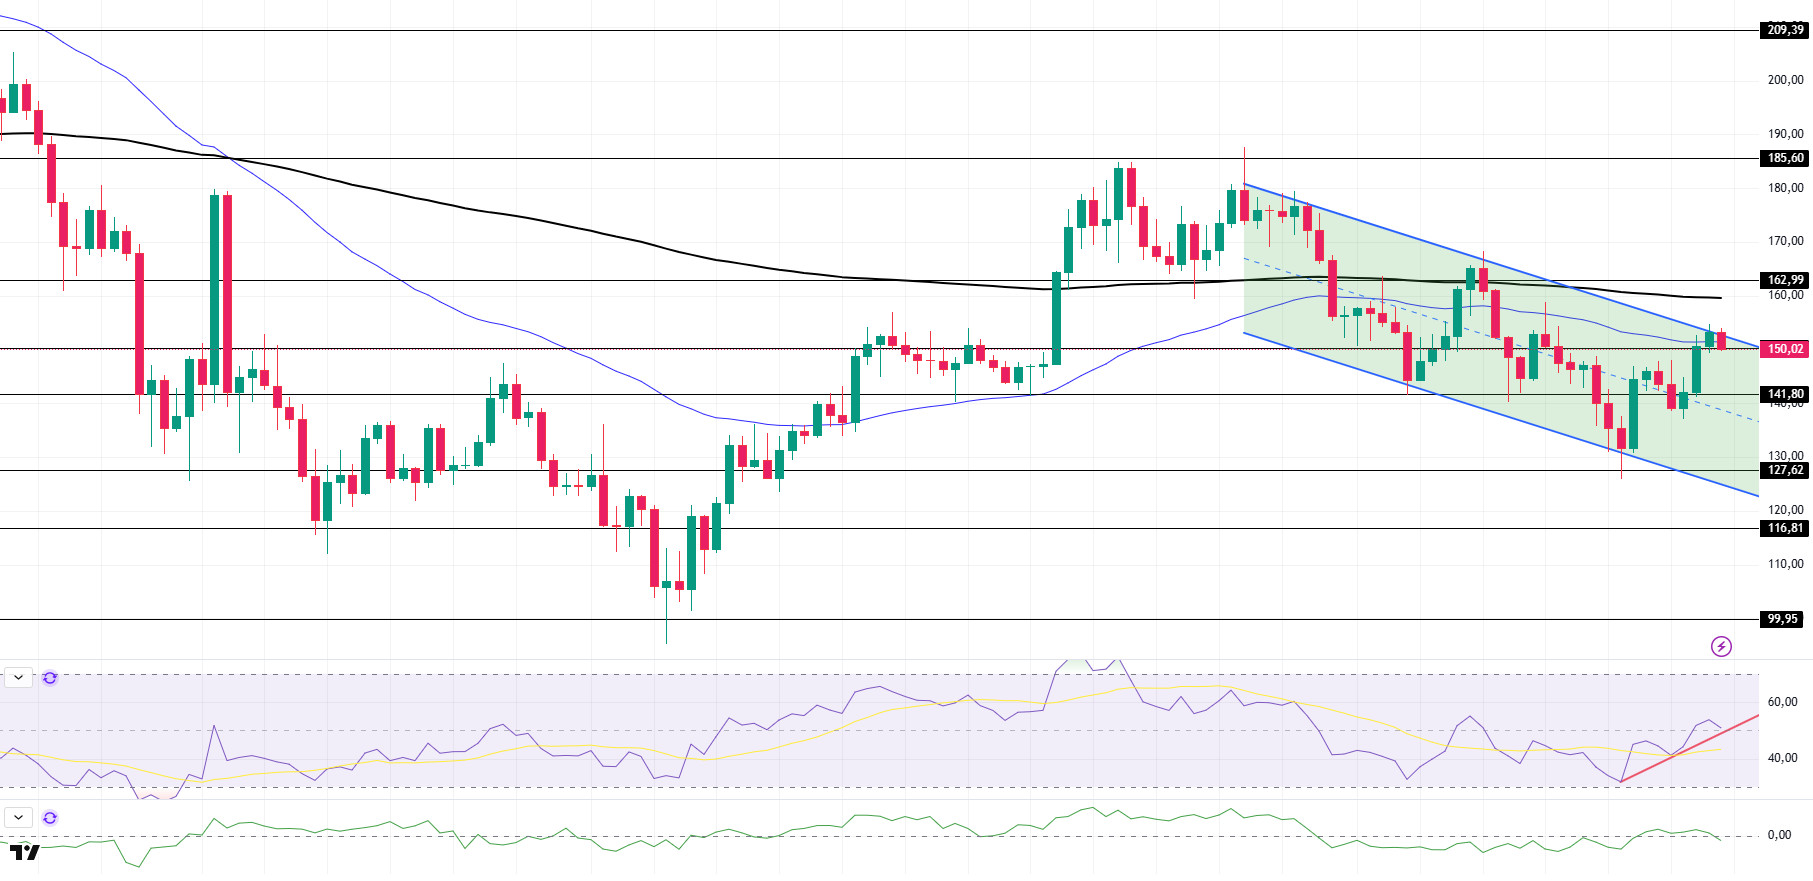
The SOL price gained about 16% this week. It accelerated to the top of the downtrend that started on May 23 and is currently testing the 50 EMA (Blue Line) moving average as resistance and the 50 EMA (Blue Line) as support. It may rise up to $ 162.99 price levels on the closure of above-trend candles. If the train fails to break the ceiling and continues its in-trend movement, the $ 127.62 level should be followed.
The asset is trading between the 50 EMA (Blue Line) and 200 EMA (Black Line) moving averages, indicating that the asset is in the decision phase. Moreover, the fact that the 50 EMA continues to remain below the 200 EMA indicates that a “death cross” continues to form from a technical perspective. This suggests that bearish potential remains in the medium term. Although the RSI (14) is in positive territory, selling pressure is building. In addition, it continued to stay above the uptrend that started on June 22. This may mean that the uptrend may continue. Chaikin Money Flow (CMF-20) crossed into negative territory again; the decline in money inflows may take the CMF-20 indicator deeper into negative territory. If macroeconomic data remains positive and developments in the ecosystem remain positive, the first major resistance point of $162.99 could be retested. Conversely, in case of possible negative news flow or deterioration in macro data, the $127.62 level can be monitored as a potential buying opportunity.
Supports: 150.23 – 141.80 – 127.62
Resistances: 162.99 – 185.60 – 209.39
DOGE/USDT
Bitwise, one of the largest crypto asset managers, updated its application for a spot Dogecoin ETF.
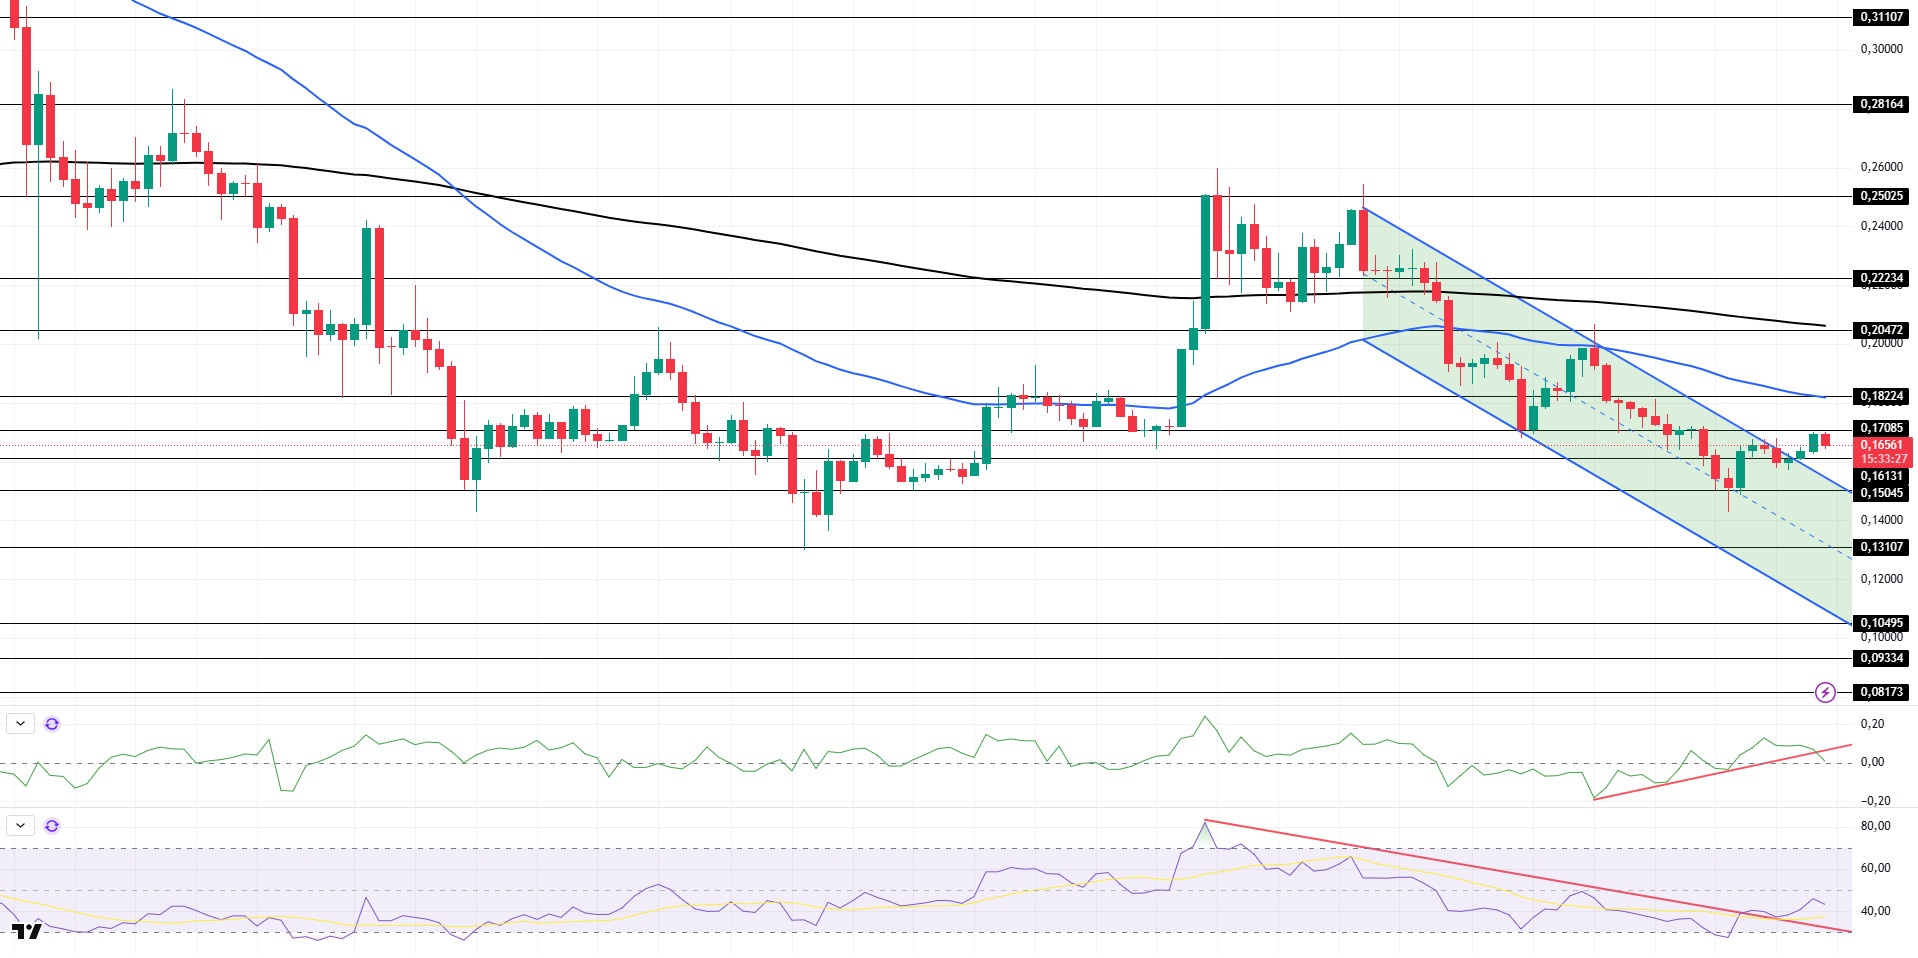
DOGE has gained about 9.6% since last week on the daily chart. Breaking the downtrend that started on May 23rd to the upside this week, the price managed to stay above the downtrend. If the uptrend continues, it may test the 50 EMA (Blue Line) as resistance. In case of a pullback, the ceiling level of the downtrend may work as support.
The asset continued to remain below the 50 EMA and 200 EMA (Black Line), suggesting that the death cross pattern remains valid. This suggests that bearish pressure may continue in the medium term. The Chaikin Money Flow (CMF-20) indicator fell to neutral. In addition, it broke the uptrend that started on June 11 to the downside. This may cause price declines. Money inflows continue to decline. The Relative Strength Index (RSI-14) indicator is at the mid-level of the negative zone, but it has managed to break its downtrend upwards since May 10. This may cause it to test the 50 EMA moving average. In case of macroeconomic risks or negative news from the ecosystem, the $0.15045 level can be monitored as a strong support. On the other hand, the $0.18224 level stands out as the first strong resistance level if the upward movement gains strength.
Supports: 0.16131 – 0.15045 – 0.13107
Resistances: 0.17085 – 0.18224 – 0.20472
TRX/USDT
The monthly volume of USDT transferred on the TRON network reached an all-time high of $688.2 billion and the number of USDT transactions per month reached 70.1 million. These metrics demonstrate continued confidence in the network’s high transaction throughput (TPS), low transaction costs and stable infrastructure capacity.
During the week of June 23-29, 2025, a total of 43.2 million TRX were burned on the TRON network. This reduced the circulating supply by 15.8 million. The decline in circulating supply continues to put deflationary pressure on TRX.
Over the past week, the TRON network has generated a total of 76 million dollars in revenue, maintaining its position as the highest revenue generating ecosystem among all blockchain networks. This revenue is directly related to the high levels of transaction intensity, total locked asset (TVL) size, the number of active addresses on a daily basis, and user interaction on DeFi protocols on the TRON network, demonstrating that the key metrics supporting the network’s operational efficiency are working steadily.
TRX, which started last week at 0.2634, rose about 5% during the week and closed the week at 0.2768. Currently trading at 0.2772, TRX is just below the middle band of the bullish channel on the daily chart. With a Relative Strength Index (RSI) value of 54, TRX price can be expected to move slightly higher from its current level and move towards the upper band of the bullish channel. In such a case, it may test the 0.2880 resistance. If it closes daily above the 0.2880 resistance, it may continue to rise and may want to test the 0.2975 resistance. If it fails to close daily above 0.2880 resistance, it may decline with the selling pressure that may occur in the upper band of the channel. In such a case, it may test the supports of 0.2715 and 0.2555 respectively. On the daily chart, 0.2411 is an important support and as long as it stays above it, the bullish demand can be expected to continue. If this support is broken, selling pressure may increase.
Supports 0.2715 – 0.2555 – 0.2411
Resistances 0.2880 – 0.2975 – 0.3080

AVAX/USDT
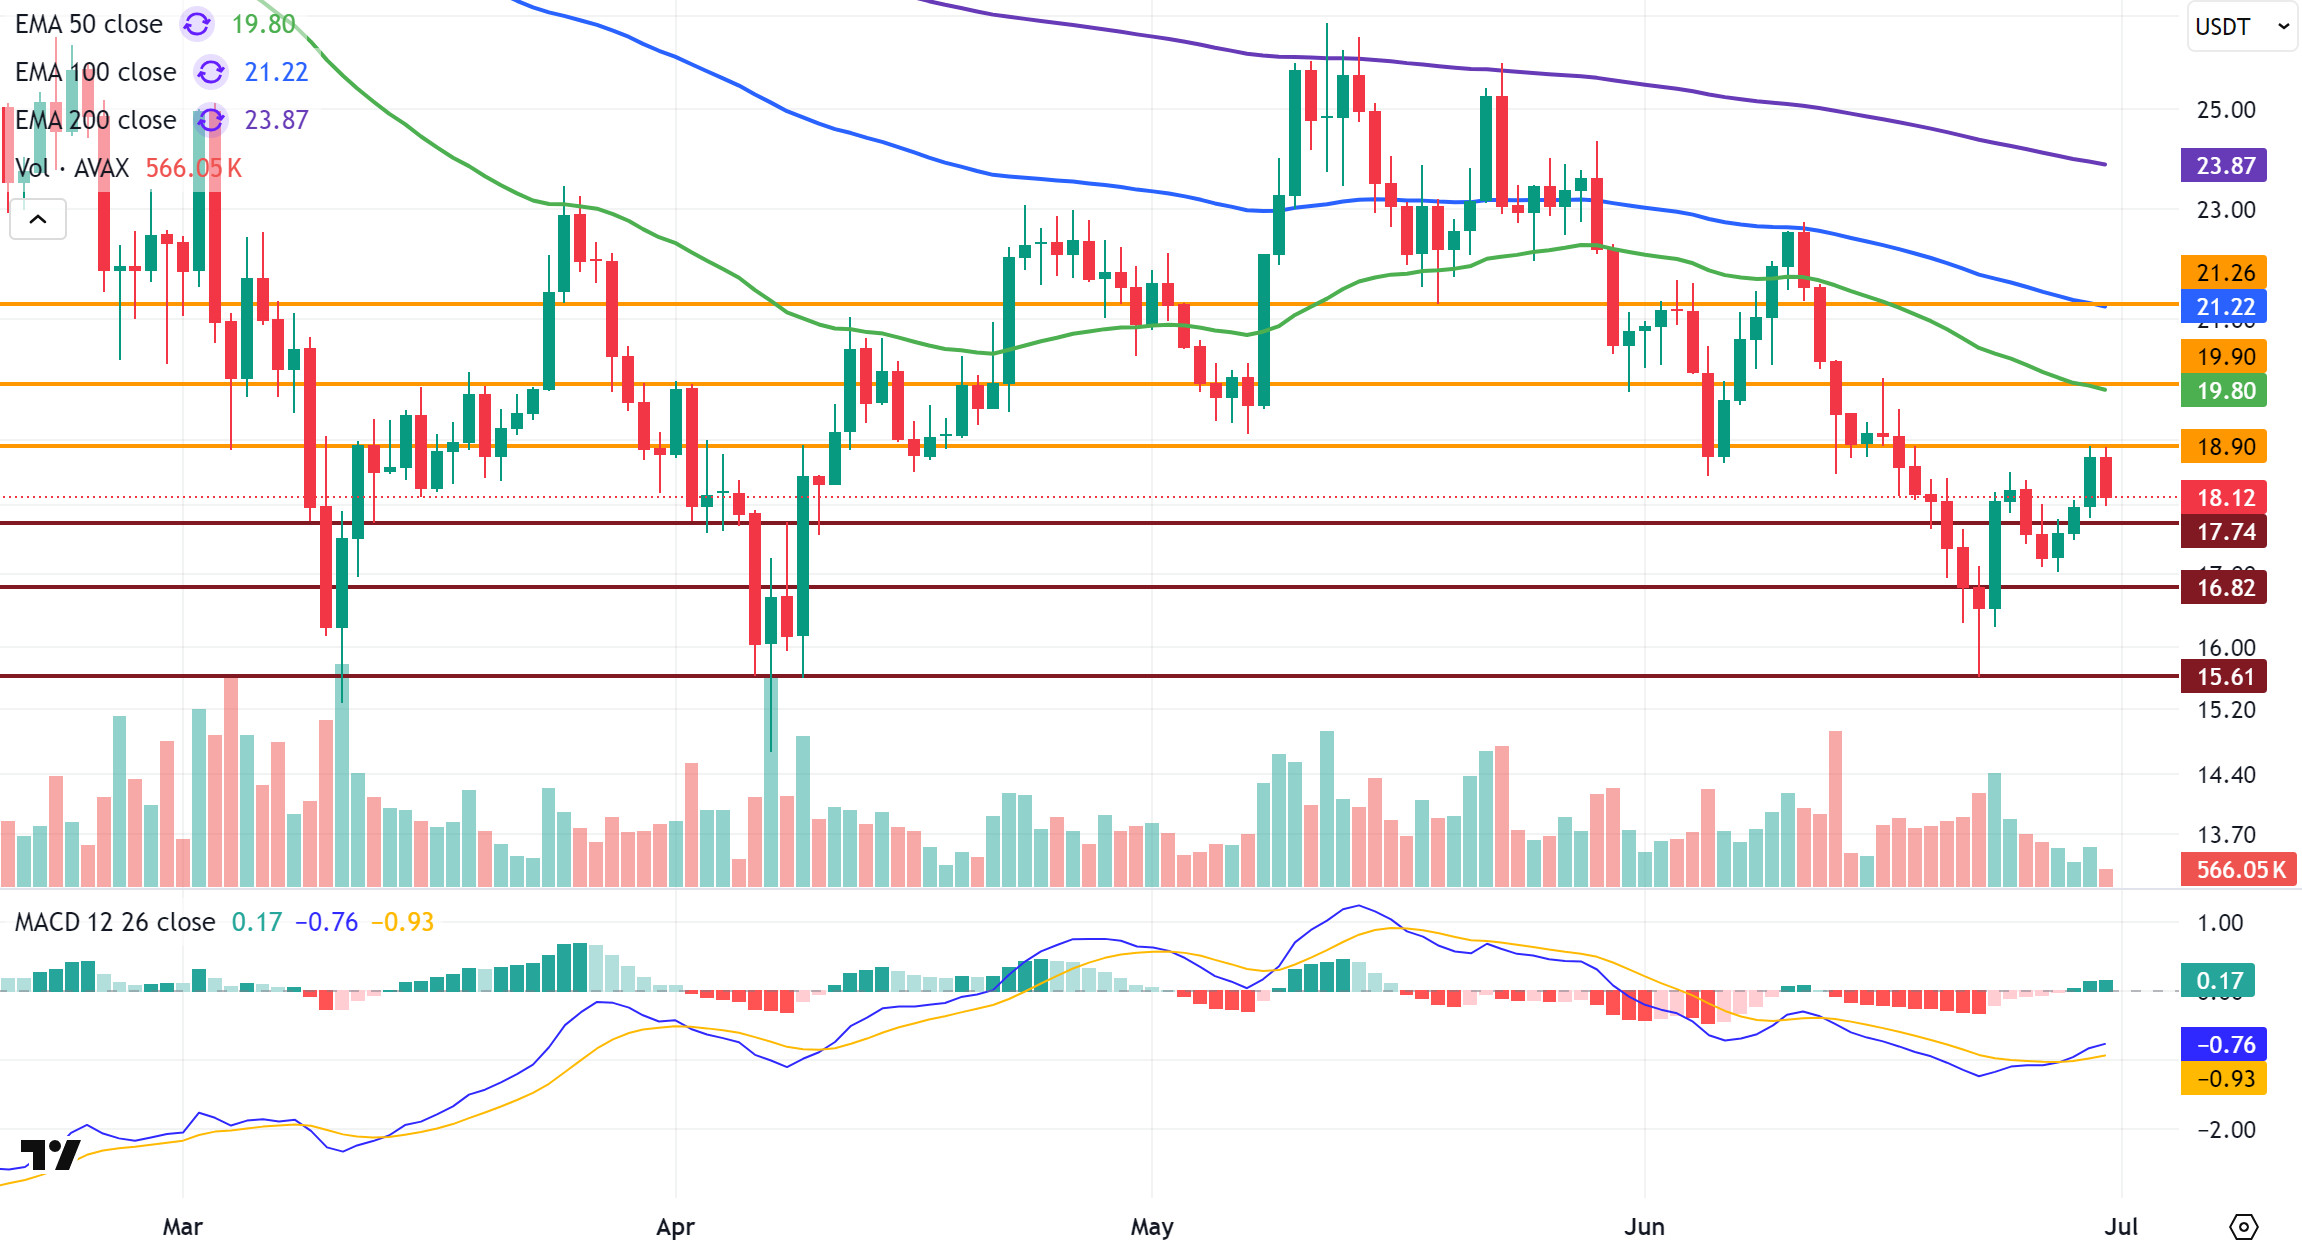
AVAX, which started last week at $ 16.51, rose by about 13.4% as a result of the upward movement throughout the week, closing the week at $ 18.72. AVAX, which tested the $ 18.90 resistance level with its rise on the last day of last week, fell with the sales at this resistance level and this decline continues on the first day of the new week. On the other hand, as the pressure of geopolitical developments that have been influential on the crypto market in recent weeks has decreased, recovery signals have started to be seen throughout the market. On the AVAX front, in order for this recovery to continue, it is very important to maintain persistence above the Exponential Moving Average (EMA) levels, which are technically critical.
Looking at the Moving Average Convergence/Divergence (MACD) indicator on the daily chart, although the MACD line has crossed the signal line upwards, it is still trading in the negative zone. This suggests that positive momentum is starting to build but is not yet strong enough. If momentum remains weak, there is a risk that upward movements in AVAX may remain limited.
With the rise that may be experienced in the new week for AVAX, especially the EMA50 level and the closes above the $ 19.90 resistance may strengthen the positive scenario in the short-term outlook. In this case, AVAX may target the EMA100 and EMA200 levels. However, in order to reach these levels, a stronger momentum is required to be supported by trading volume. On the other hand, in case of a decline in AVAX, $ 17.74 can be followed as the first support level. In case of persistence below this level, supports of $ 16.82 and $ 15.61 will come into play, respectively. Closes below these levels could increase selling pressure and cause the downtrend to regain momentum.
(EMA50: Green Line, EMA100: Blue Line, EMA200: Purple Line)
Supports 17.74 – 16.82 – 15.61
Resistances 18.90 – 19.90 – 21.26
SHIB/USDT
This week, the Shiba Inu ecosystem experienced a remarkable surge in whale behavior and supply dynamics. In particular, there was a significant increase in large investor activity on Binance as billions of SHIBs changed hands. The tendency of whales to expand their positions, combined with selling pressure from retail investors, led the market to seek an uncertain equilibrium in the short term. However, on-chain data during the week showed that this surge in interest was immediately followed by a sharp pullback in large investor inflows. In just three days, large wallet inflows fell from 3.06 trillion SHIBs to 84.76 billion SHIBs, marking a significant 97% decline. This decline suggests that whales have paused their aggressive buying and have moved to a holding position due to macroeconomic uncertainties. On the supply side, the most striking headline of the week was the extraordinary rise in burn rates. A total of 13 090 171 SHIBs were taken out of circulation in the last 24 hours and the burn rate increased by 12.833% compared to the previous period. The fact that the SHIB price continued its downward trend despite such a significant acceleration in burns suggests that supply has limited impact on the short-term price. This once again confirms that burn rates need to remain sustainably high in order to strengthen the perception of long-term scarcity. In the trust dimension of the ecosystem, the “fake SHIB” warning from the project’s official representatives came to the fore. Community leader Lucie reminded that only the original Ethereum-based token is valid and called for caution against fraud attempts. These warnings are especially critical for community trust and raise the risks posed by fake supply attempts in the market.
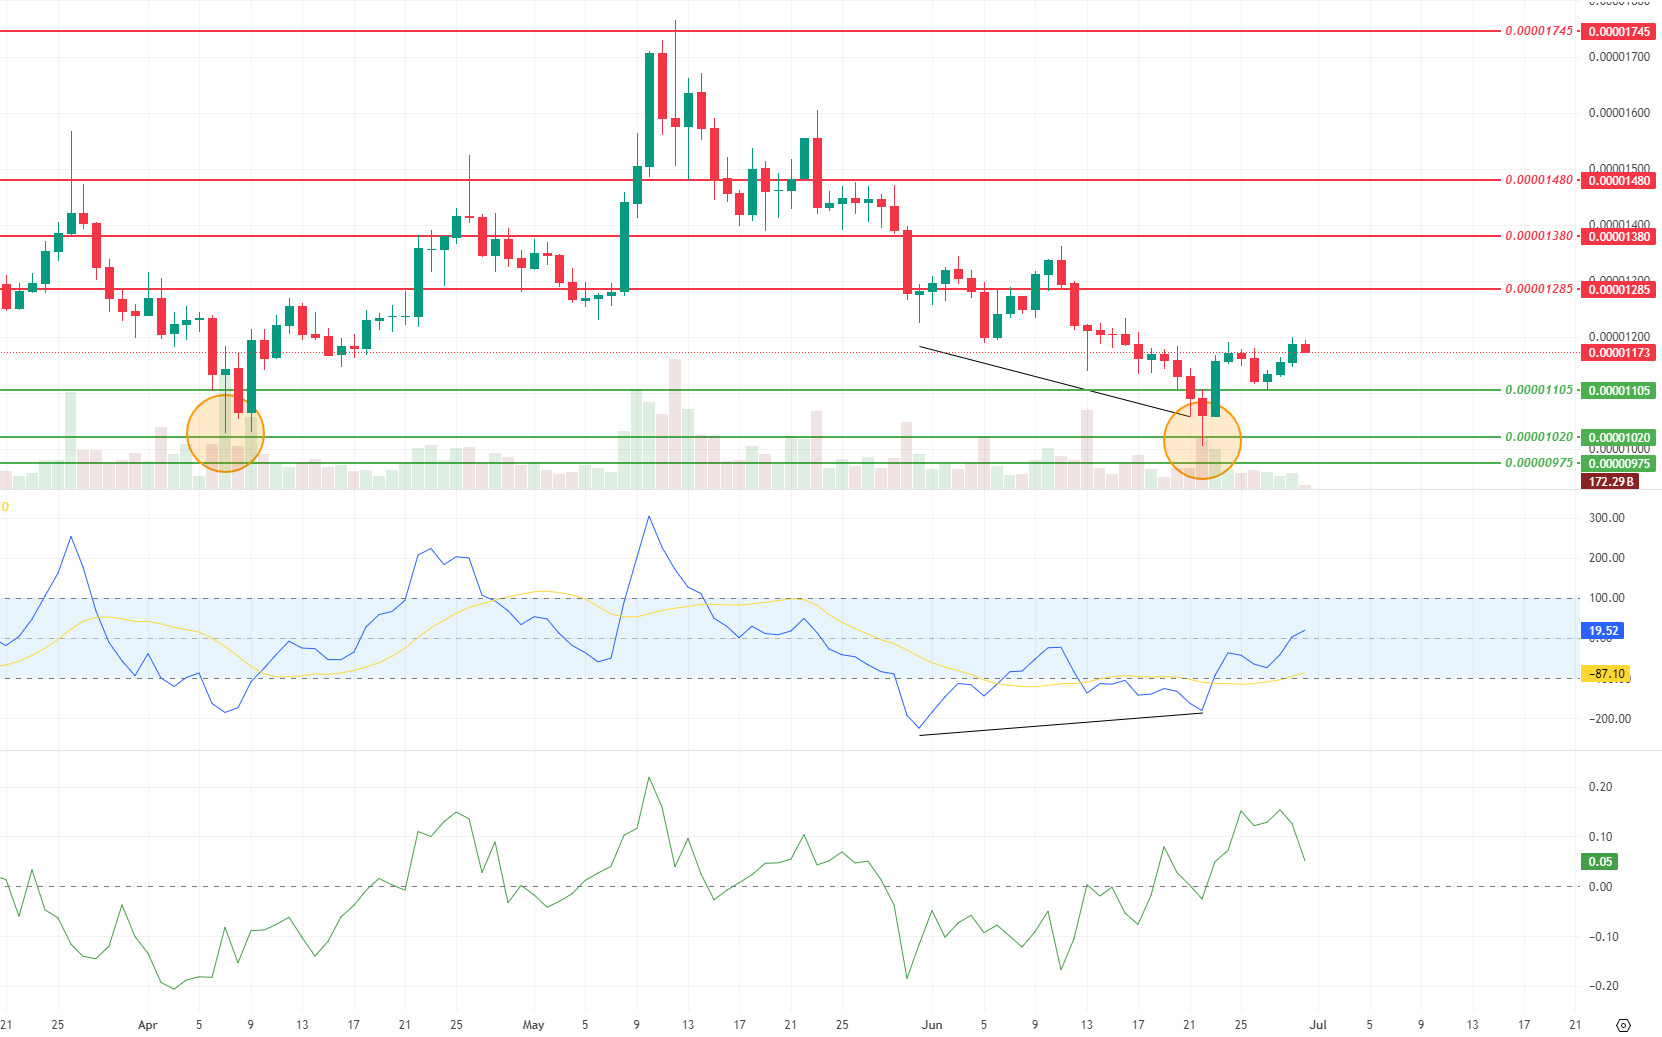
When we analyze the technical side, a significant strengthening signal stands out in Shiba Inu price action compared to last week. The increase in trading volume and the recovery in momentum indicators show that the buy side has stepped in more decisively. The decline in volatility paves the way for the price to enter a controlled upward trend, while sudden and sharp fluctuations remain limited. The positive mismatch (Black Line) on the Commodity Channel Index (CCI) oscillator, which has been going on for a while, made its effect felt more clearly this week and contributed to the price’s rise to the $0.00001170 level. This move confirms that buyers tend to take full control of the momentum after the recent double bottom pattern. In addition, the Chainkin Money Flow (CMF) indicator moved into positive territory, indicating that capital flows are predominantly in the direction of buying, which is an important data supporting the bullish scenario. This outlook strengthens the possibility of a new bullish attempt towards the 0.00001285 dollar resistance if the price stabilizes at current levels. On the other hand, in the negative scenario, if volatility continues to remain low and trading volume weakens again, there is a risk that the price may retreat to the level of 0.00001105 dollars. This threshold should be monitored as an important intermediate support in the short term. If this level is lost, the 0.00001020 dollar region will stand out as a stronger main support area and will be considered as a critical threshold where the price may seek a reaction again.
Supports 0.00001105 – 0.00001020 – 0.00000975
Resistances 0.00001285 – 0.00001380 – 0.00001480
LTC/USDT
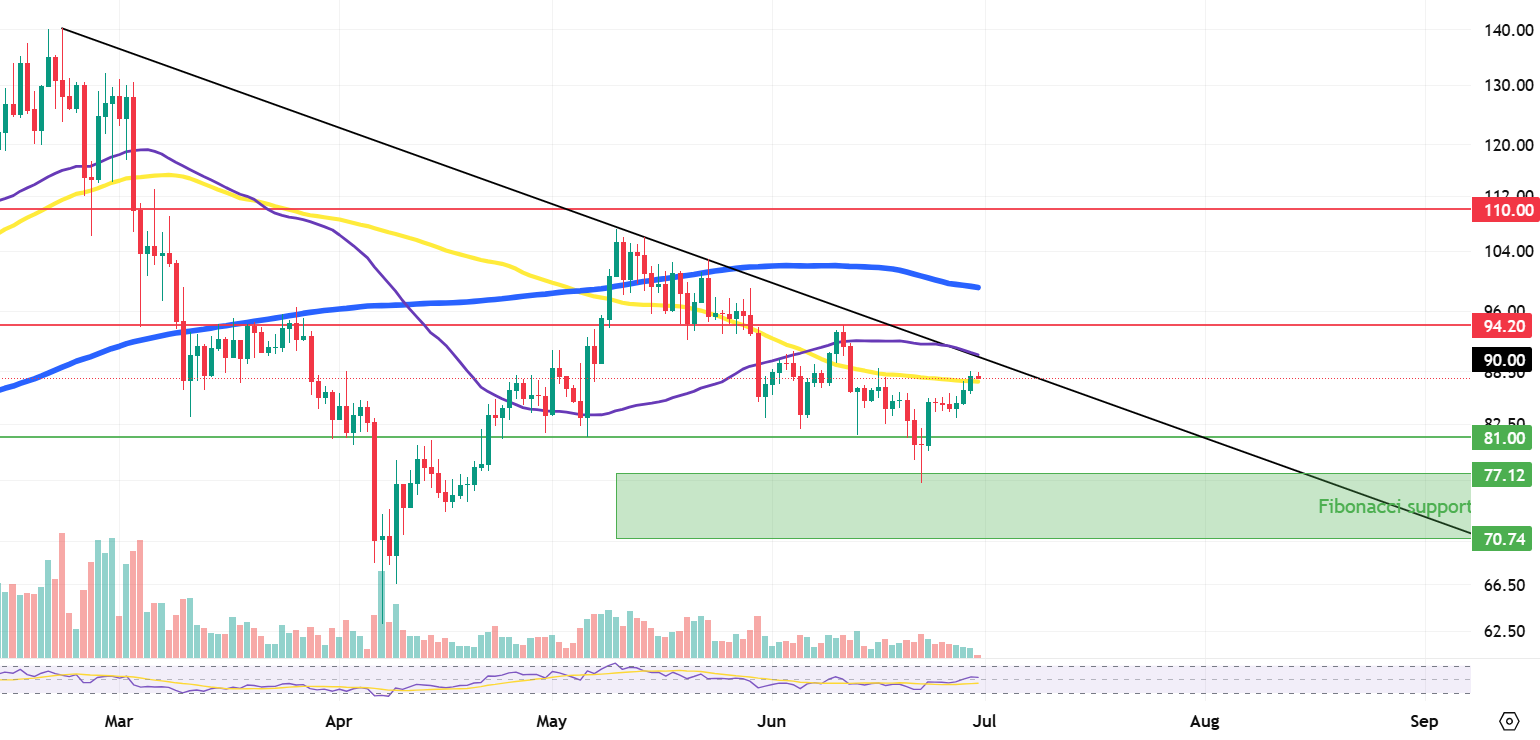
LTC ended last week with an increase of 9.66%, ending a five-week negative streak. It started the new week at $ 87.96. LTC, which also appreciated 2.14% against Bitcoin during this period, has a market capitalization of approximately $6.68 billion and maintains its 20th place in the crypto market. This shows that Litecoin is keeping pace with the general market movements. On the futures side, there was an increase of about $31 million in open positions compared to last week, with total open interest rising from $235 million to $266 million. Funding rates, on the other hand, remain positive.
As of this week, Litecoin is trading below the 50-period moving average (purple) and 200-period moving average (blue) and above the 100-period moving average (yellow). This technical structure suggests that the price continues to remain under pressure, but this pressure has been partially pierced. If the price succumbs to pressure again, the first stop can be expected at 81.00. Then there is the first potential support point of the fibonacci support zone at 77.12 and the last support level at 70.74. A reaction can be expected from this (green area) depending on the speed of the decline.
On the upside, the first resistance level can be expected as the horizontal downtrend at 90.00 and the 50-day moving average close to the same level. In case this downtrend ends, the first upside target can be expected at 94.20. If this level is exceeded quickly, the expectation that the movement to 110.00 will begin will strengthen. In this process, it should not be neglected that the 200-day moving average between the two levels is likely to create selling pressure with minor violations, although not pointwise.
Resistances 90.00 – 94.20 – 110.00
Supports 81.00 – 77.12 – 70.74
LINK/USDT
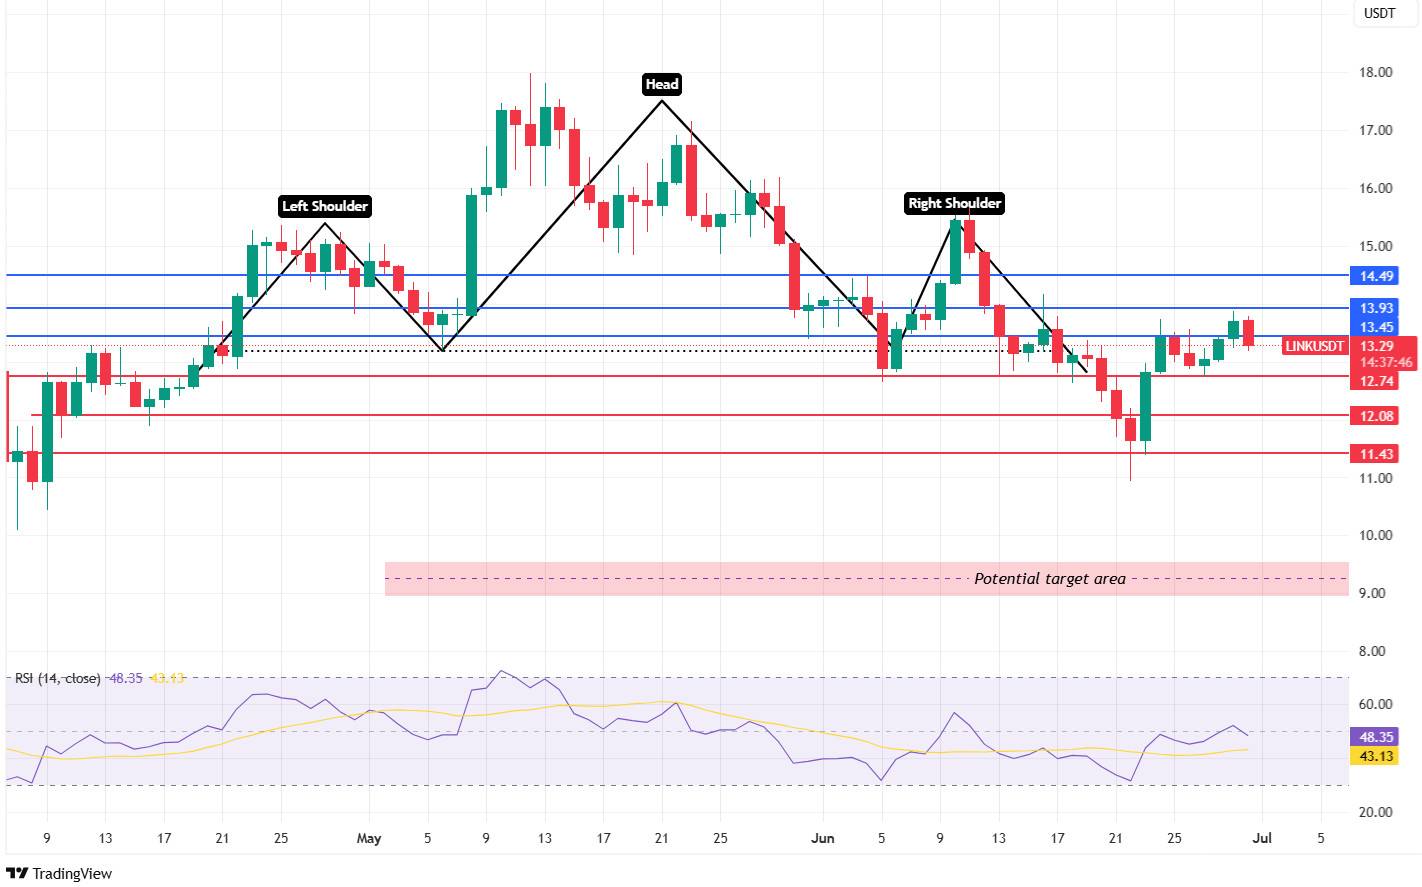
LINK, with the support it received from the $ 11.43 level we mentioned last week, made a rise up to $ 13.93 resistance. In the current outlook, it faces selling pressure at these levels. In case of persistence above the $ 13.45 level, the potential Shoulder-Head-Shoulder pattern may become invalid, which could pave the way for the uptrend to gain momentum. The critical resistance area to follow at this point is the $ 14.50 level. This level is very important for the continuation of the upward movement.
On the other hand, daily closes below the $ 13.45 level have the potential to move the price back to the $ 11 band; In case of loss of this level, it has the potential to move up to the $ 9 levels, which is the target zone. Relative Strength Index (RSI) is still in negative territory. Since the RSI’s transition to the positive zone may have a strengthening effect in terms of buying momentum, it should be carefully monitored in terms of direction determination.
Supports 12.74 – 12.08 – 11.43
Resistances 13.45 – 13.93 – 14.49
BNB/USDT
In the BNB ecosystem this week, the NEWT and SAHARA projects were listed on Launchpool. These listings are expected to have an overall positive impact on the BNB price as they increase the demand for BNB used in transaction fees and reduce the circulating supply as users stake BNB.
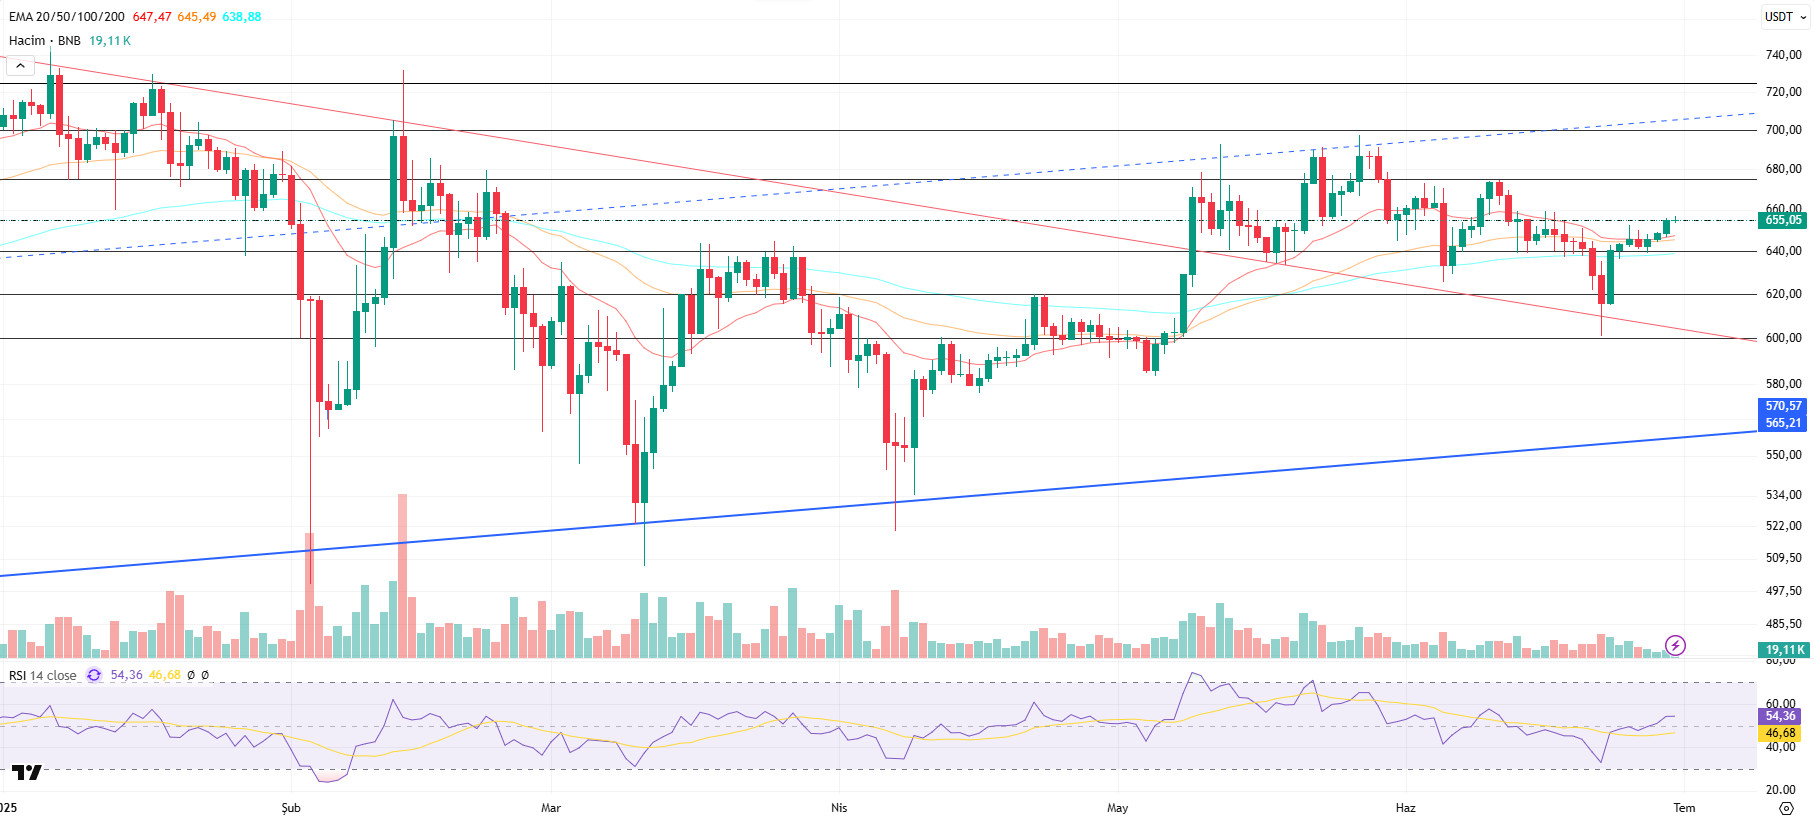
From a technical point of view, the retracement process that started with the impact of geopolitical developments in BNB/USDT caused the price to be pressured down to the $600 level. Finding support at this level, BNB entered a recovery trend and made a positive start to the week on Monday, June 23, as geopolitical tensions eased. In this context, the asset rose as high as $655 in the new week.
In terms of technical indicators, BNB/USDT, which is currently trading between $640 and $675, has seen a weak but positive movement in trading volume over the last one-week period. This indicates a moderate increase in the market’s buying appetite. On the other hand, the Relative Strength Index (RSI) displayed an upward trend due to the recovery in recent days and rose above both the average value and the 50 level. This outlook reveals that positive trends are effective in the short term, albeit limited.
Within the framework of the current technical structure, if the positive momentum continues, the BNB price is expected to test the $ 675 resistance in the first place. If this level is exceeded, the $700 and $725 levels stand out as the next strong resistance zones, respectively. On the other hand, if the $ 675 level cannot be exceeded and selling pressure increases, the price is likely to retreat back to the $ 640 support level. If this support is broken downwards, the 620 and 600 dollar levels should be monitored as important support zones, respectively.
Supports 640 – 620 – 600
Resistances 675 – 700 – 725
SUI/USDT
Sui had a strong start to the week with updates to its network and supply dynamics. While developer activity in the ecosystem maintained its momentum this week, new decentralized application (dApp) announcements and developer-focused events once again demonstrated Sui’s innovation potential. One of the highlights of the week was the big token lockup on June 29, 2025. In this context, approximately $122.8 million worth of SUI tokens were unlocked. This supply increase is carefully monitored in terms of liquidity and price dynamics in the market. On the other hand, strategic partnerships with leading financial institutions such as Franklin Templeton and integrations with global exchanges are increasing Sui’s adoption in the institutional space. Thanks to partnerships with Web3 security platforms, security capabilities such as real-time wallet protection, smart contract audits and threat detection have been significantly strengthened. These measures are critical to rebuilding user trust following incidents such as the Cetus attack in the past. All of these enhancements increase the scalability and operational efficiency of the Sui network, enabling it to serve larger user bases and higher transaction volumes.
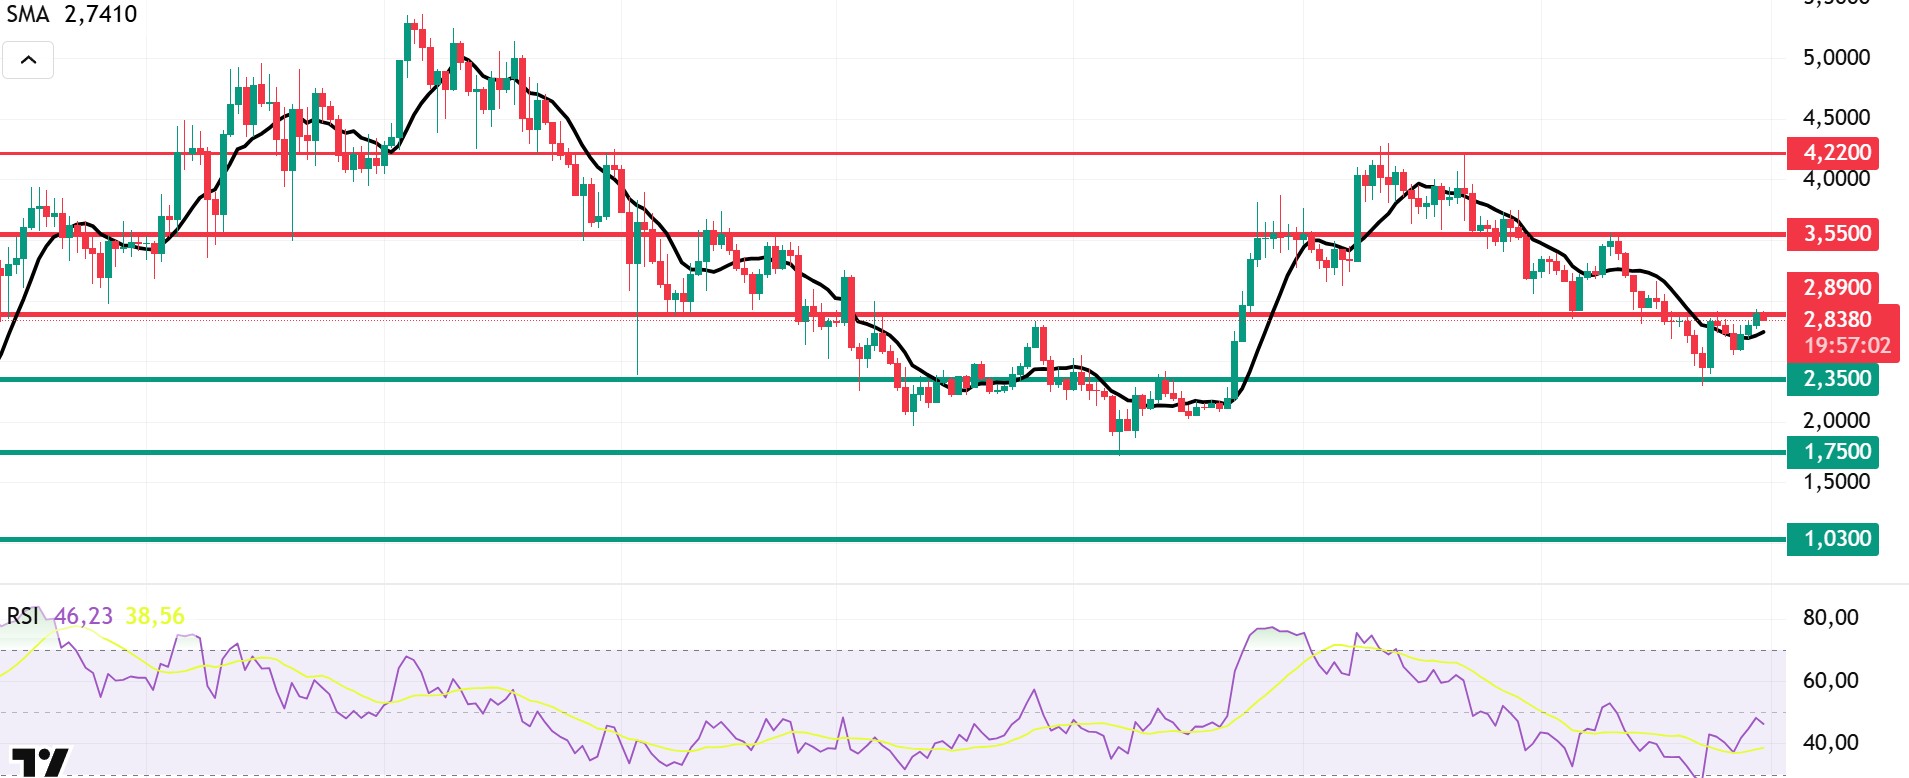
When we look at Sui’s technical outlook after the recent developments, it is seen that the price stabilized at around $2.83 on a weekly basis due to fundamental developments. Relative Strength Index (RSI) is currently in the range of 46.23 – 38.56. While this value range indicates that the market is close to the oversold zone, a rise in the RSI to the 55.00 – 60.00 range may indicate a potential buying opportunity. If the price moves upwards, the levels of 2.89 – 3.55 – 4.22 dollars can be followed as resistance points, respectively. However, if the price falls to new lows, RSI falling to the 20.00 – 30.00 band may indicate that selling pressure may deepen. In this case, the $2.35 and $1.75 levels stand out as strong support zones. Especially based on the trend line, a pullback to $1.75 seems technically possible. According to Simple Moving Averages (SMA) data, Sui’s SMA is currently at $2.74. If the price maintains above this level and crosses the SMA line upwards, the uptrend may regain strength.
Supports 1.03 – 1.75 – 2.35
Resistances 2.89 – 3.55 – 4.22
ADA/USDT
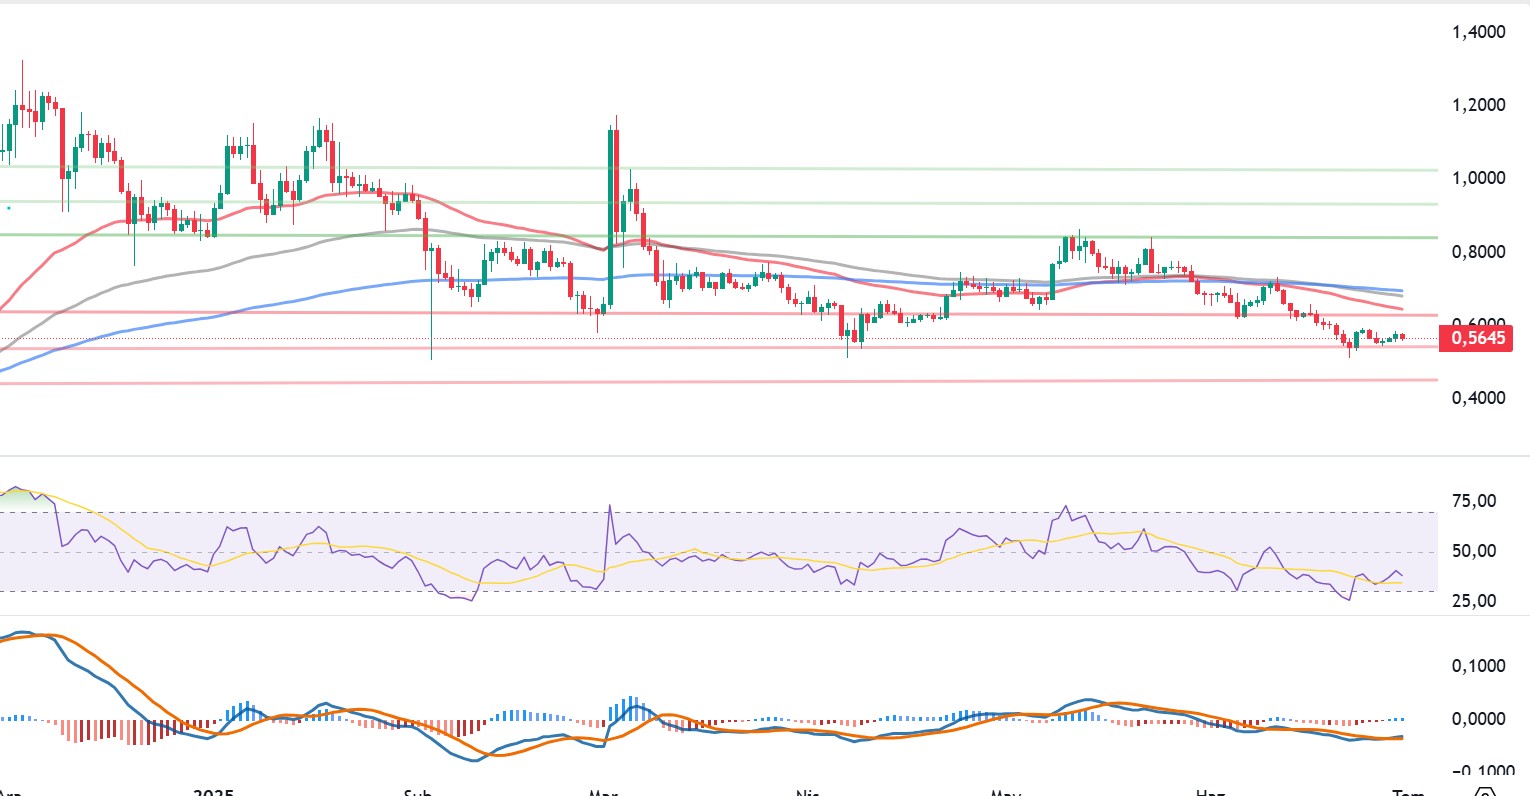
Cardano (ADA) fell 15% on the week, first falling to the support level of $0.5818 amid geopolitical tensions in the Middle East (US-Iran). Spot ETF uncertainty and the FED’s indecisive stance on interest rate policy played a role. As of June 25, the price experienced sharp retracements of 6.45%. ADA’s trading volume was about 37-38% above the 30-day average. The IOG announcement on June 26, the “Hydra Phase 2” testnet successes and the technical sessions held on June 25 and 26 reinforced the next generation Layer-2 solutions (Midgard, Hydra Tail, zkFold, Eryx) to improve network performance and scalability. While these developments provide strong fundamentals in the medium-long term, from a technical analysis point of view, the return above the EMA 200 and the break of the 0.6200 – 0.6500 dollar band will be the key signal for a short-term recovery.
One of the most notable technical developments on the chart is that ADA has been below all EMAs (20/50/100/200) since the beginning of the week. This indicates that the downtrend continues technically. On the daily timeframe, the price is trying to hold at $0.5639, but a clear EMA crossover has not yet been achieved. When the Relative Strength Index (RSI) indicator is analyzed, it is seen that ADA is close to the oversold zone. The RSI value is hovering near 40 levels, indicating that the market is under weak buying pressure, but there may be potential for a rebound in the short term. The Moving Average Convergence Divergence (MACD) indicator is in negative territory. The blue MACD line remains below the orange signal line, while the histogram bars indicate continued weak momentum. In the short term, there is a bullish crossover possibility on the MACD, but this is yet to be confirmed by the price. A break above the EMA 50 (0.6930) and EMA 200 (0.6170) moving averages could also be considered as a bullish signal. In the opposite case, if the decline continues, the $0.4837 and $0.4587 levels may be retested as the first supports, and if a break at these levels occurs, the downtrend may deepen.
Supports 0.4837 – 0.4587 – 0.4158
Resistances 0.8200 – 0.7320 – 0.7000
Legal Notice
The investment information, comments and recommendations contained in this document do not constitute investment advisory services. Investment advisory services are provided by authorized institutions on a personal basis, taking into account the risk and return preferences of individuals. The comments and recommendations contained in this document are of a general type. These recommendations may not be suitable for your financial situation and risk and return preferences. Therefore, making an investment decision based solely on the information contained in this document may not result in results that are in line with your expectations.