
BTC/USDT
Last week, the crypto market had an active week with important developments. FTX, which is in the process of bankruptcy, took a critical step by starting payments to creditors as of February 18, while US President Donald Trump’s statement that “the crusade against Bitcoin and crypto is over” added optimism to the markets. Strategy, led by Michael Saylor, emphasized its determination to continue Bitcoin purchases, while El Salvador increased its daily BTC purchases, raising its reserve to 93,417 BTC. However, the positive sentiment was disrupted by a large-scale hack attack on Bybit, which wiped out all of Bitcoin’s intra-week gains and changed risk sentiment again.
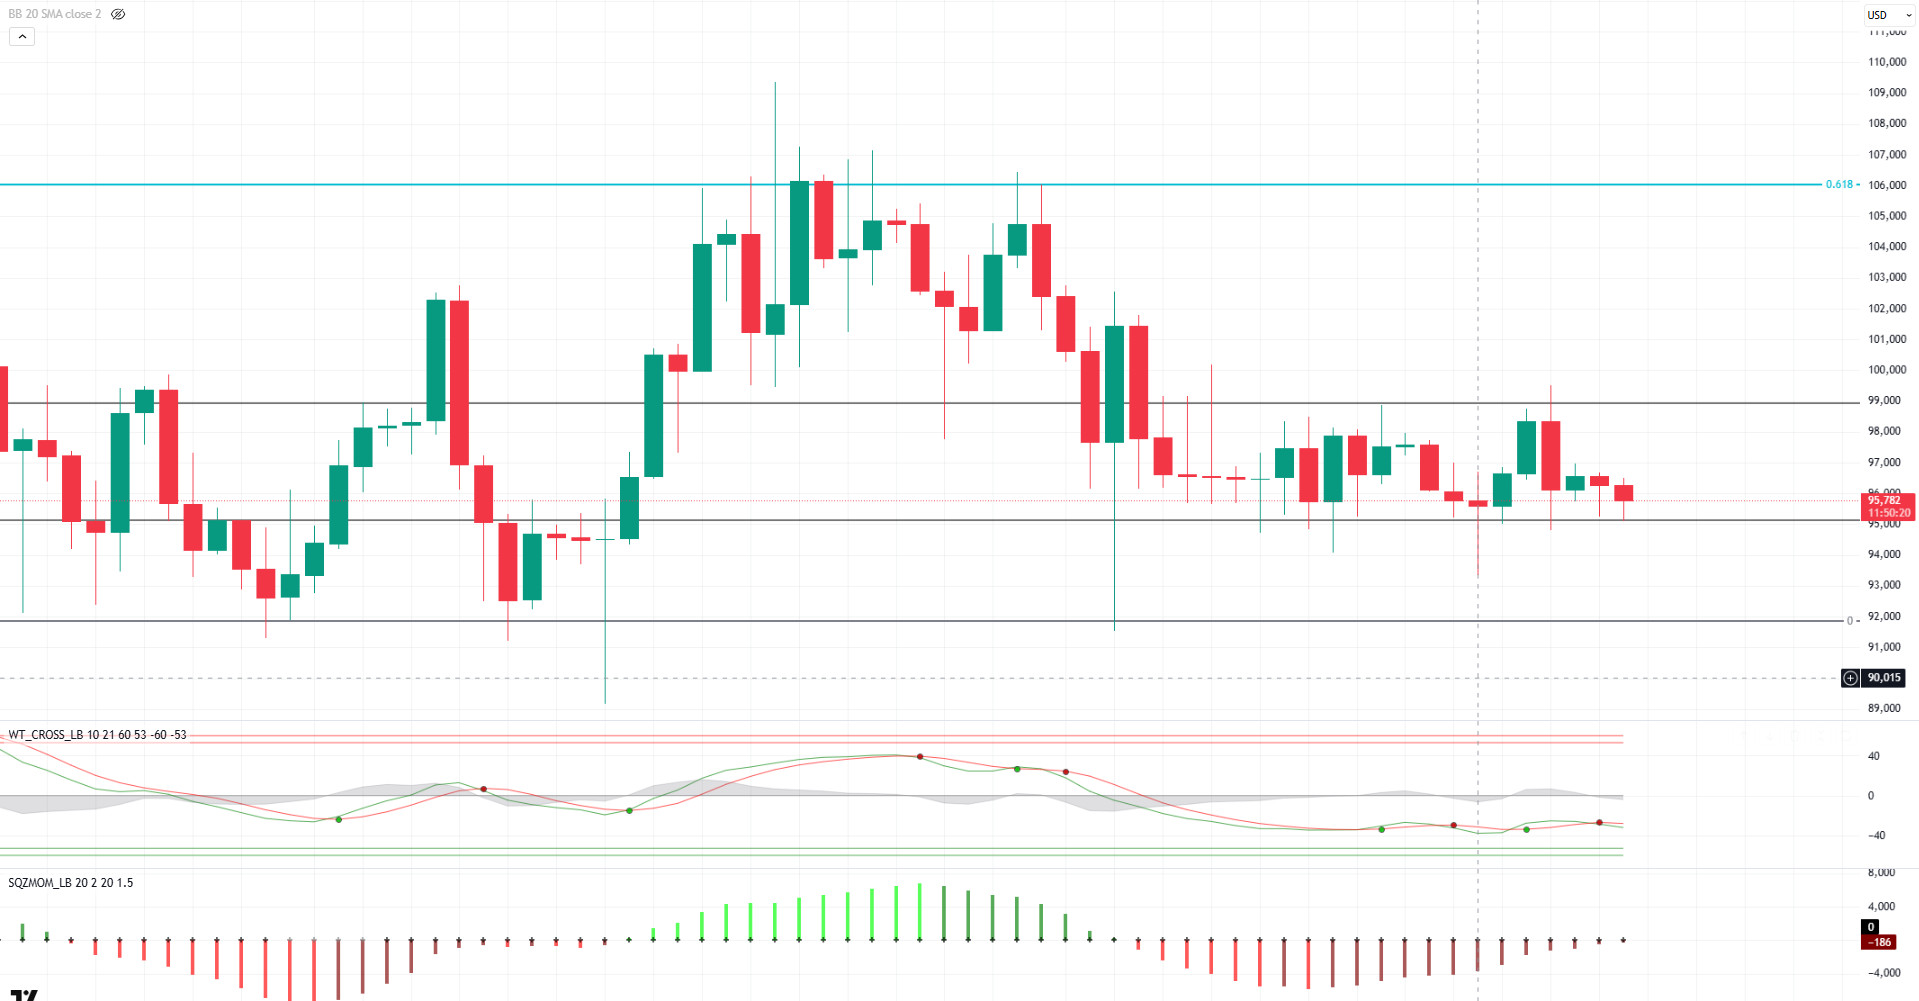
When we look at the technical outlook of BTC along with fundamental developments, BTC, which started the week at the 95,000 level, managed to recover and retested the 99,400 level, although it sagged below this level from time to time. Although it suffered a weekly depreciation of 0.65%, it is seen that it suffered a loss of up to 5%, falling as low as 94,850 with a sharp decline starting from the 99,400 level where it rose. Currently, BTC is trading at 95,600, consolidating in a horizontal band. This suggests that the market is in search of direction in the short term. When technical oscillators are analyzed, it is seen that the sell signal continues to be maintained while the daily charts are close to the oversold zone. On the other hand, although momentum indicators show a weak outlook, it is noteworthy that it has started to regain strength. The 95,000 level, which is the critical support level for BTC, stands out as an important reference point for the price to stay in the positive zone. If the upward movement continues, the 99,000 level can be targeted. However, pricing below the 95,000 level may increase selling pressure and pave the way for deeper retracements. When the weekly liquidation heat map is analyzed, the accumulation of long positions concentrated above the 93,000 level draws attention. This may indicate that BTC may see strong buying from this level in a possible bearish scenario
Supports 95,000 – 92,800 – 90,000
Resistances 97,000 – 99,100 – 101,400
ETH/USDT
The hacking of 446,000 ETH from Bybit wallets last Friday caused a major surge in the Ethereum market. The news prompted investors to panic sell, while the price of ETH plummeted to as low as $2,640. However, with the news that Bybit would buy ETH in the over-the-counter (OTC) market, the market showed signs of recovery and the price rose again to $2,850. However, this rise could not be permanent. As selling pressure increased towards the close of the week, ETH fell again and displayed an uncertain outlook, falling below the $2,700 level. One of the notable points in this process was that no liquidity outflow was observed on decentralized exchanges (DEX). While the amount of ETH in liquidity pools remained largely stable, centralized exchanges saw a significant increase in trading volumes. This could indicate an attempt to sell the hacked ETH through decentralized exchanges. Or it could indicate that market makers are active on centralized exchanges, but are taking a more stable position in the DEX ecosystem.
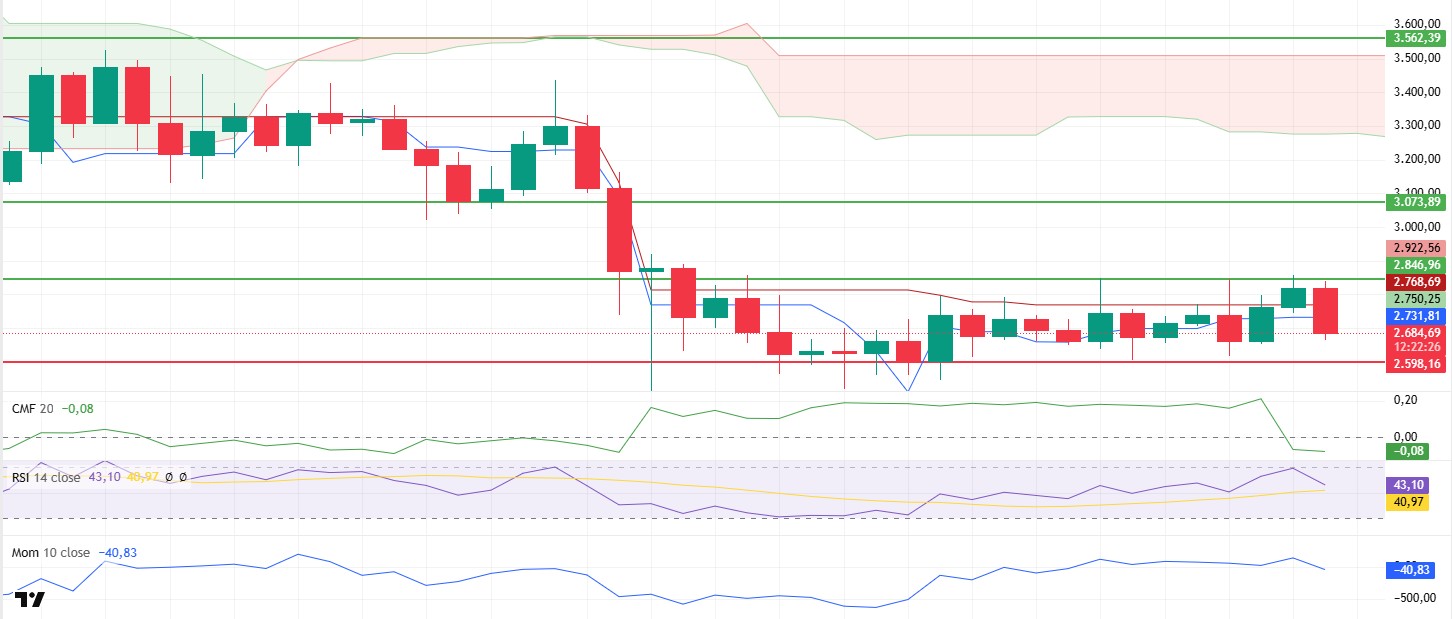
Looking at technical indicators and on-chain activity, Cumulative Volume Delta (CVD) data reveals that there is no strong selling pressure in the spot market, but there is serious selling on the futures side. Short trades have increased, especially in leveraged positions, and the decline in the funding rate confirms this trend. This suggests that the current selling pressure is mostly coming from the derivatives markets and that spot traders are not selling aggressively. Chaikin Money Flow (CMF) data fell sharply into negative territory, indicating that a large amount of liquidity has left the market, while Relative Strength Index (RSI) and momentum indicators remained strong, giving positive signals that buyer interest may be high at certain support levels. When the Ichimoku indicator is analyzed, the price breaking below the tenkan and kijun levels creates a negative outlook, while the kumo cloud remains stable and the gap between tenkan and kijun does not widen, indicating that the market has not yet set a clear direction. This suggests that the price may continue to move in an uncertain zone in the short term.
ETH price has been stuck in the $2,850-$2,598 range for a long time, and the fact that the current sell-off is mainly coming from futures suggests that the price may have the potential for an upward movement in the medium term. Technical indicators also support this view. If the $2,598 level is maintained as a strong support, the price is likely to try to move upwards again. However, daily closes below the $2,598 level could put a sharp selling pressure on the market and cause the price to enter a deeper correction.
Supports 2,598 – 2,404 – 2,100
Resistances 2,846 – 3,073 – 3,562
XRP/USDT
With the SEC’s acceptance of XRP ETF application filings, the price of XRP, which has depreciated in recent weeks, has seen a short-lived recovery, but the price has fallen again as we enter the new week. This price action has not caused a major shift in technical indicators while maintaining the general uncertainty in the market. However, some important signals are giving clues about the future direction of the price.
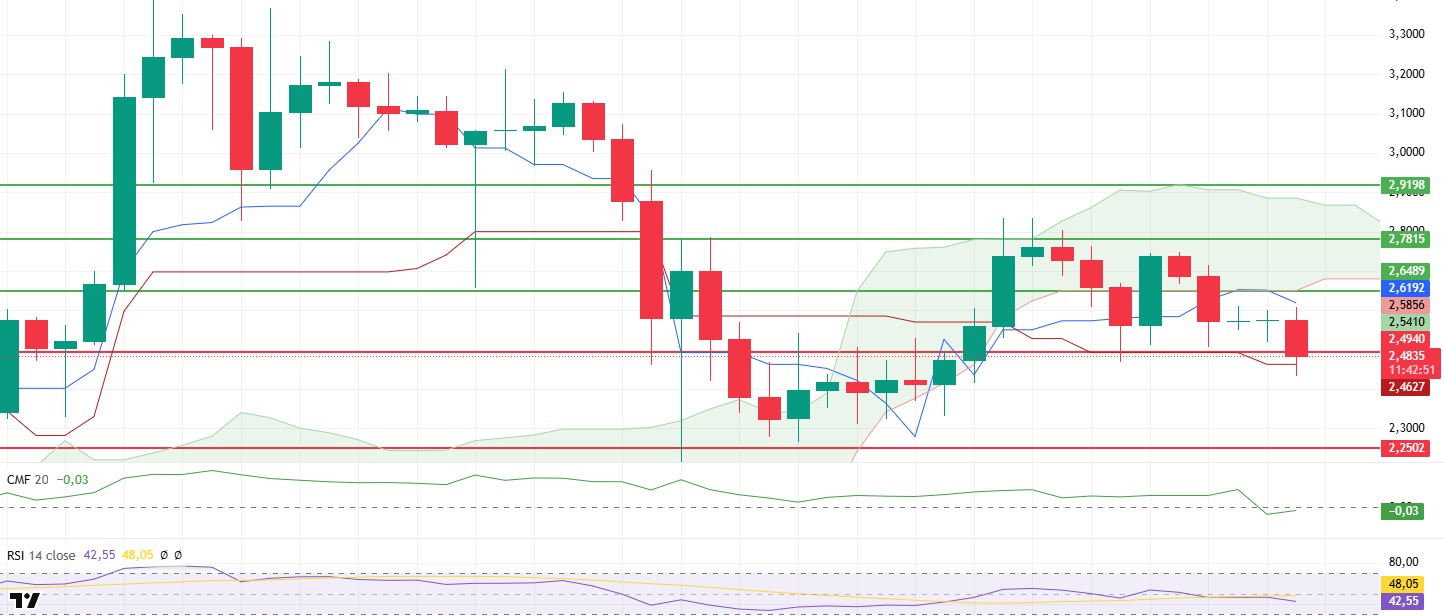
First of all, when the Ichimoku indicator is analyzed, it is seen that the XRP price moves between the tenkan and kijun levels on the daily timeframe. This shows that the market is unable to determine a clear direction and the price is trading in a tight zone. However, the fact that the price touched and rejected the kumo cloud suggests that downside risks are more dominant. The fact that the kumo cloud acts as resistance at this stage stands out as an important factor limiting XRP’s rise. Despite the price movements, the Chaikin Money Flow (CMF) indicator remains strong, indicating that there is no dramatic liquidity outflow from the market, suggesting that the market is still resilient in the medium term and possible upside support. In particular, the positive divergence in the CMF indicator is an important signal that potential price rises could be realized in the coming period. However, the Relative Strength Index (RSI) breaking a key support level and weakness in momentum suggest that downward pressure on the price is increasing. Especially if XRP closes below the $2.49 level, it is assessed that sales may accelerate and a deeper downward wave may be triggered. The weakening of the RSI indicates that the strength of buyers is waning and the market has not yet signaled a strong recovery.
Overall, the XRP price continues to trade in an uncertain range and the $2.49 level stands out as a critical threshold. If the price continues to stay above this level, it can be said that upward movements may continue. However, daily closes below the $2.49 level may bring about sharp sales and cause the price to head towards lower support levels.
Supports 2.4940 – 2.2502 – 2.0201
Resistances 2.6489 – 2.7815 – 2.9198
SOL/USDT
Investor confidence in the network has continued to wane as the past week has been linked to high-profile carpet-pulling scams in the Solana ecosystem. However, Solana launched its memecoin launchpad, the Pump.fun mobile app. Asset manager Grayscale on Tuesday announced a fund based on the Solana network’s PYTH network-based governance token, adding to growing investor demand for digital asset-focused investment products to its offerings. On the other hand, the Trump Company plans to airdrop to eligible NFT and trading product buyers in the Solana ecosystem. According to BlockBeats, Toronto-based cryptocurrency holding company Sol Strategies announced an increase in SOL holdings. The company purchased an additional 12,456 SOL tokens between February 7 and February 14, 2025. Solana’s annual inflation increased by 96.30% a week after the SIMD 30.5% implementation introduced a new priority fee distribution model. Coinbase launched CFTC-regulated SOL futures in the US. On the Onchainde side, the platform saw a significant drop in daily trading volume, down 50% from its high in January 2025. The upcoming token unlock could further weaken Solana’s price by increasing selling pressure. On March 1, 11.16 million SOLs worth over $2 billion will be unlocked at current prices. The total value locked (TVL) has fallen from highs of over $12 billion to $8.9 billion, while the number of transactions continues to rise, but the volume has dropped from $35 billion to $2.5 billion. At the same time, Solana’s network activity slowed significantly, with active addresses falling to a five-month low. Decentralized exchange (DEX) trading on Solana, however, hit a five-week low of $2.61 billion, a 28% drop in on-chain trading figures
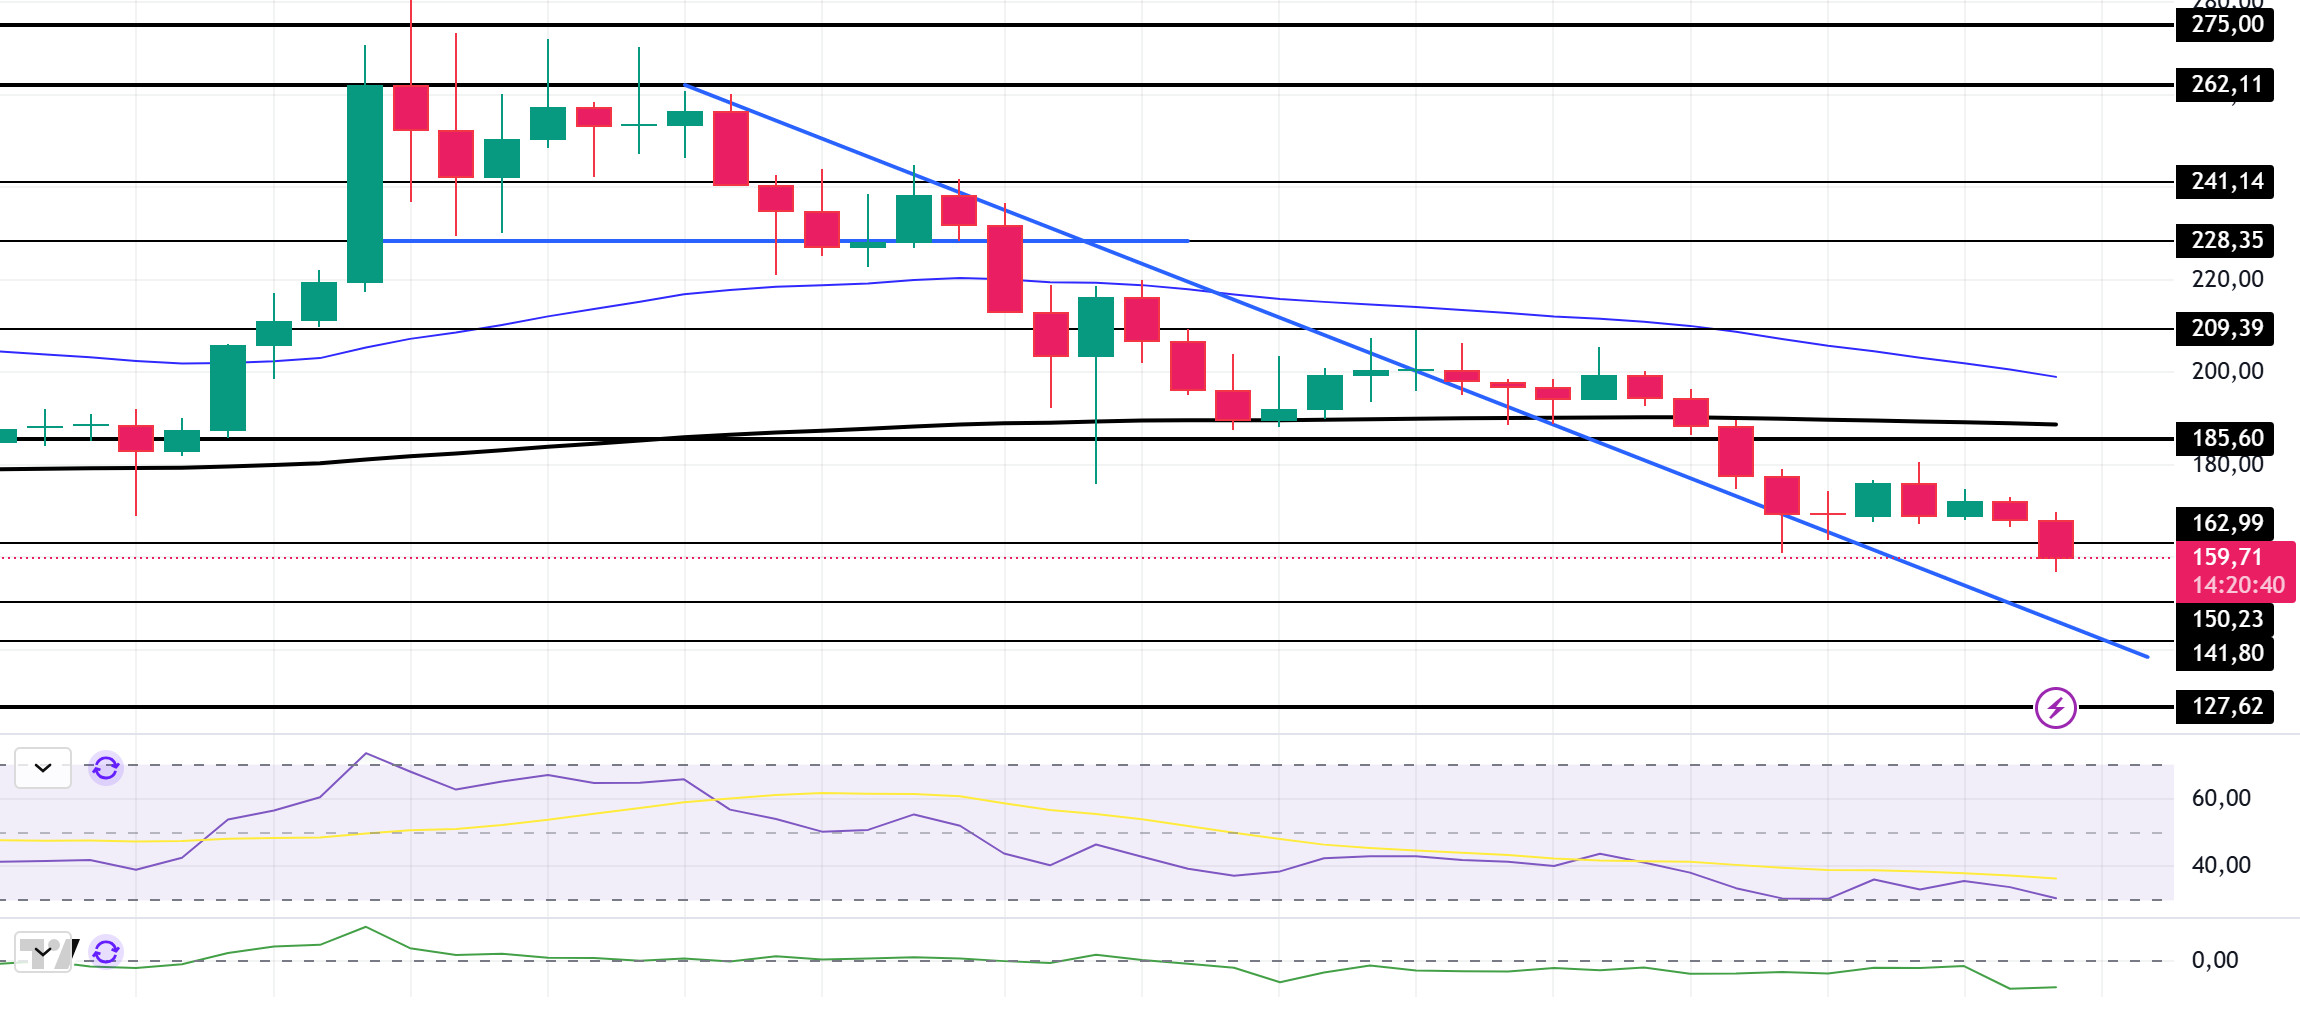
SOL has started to move sideways since last week, exhibiting slight declines. The price is below the 50 EMA (Blue Line) and the 200 EMA. On our daily chart, the 50 EMA (Blue Line) continues to be above the 200 EMA (Black Line). This shows that the trend is bullish in the medium term. Although the price broke the downtrend that started on January 26 to the upside, it used the continuation of this trend as support and moved sideways. The Relative Strength Index (RSI) is near the 14 oversold level. However, when we examine the Chaikin Money Flow (CMF)20 indicator, it is close to the middle level of the negative zone, but the increase in volume may strongly increase money inflows. If the positive results in macroeconomic data and positive developments in the ecosystem continue, it may test the first major resistance level of $ 209.39 . In case of negative macroeconomic data or negative news in the Solana ecosystem, the $150.23 level can be followed and a buy point can be determined.
Supports 162.99 – 150.23 – 141.80
Resistances 185.60 – 209.39 – 228.35
DOGE/USDT
Elon Musk’s DOGE announces SEC audit for fraud, abuse and waste. The price of Dogecoin could increase if Elon Musk and Trump offer $5,000 stimulus checks. The checks would be in the form of a DOGE dividend from savings made by Musk’s team. House Democrats are pressuring GOP lawmakers to defect by pushing the Taxpayer Data Protection Act to block Musk’s DOGE from accessing federal records. On the other hand, betting markets indicate that the spot Dogecoin (DOGE) ETF is more likely to be approved. According to Polymarket data, it now has a 37% chance of approval by the end of 2025, up from 75% since Donald Trump’s inauguration. On the on-chain data analysis provided by Santiment shows that the Dogecoin network has experienced a sharp decline in whale activity by about 88% since mid-November 2024.
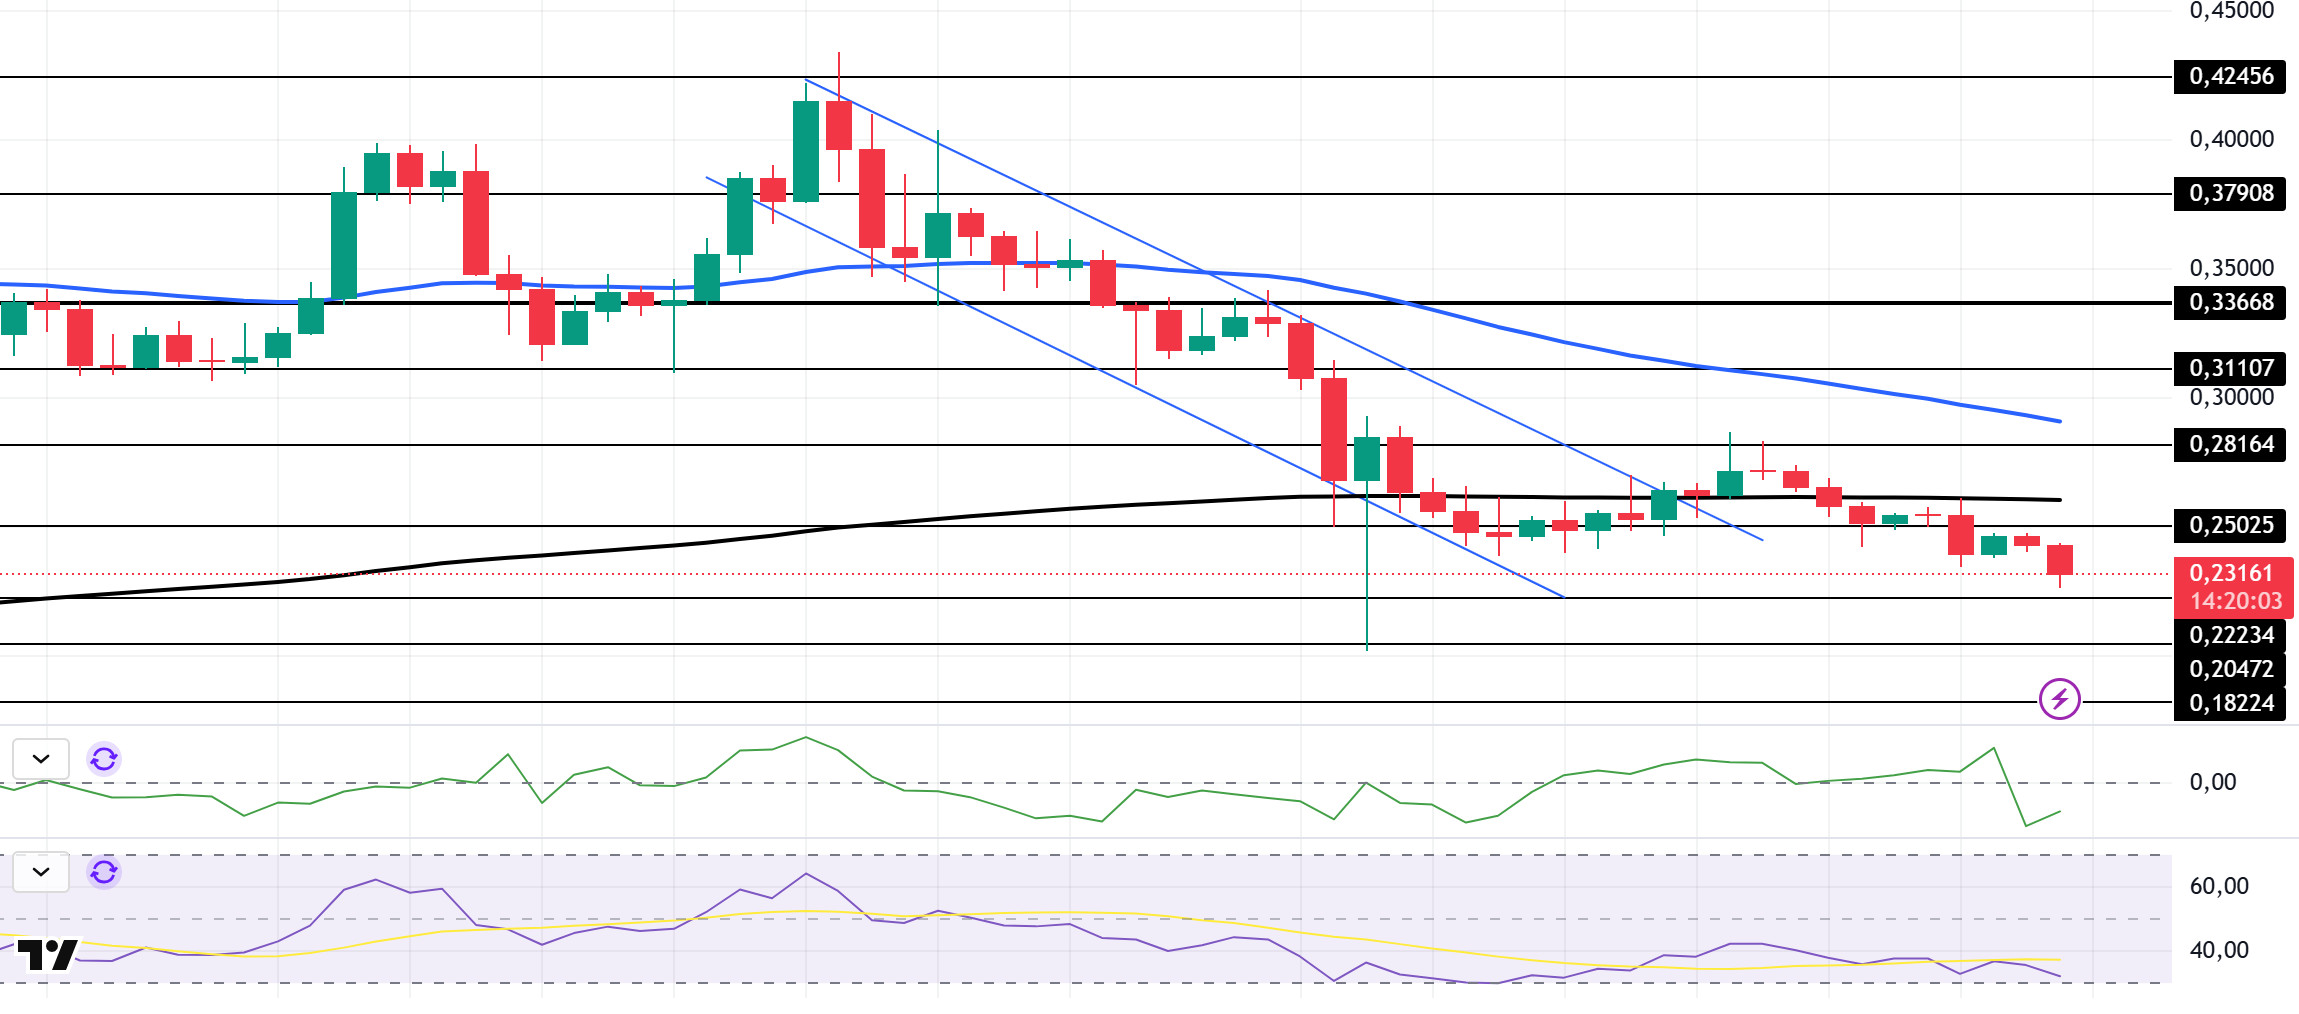
When we look at the daily chart, the asset, which has been in a downtrend since January 17, has continued its decline and broke the $ 0.25025 level downwards. Moving horizontally at this level, the asset may retest the 200 EMA (Black Line) as resistance. Although the 50 EMA (Blue Line) remains above the 200 EMA (Black Line), indicating that the bull continues for the asset, the difference between the two averages is about 11.87%, which may increase the probability of continuing to fall. If this bearish momentum continues, the asset may test the $0.20472 level once again. When we look at the Chaikin Money Flow (CMF)20 indicator, the fact that it is in the negative zone and money outflows are high, but the volume is starting to increase shows us that there may be a price increase. Relative Strength Index (RSI)14 was in the oversold zone. In case of possible macroeconomic conditions and negative developments in the ecosystem and retracements, the $0.20472 level can be followed as a strong support. In case the retracement ends and the rises begin, the 0.33668 dollar level should be followed as a strong resistance.
Supports: 0.22234 – 0.20472 – 0.18224
Resistances 0.25025 0.28164 – 0.31107
TRX/USDT
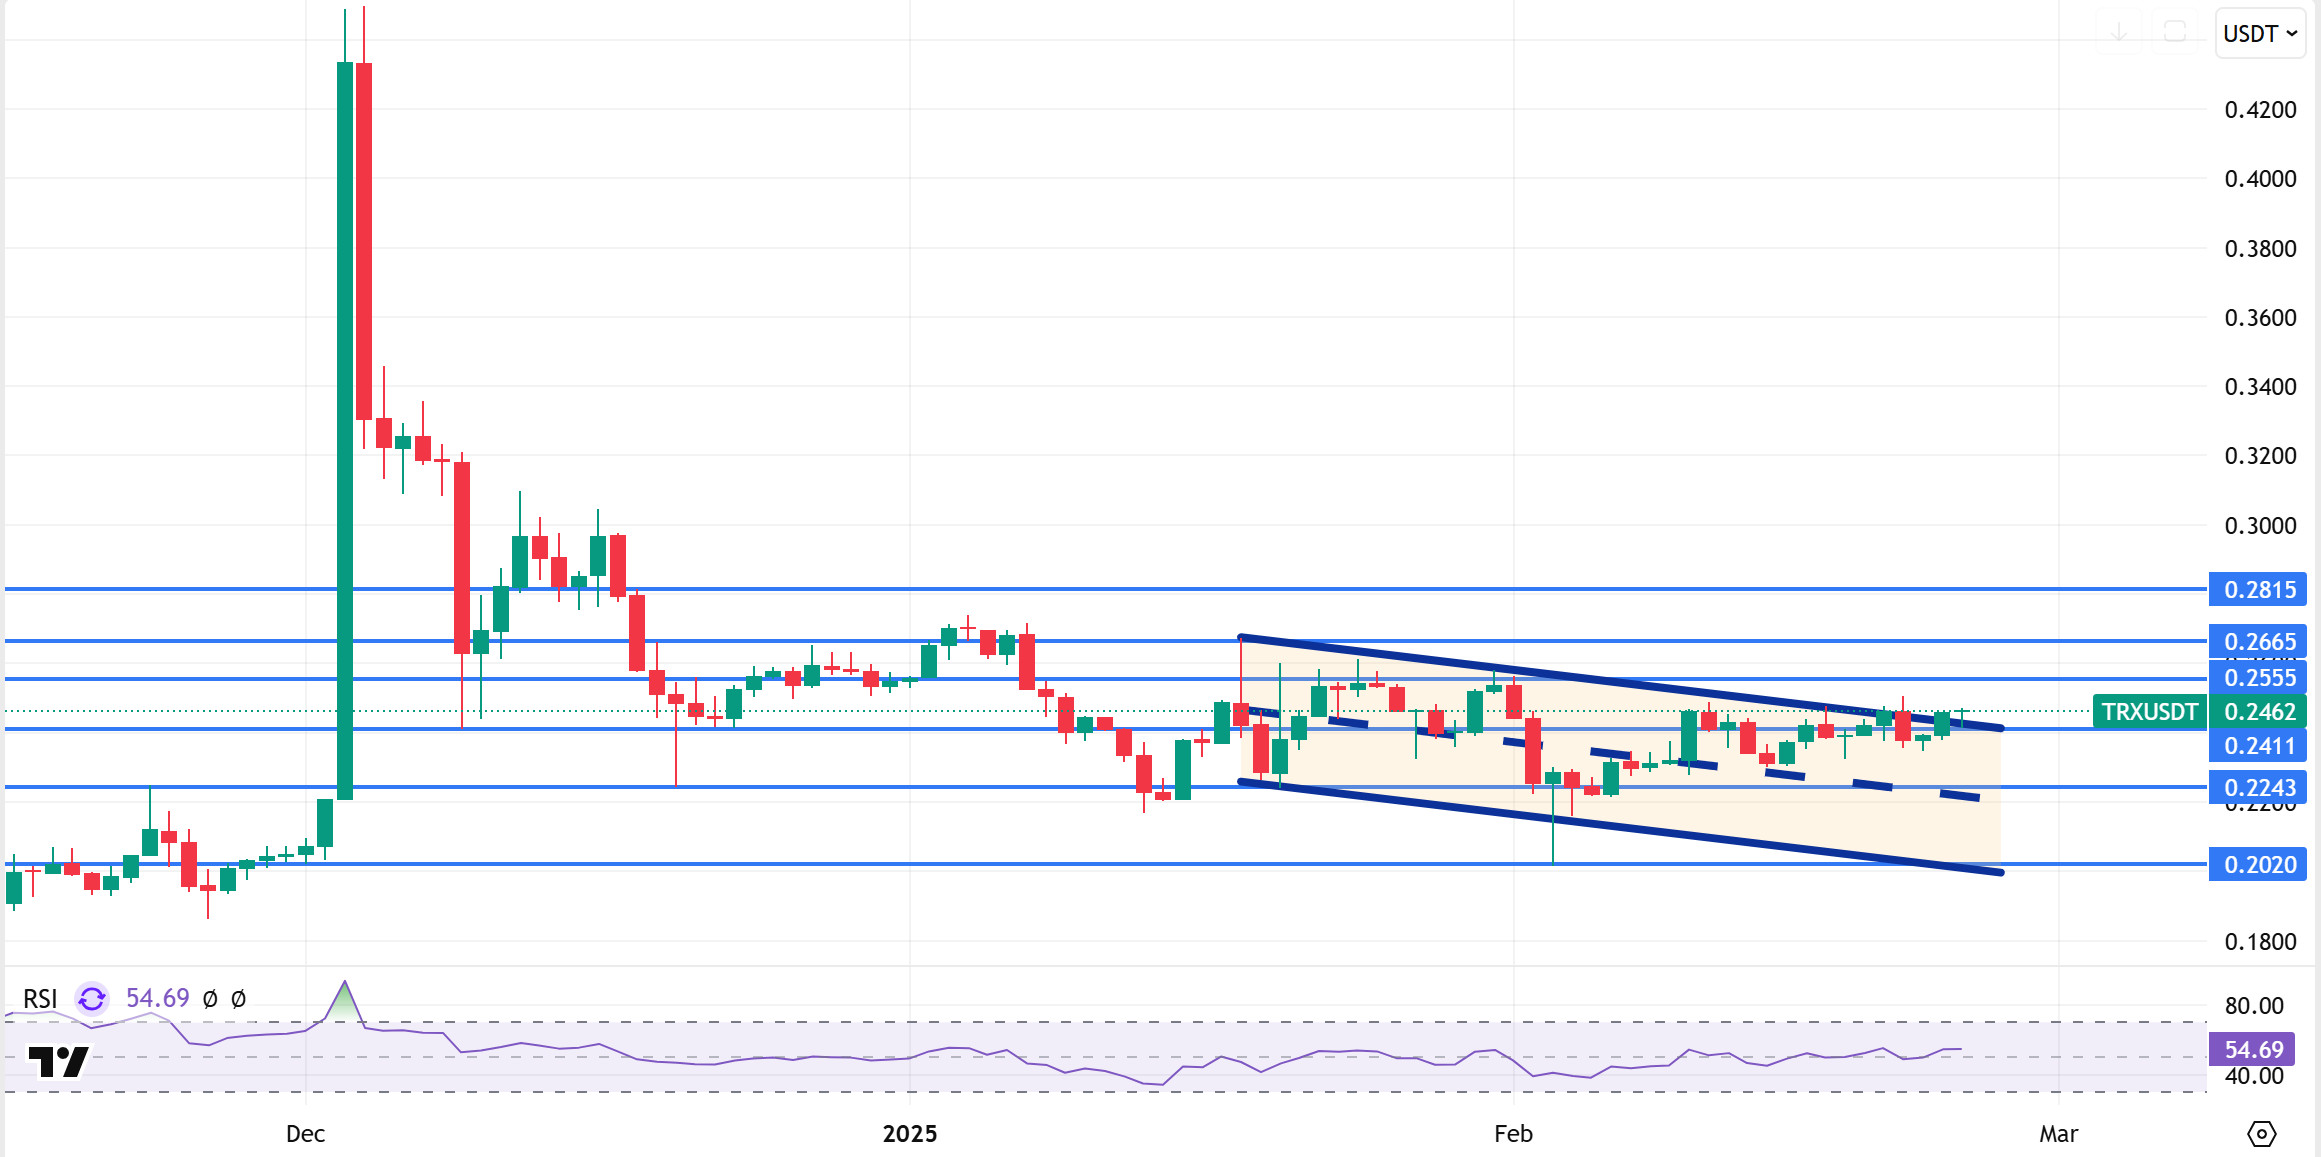
TRX, which started last week at 0.2424, rose about 1.5% during the week and closed the week at 0.2459. This week, US conference board consumer confidence, gross domestic product, unemployment claims data will be released. In particular, the market will closely follow the unemployment claims data. If this data is announced above expectations, it may be priced positively by the market.
TRX, currently trading at 0.2462, is in the upper band of the bearish channel on the daily chart. With a Relative Strength Index value of 54, it can be expected to move towards the bearish channel middle band by falling slightly from its current level. In such a case, it may test 0.2243 support. If it cannot close daily below 0.2243 support, it may increase with the buying reaction that may come and try to break the upper band of the channel again. In such a case, it may test 0.2555 resistance. As long as it stays above 0.2020 support on the daily chart, the bullish demand may continue. If this support is broken, selling pressure may increase.
Supports 0.2411 – 0.2243 – 0.2020
Resistances 0.2555- 0.2665 – 0.2815
AVAX/USDT
AVAX remained almost unchanged in terms of price, closing at $24.83 for the week after starting trading at $24.84 at the opening of last week. Price movements, especially last week, showed that the market remained indecisive, fluctuating within a horizontal band instead of a clear uptrend or downtrend.
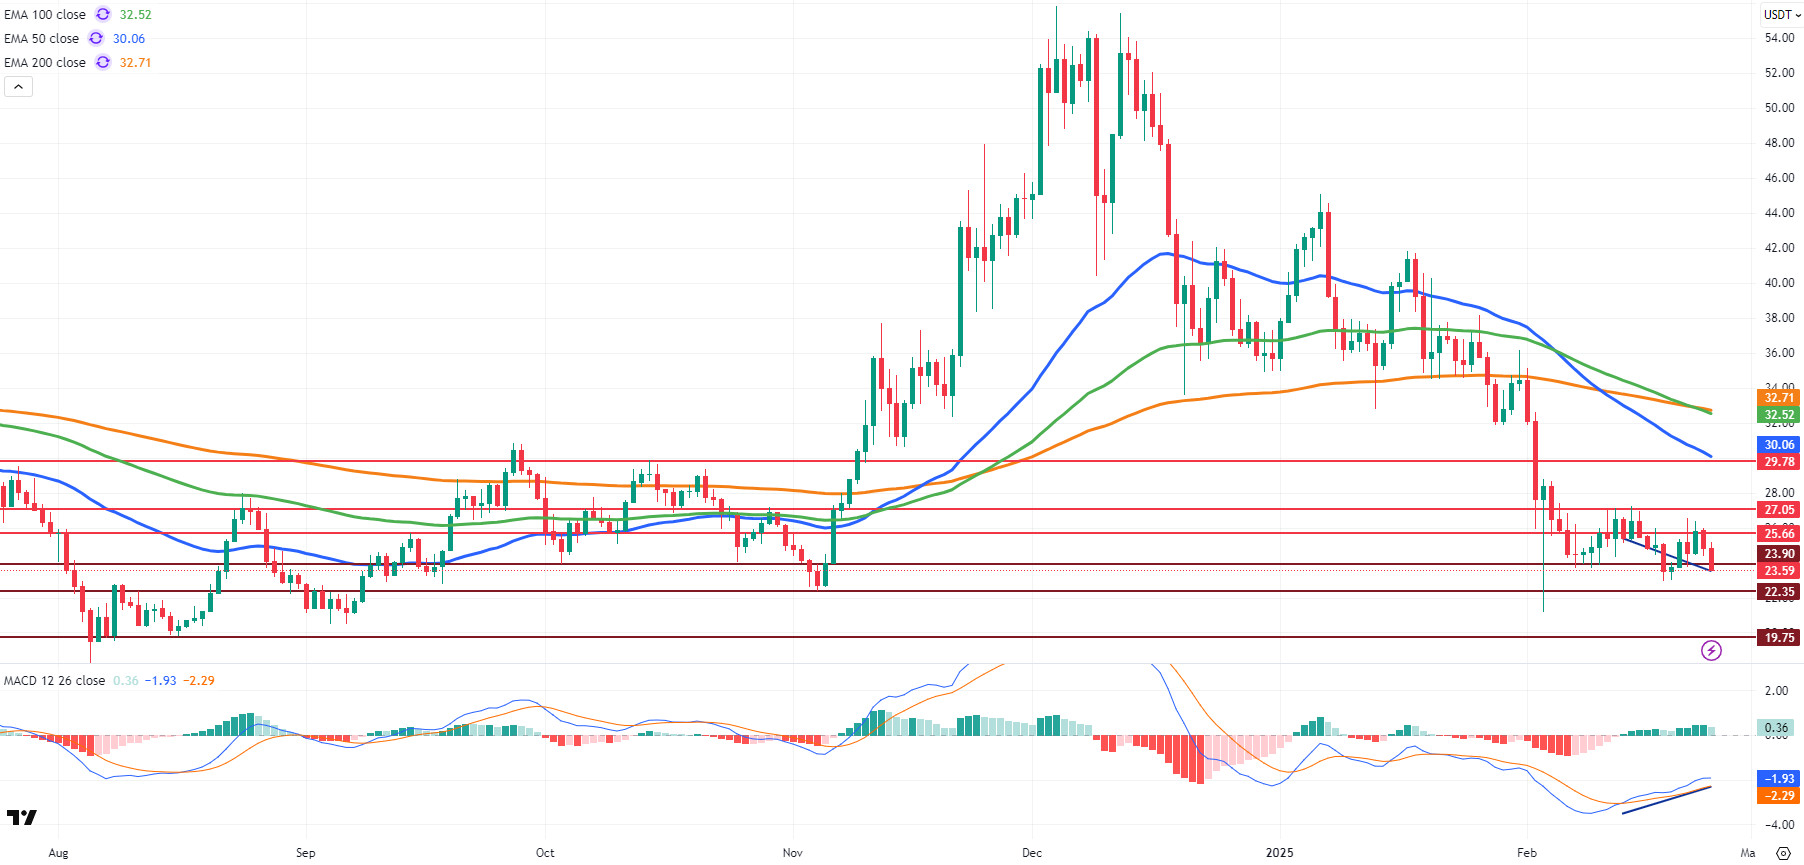
When we examine the daily chart for AVAX, which started the new week with a decline, the Moving Average Convergence/Divergence (MACD) indicator is moving above the signal line. This indicates that the negative momentum has started to weaken and the selling pressure is decreasing. However, no significant upward movement is observed in AVAX price yet. Although the momentum is positive, the fact that the price is declining suggests that buyers are not strong enough in the market and selling pressure continues. It is also trading well below the critical Exponential Moving Average (EMA) levels. This suggests that the price remains in an overall downtrend and that an upside move could face strong resistance. Especially below the EMA50, the price’s recovery may be limited in the short term.
AVAX, which is in search of short-term direction, is testing the $ 23.90 support level on the opening day of the week. In case of a daily close below this level, selling pressure may increase and AVAX may retreat to $22.35 and then $19.75 respectively. In contrast, AVAX may test the $25.66 resistance level if the MACD indicator continues its ascent towards the positive zone above the signal line and strong buying comes in. If this level is broken, AVAX may start a bullish move towards the resistance levels of $27.05 and then $29.78.
(EMA50: Blue Line , EMA100: Green Line , EMA200: Orange Line)
Supports 23.90 – 22.35 – 19.75
Resistances 25.66 – 27.05 – 29.78
SHIB/USDT
Last week, the SHIB community managed to burn 128 million tokens out of circulation. This demonstrates the continuation of the deflationary strategy and the ecosystem’s aim for long-term value growth through token scarcity. In the same period, updates to the ShibaSwap platform have contributed to the expansion of the ecosystem by improving the user experience, increasing transaction speed and providing new liquidity options. These developments are expected to strengthen SHIB’s overall ecosystem structure, positively impacting community trust and investor interest in the long term.
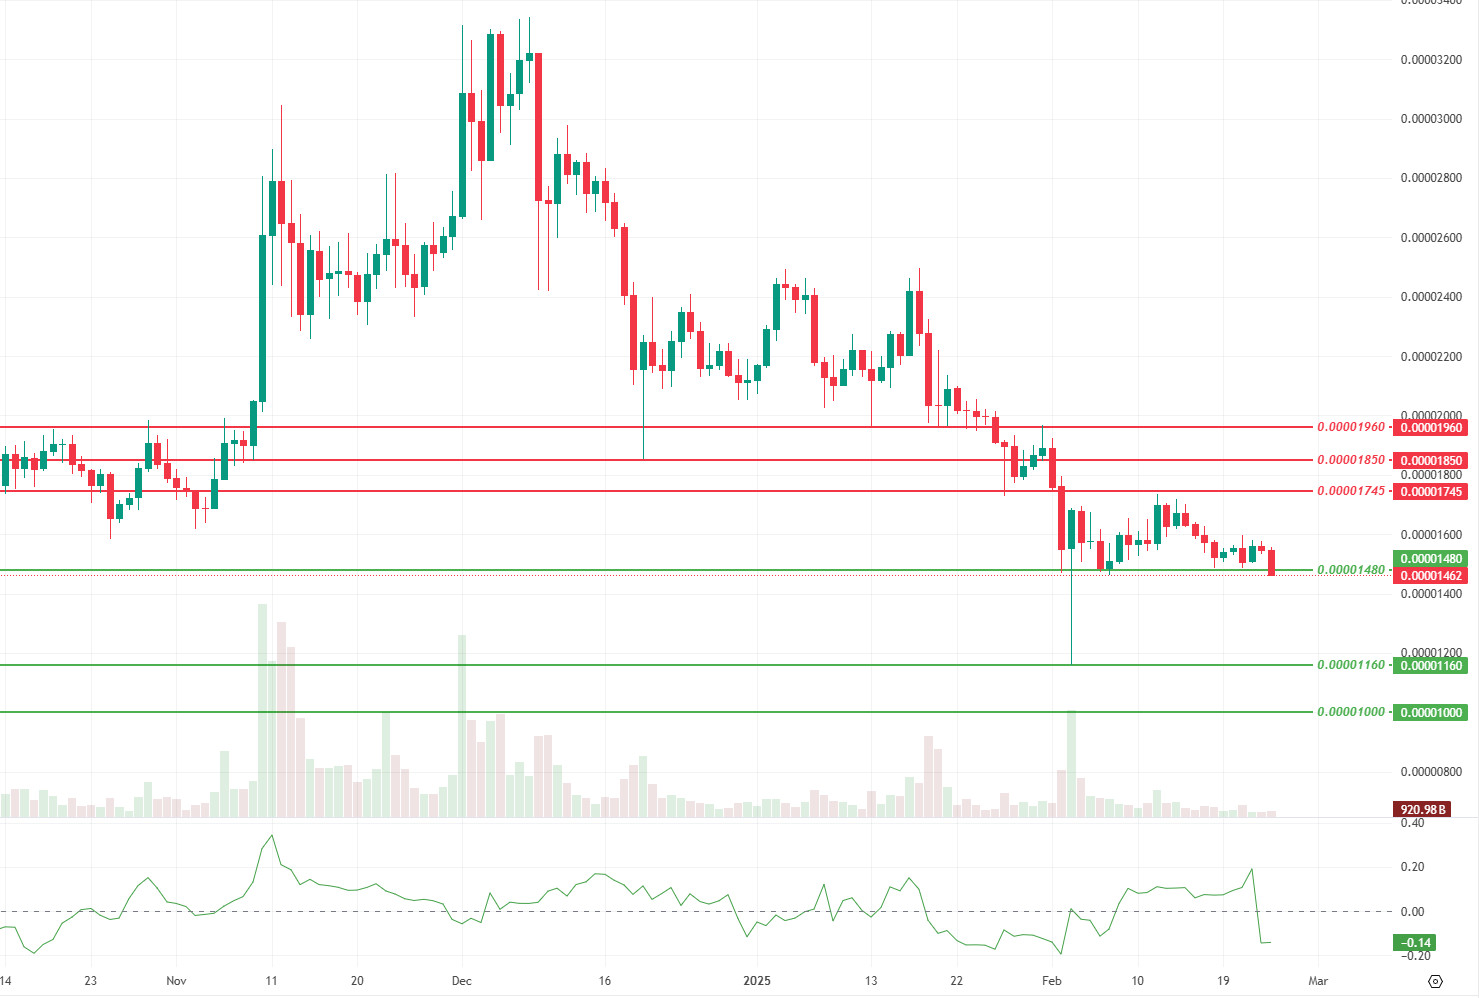
Technical analysis of Shiba Inu (SHIB) shows a significant decrease in momentum, trading volume and volatility this week after last week’s dynamic market movements. The data on the CMF (Chaikin Money Flow) oscillator reveals that compared to the previous week, buying pressure has been replaced by selling pressure. While SHIB is reacting to the support zone at $0.00001480, if this level is broken, pullbacks towards the next support zone of $0.00001160 may be observed. On the other hand, if buyers re-enter the market with the reaction from the price level of $ 0.00001480, an upward movement towards the first resistance level of $ 0.00001745 is expected.
Supports 0.00001480 – 0.00001160 – 0.00001000
Resistances 0.00001745 – 0.00001850 – 0.00001960
LTC/USDT
Litecoin, which rose by 3.29% in the past week, started a bullish streak with its second positive closing week. With this increase, it managed to remain in 15th place in the market capitalization ranking. According to Arkham data, the amount of open positions in futures decreased from 415 million dollars to 367 million dollars, while funding rates in futures markets continue to be positive as in the previous week.
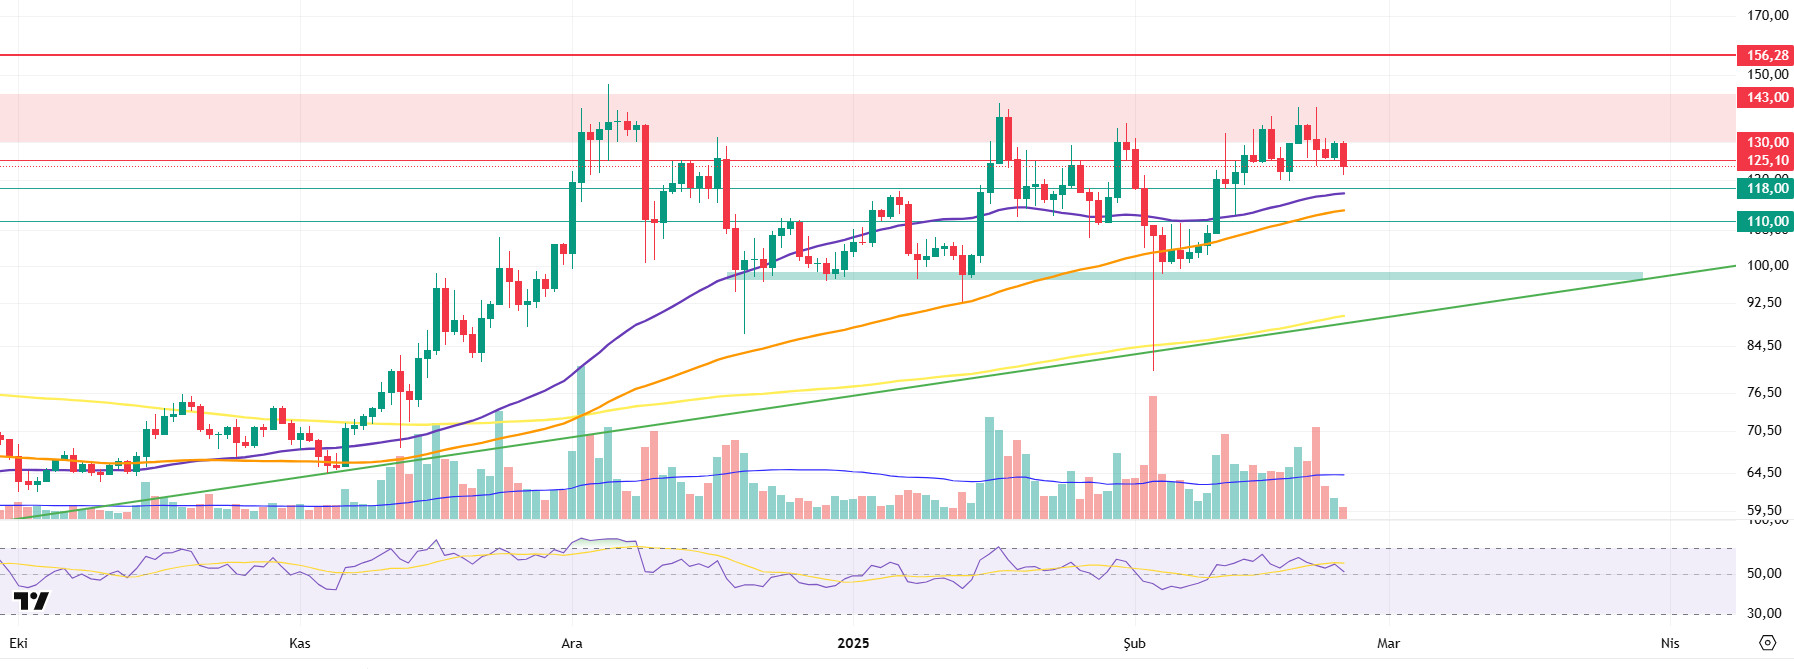
Litecoin’s daily chart shows that the price remains above the 50 (Purple line), 100 (Orange Line) and 200 (Yellow line) period moving averages. However, it is noteworthy that the week started negatively and the 125.10 level, which turned into a support level the previous week, was broken, after which this level became resistance again. In addition, it is clearly observed that intense bullish attempts were made between 130.00 – 143.00 levels, but this resistance band has not yet been overcome.
If this resistance zone cannot be broken and the decline in Bitcoin continues, the first support level stands out as 118.00 in downward movements. This level can be considered as intermediate support. Then, a more pronounced buying pressure is likely to occur with a potential support at 110.00. The presence of 50 and 100-day moving averages between these two intermediate support levels increases the potential for the price to move horizontally if it falls to this region. Finally, the green band at 98.74 can be considered as major support. In case this area is quickly breached, the price is likely to retreat to the trend support.
Resistances 125.10 – 130.00 – 143.00
Supports 118.00 – 110.00 – 98.74
 LINK/USDT
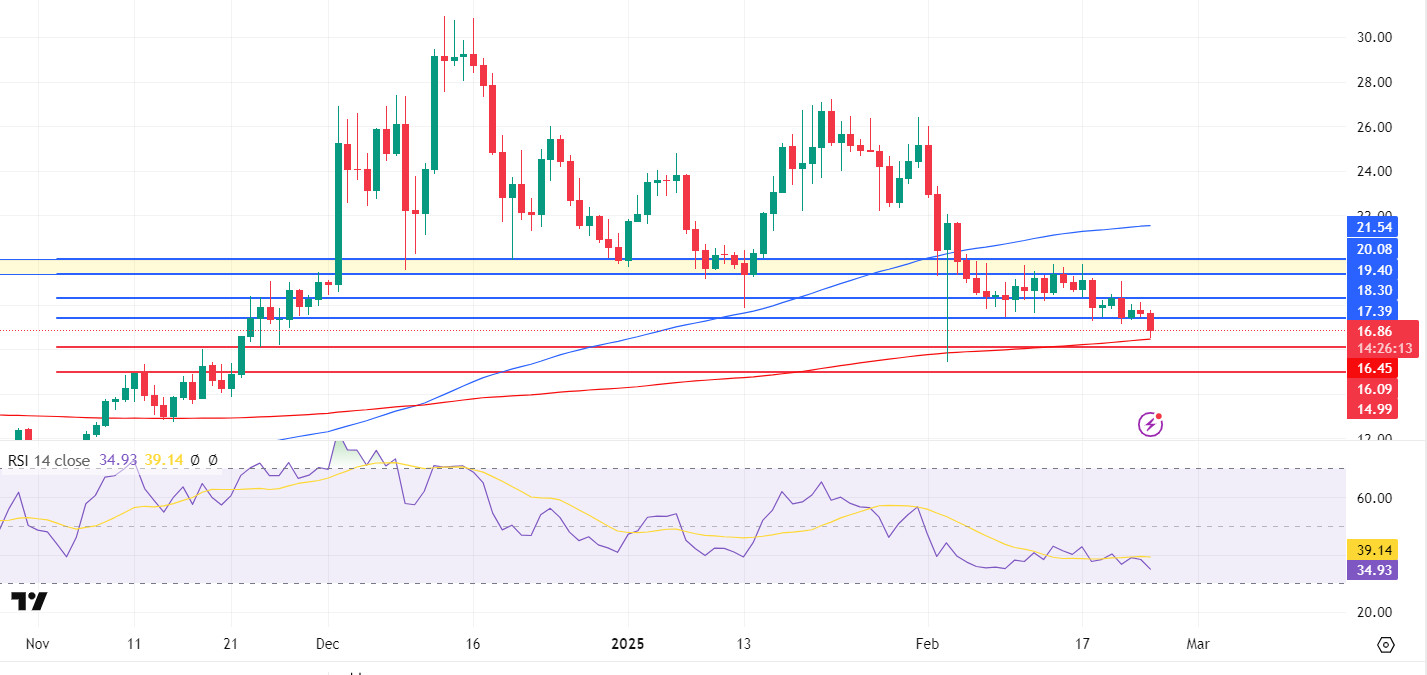
LINK price action is stuck between critical support and resistance levels. The recent price action is notable for an important test of support at the 200-day moving average (SMA200) at $16.86. In the event of a loss of this support level, the price is likely to retrace back towards the $16.45 and $16.09 levels. In particular, the $ 14.99 support stands out as a critical region both psychologically and technically.
On the other hand, the RSI indicator is at 34.93 and in negative territory, suggesting that the market is yet to signal a recovery. The 100-day moving average (SMA100) above the current price levels may increase selling pressure on upside moves. The $17.39 – $18.30 levels stand out as the first resistance points to be overcome in the short term, while the $20.08 – $21.54 zone constitutes a strong resistance area. In order to talk about a new uptrend, the $ 21.54 level must be broken in volume. A scenario in the opposite direction would be highly likely to trigger the loss of support levels by strengthening the downward movement of the price
(SMA200: Red Line, SMA100: Blue Line)
Supports 16.45 – 16.09 – 14.99
Resistances 17.39 – 18.30 – 20.08
BNB/USDT
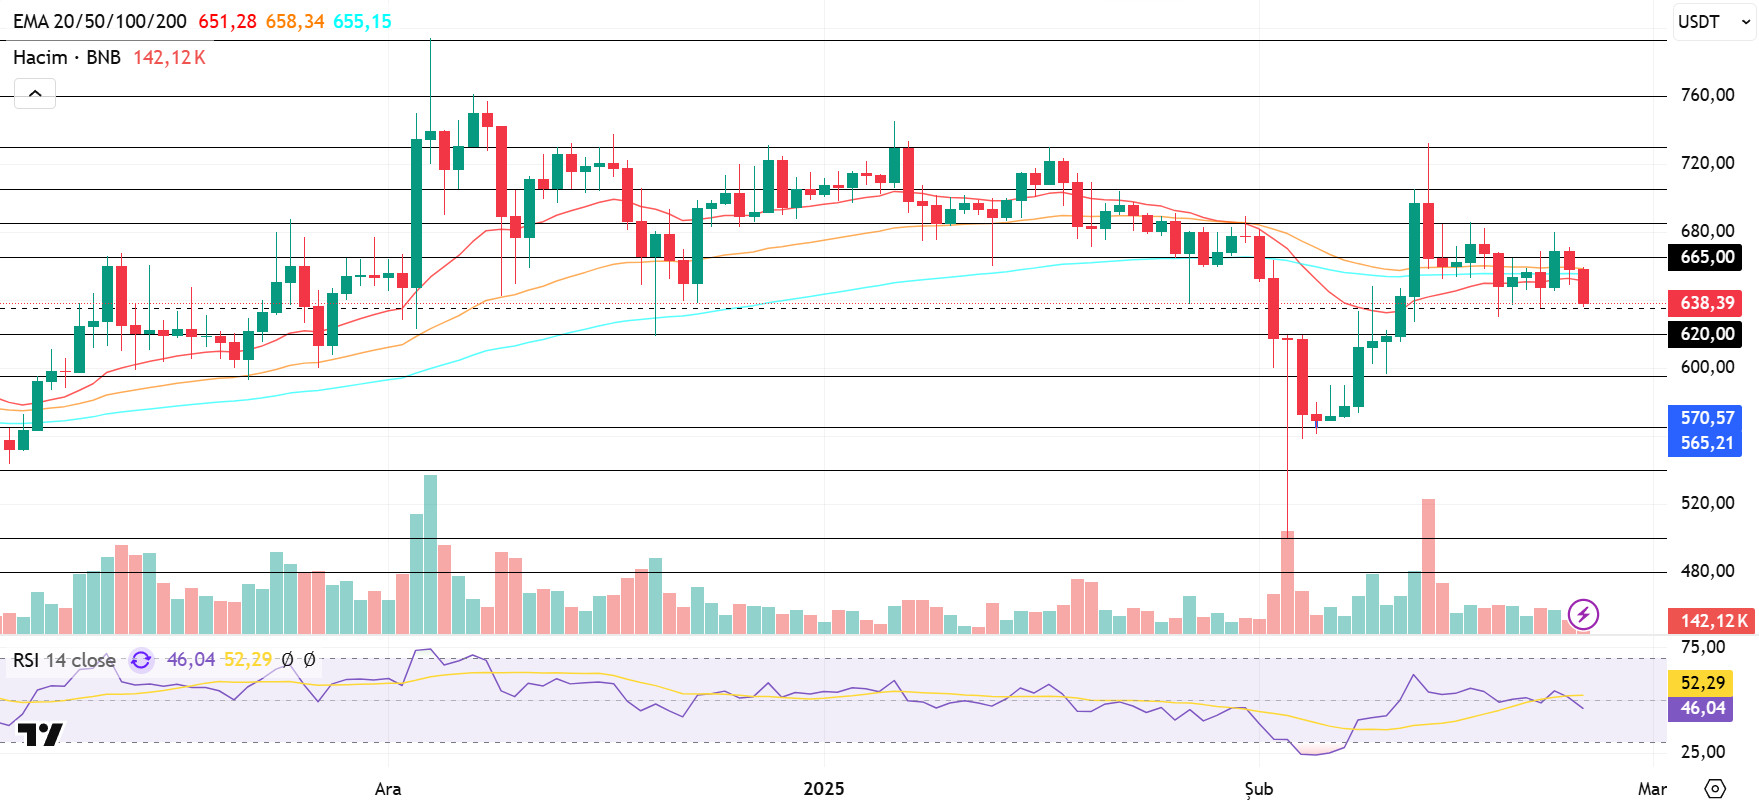
At the beginning of last week (Monday, February 17), BNB/USDT, which was slightly suppressed by the resistance at $ 680, closed the week above $ 665. Continuing its negative momentum in the following days, the asset fell towards the $635 level. However, it saw some support at this level, limiting its retreat momentum.
The asset, which showed a limited decline at the start of the new week, is moving in the range of $620 – $665. Moreover, BNB/USDT is trading below (EMA 20: Red line, EMA 50: Orange line and EMA 100: Blue line), maintaining its short-term negative outlook.
Volume indicators have been low over the past week, which has been a negative factor in the direction of the asset. In this case, positive strong trading volume is needed for the price to gain bullish momentum as of the new week. The RSI indicator moved below the 50 level in line with the price movements. The fact that the RSI remains below this level indicates that sell-side movements may continue.
If the negative momentum observed at the beginning of the new week continues, the price is expected to fall to the $ 620 level first. If the $620 level is broken down, there is a possibility that it may fall towards the $595 and $565 levels, respectively. On the other hand, if support is encountered at the $ 635 level, the price is likely to rise to $ 665 again. If the $ 685 level is broken upwards, the $ 685 and $ 705 levels will be monitored as new resistance zones.
Supports 620 – 595 – 565
Resistances 665 – 685 – 705
ADA/USDT
Cardano, Grayscale and other existing trusts have also applied to convert them into spot ETFs. The SEC had previously classified Cardano as a security along with XRP and Solana in its lawsuits against Binance and Coinbase. These legal hurdles could delay approval, as seen with other altcoin-based ETFs. These developments are expected to strengthen ADA’s overall ecosystem structure, positively impacting community trust and investor interest in the long run.
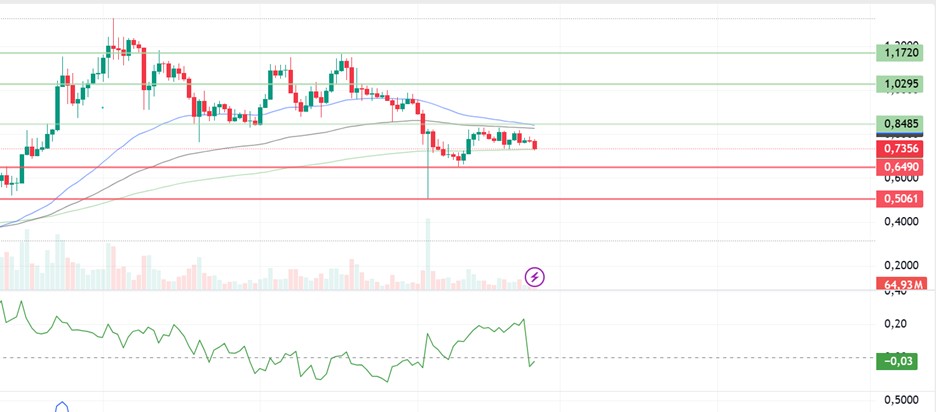
In the technical analysis of Cardano (ADA), data from the CMF (Chaikin Money Flow) oscillator reveals that the buying pressure has been replaced by selling pressure compared to the previous week. On February 3, ADA started a downtrend due to the selling pressure created by market conditions. Currently, the price is below the 50 EMA (Blue Line) and 100 EMA (Black Line). This suggests that the market is likely to continue sideways for a while. If the price stays above the $0.8485 level, it could change the trend direction and approach bullish. In this case, it may test the resistance level of $1.0295 with the rise of the ADA. If these resistance levels are broken to the upside, the uptrend may continue up to the $1.1720 resistance levels. In a possible volatility scenario, if the price of ADA falls, it may retest the $0.7356 support level and the .6490 support level. If these support levels are broken, the decline may deepen.
(EMA50: Blue Line , EMA100: Black Line , EMA200: Green Line)
Supports: 0.7356 – 0.6490 – 0.5061
Resistances: 0.8485 – 1.0295 – 1.1720
LEGAL NOTICE
The investment information, comments and recommendations contained in this document do not constitute investment advisory services. Investment advisory services are provided by authorized institutions on a personal basis, taking into account the risk and return preferences of individuals. The comments and recommendations contained in this document are of a general type. These recommendations may not be suitable for your financial situation and risk and return preferences. Therefore, making an investment decision based solely on the information contained in this document may not result in results that are in line with your expectations.

