
BTC/USDT
Last week, the crypto market was marked by historic developments and sharp price movements. At the beginning of the week, Bitcoin fell sharply as the Trump administration announced plans for tariffs on Canada and Mexico. However, with the news that Trump will hold a committee meeting on the strategic Bitcoin reserve system and sign an executive order, the market recovered, and Bitcoin rose back to the $95,000 level. While the non-farm employment data released during the week did not have a major impact on the markets, all eyes turned to the committee meeting held on Friday. Trump held a historic meeting with Crypto Committee Chairman David Sacks and representatives of major crypto projects. However, limiting the reserve system to only seized cryptocurrencies did not fully meet investor expectations and the market turned down again.
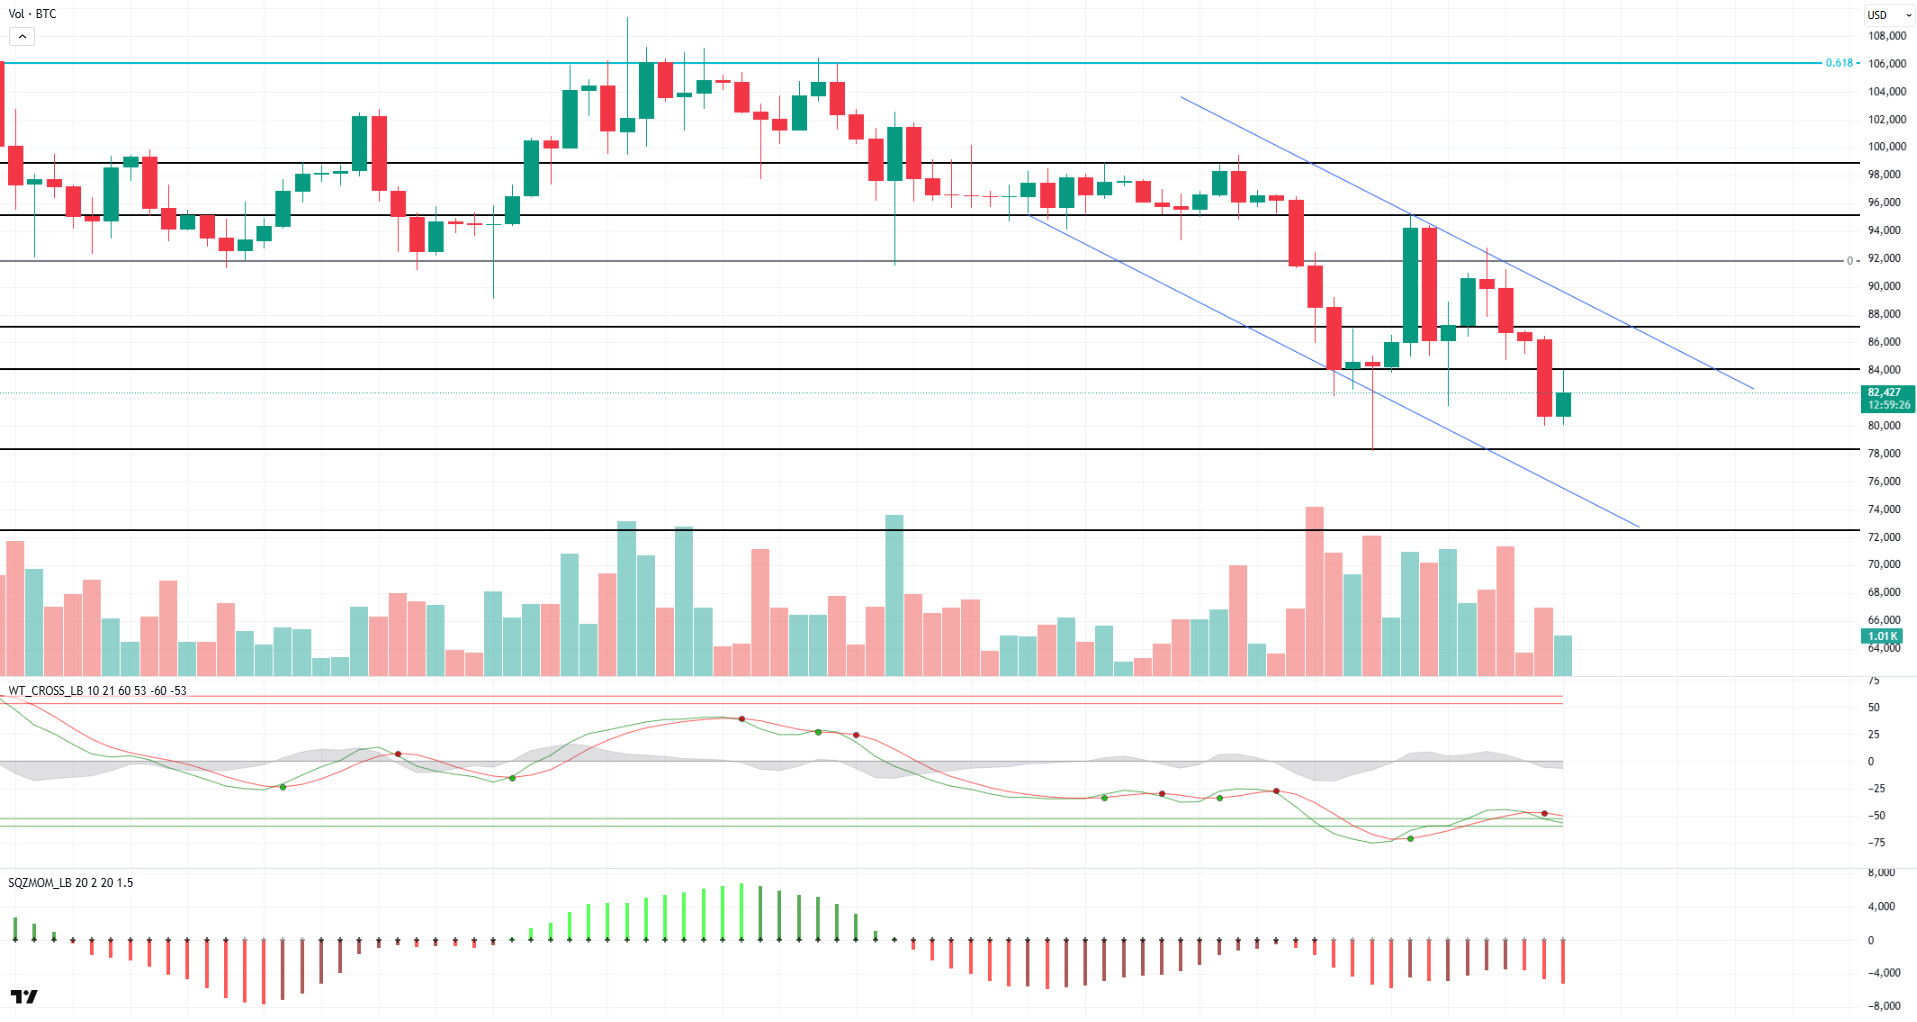
Looking at the technical outlook, BTC has been fluctuating within a widening range throughout the week in response to fundamental developments. BTC, which started the week at 85,000, tested 95,000 levels and then turned down again, recording a weekly decline of 12.88%. Although rises were recorded from time to time, these movements could not be permanent and selling pressure continued to push the price downwards. When technical oscillators are analyzed, it is observed that BTC continues to generate a sell signal in the oversold zone on the daily chart, while momentum indicators maintain their negative momentum. BTC, which is currently trading at 82,000, may play a critical role in determining the direction of the market for the rest of the week. The continued selling pressure on the market makes the rises limited and temporary. Therefore, if the downward movement continues, the 78,000 level stands out as a critical support point for BTC. On the other hand, in a possible rebound, the breakout of the falling trend structure on the daily chart will be monitored. The realization of this breakout could allow BTC to break out of the downtrend and create a strong bullish potential again.
Supports 80,000 – 78,000 – 74,000
Resistances: 84,000 – 87,000 – 91,800
ETH/USDT
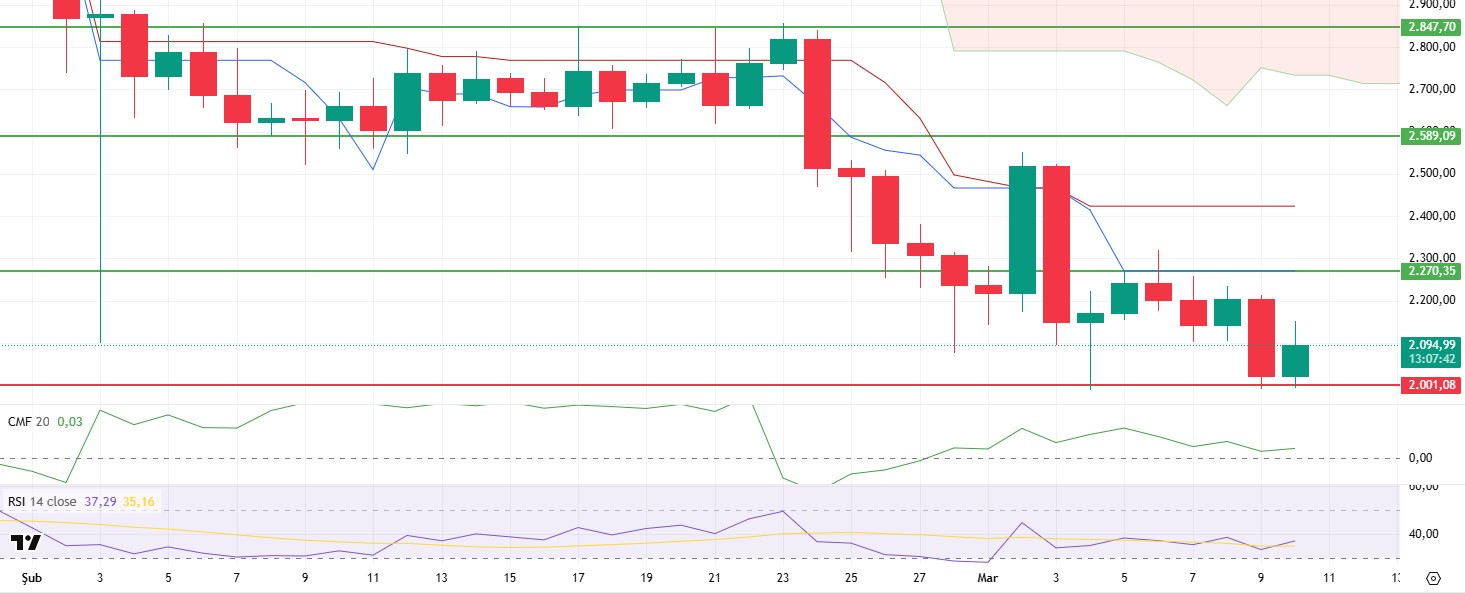
Although Ethereum managed to rise above the $2,500 level after US President Donald Trump ordered the creation of a strategic crypto reserve and news spread that Ethereum would be included in this reserve, it could not maintain this momentum due to global economic uncertainties and the negative impact of tariffs on the markets. With the selling pressure, the price retreated again and fell below the $2,000 level to the critical support zone yesterday evening. Although there was some recovery at this level as buyers stepped in, the uncertainty in the market continues.
Analysing technical indicators and on-chain data, the Cumulative Volume Delta (CVD) indicator shows that buyers are more dominant in the US, but sellers are gaining weight in global markets. This suggests that Ethereum is reacting to positive US-based news flow but is facing selling pressure due to global economic conditions. The Chaikin Money Flow (CMF) indicator is moving sideways in positive territory, indicating that the balance of buyers and sellers in the market is maintained, and liquidity flows remain stable for now. The Relative Strength Index (RSI), on the other hand, has managed to stay above the based MA line while moving around 30 levels. The RSI’s upward momentum from here sets the stage for a potential rebound. Looking at the Ichimoku indicator, the price lost both kijun and tenkan levels. In particular, the fact that the tenkan level remains below the kijun level shows that Ethereum is still weak in price action. Therefore, regaining the $2,270 level stands out as a critical threshold. If the price can exceed this level, buyer interest in the market may increase again and Ethereum may be able to enter a stronger recovery process.
Overall, Ethereum fell to the $2,000 region with strong selling pressure and found support at this level. If it manages to hold here without hanging below the $ 2,000 level, a movement towards the $ 2,270 level can be expected again. If this region is exceeded, there is a possibility that the rise will continue up to $ 2,589. However, if there is no permanence at the $ 2,000 level and the price closes below this support, there may be a risk of deepening the downward movement and testing lower levels.
Supports 2,001 – 1,805 – 1,527
Resistances 2,270 – 2,589 – 2,847
XRP/USDT
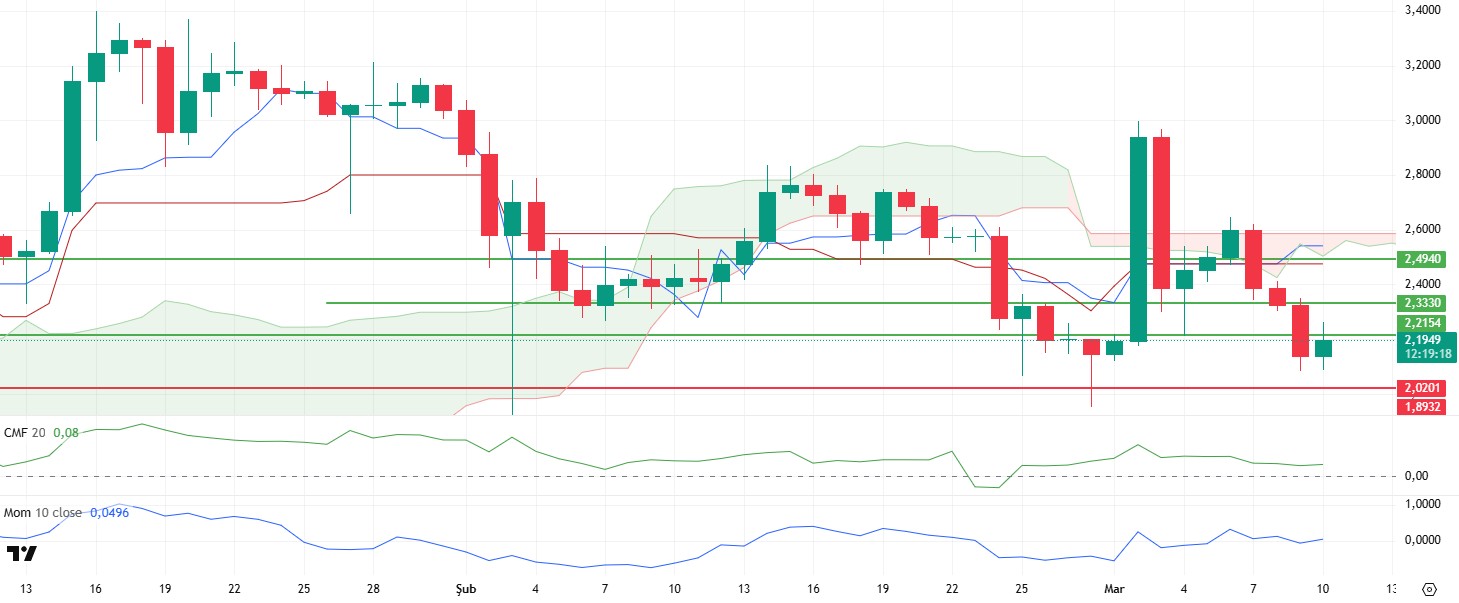
XRP rallied strongly last week, reaching as high as $2.64 on the back of positive news flow from the US and claims that it would be included in the strategic reserve. However, uncertainties in global markets and growing concerns about US tariffs have led to a general selling pressure in the markets. This also negatively affected XRP, causing the price to fall back below the $2.21 level. While the inability of buyers to react adequately in this region increased the pressure on the price, technical indicators started to give some critical signals about future price movements.
Looking at the technical indicators, the Chaikin Money Flow (CMF) indicator is moving down in the positive territory. This indicates a positive divergence in the XRP price despite the selling pressure in the market. Generally, positive divergences indicate that the price is likely to find support and rebound from current levels. Especially if the $2.21 level is exceeded again in the coming days, an upward movement can be expected to start. A look at the Ichimoku indicator shows that the price has lost the kijun, tenkan and kumo cloud levels. While this suggests that XRP is experiencing weakness in its current price action, the fact that the tenkan level remains above the kijun level sends a positive signal that the possibility of a recovery remains. If the price regains the tenkan and kijun levels, it could strengthen the bullish move and increase buyer interest. The momentum indicator remains flat despite the recent bearish move. This suggests that short positions are starting to lose their impact and the bearish move may weaken. If the momentum indicator starts to gain momentum to the upside, it may be possible for the price to break through the $2.21 level and head higher.
In conclusion, the technical indicators on the daily timeframe have started to show some positive signals. However, in order for the bullish movement to continue, it is critical for XRP to maintain the $2.02 support level. If the price manages to hold above this level, it can start an upward movement again by rising above the $2.21 level. On the other hand, the loss of the $2.02 level could increase selling pressure and cause the price to experience a deeper retracement. Therefore, whether XRP can stay above the $2.02 level in the coming days will be decisive for the direction of price action.
Supports 2.0201 – 1.8932 – 1.6309
Resistances 2.2154 – 2.3330 – 2.4940
SOL/USDT
Last week in the Solana ecosystem;
– In a big surprise, US President Donald Trump announced that three US-based altcoins, one of which is SOL, will be the strategic reserve of cryptocurrencies for the US.
– Anatoly Yakovenko, co-founder of Solana, stated that he opposed the US crypto reserve, arguing that it would centralize control and undermine decentralization, the core principle of crypto.
– CME Group announced on March 17 that it would launch Solana futures, strengthening ETF expectations.
– Neptune Digital joined Sol Strategies to develop Solana Staking. Through this agreement, Neptune will leverage Sol Strategies’ advanced blockchain infrastructure to optimize Solana staking.
– Sol Global has completed the strategic arrangement of non-Solana assets and removed all mortgaged debt.
– On the other hand, the bankruptcy court limited FTX’s weekly SOL liquidation to $50 million and later increased it to $100 million.
On the onchain side;
– According to new data provided by Dune Analytics, Solana experienced a massive 88% drop in token growth.
– For the fifth month in a row, Solana surpassed all other chains in the market with a decentralized exchange volume of $105 billion.
– In February, more than $700 million in assets were transferred to Solana from other blockchains via cross-chain bridges.
– Over $279 million was moved to SOL CEXs by Galaxy Digital.
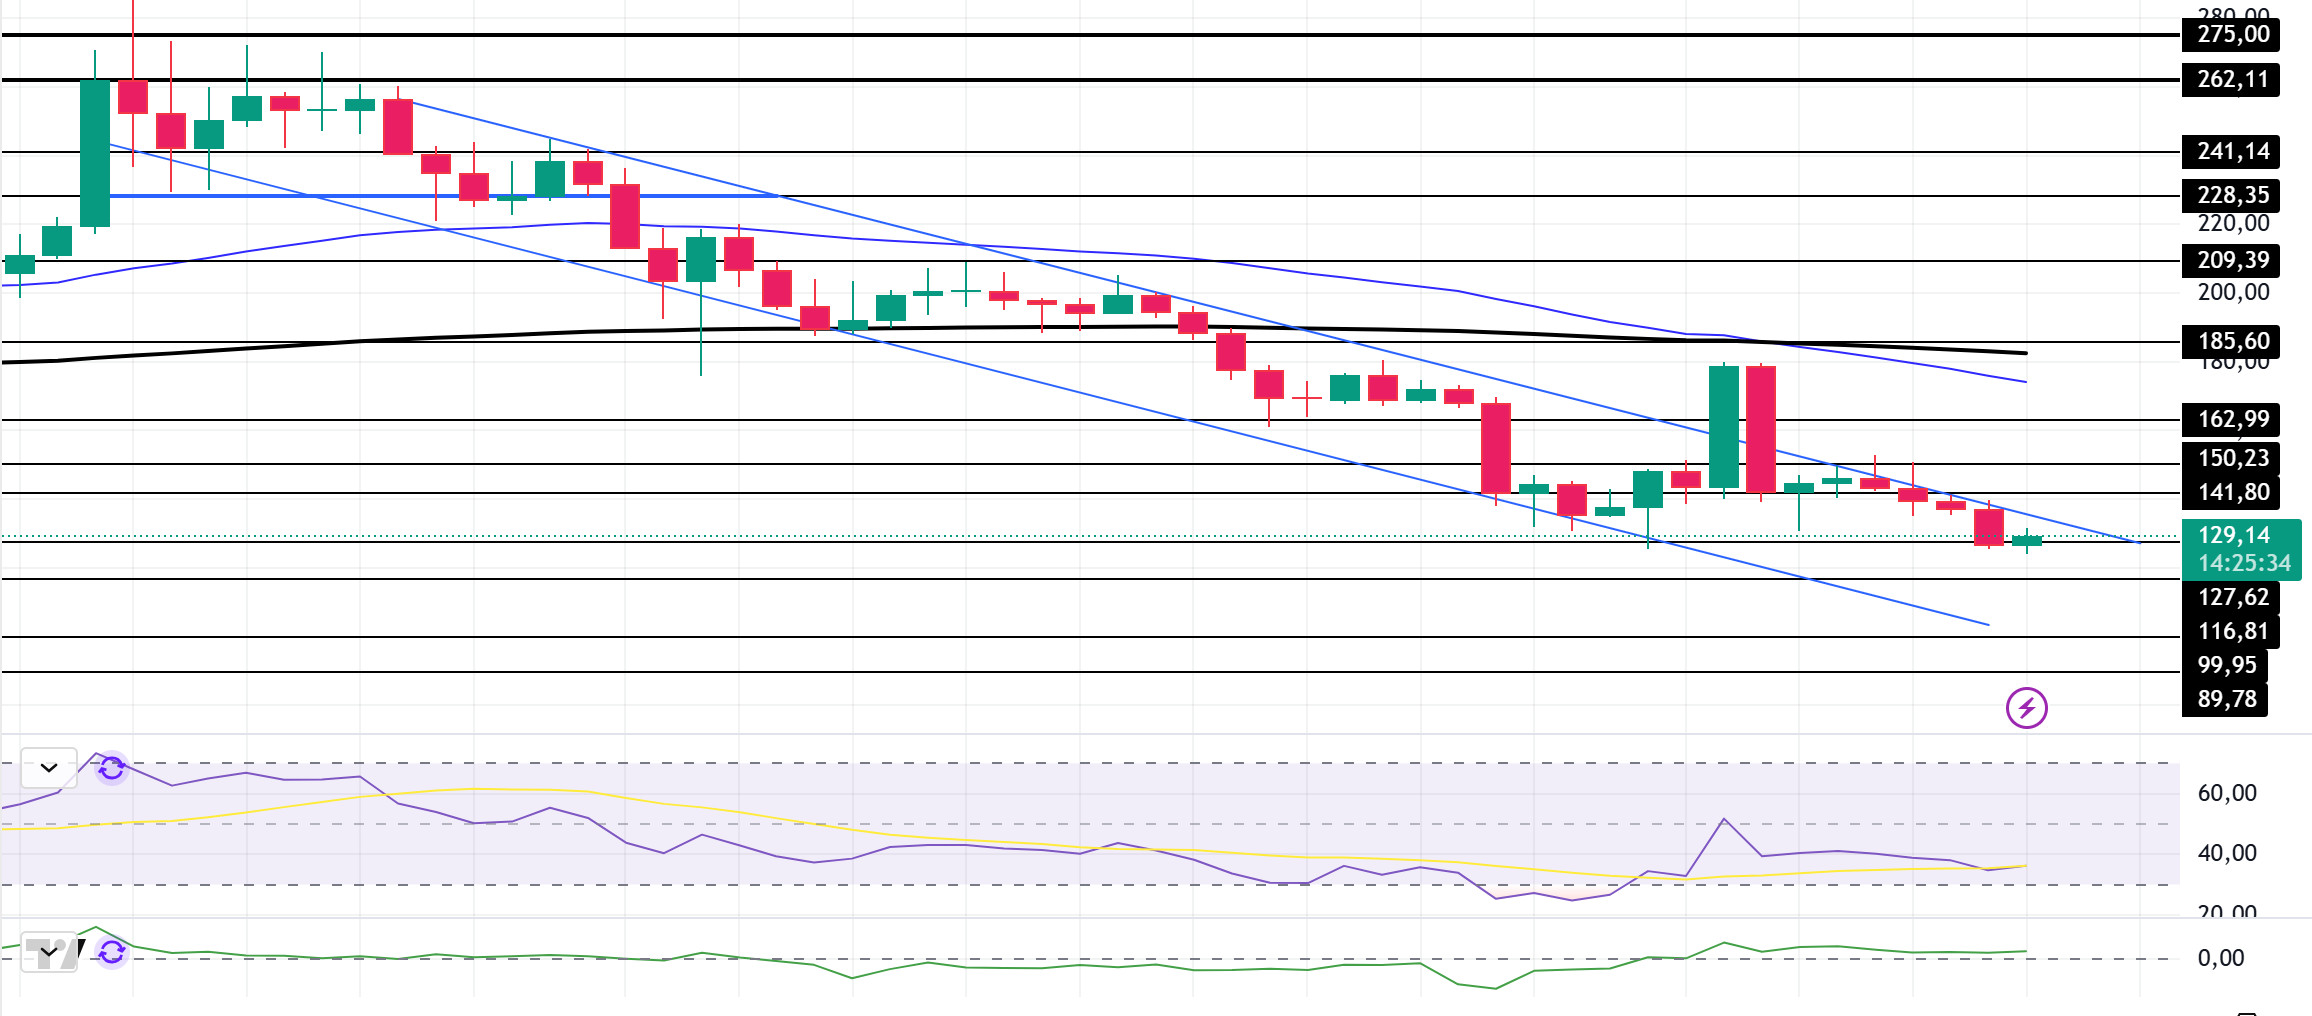
With these developments, when we look technically at SOL, the native token of the network, it has exhibited declines since last week. The asset continues to be in a downtrend that started on January 26. The price is below the 50 EMA (Blue Line) and the 200 EMA. On our daily chart, the 50 EMA (Blue Line) has crossed below the 200 EMA (Black Line). With the formation of what we call this death cross, we see that the downward momentum has increased. This formation may put the asset into a bear process in the medium term. Relative Strength Index (RSI)14 is in negative territory. When we examine the Chaikin Money Flow (CMF)20 indicator, it is close to the neutral level of the positive zone, but the increase in volume can strongly increase money inflows. If the positive results in macroeconomic data and positive developments in the ecosystem continue, it may test the first major resistance level of $ 162.99. In case of negative news from macroeconomic data or the Solana ecosystem, the $ 116.81 level can be followed and a buying point can be determined.
Supports 116.81 – 99.95 – 89.78
Resistances 127.62 – 141.80 – 150.23
DOGE/USDT
Last week in the DOGE ecosystem;
– NYSE Arca filed a 19b-4 application with the US Securities and Exchange Commission (SEC) to list and trade a Dogecoin (DOGE) exchange-traded fund (ETF) from Bitwise. According to the application, Coinbase Custody will act as custodian. Meanwhile, Bank of New York Mellon (BNY Mellon) will manage cash holdings, administration and record keeping.
– According to a new Bloomberg report, the SEC is offering its employees a $50,000 incentive to resign or retire. The regulator’s offer to employees came at a time when DOGE’s mass layoff of federal employees to cut government spending was on the agenda.
On the onchain side;
– On March 4, the number of Dogecoin addresses reached an all-time high of 83.48 million, indicating strong ecosystem activity.
– Dogecoin (DOGE) saw a surge in whale activity, with major investors accumulating more than 910 million DOGE in the last 48 hours.
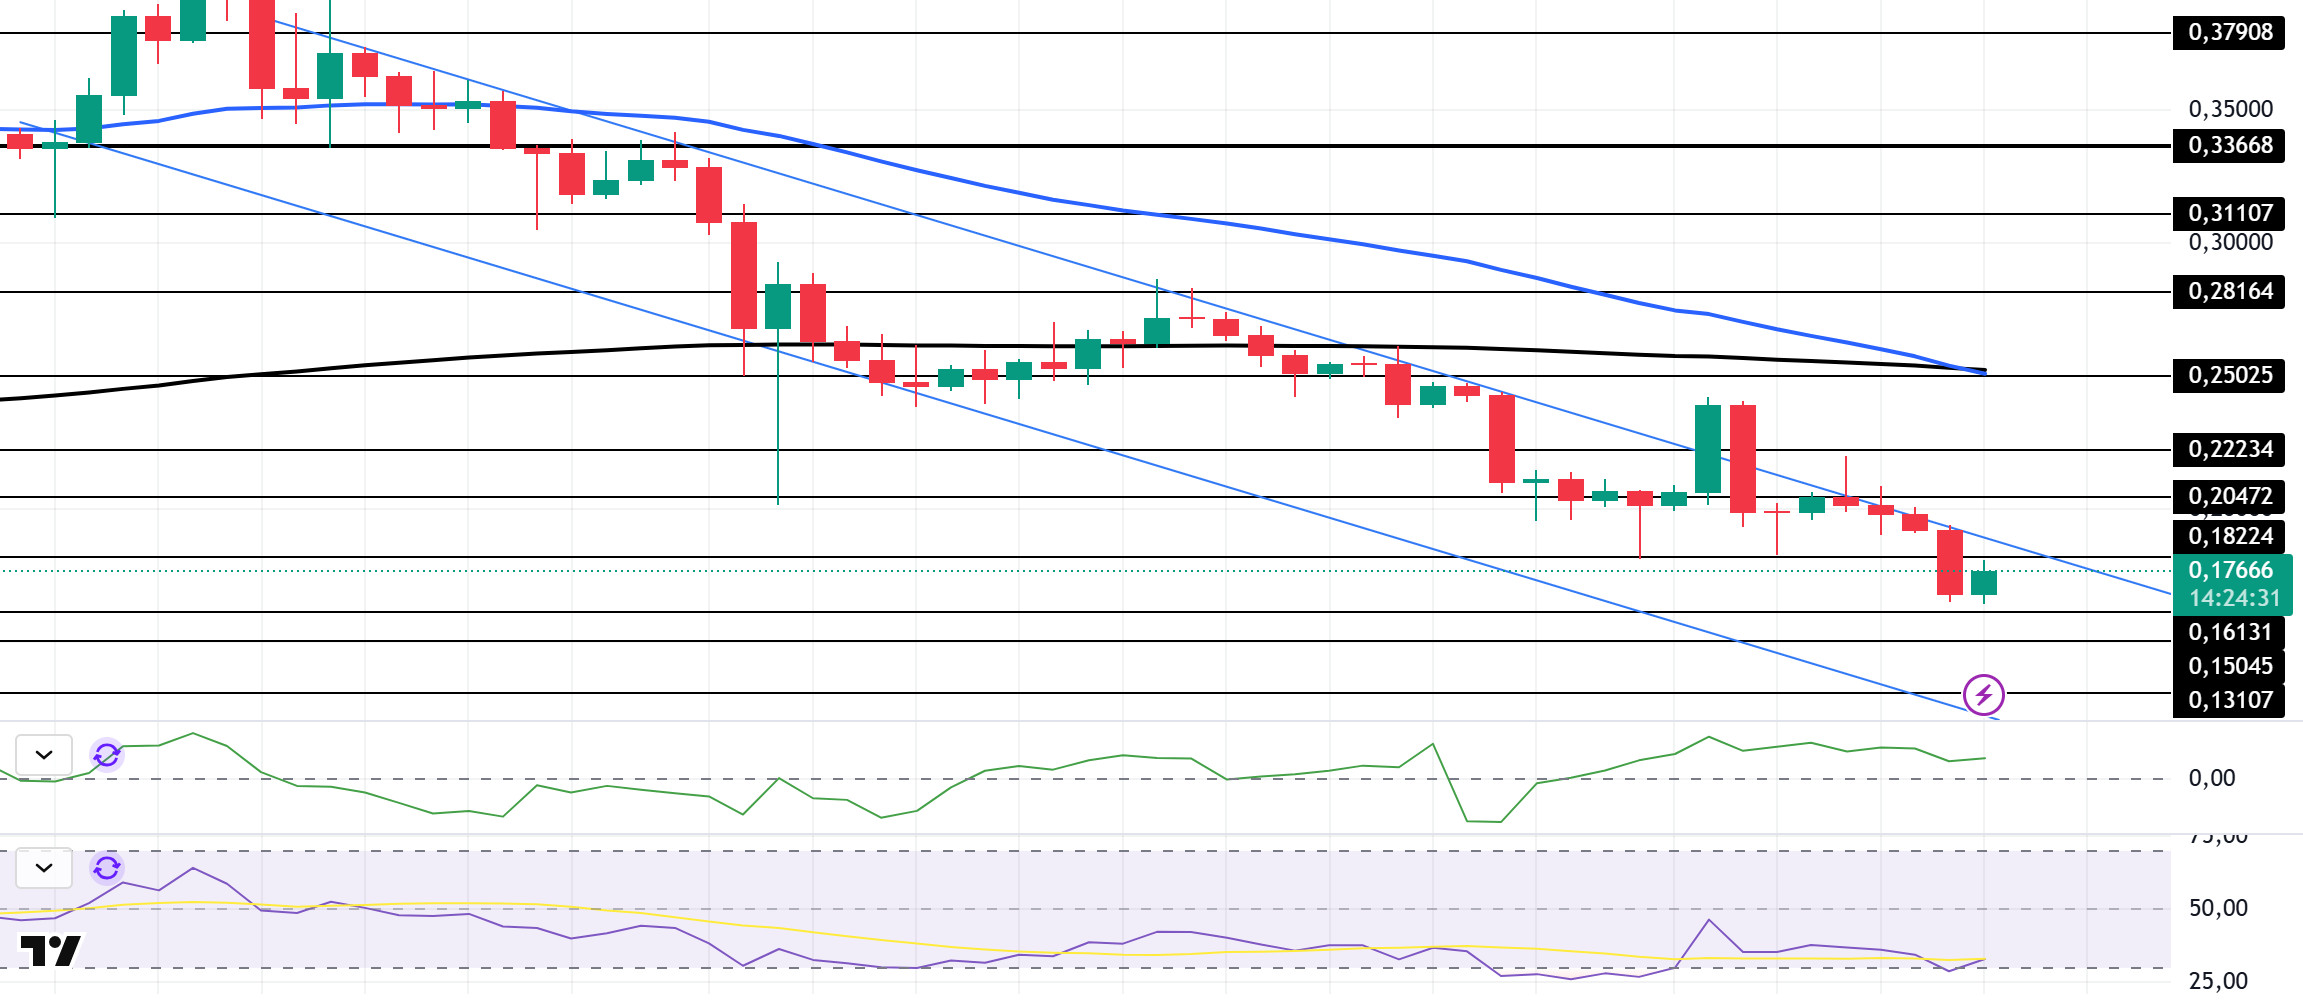
If we examine DOGE technically in the focus of all these developments, when we look at the daily chart, the asset, which has been in a downtrend since January 17, continues to stay in the trend. The 50 EMA (Blue Line) is in the transition phase below the 200 EMA (Black Line) and the pattern we call death cross has formed. This shows us that the downtrend is gaining momentum and the long-term downtrend may begin. When we look at the Chaikin Money Flow (CMF)20 indicator, the fact that it is in the positive zone, money inflows are high and the volume is starting to increase indicates that there may be a price increase. Relative Strength Index (RSI)14 is at the oversold level. In case of possible macroeconomic conditions and negative developments in the ecosystem and retracements, the $0.15045 level can be followed as a strong support. In case the retracement ends and the rises begin, the 0.25025 dollar level should be followed as a strong resistance place.
Supports: 0.16131 – 0.15045 – 0.13107
Resistances: 0.18224 – 0.20472 – 0.22234
TRX/USDT
Last week, Tron’s announcement that it would launch Gas Free, a feature that would support gas payments with USDT, created excitement in the ecosystem, which led to a surge towards the end of last week. World Liberty Financial, which is associated with US President Trump by Tron founder Justin Sun, is said to hold 10 million worth of TRX, making it the third largest cryptocurrency owned by World Liberty Financial. In addition, the fact that the supply of Tether (USDT) on Tron has increased by about $ 5 billion since the beginning of the year indicates that network usage has not lost its upward momentum.
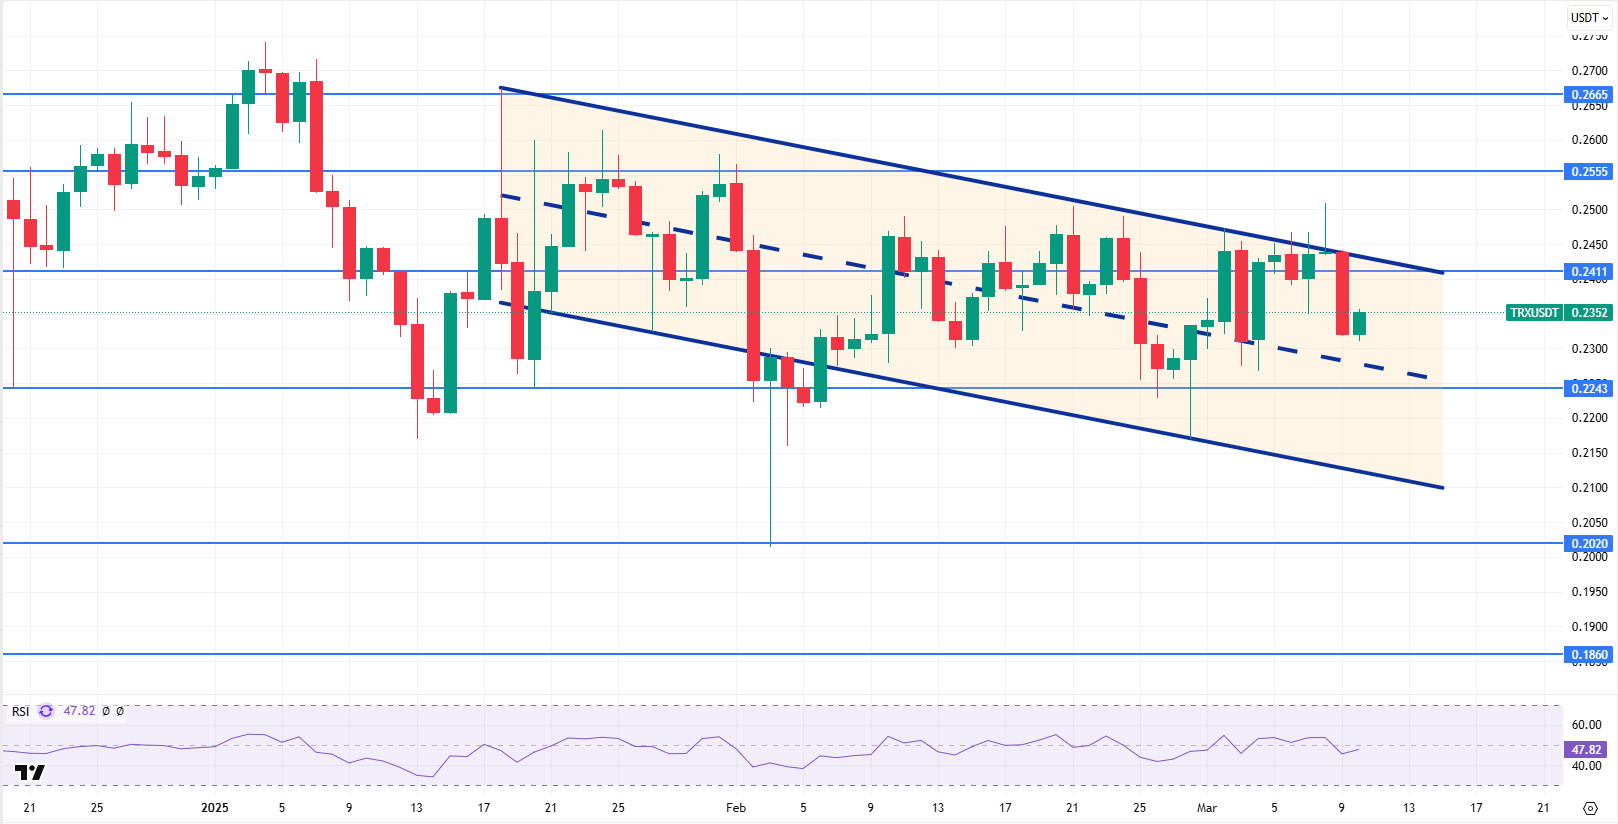
TRX, which started last week at 0.2441, fell about 5% during the week and closed the week at 0.2321. TRX, which is currently trading at 0.2352, is in the middle band of the bearish channel on the daily chart. With a Relative Strength Index value of 47, it can be expected to move towards the lower band of the bearish channel by falling slightly from its current level. In such a case, it may test 0.2243 support. If it cannot close daily below 0.2243 support, it may increase with the buying reaction that may come and move back to the upper band of the channel. In such a case, it may test 0.2411 resistance. As long as it stays above 0.2020 support on the daily chart, the bullish demand may continue. If this support is broken, selling pressure is expected to increase.
Supports 0.2243 – 0.2020 – 0.1860
Resistances: 0.2411- 0.2555 – 0.2665
AVAX/USDT
AVAX, which opened last week at $ 24.94, fell as low as $ 17.60 on Sunday, March 9, 2025, due to the sharp wave of sales in the general crypto market. The weekly close was realized at $ 17.95. The weekly close was realized at $ 17.95. Volatility in the crypto market remains high due to global economic uncertainties. Although the selling pressure is still strong, a limited recovery can be seen in the new week with purchases from low levels.
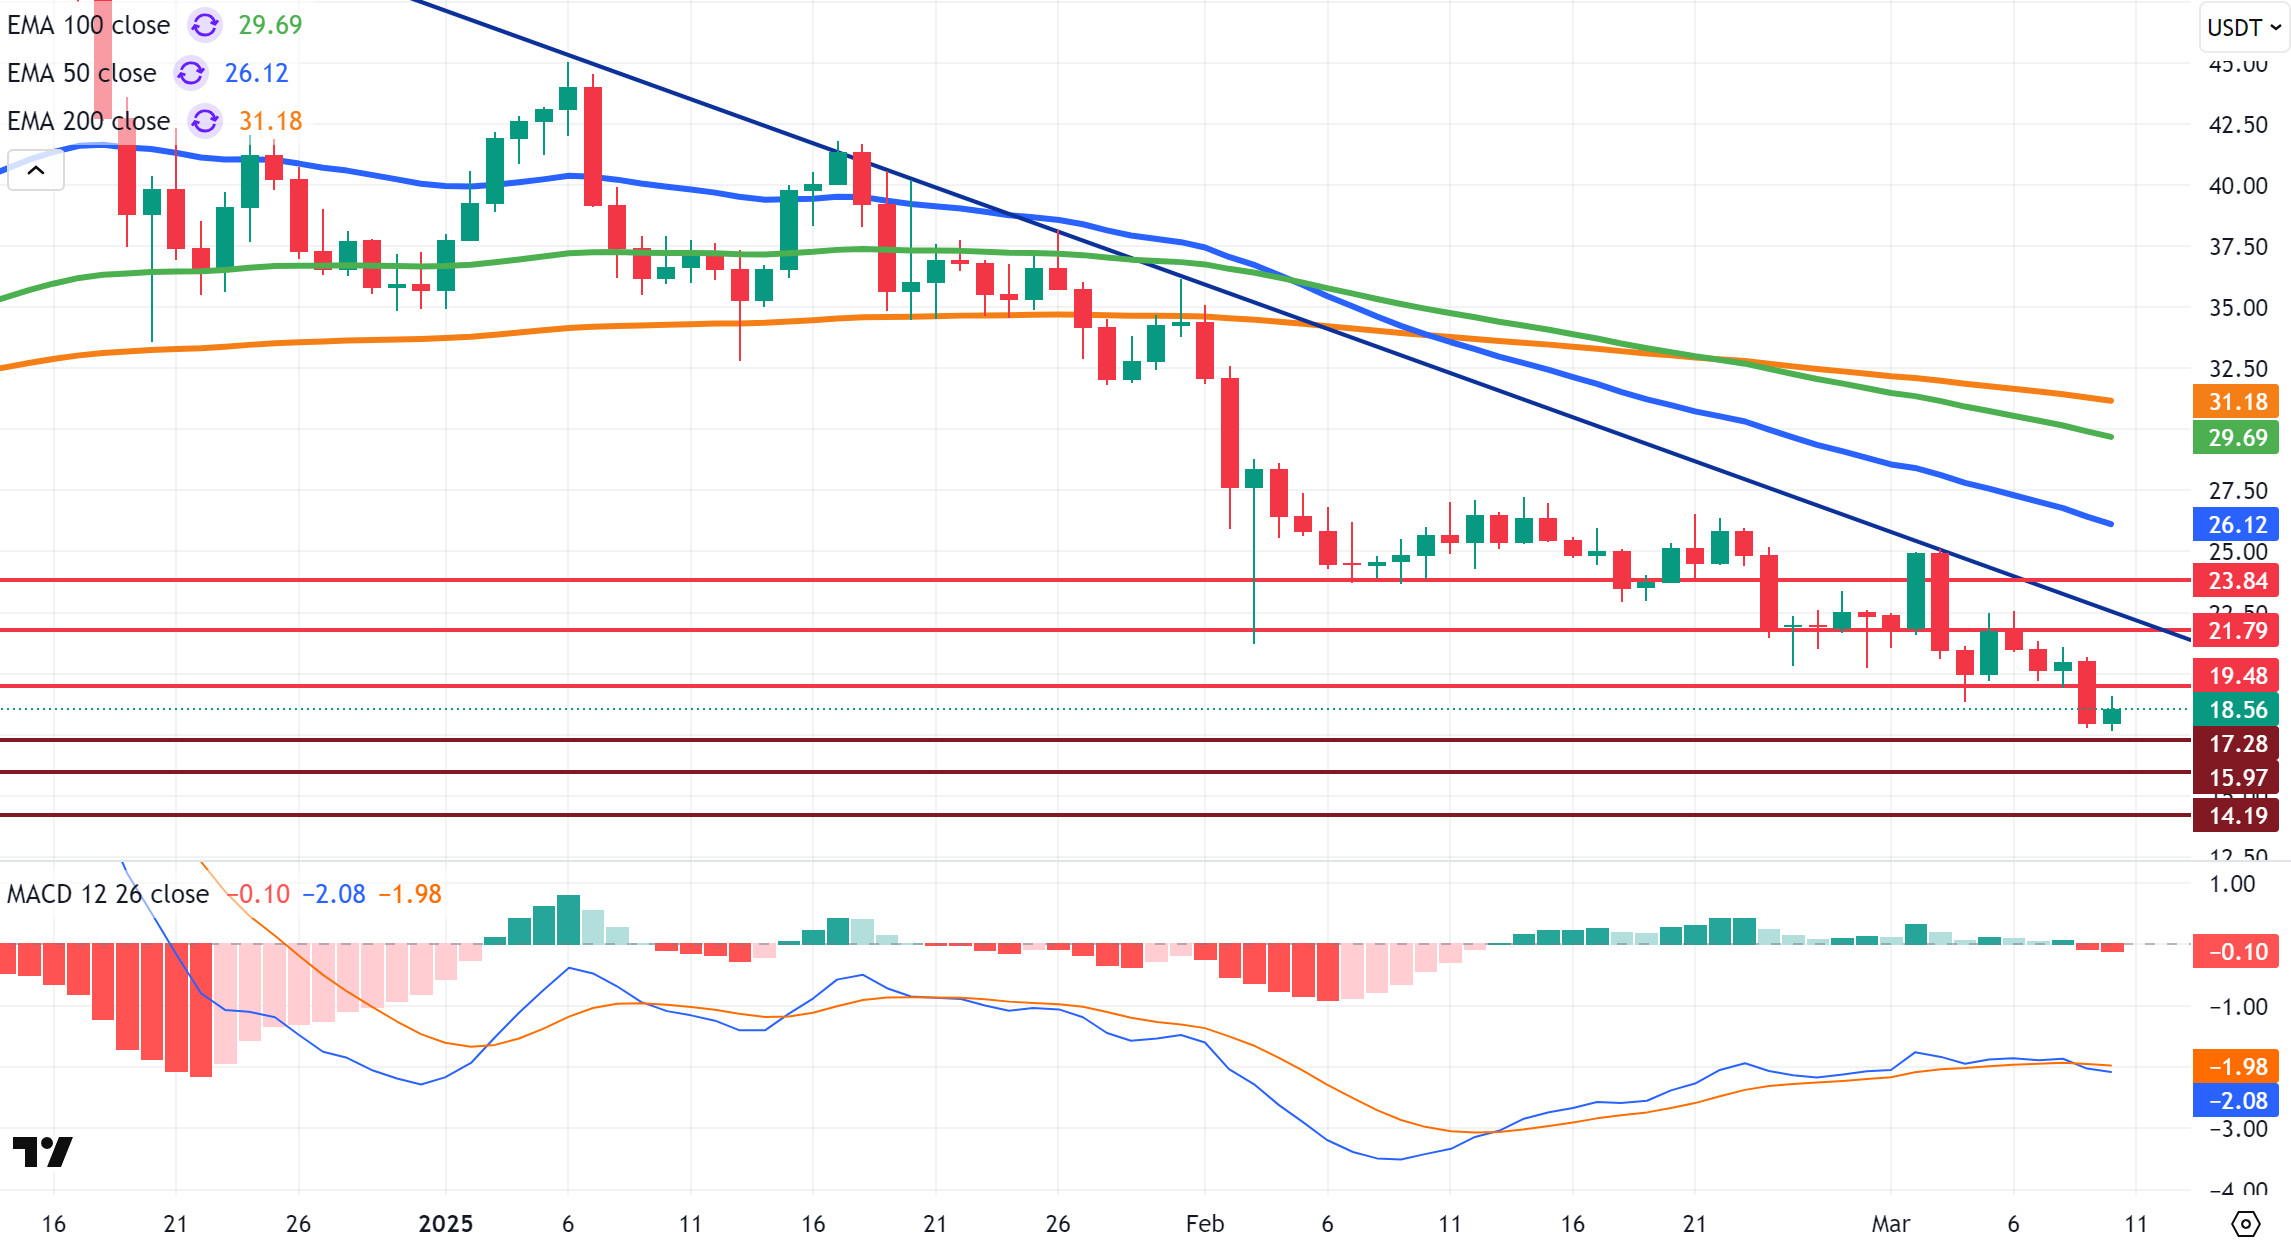
AVAX continues to trade in a downtrend. On the daily chart, the Moving Average Convergence/Divergence (MACD) indicator is in negative territory, moving below the signal line. The MACD remains in the negative territory, indicating that selling pressure persists and the bullish move remains weak. AVAX continues to trade well below the critical Exponential Moving Average (EMA) levels. Especially below the EMA50, the price’s recovery may be limited in the short term.
Daily closes below the $17.28 level in AVAX may cause a pullback to the support levels of $15.97 and $14.19. The MACD indicator remains in the negative zone, indicating that downward pressure continues. On the contrary, a break of the $19.48 resistance could see the price rebound to the $21.79 level. If strong buying comes and the MACD indicator rebounds, the $23.84 level could be tested.
(EMA50: Blue Line, EMA100: Green Line, EMA200: Orange Line)
Supports 17.28 – 15.97 – 14.19
Resistances 19.48 – 21.79 – 23.84
SHIB/USDT
The Shiba Inu community’s recent token burn of millions of SHIBs, with a remarkable 5.440% increase in the rate, stands out as an important step towards reducing supply. While this move reinforces community support, it also keeps investor interest alive. In addition, the rise in the long/short ratio and increasing open positions suggest a possible increase in demand in the Shiba Inu ecosystem.
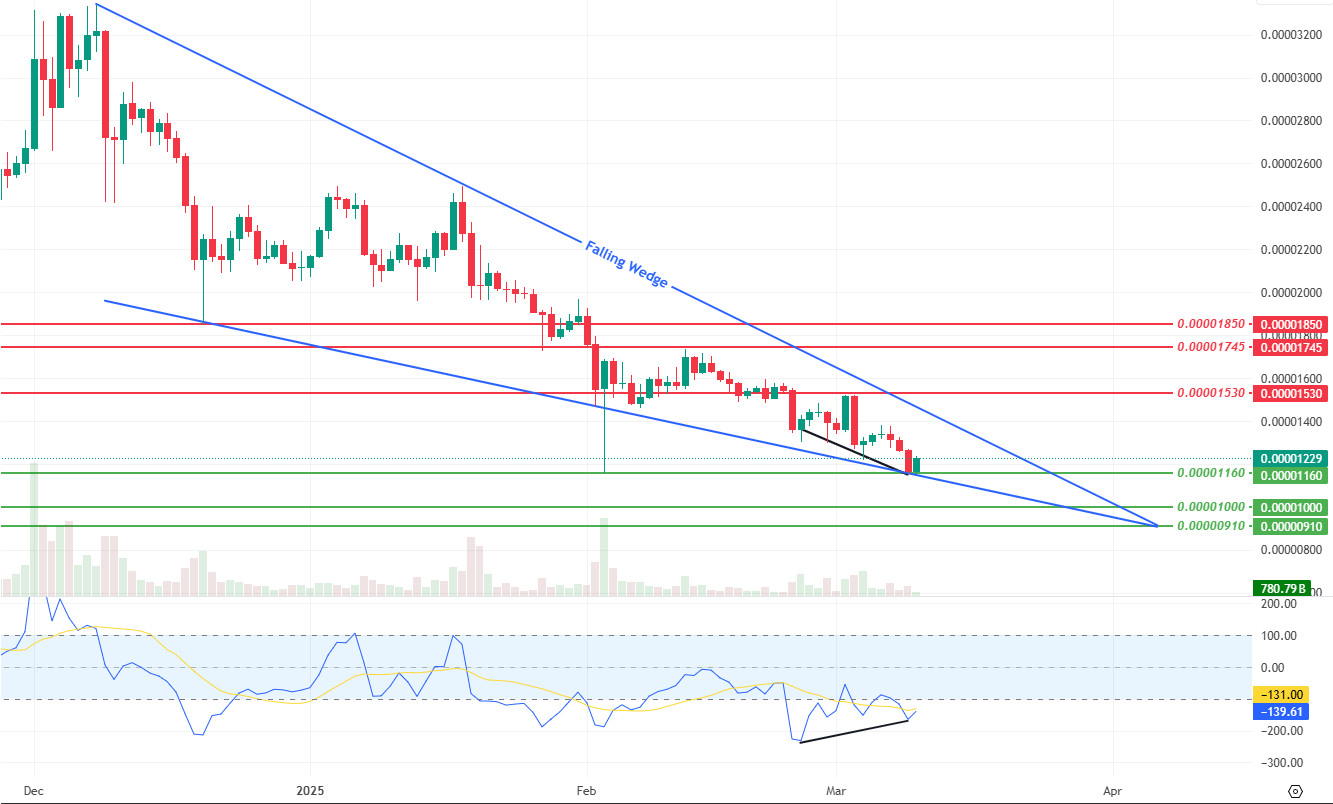
Technically, this week, the Shiba Inu (SHIB) price lost its support at the $0.00001300 level and reacted at the $0.00001160 support level. The increase in trading volume compared to last week indicates that the level of interest of market participants has increased, while the decrease in volatility indicates that there are more limited fluctuations in price movements. The positive mismatch seen in the CCI (Commodity Channel Index) oscillator (Black Line) increases the possibility of a recovery from current levels. In addition, the fact that the 0.00001160 dollar level also coincides with the lower base of a “Falling Wedge” pattern (Blue Line) reinforces the importance of this support. If this level is maintained, a rise towards the 0.00001530 dollar levels can be expected. On the other hand, if the 0.00001160 dollar level is lost, the 0.00001000 dollar level stands out as the next support.
Supports 0.00001160 – 0.00001000 – 0.00000910
Resistances 0.00001530 – 0.00001745 – 0.00001850
LTC/USDT
Litecoin fell by 26.01% in the past week, creating a two-week negative streak. Litecoin, which fell as low as 92.96 in this process, lost 13.43% more value compared to Bitcoin. With weekly losses, Litecoin, whose market capitalization fell to $7.28 billion, fell from 16th to 18th place in the ranking. The amount of open positions in futures transactions remained at the same level as the previous week and was recorded as 262 million dollars. However, after rising up to 532 million dollars during the week, it returned to its starting level. However, funding rates went completely negative.
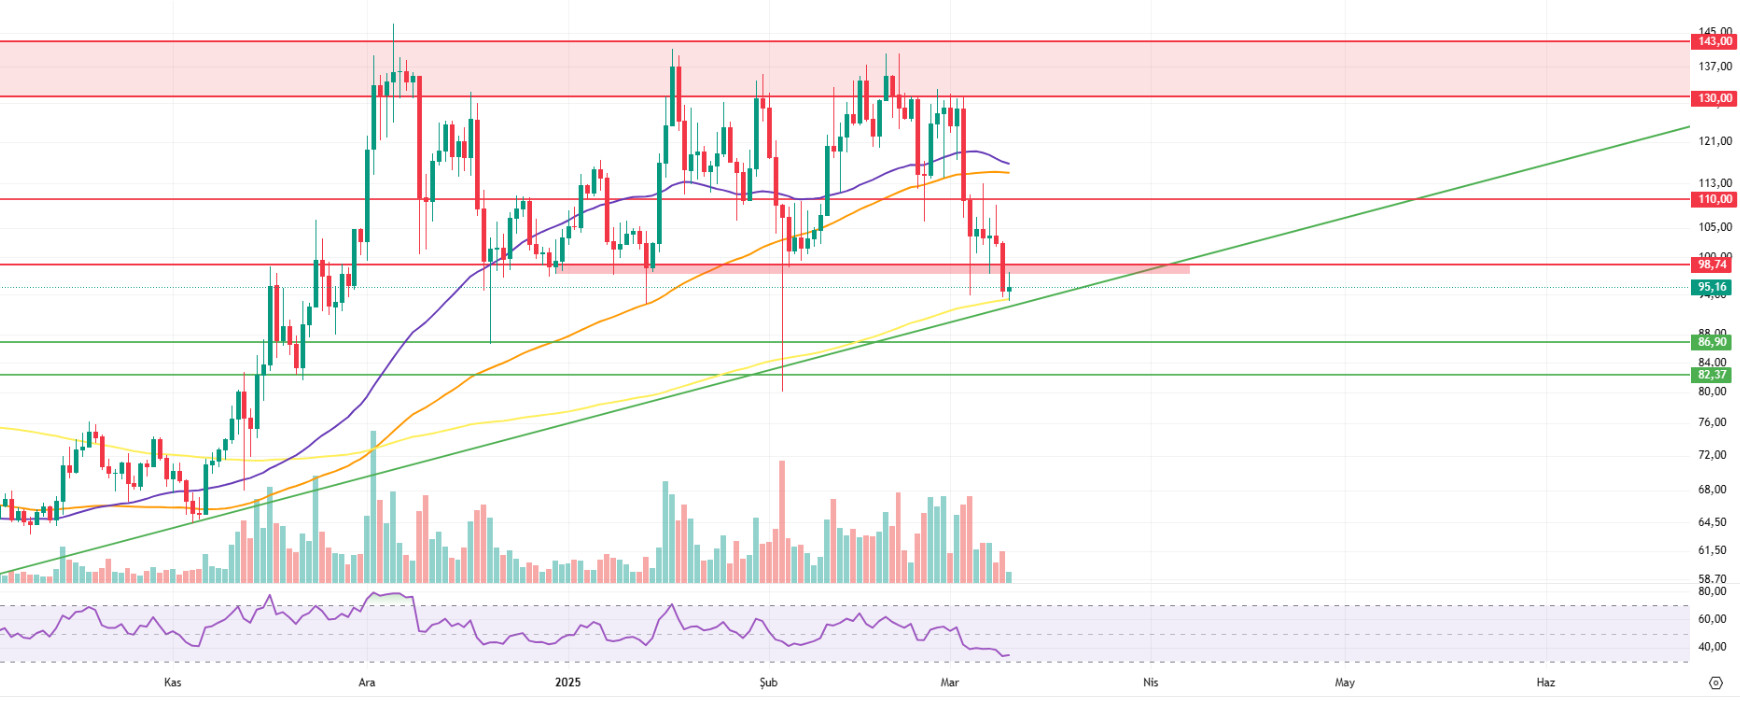
Litecoin’s daily chart shows that the price broke below its 50 (purple line) and 100 (orange line) period moving averages, while holding above its 200 (yellow line) period moving average. In this sharp downward movement, a pullback to the main trend support has been realized, and even if the downtrend that has started will continue, a pull back movement can be expected, and this movement can be expected to come up to 98.74, which was seen as the main support last week. With the break of this level, the possibility that the downtrend that has been going on for 2 weeks may have ended is strengthened and an attack towards the 110.00 level is likely to come. With the level seen as intermediate resistance, it can be expected to rise above the 50 and 100-day moving averages. The time spent after breaking above the moving averages may increase the upward pressure and trigger an impulse towards the 130.00 level, the beginning of the red band.
On the other hand, a continuation of the bearish move after losing important support levels seems quite likely. At this stage, the most critical support stands out as the uptrend support. In case of a downside break of the trend support, which is currently at 92.09, it may be possible for the price to retreat towards the levels of the moving averages in the 50 and 100-week periods. These levels are the 50-week moving average at 86.90 and the 100-week moving average at 82.37, which can be considered as critical regions where reaction buying may come.
Resistances 98.74 – 110.00 – 130.00
Supports 92.09 – 86.90 – 82.37
LINK/USDT
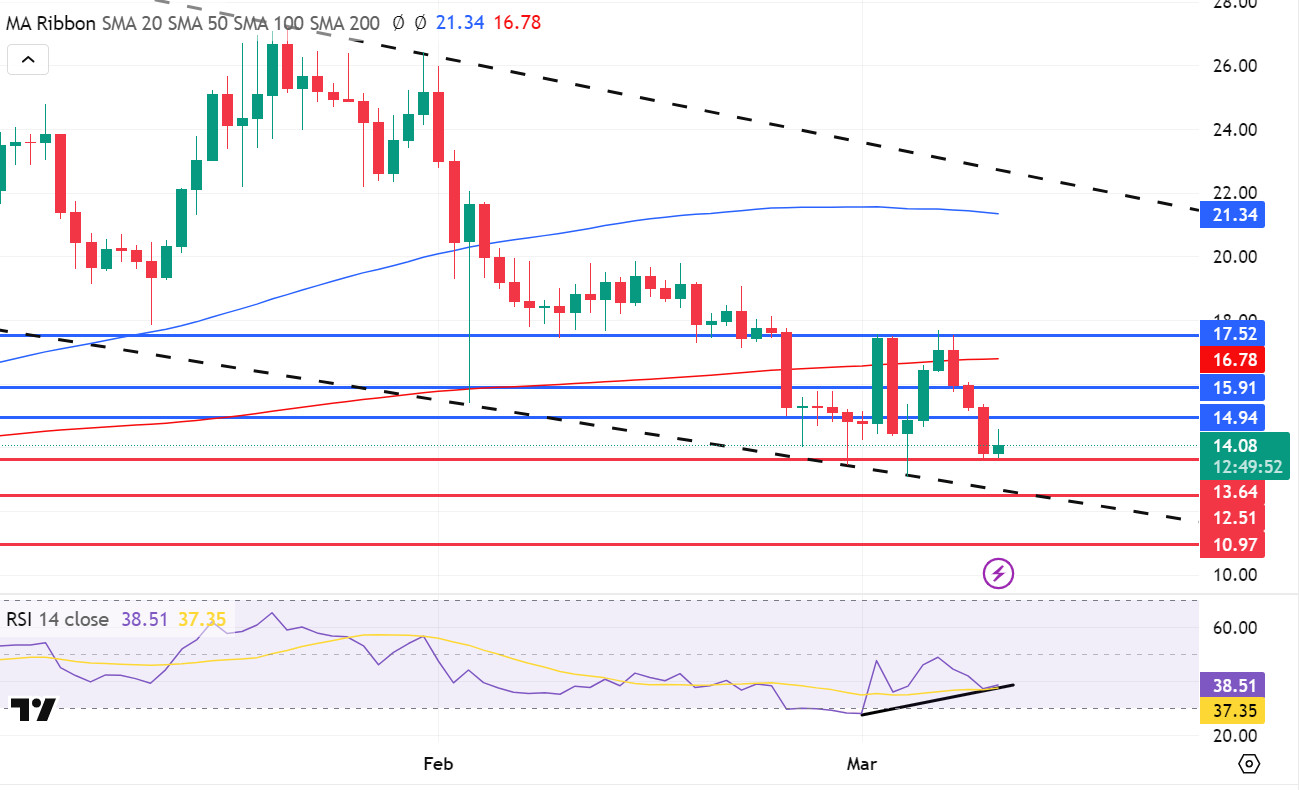
LINK had formed a falling channel with a downward trend of about three months starting on December 16th. Although the news that Chainlink founder Sergey Nazarov will attend the crypto summit created excitement in the community by increasing the expectation on the LINK token, the selling pressure in the markets continued when the summit did not meet expectations, and LINK continues its horizontal movement in the bottom of the channel, affected by these sales.
From a technical point of view, a downside break of the $12.51 level and a daily close below this level could lead to a breakdown of the three-month channel movement and increased selling pressure. In such a scenario, the price is likely to retreat to the $10 levels.
On the other hand, the Relative Strength Index (RSI) indicator gives a positive mismatch signal. However, for this signal to be realized, LINK needs to break the resistance at $ 17.52 to the upside. Once this breakout occurs, the increased demand may move the price first to $ 21, the 100-day moving average (SMA100), and then to the upper band of the channel to $ 22-23. Important levels to watch in the short term are $ 14.94 as the first resistance point, while the $ 15.91 level plays a critical role in the horizontal movement gaining upward momentum. If these levels are exceeded, the bullish scenario for LINK may strengthen.
(SMA200: Red Line, SMA100: Blue Line)
Supports 13.64 – 12.51 – 10.97
Resistances 14.94 – 15.91 – 17.52
BNB/USDT
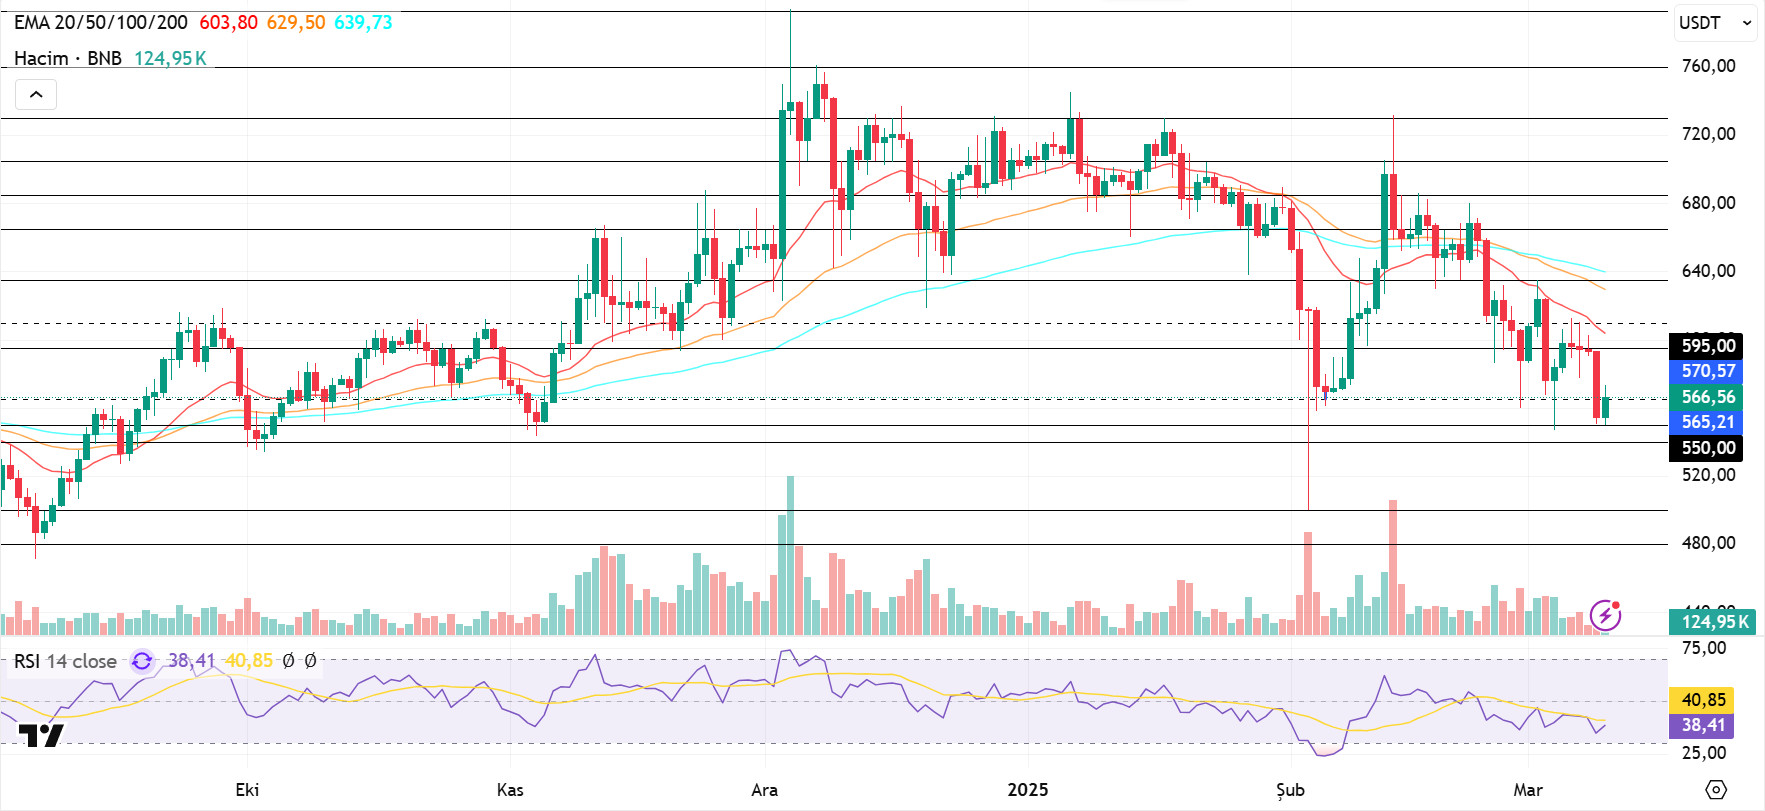
At the beginning of last week (Monday, March 3), BNB/USDT, which was pressured by the resistance at the EMA 20 level, retreated towards the $ 665 level. Although it showed some recovery in the following days, the asset continued its negative momentum and fell towards the $550 level. However, it saw some support at this level, limiting its retreat momentum.
With the start of the new week, the asset, which has shown a limited rise, moves in the range of 550 – 595 dollars. Moreover, BNB/USDT continues to trade below (EMA 20: Red line, EMA 50: Orange line and EMA 100: Blue line), maintaining its short-term negative outlook.
Volume indicators have been low over the past week, which has been a negative factor in the direction of the asset. In this case, positive strong trading volume is needed for the price to gain bullish momentum as of the new week. The RSI indicator moved below the 50 level in line with the price movements. The fact that the RSI remains below this level indicates that the sell-side movements may continue.
If the positive momentum observed at the beginning of the new week continues, the price is expected to rise to the $595 level first. If the $ 595 level is broken upwards, there is a possibility that it may fall towards the $ 635 and $ 665 levels, respectively. On the other hand, if resistance is encountered at the $565 level, the price is likely to fall back to the $550 level. If the $550 level is broken downwards, the $520 and $500 levels will be monitored as new support zones.
Supports 565 – 520- 500
Resistances 595 – 635 – 665
ADA/USDT
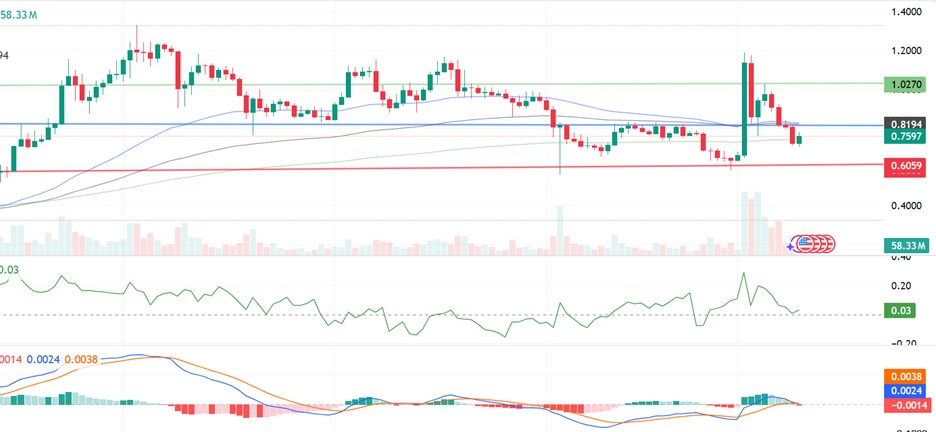
Since last week, the price of ADA has lost 24.17% to reach 0.7597. Cardano has the lowest market depth of the five altcoins included in the US cryptocurrency reserve. Market depth measures liquidity and indicates the market’s ability to absorb large buy or sell orders without significant price fluctuations. This week, Trump signed a presidential decree for the Digital Assets Working Group to move forward with this reserve. This decree could create market depth for ADA, creating bullish expectations.
In technical analysis of ADA, data from the CMF (Chaikin Money Flow) oscillator shows continued selling pressure. Momentum continues its downtrend, weakening. On the daily chart, the Moving Average Convergence/Divergence (MACD) indicator is in negative territory, moving below the signal line. The MACD remains in negative territory, indicating that selling pressure remains and the bullish move remains weak. ADA continues to trade well below the critical Exponential Moving Average (EMA) levels. In particular, the intersection of the EMA50 and EMA100 zone indicates that the price’s recovery may be limited in the short term. If the price stays above the $1.0270 level, it could change the trend direction and test the $1.1700 and $1.2110 levels. In a possible volatility scenario, in case ADA’s price falls, the 200 EMA (Green Line) may retest the $0.7030 support level and the $0.6059 support level. In case these support levels are broken, the fall may deepen.
Supports 0.7030 – 0.6059 – 0.5902
Resistances: 1.0270 – 1.1700 – 1.2110
LEGAL NOTICE
The investment information, comments and recommendations contained in this document do not constitute investment advisory services. Investment advisory services are provided by authorized institutions on a personal basis, taking into account the risk and return preferences of individuals. The comments and recommendations contained in this document are of a general type. These recommendations may not be suitable for your financial situation and risk and return preferences. Therefore, making an investment decision based solely on the information contained in this document may not result in results that are in line with your expectations.
