
BTC/USDT
Last week saw notable developments on the crypto and macro fronts. Institutional investor interest increased, with companies such as Strategy, Metaplanet and Bitdeer buying a total of 7,349 BTC, indicating strengthening market confidence. Bitcoin spot ETFs recorded net inflows for the 10th day in a row, signaling continued institutional demand with a flow of $89 million. Data from the US revealed that the economy has yet to stabilize; GDP exceeded expectations at 2.4%, while core PCE came in at 2.8%, indicating continued inflation. On the other hand, GameStop adopted Bitcoin as a reserve asset, while Mt. Gox’s $1 billion BTC transfer was thought-provoking.
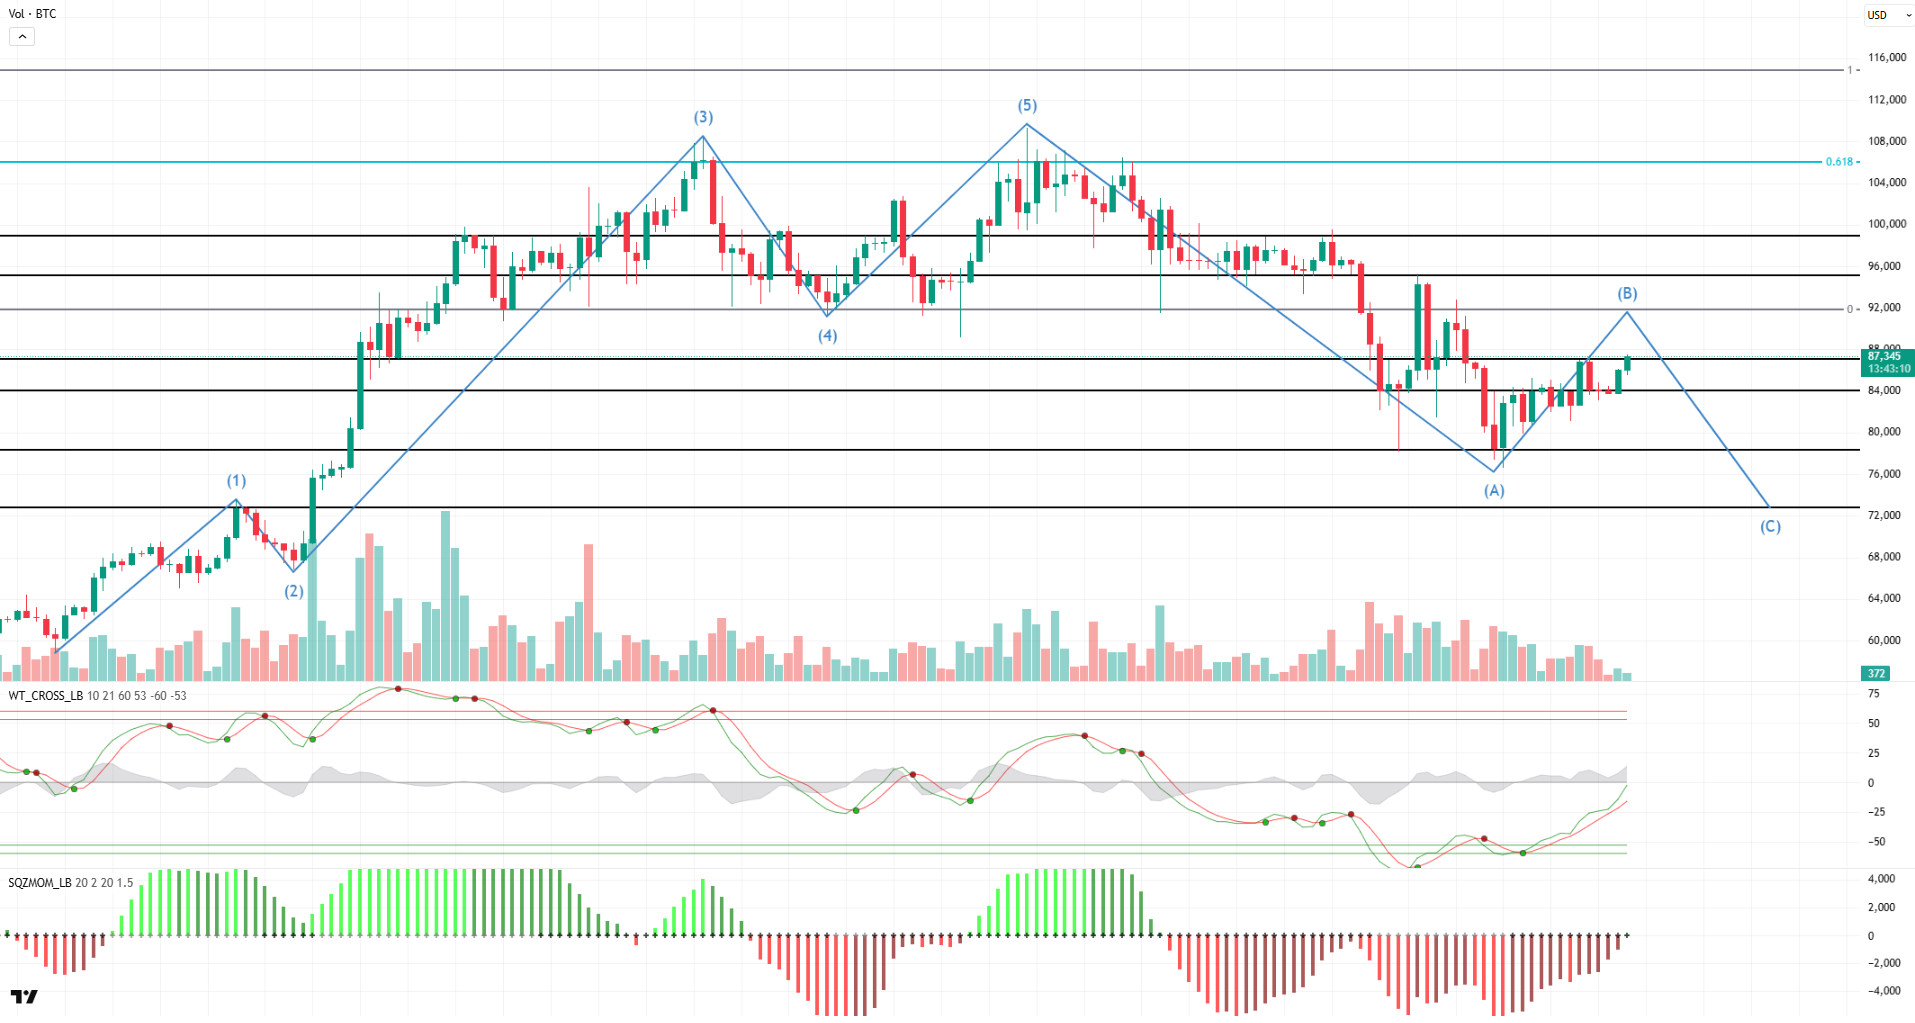
Looking at BTC’s technical outlook, we see that it has left behind an eventful week characterized by a minor uptrend and increased volatility. Starting the week at 83,000, BTC rose 5.84% to test the 88,800 level. However, with the strong resistance it encountered at this level and the increase in selling positions, it retreated to 81,700 and ended the week down 4.57%. At the time of writing, BTC is trading at 82,100. The price action moved towards point B, in line with the Elliott Wave theory mentioned in the previous week, before turning to point C. The target of point C in the theory corresponds to 72,700, which is the 1st point where the pattern started. Analyzing the technical oscillators, the Wave Trend Oscillator continues to signal a sell signal on the daily chart and momentum is weakening again. This could prompt a pullback towards the 78,500 level that the price tested earlier. In such a scenario, the double bottom pattern stands out as an important technical structure to follow. While weekly liquidation data shows that buying positions were liquidated, it is noteworthy that the market may enter a new accumulation process. In addition to the technical outlook this week, fundamental developments such as Trump’s tariff plans to be announced on April 2 may increase the selling pressure in the market. In such a case, both the double bottom pattern and the Elliott theory may become more likely to work on the technical side. On the other hand, short positions concentrated above the 87,000 level suggest that upward movements may encounter resistance in this region. In a recovery scenario with possible optimistic developments, the 84,000 level will first be monitored as resistance. If this level is exceeded, 87,000 levels may become a target again.
Supports 80,000 – 78,000 – 72,700
Resistances: 84,000 – 87,000 – 91,800
ETH/USDT
While the pressure created by tariffs on the US side deepens the ongoing wave of sales in risky assets, recession concerns continue to suppress investors’ risk appetite in the markets. Increasing global economic uncertainties and geopolitical risks have caused fluctuations in many asset classes from equities to commodities, while digital assets such as ETH are also negatively affected by this uncertainty. Declining liquidity in the market and the cautious stance of investors are causing increased selling pressure on ETH. US Federal Reserve (FED) Chairman Jerome Powell’s emphasis on uncertainty regarding the interest rate decision made it difficult for the markets to determine the direction of the markets, further reducing the risk appetite of institutional investors. As a result, Ethereum ETFs have seen continued outflows. Throughout March, Ethereum ETFs have seen negative net flows on almost every trading day, indicating weakening investor confidence and a marked decline in institutional interest. Total cumulative net inflows into Ethereum ETFs since launch have fallen to $2.426 billion with the latest outflows. While these outflows create a serious selling pressure on the market, they reveal that institutional funds’ interest in Ethereum is waning. One of the most critical factors that will determine market dynamics in the coming period will be the US customs tariffs that will take effect on April 2, 2025. This development, which creates volatility in global markets, will be decisive in shaping investors’ risk perception. However, the possibility that US President Donald Trump may show flexibility on tariffs is followed as a critical development for the markets. If Trump signals an easing in tariffs in a market-friendly manner, this may increase the general risk appetite and have a positive impact on cryptocurrency markets, especially Ethereum. In the opposite scenario, tighter trade conditions could push investors towards more defensive assets and increase selling pressure on ETH. In terms of Ethereum network activity, on-chain data shows that usage on the network has dropped sharply. Ethereum’s declining appeal and the increasing adoption of Layer-2 solutions have caused transaction volume on the main chain to decline significantly . Layer-2 networks have become a more attractive alternative for users due to lower transaction fees and faster transaction confirmation times. This has resulted in lower transaction fees on the Ethereum mainnet and reduced revenues for network validators. While the need to compensate validators is a factor that could lead to an increase in Ethereum supply, it also leads to a decrease in staking returns. The lack of new capital inflows into the Ethereum network and the decline in staking yields may call into question the attractiveness of Ethereum as a store of value in the medium and long term.
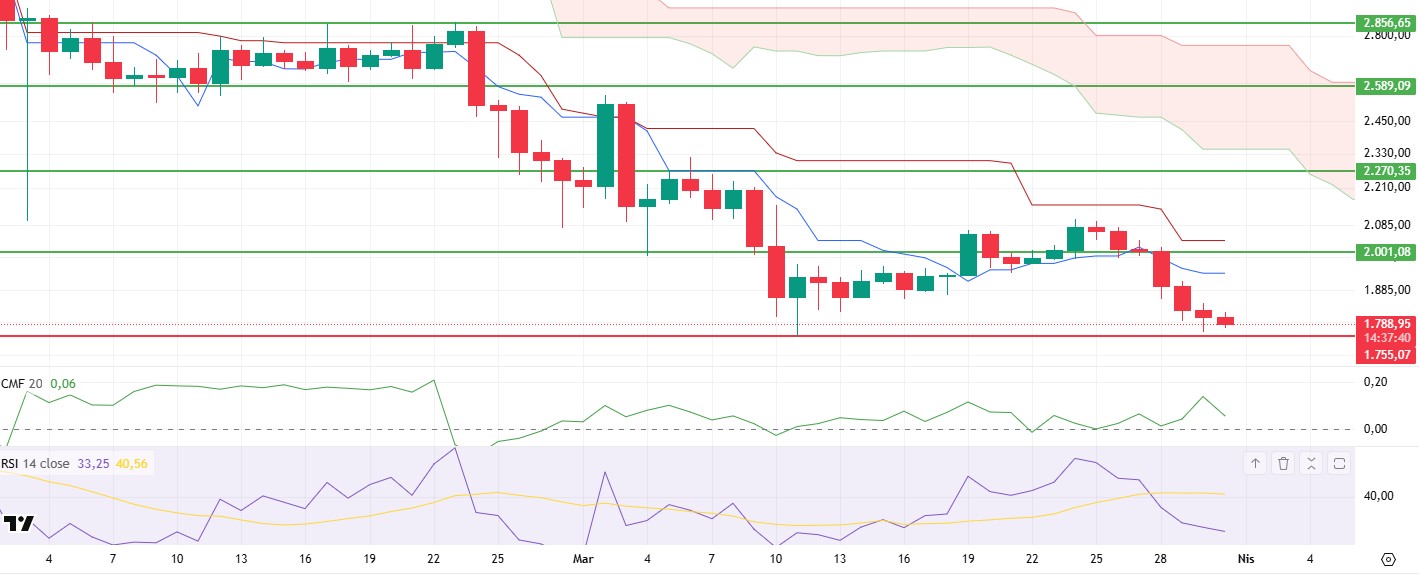
In terms of technical analysis, it is seen that the Ethereum price is hovering at critical levels. ETH, which rose above the $ 2,000 level in the past days, managed to rise to the $ 2,100 level. However, intense selling pressure from this region caused the price to move down again. Cumulative Volume Delta (CVD) data, which shows that selling pressure is common in both spot and futures markets, reveals that buyers do not have enough power. Increased liquidity outflows on the futures side suggest that leveraged trades are starting to unwind and the selling pressure is not organic. In addition, the Chaikin Money Flow (CMF) indicator shows that the price moved upwards in a low-volume environment over the weekend but weakened with increased selling on the futures side. With the negative opening of the US stock markets on Monday, selling accelerated in the spot market and the CMF indicator moved downwards. This indicates that liquidity outflows from the market have increased and Ethereum is going through a difficult period in terms of institutional fund flows. Momentum indicators are also showing signs of weakness. The Relative Strength Index (RSI) fell as low as 33, indicating that ETH is approaching oversold territory, and the price is maintaining its bearish momentum. According to the Ichimoku indicator, the price’s loss of the tenkan level further strengthens the negative outlook, while the downtrend is likely to continue if ETH fails to make a strong recovery from current levels.
Given the current technical structure, the most critical support zone for ETH is at $1,755. While ETH price is converging to this area, it seems likely that a deeper correction is likely to occur if the selling pressure continues and this level is broken. The high levels of open positions, especially in the futures market, indicate that rapid and sharp sales may come if the $1,755 support is lost. On the other hand, if a strong buying reaction comes from this level and the risk appetite in global markets recovers, it may be possible for Ethereum to rise above the $2,000 level again and create permanent pricing here. As a result, the uneasiness in global markets, ongoing outflows from Ethereum ETFs and weak new capital inflows to the Ethereum network cause ETH to maintain its current downward trend. In the short term, the $1,755 level should be followed as a critical threshold for price movements. If it falls below this level, selling pressure for Ethereum can be expected to intensify further.
Supports 1,755 – 1,527 – 1,233
Resistances 2,001 – 2,270 – 2,589
XRP/USDT
After reaching a multi-year peak of $3.40, XRP has faced strong selling pressure, falling nearly 40% to as low as $2.05. The retreat came as the market was caught in a wave of broad selling amid general macroeconomic pressures and a growing risk aversion, despite positive developments regarding the SEC’s dismissal of its lawsuit against Ripple. The uncertainties created by US President Donald Trump’s trade policies have negatively affected many risky assets, including crypto markets. In particular, the break of the $2.24 level accelerated the decline and deepened the selling pressure.
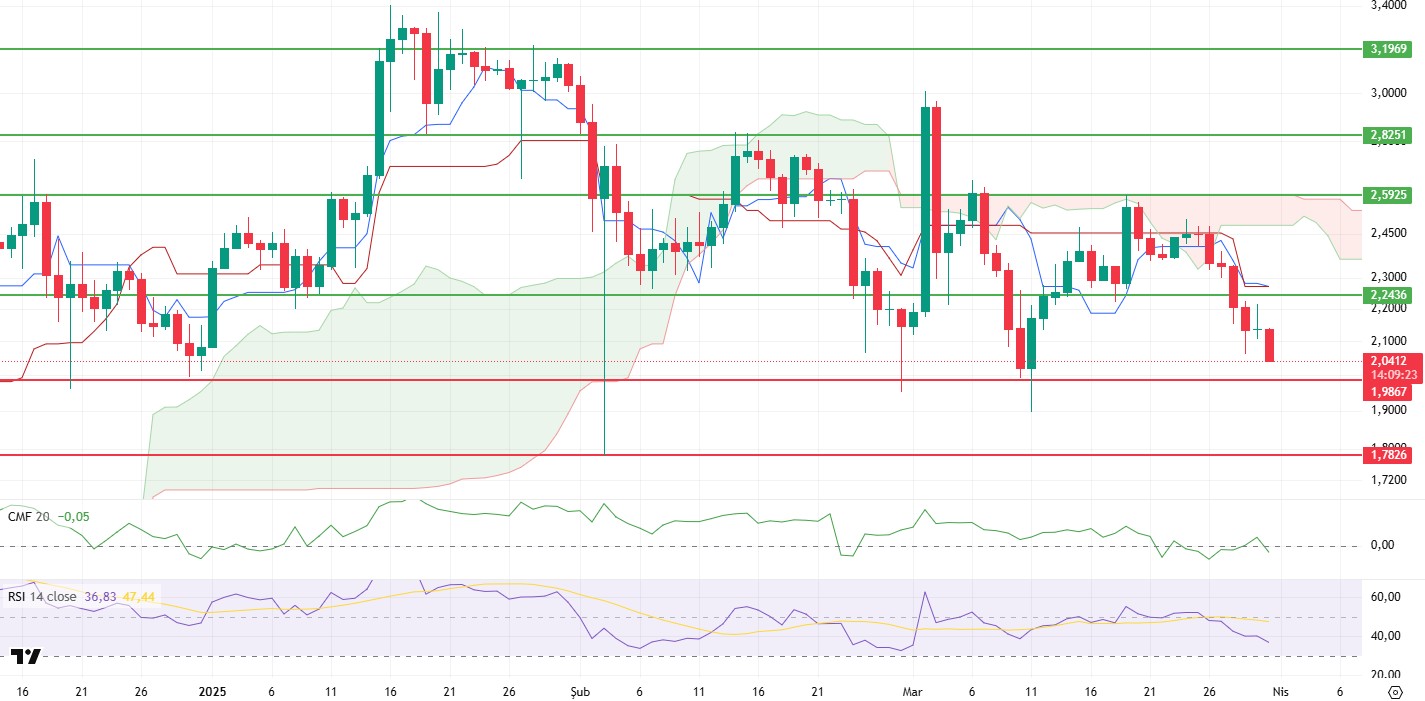
In terms of technical analysis, market structure is weakening, and price action is giving negative signals. The Chaikin Money Flow (CMF) indicator was flat with a bearish move, indicating that liquidity outflows did not increase sharply, but the selling pressure came mostly from the futures markets. The high volume of selling on the futures side suggests that the market is largely driven by leveraged traders and the price action lacks organic buyer support. An analysis of the Ichimoku indicator shows that the overall technical picture is negative as the price dips below the kumo cloud, tenkan and kijun levels. In particular, a break below the cloud suggests that the market has entered a clear downtrend, and that weakness could continue if buyers fail to seize momentum. Equal kijun and tenkan levels suggest that the price remains uncertain about the direction and the market needs a strong catalyst to enter a new trend. Momentum indicators also confirm that selling pressure continues. The Relative Strength Index (RSI) lost its strong support level to 37, indicating that the market is approaching oversold territory, and the downtrend is continuing due to weakening buying power. If the RSI stays at these levels, the price may remain bearish, while the RSI will need to rise back above the 40 level for a possible reaction buying.
In light of the current technical outlook, the XRP price is likely to retreat to the $1.98 region. In the absence of a strong buying reaction at this level, the price is likely to retreat to the main support zone at $1.78. Since the $1.78 area is a critical support level in terms of past price movements, the market is likely to react from here. However, if the general risk sentiment in the markets remains negative and XRP fails to get a strong buyer response from this level, selling pressure towards lower levels can be expected to continue. On the other hand, if global macroeconomic developments and market sentiment improve, it may be possible for the price to rebound and move towards the $2.24 resistance. If a permanent breakout above this level occurs, XRP may strengthen its upward movement and enter a new uptrend.
Supports 1.9867 – 1.7826 – 1.5358
Resistances 2.2436 – 2.5925 – 2.8251
SOL/USDT
Last week in the Solana ecosystem.
- Block Beats News notes that Fidelity Investments has registered a Solana Fund in Delaware on March 22, 2025.
- Polymarket officially launched on the Solana blockchain, allowing users to make deposits using Solana’s cryptocurrency.
- BlackRock has expanded its blockchain-based money market fund to the Solana blockchain.
- According to PANews, the Chicago Board Options Exchange (CBOE) has applied for a Solana ETF on behalf of Fidelity.
- The CME’s Solana futures ETF failed to sustain and see the first day’s interest and quickly dwindled to as few as 73 contracts.
On the onchain side;
- According to Flipside data, the total supply of stablecoins on Solana exceeded $12.8 billion, reaching the highest level since January 2021.
- According to DeFiLlama data, Solana’s total locked value (TVL) rose to 54.87 million SOL, the highest level since June 2022.
- fun’s new DEX reached $1 billion in volume one week after launch.
- According to Odaily, Solana reported that the number of addresses on its network reached an all-time high, rising to around 11.12 million.
- A newly created cryptocurrency addresses recently revealed that 1.77 million SOL coins, worth approximately $223 million, were recently withdrawn from a centralized exchange.
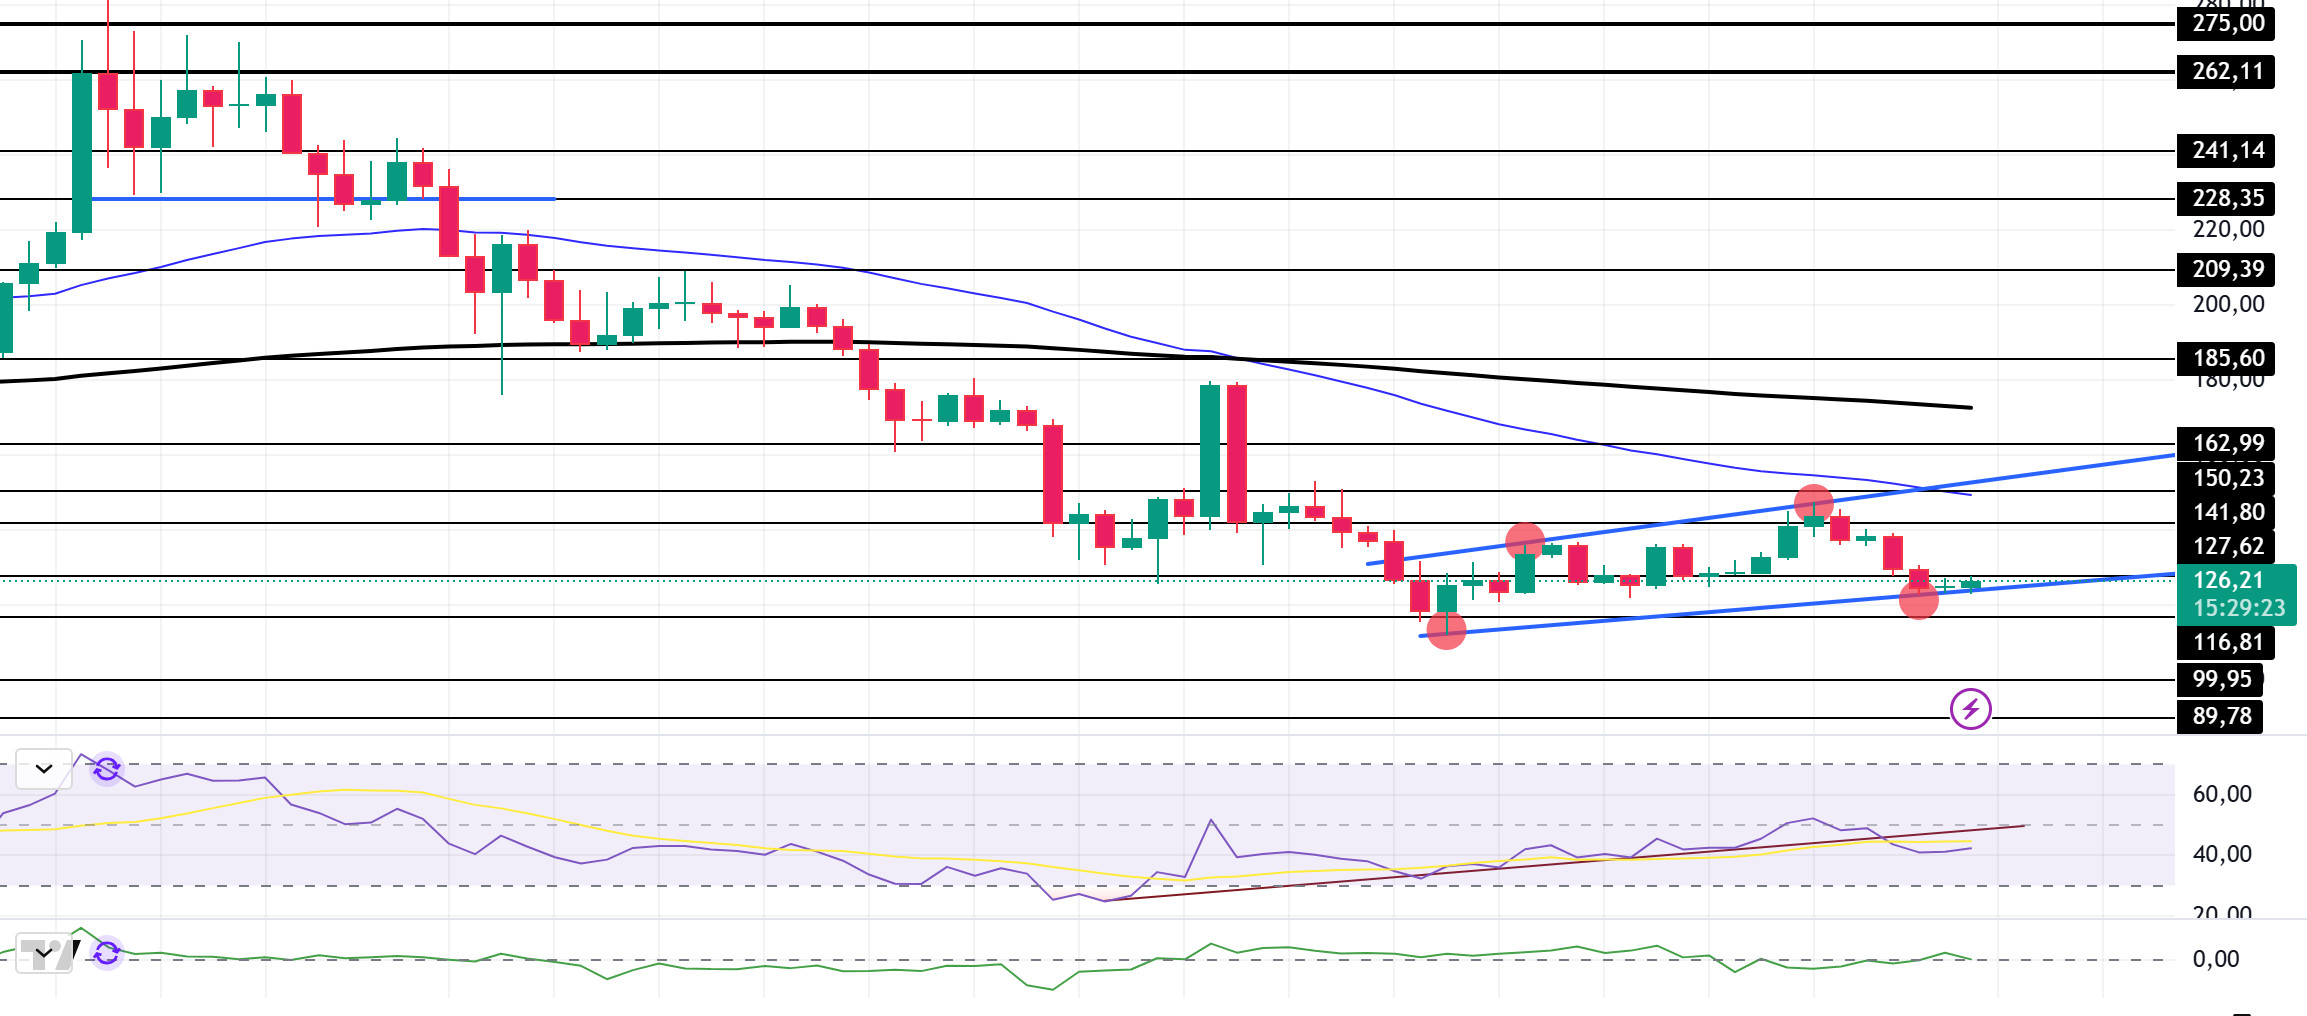
With these developments, when we look technically at SOL, the network’s native token, it has declined 10% since last week. Although the price tested the rising support level for the 3rd time, which started on March 11, the rise was not that strong and returned from the strong resistance levels. The asset is below the 50 EMA (Blue Line) and the 200 EMA, while the 50 EMA (Blue Line) continues to be below the 200 EMA (Black Line). With the death cross, the downward momentum may continue and cause the asset to fall further in the medium term. Relative Strength Index (RSI)14 is at the mid-level of the negative zone. It has also broken the uptrend to the downside since February 26. This may cause the price to decline further. The Chaikin Money Flow (CMF)20 indicator is close to the neutral level, but an increase in volume could strongly increase inflows. If the positive results in macroeconomic data and positive developments in the ecosystem continue, it may test the first major resistance level of $ 141.80. In case of negative news from macroeconomic data or the Solana ecosystem, the $ 116.81 level can be followed and a buying point can be determined.
Supports 116.81 – 99.95 – 89.78
Resistances 127.62 – 141.80 – 150.23
DOGE/USDT
Last week in the Doge ecosystem;
- There is no cryptocurrency involvement in the government’s efficiency initiative, with Elon Musk clarifying amid speculation that DOGE has no relationship with Dogecoin.
- Rosen Bridge will integrate Dogecoin into its secure ecosystem in two weeks. Dogecoin (DOGE) has made an important update.
- In an X post, House of Doge, an arm of the Dogecoin Foundation, officially informed the community about the noteworthy developments, stating that the official Dogecoin Reserve is now live and will launch the reserve with 10 million Dogecoins.
On the onchain side;
- Among whales holding between 1 million and 10 million DOGE, there was a significant increase from 10.38 billion to 10.45 billion DOGE.
- According to PANews, data from Santiment reveals that Dogecoin’s network activity has reached its lowest point since October 2024. There are currently only 66 ‘whale’ transactions per day on the network and active addresses have fallen below 60,000.
- Dogecoin whales have embarked on a remarkable buying spree. The whales have bought 200 million coins in the last 14 days.
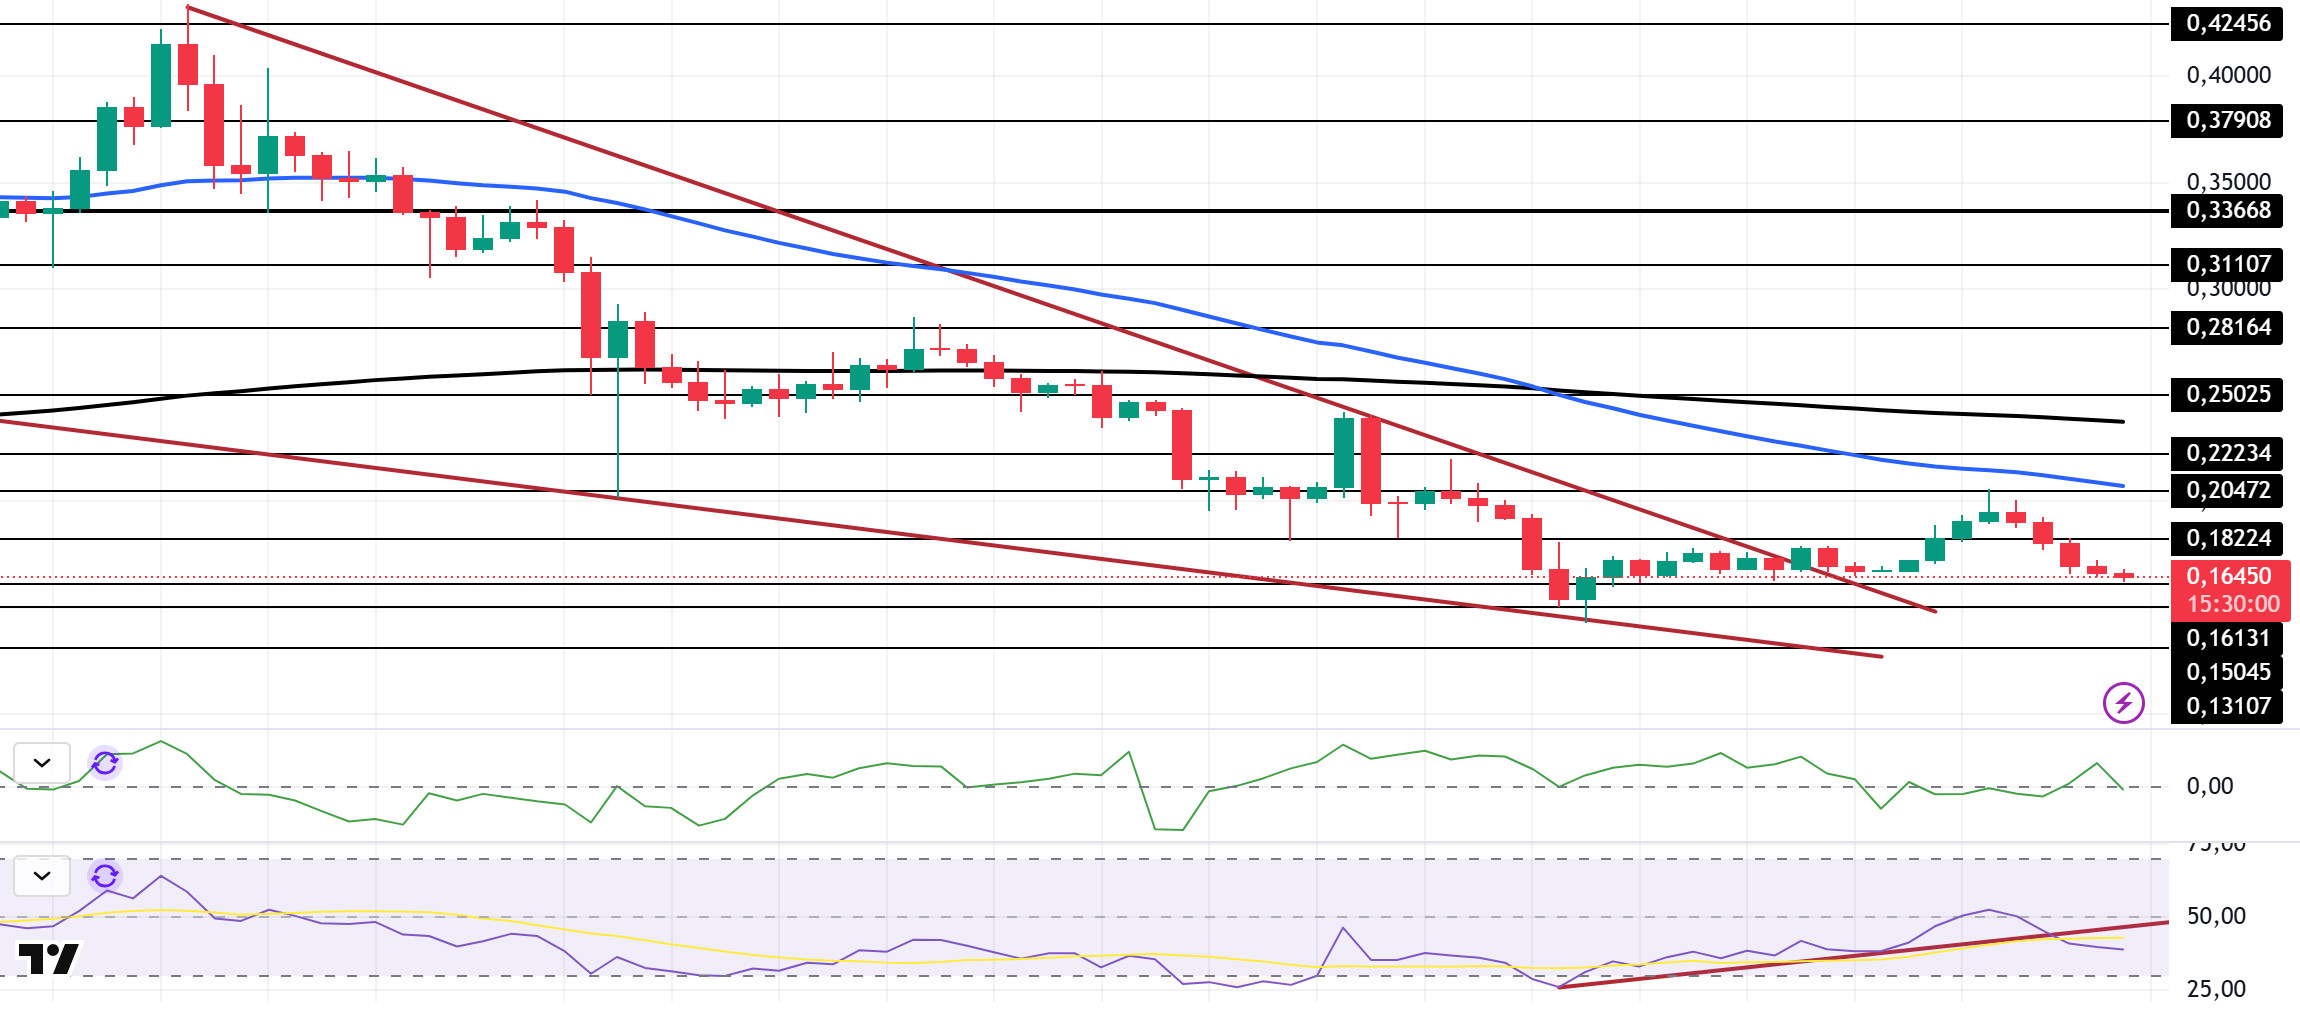
If we examine DOGE technically in the focus of all these developments, when we look at the daily chart, it has been in a downtrend since January 17 and broke the downtrend last week and also broke the bullish wedge pattern. This breakthrough raised the asset to the resistance level of $ 0.20472. However, it was affected by the general decline of the cryptocurrency market and fell by 20%. It is currently testing the strong support level of $0.16131. On the other hand, the 50 EMA (Blue Line) is pricing below the 200 EMA (Black Line) and the death cross pattern shows us that the downtrend continues. When we look at the Chaikin Money Flow (CMF)20 indicator, it is at a neutral level. Negative money inflows suggest that price declines may continue, and CMF may move into negative territory. Relative Strength Index (RSI)14 lost momentum from the neutral zone and found value in the middle levels of the negative zone. At the same time, the uptrend that started on March 10 broke to the downside. This may further exacerbate the pullback. In case of possible negative developments in macroeconomic conditions and ecosystem, the $0.15045 level can be followed as a strong support. In case the retracement ends, and the rises begin, the 0.20472-dollar level should be followed as a strong resistance.
Supports: 0.16131 – 0.15045 – 0.13107
Resistances: 0.18224 – 0.20472 – 0.22234
TRX/USDT
With 1 billion USDT printed on the Tron network last week, the amount of USDT in circulation on the network reached $64.7 billion. The number of USDT addresses on Tron has increased as a result of the recently launched Gas Free feature, which allows fee payments to be made in USDT instead of TRX. So much so that 78% of all USDT addresses are located on the Tron network. In addition, the Tron network continues to attract attention with its high utilization rate recently, and as a result, its 7-day total revenue last week was 1.2 million dollars. With this revenue, it ranked first among all networks.
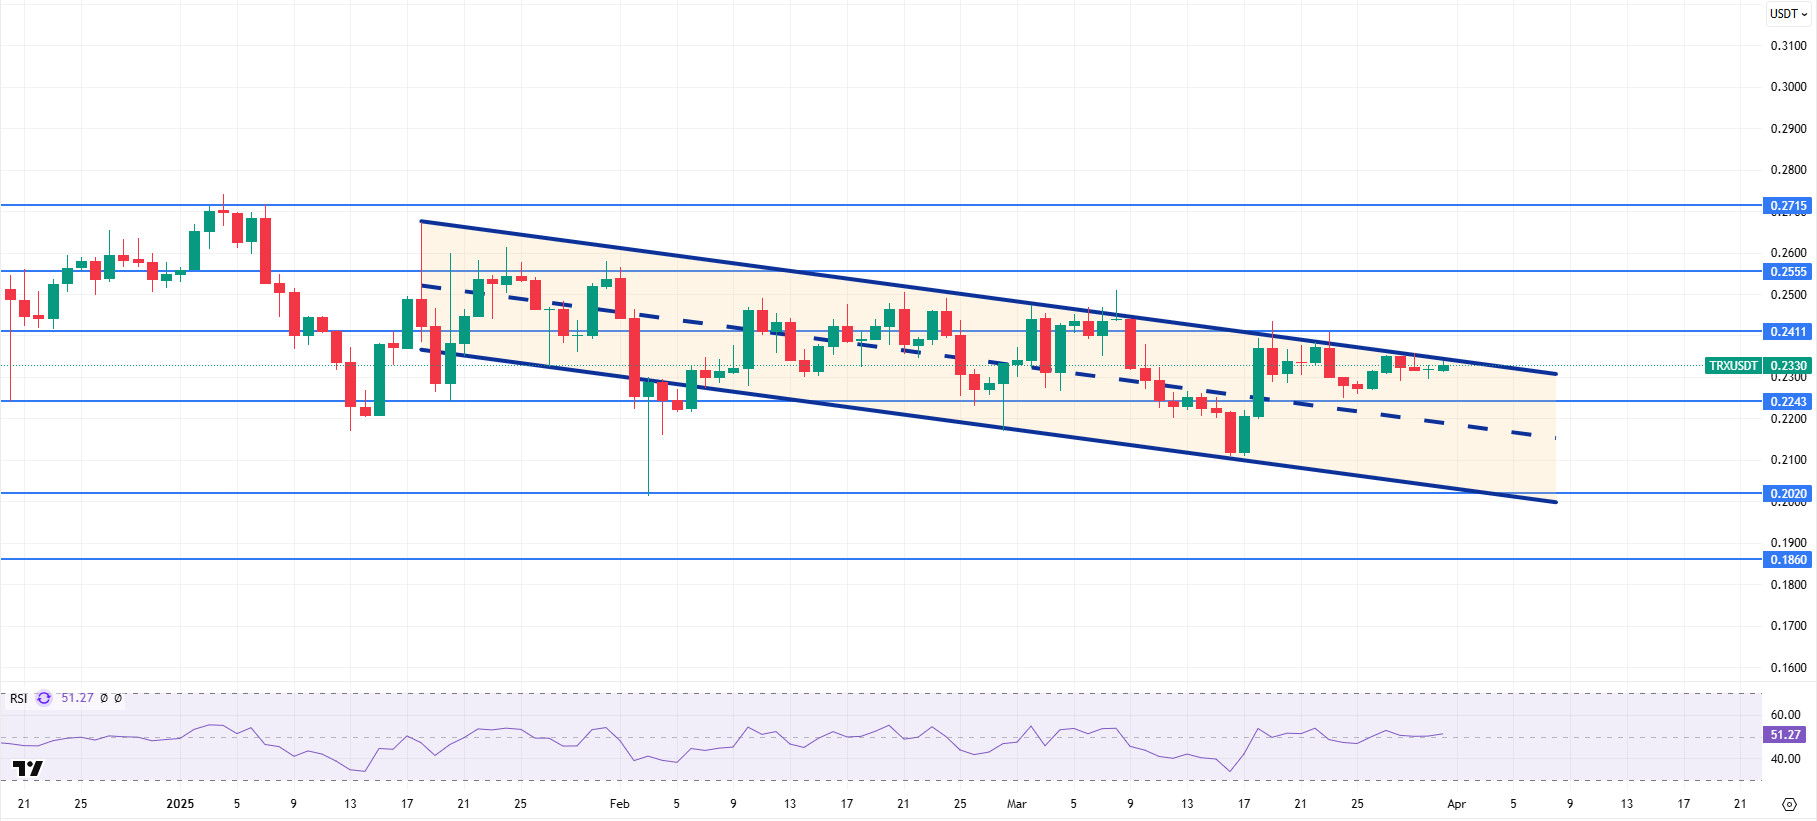
TRX, which started last week at 0.2299, rose about 1% during the week and closed the week at 0.2319. TRX, currently trading at 0.2330, is in the upper band of the bearish channel on the daily chart. With a Relative Strength Index value of 51, it can be expected to move towards the bearish channel middle band by falling slightly from its current level. In such a case, it may test 0.2243 support. If it closes daily below 0.2243 support, it may continue its decline and may want to test 0.2020 support. If it cannot close daily under 0.2243 support, it may rise with the buying reaction that may occur and may try to break the channel upwards. In such a case, it may test 0.2411 resistance. As long as it stays above 0.2020 support on the daily chart, the bullish demand may continue. If this support is broken, selling pressure is expected to increase.
Supports 0.2243 – 0.2020 – 0.1860
Resistances: 0.2411- 0.2555 – 0.2715
AVAX/USDT
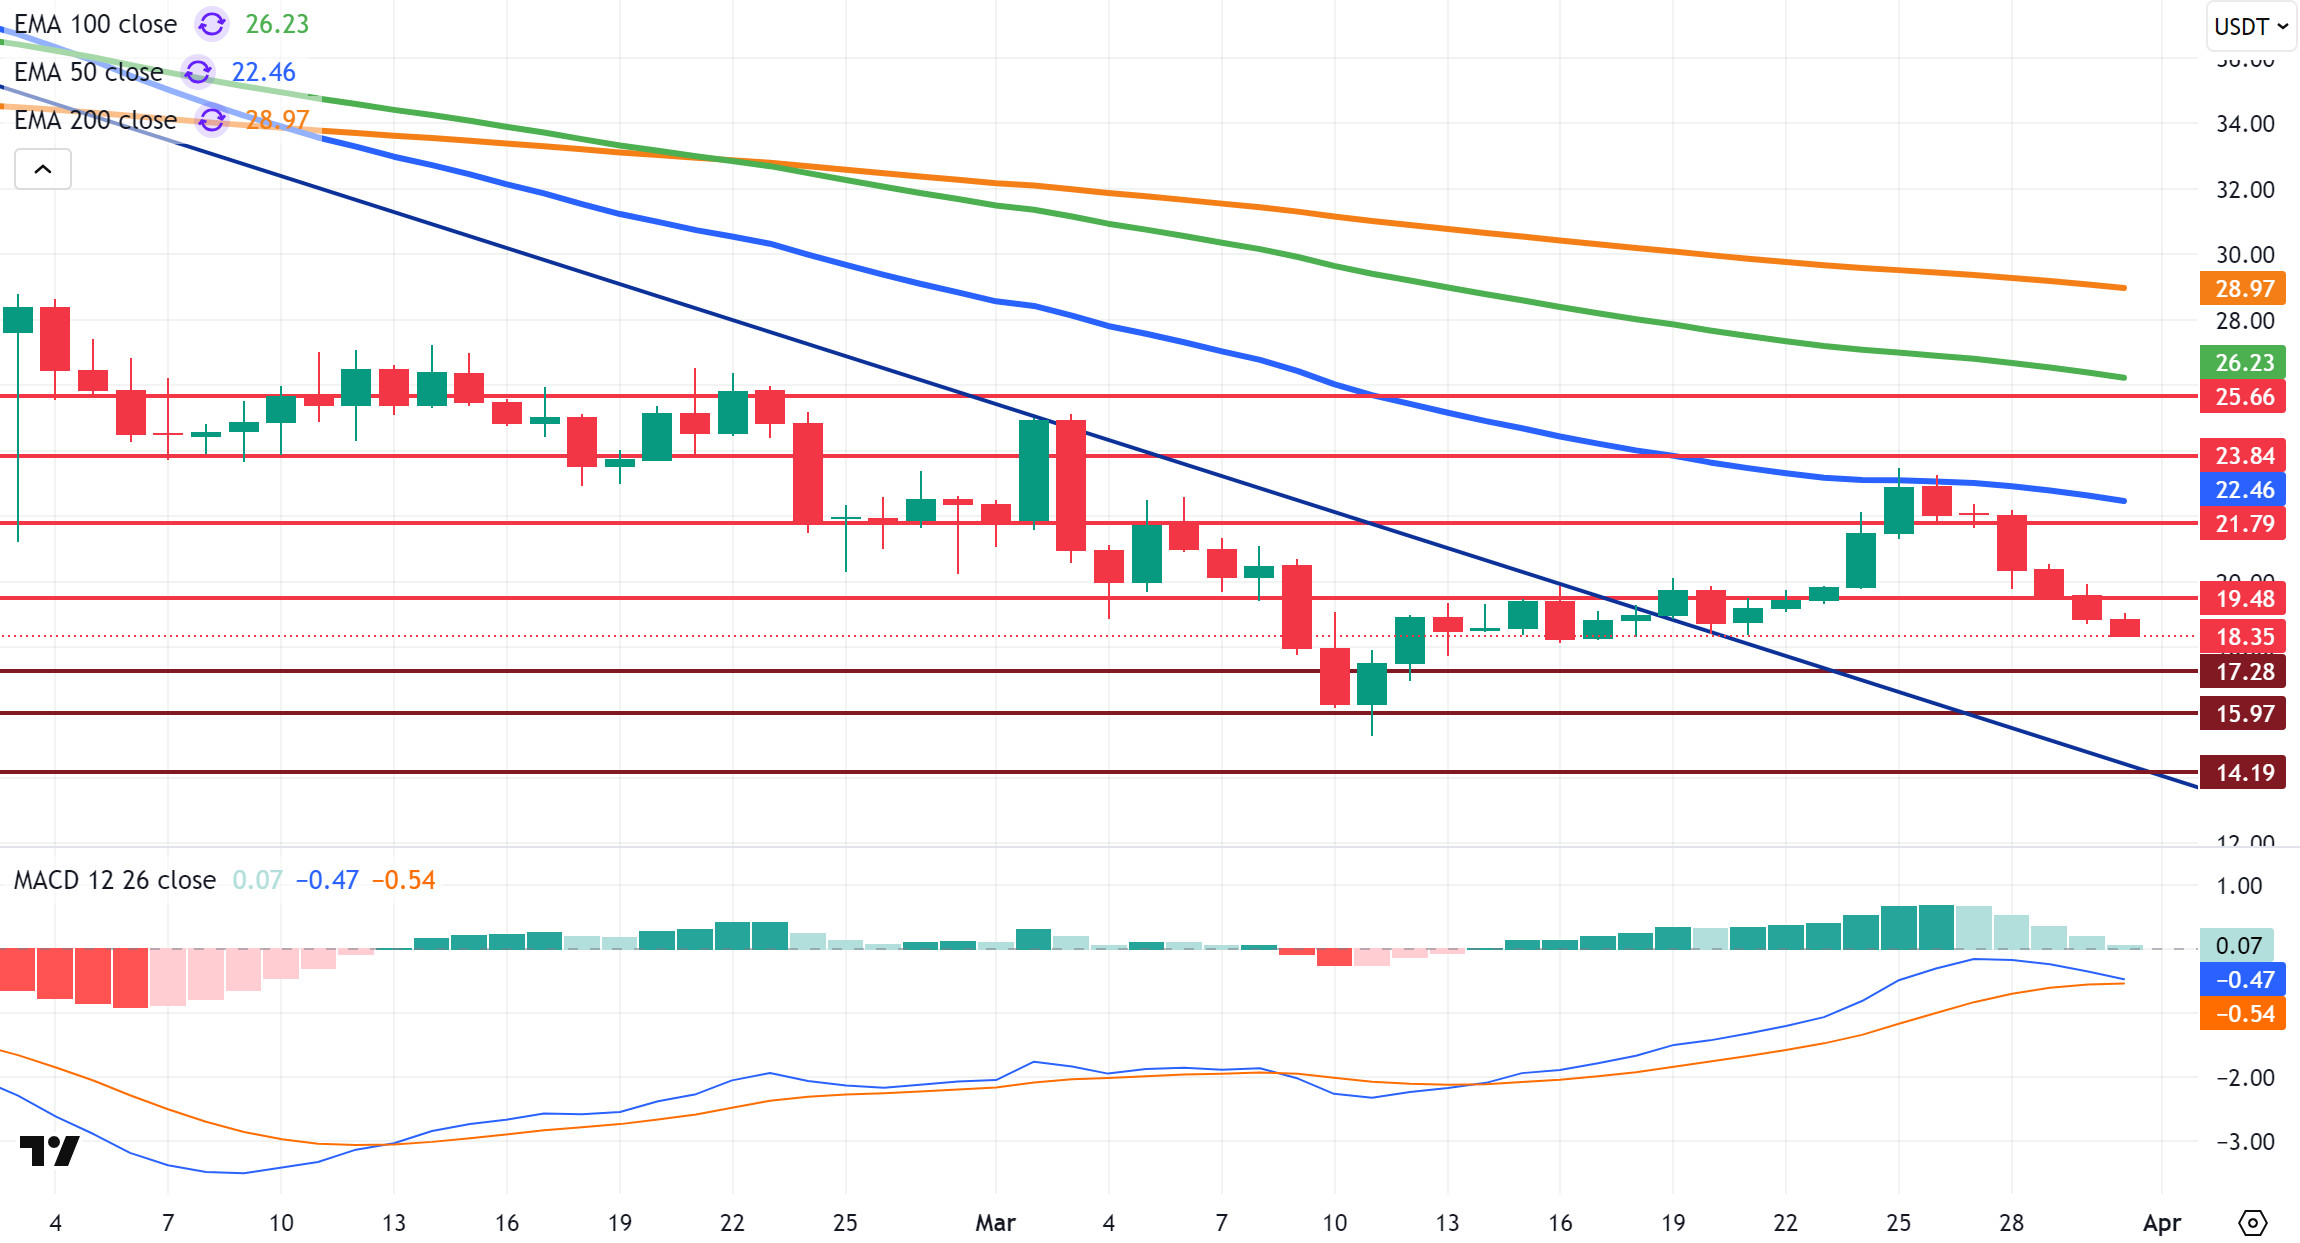
Although AVAX started last week with a rise at $19.80, it turned down with selling pressure from the 50-period Exponential Moving Average (EMA50) level. Despite testing the EMA50 level, AVAX, which could not overcome this resistance, declined and closed the week at $ 18.85. AVAX, which started the new week with a weak outlook, continues to be traded at $ 18.35 as of now.
On the daily chart, the Moving Average Convergence/Divergence (MACD) indicator is still in negative territory but above the signal line. This suggests that there is an effort to recover momentum, but the uptrend is yet to be confirmed. On the other hand, AVAX is still trading below the critical Exponential Moving Average (EMA) levels. Especially below the EMA50, it technically indicates that selling pressure continues.
AVAX is currently searching for direction at critical technical levels. The fact that it remains below the EMA50 and the MACD is still in negative territory suggests that upside movements may remain limited. In case the selling pressure and downward trend continues, the first strong support is at $17.28. If this level is broken, a retreat to the support levels of $15.97 and then $14.19 may be seen, respectively. On the other hand, positive news flow about AVAX and a change in the direction of market momentum could lead the price to experience an upward breakout. In this case, it may be possible for AVAX to break through the $19.48 resistance and recover to the $21.79 level. If the MACD crosses into positive territory and strong buying comes in, AVAX could potentially test the $23.84 level.
(EMA50: Blue Line, EMA100: Green Line, EMA200: Orange Line)
Supports 17.28 – 15.97 – 14.19
Resistances 19.48 – 21.79 – 23.84
SHIB/USDT
Shiba Inu (SHIB) has been on a downtrend in recent days, facing selling pressure. Macroeconomic uncertainties and profit-taking triggered the decline, while there was also a warning against a phishing scam targeting the SHIB community. Metrics show a 79.55% drop in token transfers and a 33.68% drop in active wallet addresses. The increase in SHIB reserves on exchanges indicates that the selling pressure continues. These developments suggest that challenges may continue for SHIB in the short term.
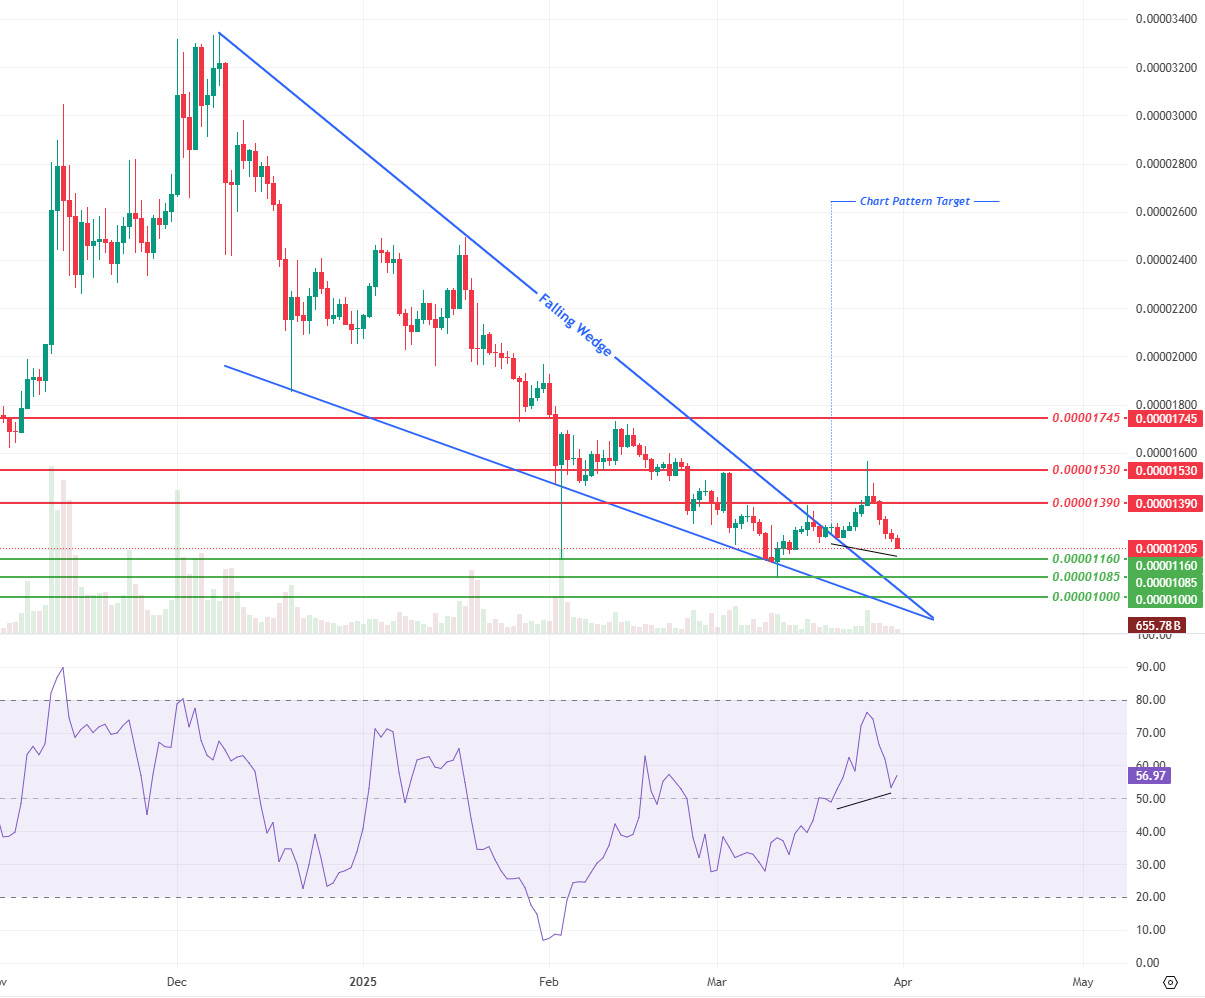
From a technical perspective, Shiba Inu (SHIB) price saw increased volume and volatility this week, but momentum weakened. After the Falling Wedge pattern that came to the fore last week, the price rejected the first resistance level of $0.00001530 and then broke down the $0.00001240 support level.
Currently, the MFI (Money Flow Index) shows a positive mismatch (Black Line), indicating that buying interest may increase despite the selling pressure. However, in order for the price to recover again, it will be important for it to rise above the 0.00001240-dollar level and maintain its permanence here. Otherwise, if the downward movement continues, the 0.00001160-dollar level should be followed as a critical support.
In the upside scenario, the price needs to hold above the 0.00001240 level and then test the 0.00001390 resistance in order to regain strength. In case this level is breached, the 0.00001530 region may come up as the next target.
Supports 0.00001160 – 0.00001085 – 0.00001000
Resistances 0.00001390 – 0.00001530 – 0.00001745
LTC/USDT
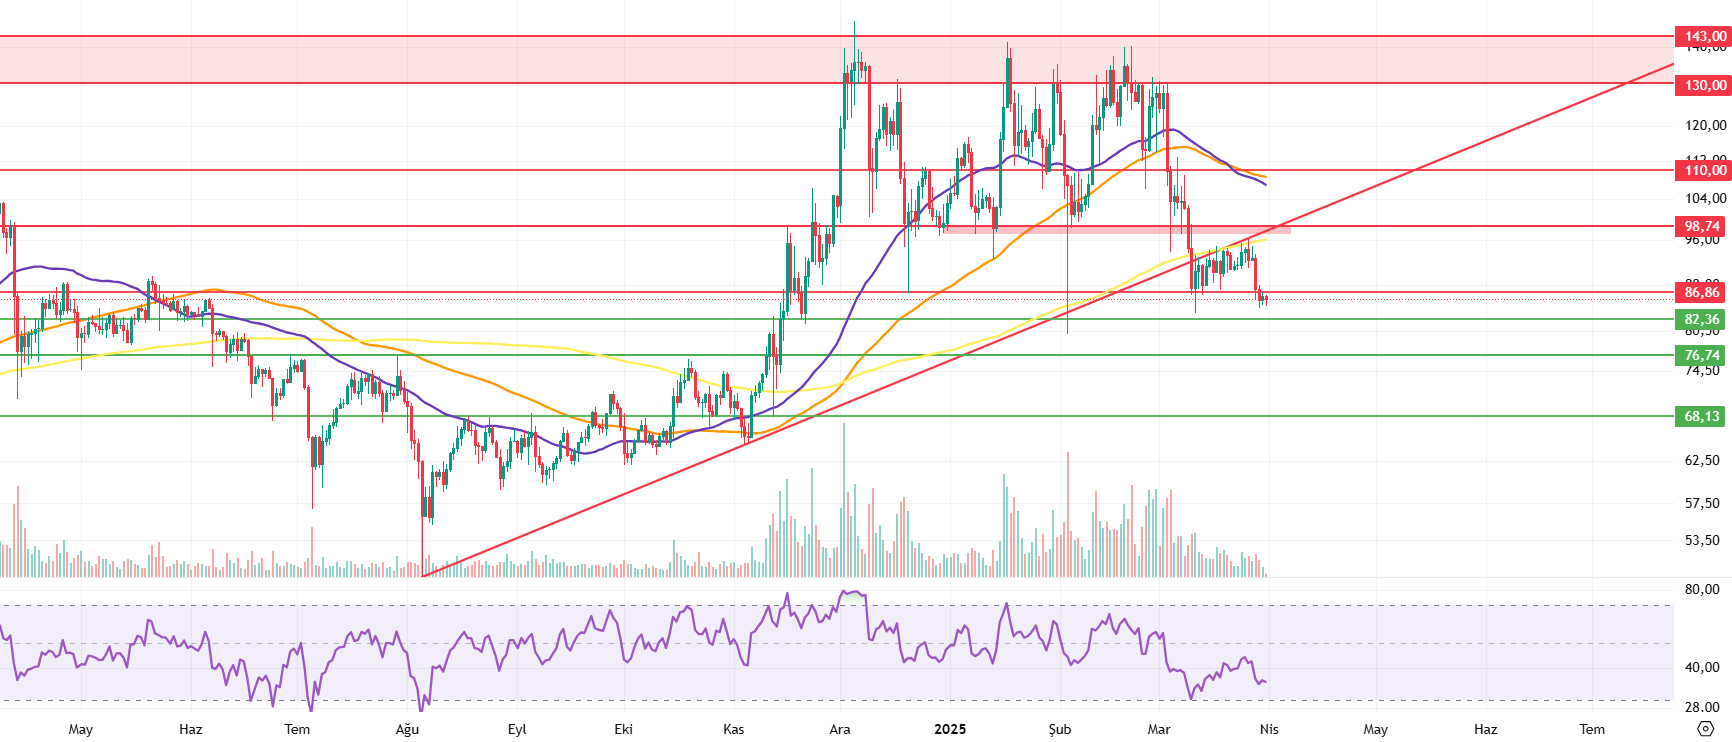
Litecoin has realized a decrease of 5.88% over the past week. During this period, Litecoin lost 1.51% of its value compared to Bitcoin. With the weekly market capitalization hovering around $6.49 billion, Litecoin moved up one spot to 19th place in the market rankings. The amount of open interest in futures was recorded at $246 million at the beginning of this week, compared to $367 million in the previous week, and funding ratios are negative.
On Litecoin’s daily chart, the price continued to stay below the 50-period moving average (purple line / MA50), 100-period moving average (orange line / MA100) and 200-period moving average (yellow line / MA200), and the weekly chart closed below the 50-period moving average, strengthening the possibility of a continuation of the downward trend.
With the failure to overcome the negative pressure and possible pullbacks in Bitcoin, the first of the important support levels for Litecoin is located at 82.36, the 100-week moving average level. Then, the 76.74 level can be considered as horizontal support. In case this level is broken, a rapid retracement towards 68.13 can be expected
In the event of a rebound in Bitcoin, Litecoin is likely to follow suit. In this scenario, the broken support at 86.86 can be expected to work as resistance. Subsequently, the resistance at 98.74 , as well as the upper limit of the red zone can be considered a very important level, as it coincides with this week’s level of the broken trend. In the continuation of the rise, it should be taken into account that profit realizations may begin at 110.00 as intermediate resistance.
Resistances 86.86 – 98.74 – 110.00
Supports 82.36 – 76.74 – 68.13
LINK/USDT
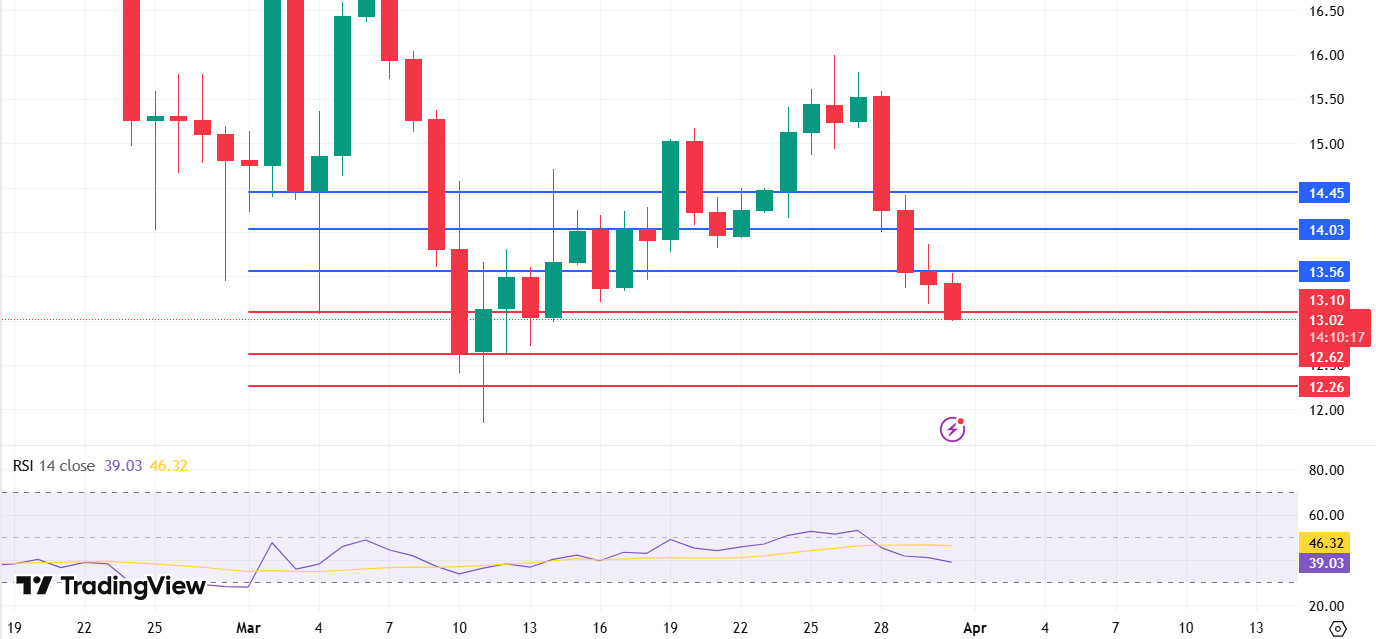
LINK is currently trading at $13.02, and the price stands at a critical point. We observe a market structure dominated by sellers in recent days. The nearest resistance levels ahead are $13.56, $14.03 and $14.45. If the price starts to recover, these levels will be important hurdles to overcome. For now, however, more downside risks stand out. If it breaks below $13.10, there is a possibility that the price could fall to $12.62 or even $12.26. The Relative Strength Index (RSI) is at 39.03 and still below 50. This supports the weak outlook in the market. If the RSI approaches the 30 level, it means that the oversold zone has been entered, and the price is likely to react upwards. Two different scenarios are currently on the table. If the price holds above the $13.02 level and buyers step in, the first target could be $13.56 and then $14.03. However, if the $13.02 support is lost, the possibility that the sales will deepen, and the price will fall to $12.62 and $12.26 levels becomes stronger.
Supports 13.10 – 12.62 – 12.26
Resistances 14.45 – 14.03 – 14.45
BNB/USDT
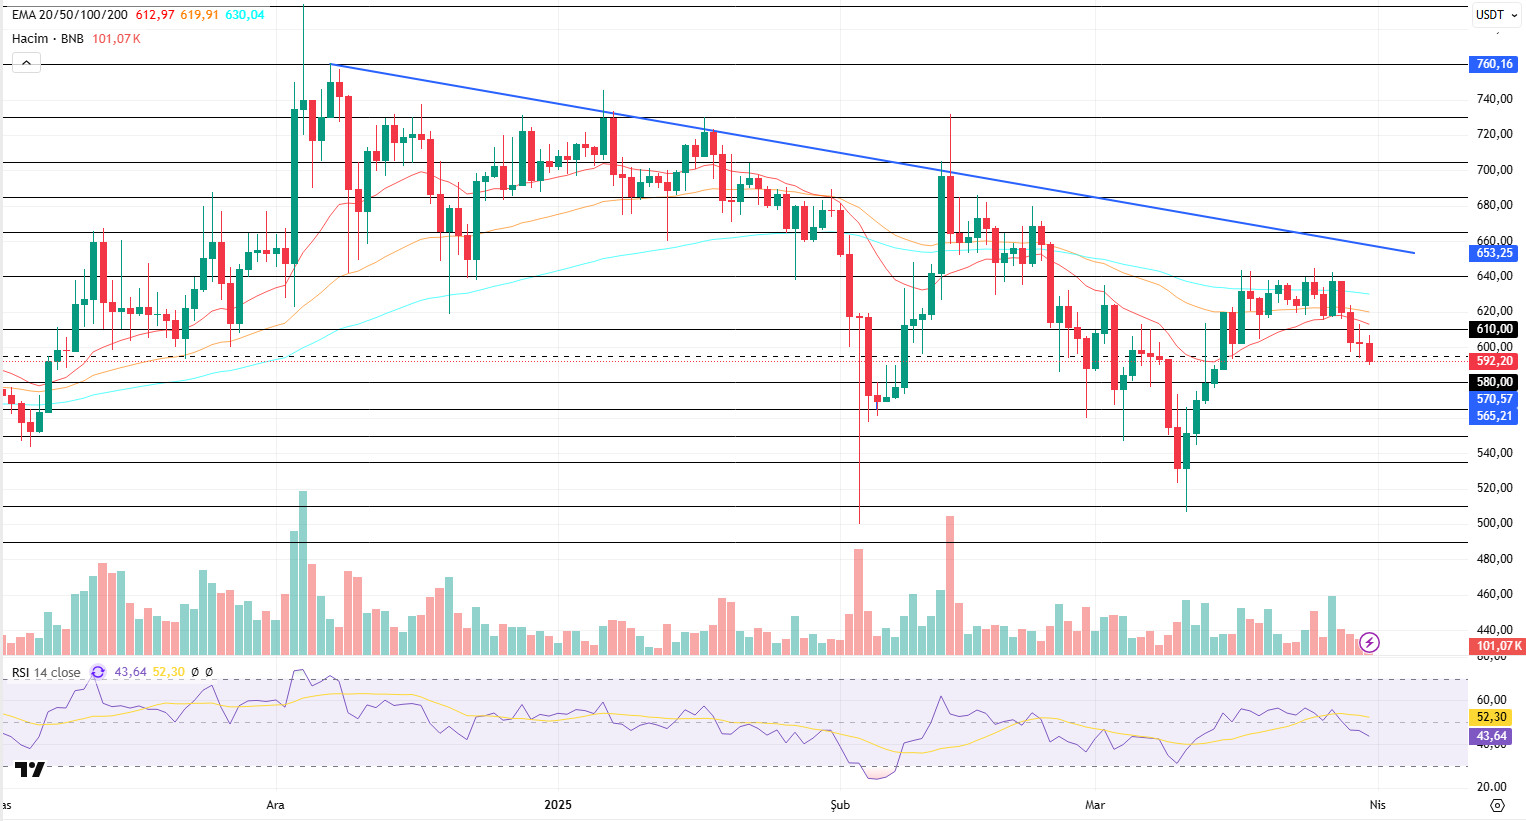
At the beginning of last week (Monday, March 24), BNB/USDT, which gained positive momentum during the day, rose to the $ 640 level, but continued to encounter resistance at this level. The asset, which generally fluctuated in the 610–640-dollar price range in the following days of the week, started to retreat with increasing selling pressure at the 640-dollar level in the last four-day period and continued to be priced in the negative zone.
BNB/USDT continued its bearish momentum at the start of the new week and is currently moving in the range of $580-610. It also broke below the EMA 20 (Red line), EMA 50 (Orange line) and EMA 100 (Blue line) levels, maintaining its short-term negative outlook.
Volume indicators were generally negative over the past week, which led to increased selling pressure on the asset. In this context, a strong positive trading volume is needed for the price to maintain its bullish momentum in the new week. The RSI indicator fell below the 50 level in line with the price action, indicating continued downward pressure. If the RSI remains below this level, it indicates that the sell-off may continue.
If the negative momentum observed at the beginning of the new week continues, the price is expected to fall to the $580 level first. If the $580 level is broken down, there is a possibility of a pullback towards the $565 and $550 levels, respectively. On the other hand, if a strong support is encountered at the $580 level, the price is likely to rise again to the $610 level. If the $610 level is broken upwards, the $640 and $660 levels will be followed as new resistance zones, respectively.
Supports 580- 565- 550
Resistances 610- 640- 665
ADA/USDT
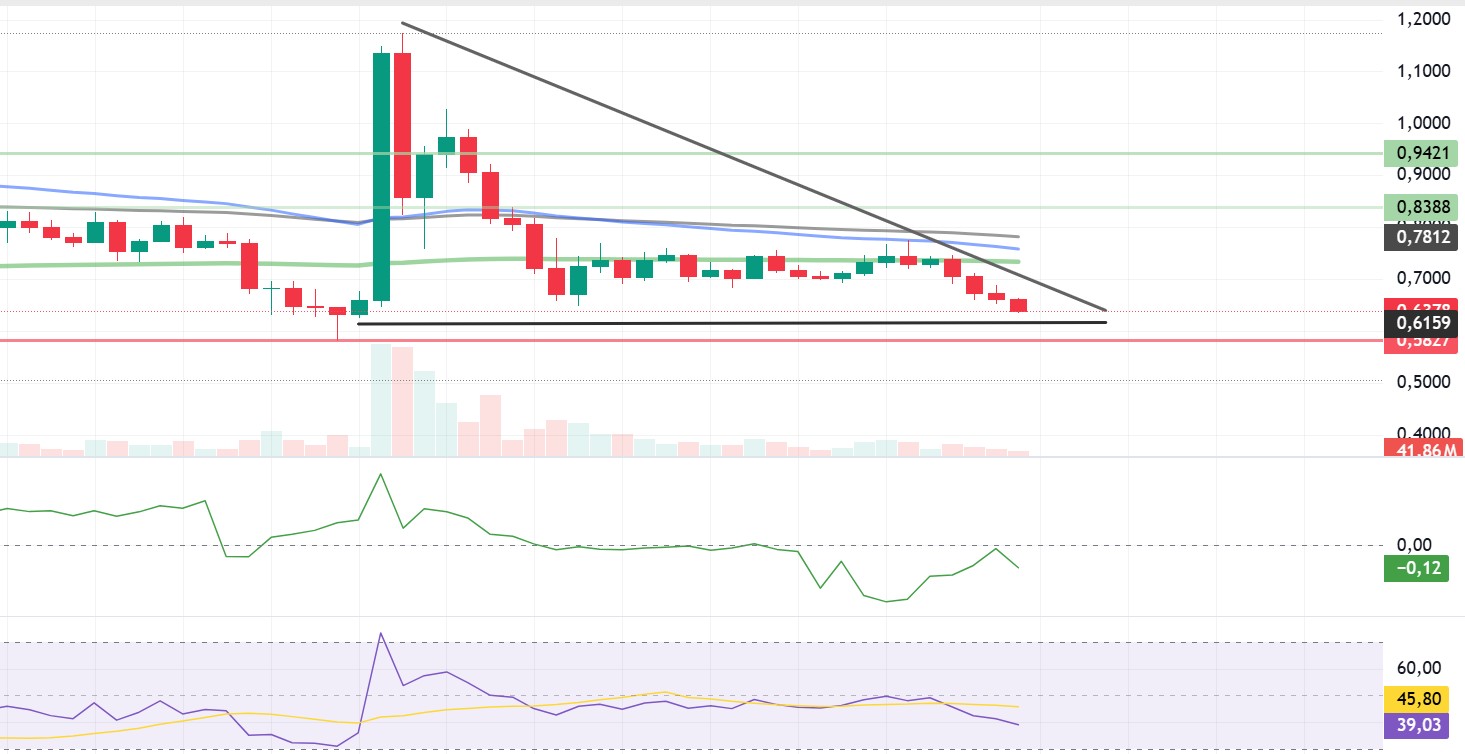
Trump’s announcement in early March that Cardano would be added to the strategic crypto reserve led to a price spike. However, ADA has not been added to the digital asset reserve and the government has not announced any plans to do so. Cardano started the week without volume, rising 8.49% from 0.6942 to test 0.7714. However, with the strong resistance it encountered at this level and the increase in selling positions, it retreated to 0.6424 and ended the week down 18.84%.
Looking at the technical chart, ADA tested the uptrend that started on March 2 as resistance but failed to break it, deepening its decline. The price remained below the 50 EMA (Blue Line) 200 EMA (Green Line) on the daily timeframe. This could deepen the decline further in the medium term. The Chaikin Money Flow (CMF)20 indicator is in negative territory, but the negative daily volume may reduce inflows and cause CMF to move into negative territory. However, the Relative Strength Index (RSI)14 indicator retreated to the lower level of the negative zone. If the uncertainty in the markets increases and risk appetite decreases, it may retest the $0.5815 support level and the $0.6059 support level. If these support levels are broken, the decline may deepen.
If the 200 EMA (Green Line) and 50 EMA (Blue Line) remain above the $0.7851 level, the trend may change direction and test the $0.8380 and $0.9421 levels.
Supports: 0.6059 – 0.5815- 0.5661
Resistances: 0.7851 – 0.8380 – 0.9421
LEGAL NOTICE
The investment information, comments and recommendations contained in this document do not constitute investment advisory services. Investment advisory services are provided by authorized institutions on a personal basis, taking into account the risk and return preferences of individuals. The comments and recommendations contained in this document are of a general type. These recommendations may not be suitable for your financial situation and risk and return preferences. Therefore, making an investment decision based solely on the information contained in this document may not result in results that are in line with your expectations.
