
BTC/USDT
Last week, Israel’s escalating airstrikes against Iran in the Middle East raised regional tensions and took a new dimension with Iran’s retaliation. In the face of rising tensions in the region, US President Trump has called for reconciliation between the parties through diplomacy and mediation. Tensions in the region overshadowed the economic dialog between the US and China in London, which resulted in an agreement in principle, and became the focal point of global markets. On the crypto front, the GENIUS stablecoin bill made significant progress, awaiting a final vote on June 17. On the other hand, institutional investors’ interest in Bitcoin continued to strengthen. Leading companies such as Strategy, Metaplanet GameStop announced BTC purchases, while smaller companies such as ANAP and Smarter Web increased their reserves. In the new week, eyes will be on the developments in the Middle East, as well as the final vote on the Stablecoin law and the US Interest rate meeting in the data set.
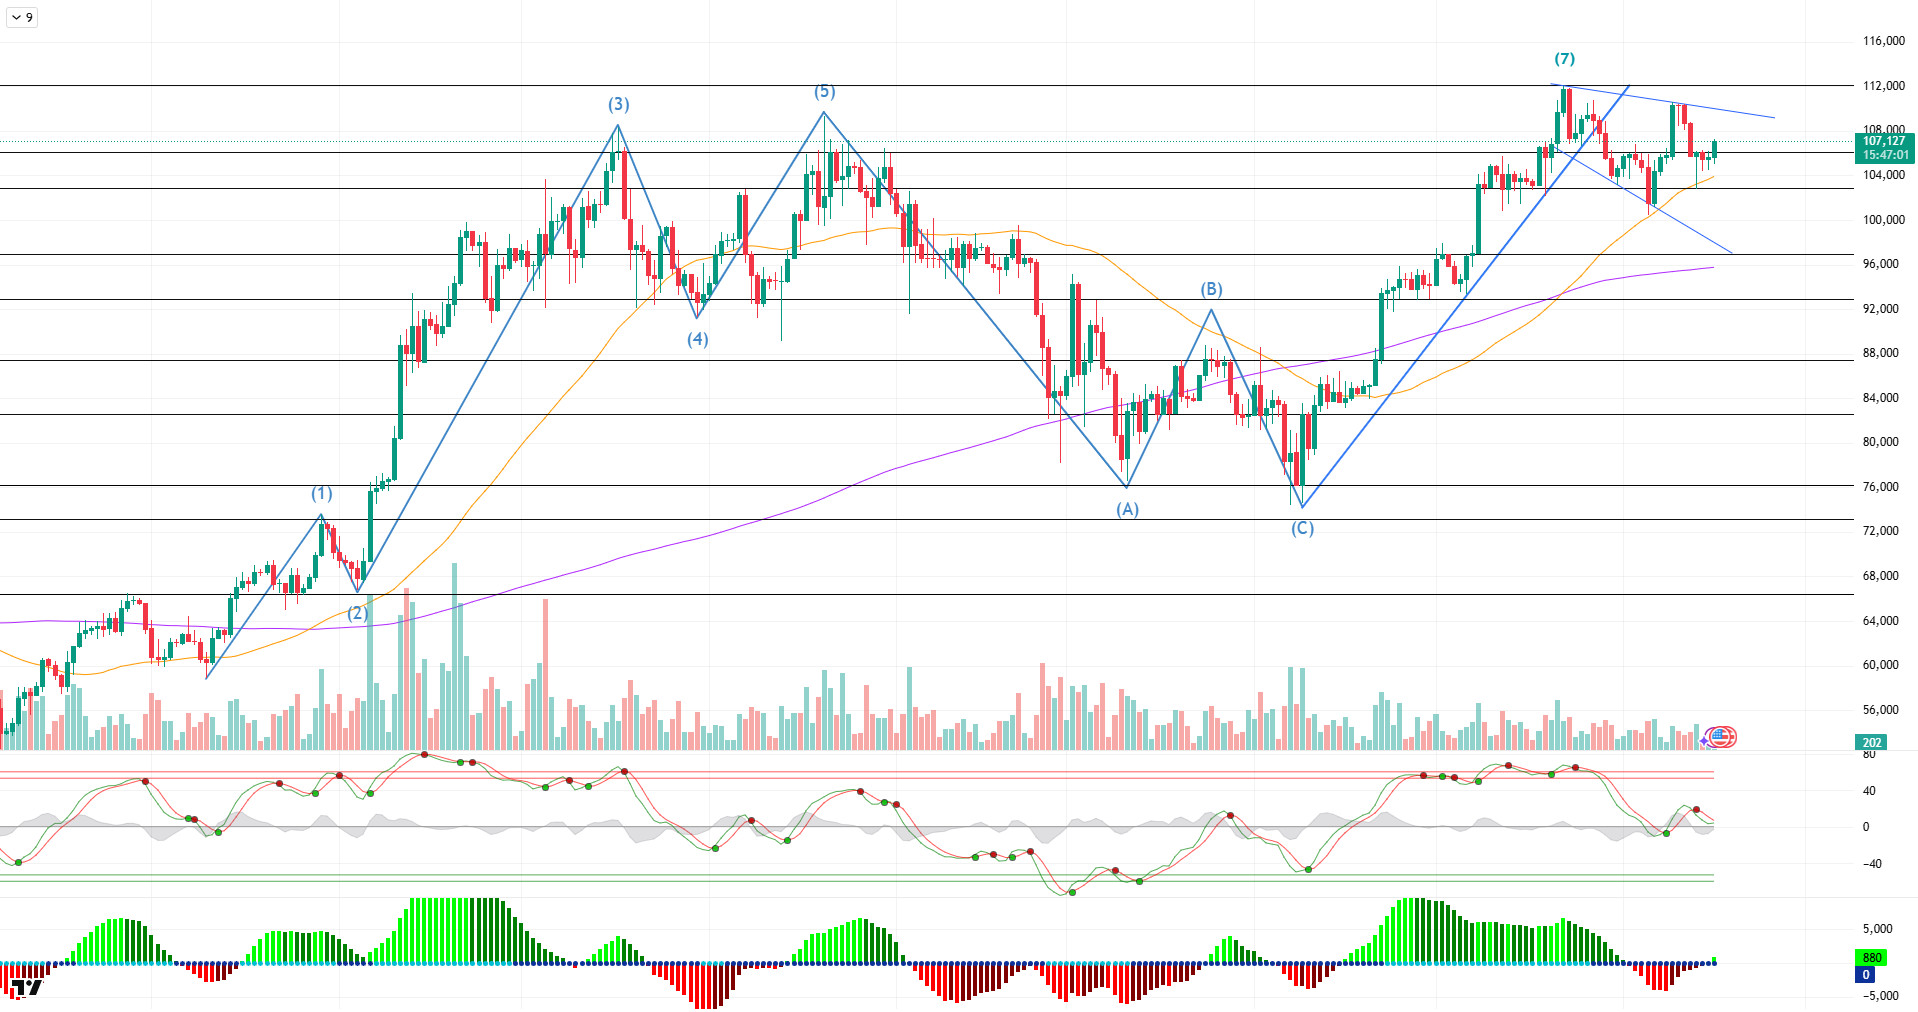
When we look at the daily technical outlook after all these developments, it is seen that BTC entered into a falling wedge pattern after the peak at the 7th point reached with the golden cross structure and declined within this structure. BTC, which started the week at 110,000 levels, recovered to 107,000 levels after falling to 102,600 during the week. With this move, BTC is set to close the week with a decline of about 2.90%.
Looking at the technical indicators, the wave trend oscillator’s sell signal at the mid-band of the channel has weakened and is close to generating a buy signal again. Likewise, the squeeze momentum indicator moved into positive territory, supporting the upward momentum of the price. On the moving averages, it is seen that the golden cross structure continues as the 50-day SMA crosses the 200-day SMA upwards, and the bullish structure is maintained in technical terms.
When the weekly liquidity data are analyzed, it is noteworthy that the sell positions opened at the ATH level are still accumulating, while the buy trades are concentrated in the 102,000 – 103,000 band with the recent decline.
Overall, the technical structure has laid a strong groundwork for an uptrend. Especially the 110,000 level, which is the upper band of the falling wedge pattern, stands out as the target zone in the short term. While liquidity data also supports this scenario, the possibility of retesting the ATH level gains strength in the continuation of the upward movement. However, the sustainability of this move will also depend on the support of fundamental developments. On the other hand, 105,000 level will be monitored as the first reference support point in a possible selling pressure.
Supports 105,000 – 103,000 – 101,400
Resistances 108,000 – 110,000 – 111,970
ETH/USDT
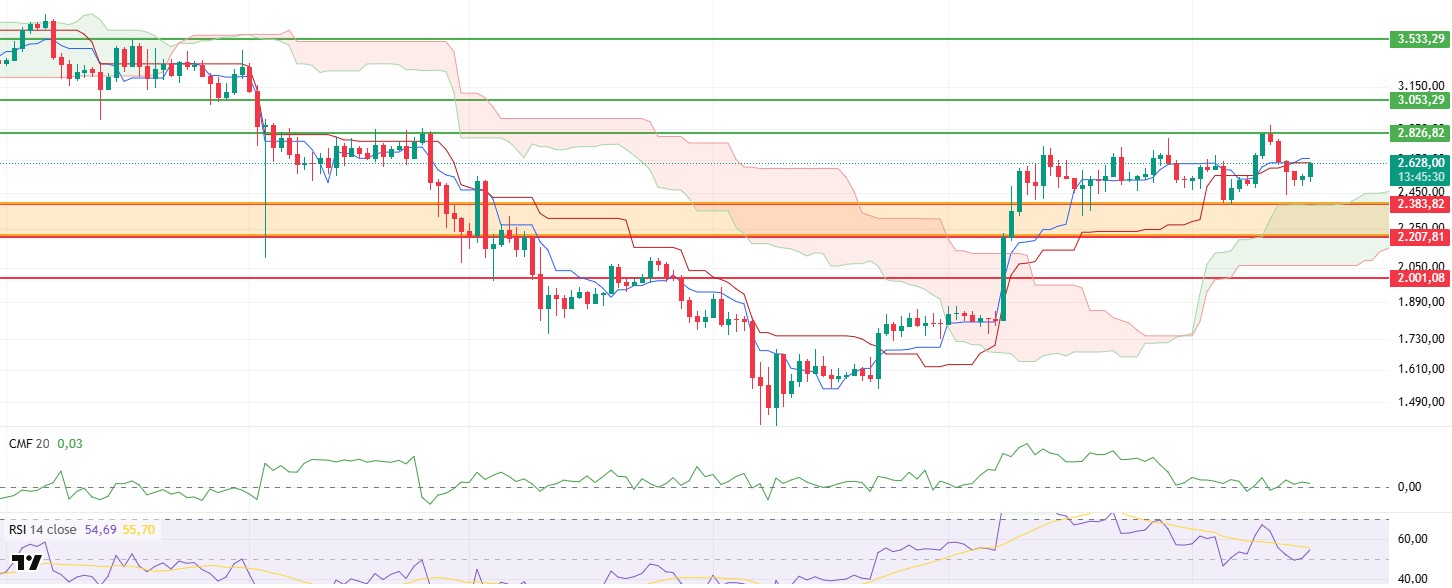
Last week, the ETH price managed to rise to the resistance zone at $2,826. However, it started to retreat with increasing selling pressure at this level. Increasing geopolitical tensions between Iran and Israel led to a decrease in risk appetite in the markets, which led to a deepening of the downward movement in the ETH price. The price fell as low as $2,435 during the week. However, after this decline, ETH, which entered the recovery process during the weekend, managed to advance to the kijun level in the Ichimoku indicator. In this process, some notable structural changes were observed in the on-chain data.
The Ethereum Fund Market Premium indicator moved back into negative territory after the sharp decline. Thus, the indicator reveals that investor sentiment has weakened in the short term as the price of Ethereum traded in the futures market has fallen below the spot market price. In parallel, the sharp decline in the long/short ratio indicates a significant increase in short positions in the futures market. While this data points to the possibility of a potential short squeeze in the market, there are still some structural signals that indicate that long-term confidence in Ethereum remains despite the decline. In particular, the fact that the total amount of locked assets (TVL) on the Liquid Staking Token (LST) protocols EIGEN and LIDO Finance continues to increase despite the bearish environment supports that investors remain positive in their medium and long-term outlook for Ethereum.
In terms of technical indicators, the Cumulative Volume Delta (CVD) indicator suggests that the price decline was mostly driven by futures, whereas spot markets experienced only limited selling pressure. This divergence, coupled with the funding rate’s shift back into slightly positive territory during the day, provides an important signal that the short-term positive momentum is re-establishing. This picture suggests that the price is on a healthy ground in the post-decline recovery process. At the same time, the fact that the Chaikin Money Flow (CMF) indicator remains in the positive zone and there is no significant liquidity outflow confirms this outlook and reveals that there is no deterioration in the overall structure of the market.
Although the Relative Strength Index (RSI) fell below the Based Moving Average line during the last downtrend, it has turned upwards again, holding above the 50 level. This move suggests that the rebound from the recent decline is not a reaction but a momentum-building rebound and is technically strong. This technical structure in the RSI confirms that the price is moving forward with the support of volume and momentum during the recovery process.
When the Ichimoku indicator is analyzed, the price is still above the kumo cloud, indicating that the medium and long-term positive trend is maintained. In addition, the fact that the tenkan level remains above the kijun level indicates a positive technical structure in the short term. However, in order for this scenario to remain valid, it is crucial for the price to sustain above both tenkan and kijun levels. If these thresholds are maintained, the positive scenario will gain more strength.
When all these technical and on-chain indicators are considered together, it seems likely that Ethereum will retest the $2,826 resistance level in the coming days, and if this level is broken, it may rise as high as $3,053. On the other hand, if the most important support zone, indicated by the orange zone on the chart, is lost, a breach of this support structure could lead to a trend reversal and the start of a new wave of selling on the price.
Supports 2,383 – 2, 207 – 2,001
Resistances 2,826 – 3,053 – 3,533
XRP/USDT
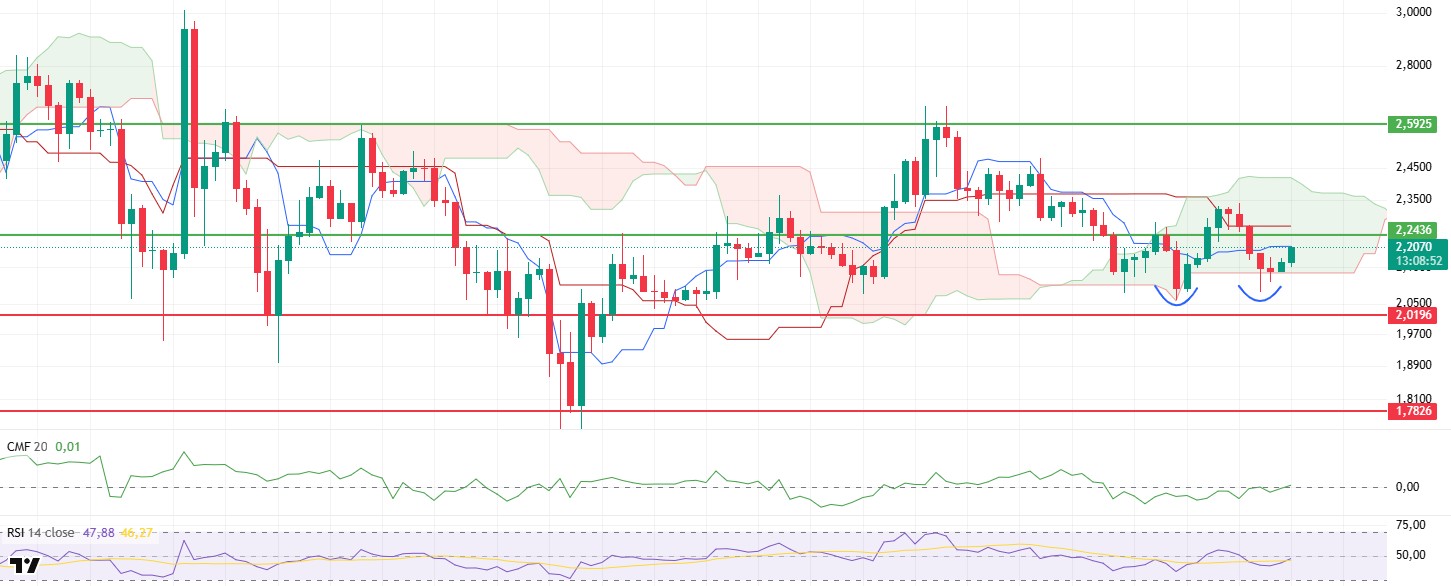
XRP, with the retracement process that started last week at $2.33 levels, fell below the sand cloud, which is technically an important threshold, and fell as low as $2.08. However, as buyers stepped in in this region, the price gave signs of recovery without closing daily under the kumo cloud. With the increase in buying over the weekend, XRP managed to exceed the $2.20 level and exhibited a short-term upward trend.
When the chart structure is analyzed, it is seen that the double bottom pattern has started to form with the price testing similar lows twice during the decline process. If this structure is completed, XRP could potentially start a new bullish wave. One of the key indicators supporting this technical formation is the return of the Chaikin Money Flow (CMF) indicator to positive territory. This indicates that liquidity is re-entering the market and buyers are gaining strength. With CMF moving into positive territory, it is clear that a structurally upward trend is gaining ground.
The RSI indicator, which accompanies price movements, is also showing a significant recovery in this process. The RSI broke the based moving average (MA) line to the upside and moved towards the 50 level, confirming that the uptrend is a healthy move supported by momentum. This can be considered as a critical signal that buyers are moving the price up while at the same time gaining confidence in the market.
Considering the Ichimoku indicator, the upward direction of the price with support from the lower band of the kumo cloud indicates a positive technical outlook in the short term. In this process, it is a very positive development for the price to rise above the tenkan level and persist in this region so that the rise can continue. In the current structure, it seems technically possible for XRP to realize a gradual rise up to $2.41, the upper band of the kumo cloud.
When the general outlook is evaluated, the recovery signals in technical indicators and the resistance of the price at critical levels increase the possibility of a continuation of the upward movement during the week. However, for this scenario to remain valid, it is of great importance that the price does not lose the lower band of the kumo cloud. Otherwise, if the price shows weakness again, there may be a risk of a pullback towards the main support zone at the $2.01 level. Therefore, although the short-term technical structure is positive, the maintenance of support levels will be decisive for the validity of the scenario.
Supports 2.0196 – 1.7826 – 1.6140
Resistances 2.2436 – 2.5925- 3.1969
SOL/USDT
Last week in the Solana ecosystem;
- Canary Marinade Solana ETF registered in Delaware.
- SOL Strategies announced that it has filed a preliminary prospectus to raise up to $1 billion to expand its investments in the Solana blockchain ecosystem.
- The SEC has asked potential Solana ETF issuers to update their S-1s.
- Allnodes is launching bare-metal servers for Solana validators and builders.
- The SEC blocked DeFi Development’s $1 billion Solana acquisition plan due to document issues.
- Publicly traded DeFi Development Corp. has signed an agreement for a $5 billion equity credit line. The firm will use the proceeds from the issuance and sale of its common shares to acquire SOL.
- Invesco has filed for the Solana ETF. Bitwise and Canary added staking to Solana ETF S-1 amendments. Fidelity Spot filed a Solana ETF S-1 application. Franklin Templeton, Galaxy Digital and VanEck submitted updated S-1 documents.
- Grayscale also presented an updated document and announced a 2.5% fee for potential funds.
- Earlier this week, the US SEC contacted several potential Solana ETFs.
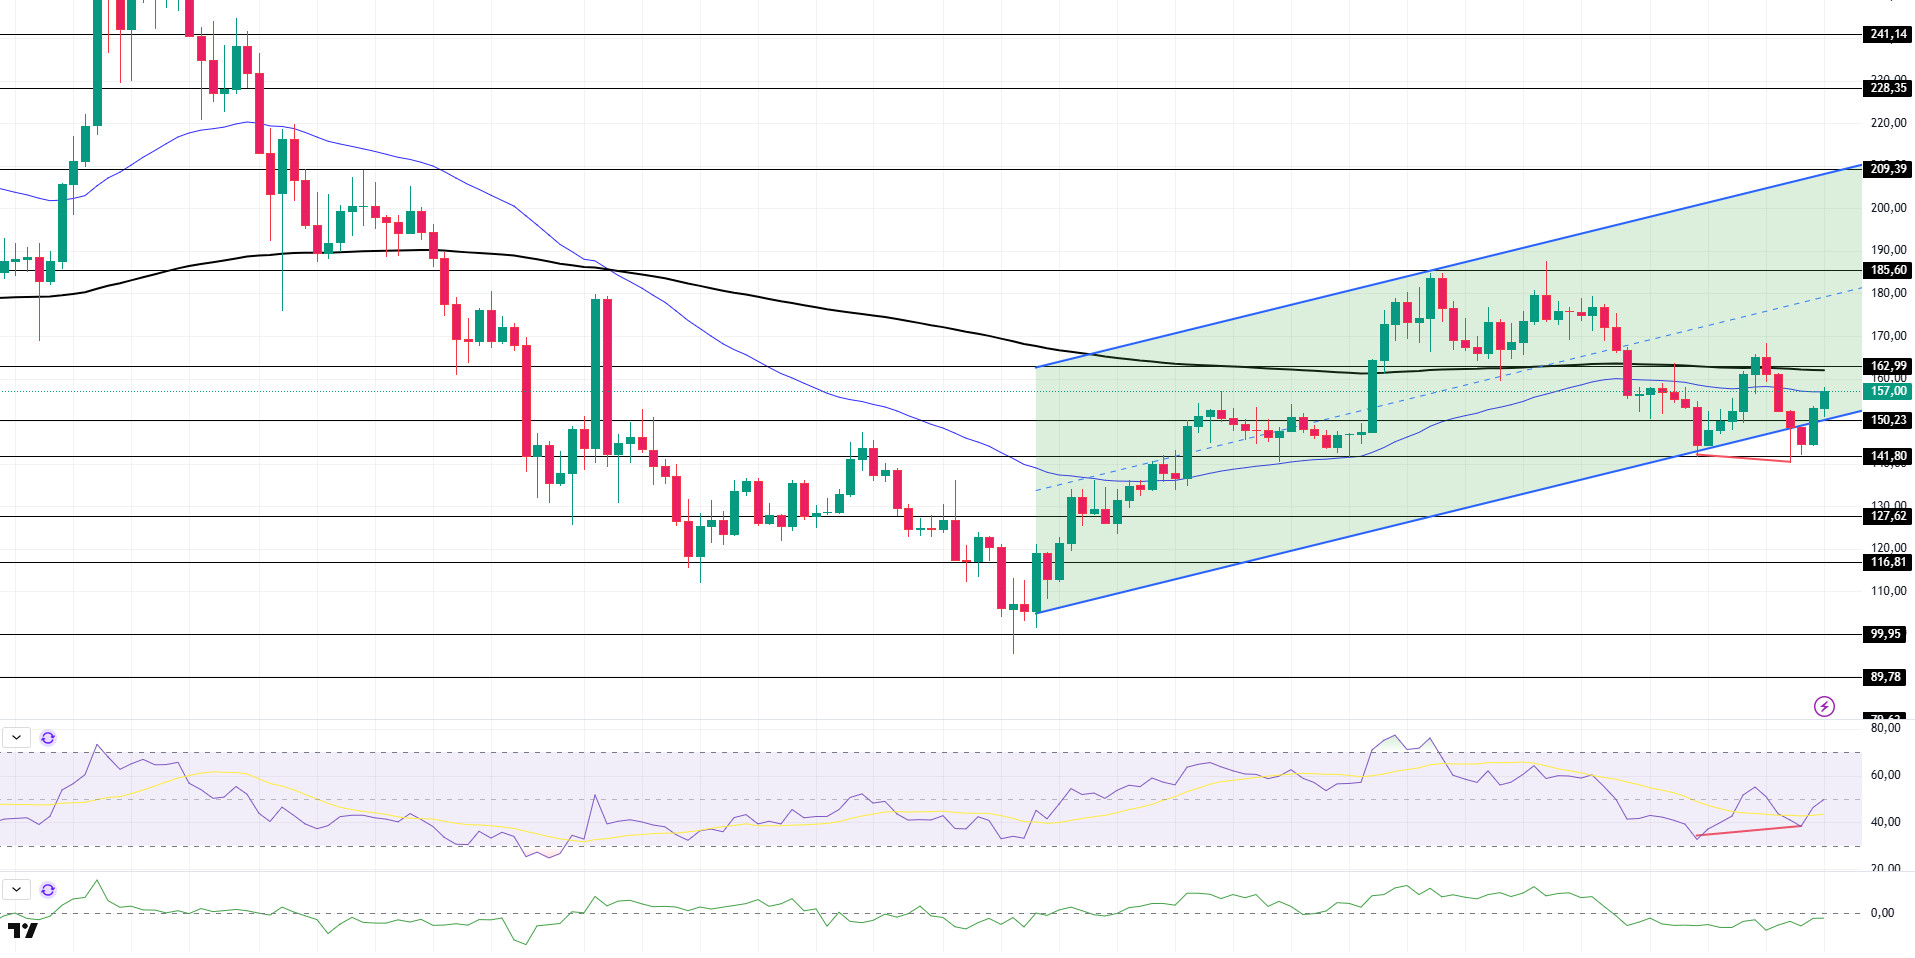
SOL price moved sideways on the daily chart. Starting on April 9, the asset broke the bottom of the uptrend that started on April 9 to the downside and started moving inside the uptrend. After testing the 200 EMA (Black Line) as resistance, the price failed to break it and moved lower. It then tested the trend’s strong support at $141.80, from where it accelerated to rally about 10.00% and is currently testing the 50 EMA (Blue Line) as resistance. If it breaks here, the 200 EMA moving average should be followed as resistance.
The asset is trading below the 50 EMA and the 200 EMA, which signals that the asset is bearish. Moreover, the fact that the 50 EMA continues to remain below the 200 EMA indicates that a “death cross” continues to form from a technical perspective. This suggests continued bearish potential in the medium term. RSI (14) rose from the oversold zone to the neutral level. In addition; bullish divergence should be followed. This may bring bullishness. Chaikin Money Flow (CMF-20) remained in the negative territory; a decline in money inflows may push the CMF-20 indicator deeper into the negative territory. If macroeconomic data remains positive and ecosystem developments remain positive, the first major resistance point at $185.60 could be retested. Conversely, in case of possible negative news flow or deterioration in macro data, the $ 141.80 level can be monitored as a potential buying opportunity.
Supports 150.23 – 141.80 – 127.62
Resistances 162.99 – 185.60 – 209.39
DOGE/USDT
Dogecoin has fluctuated this week due to Elon Musk’s dispute with President Trump. The coin, which fell during the dispute, showed signs of a slight recovery after Elon Musk apologized, but continued to lose value, affected by the crypto market’s decline. The SEC began reviewing the Bitwise Dogecoin ETF application.
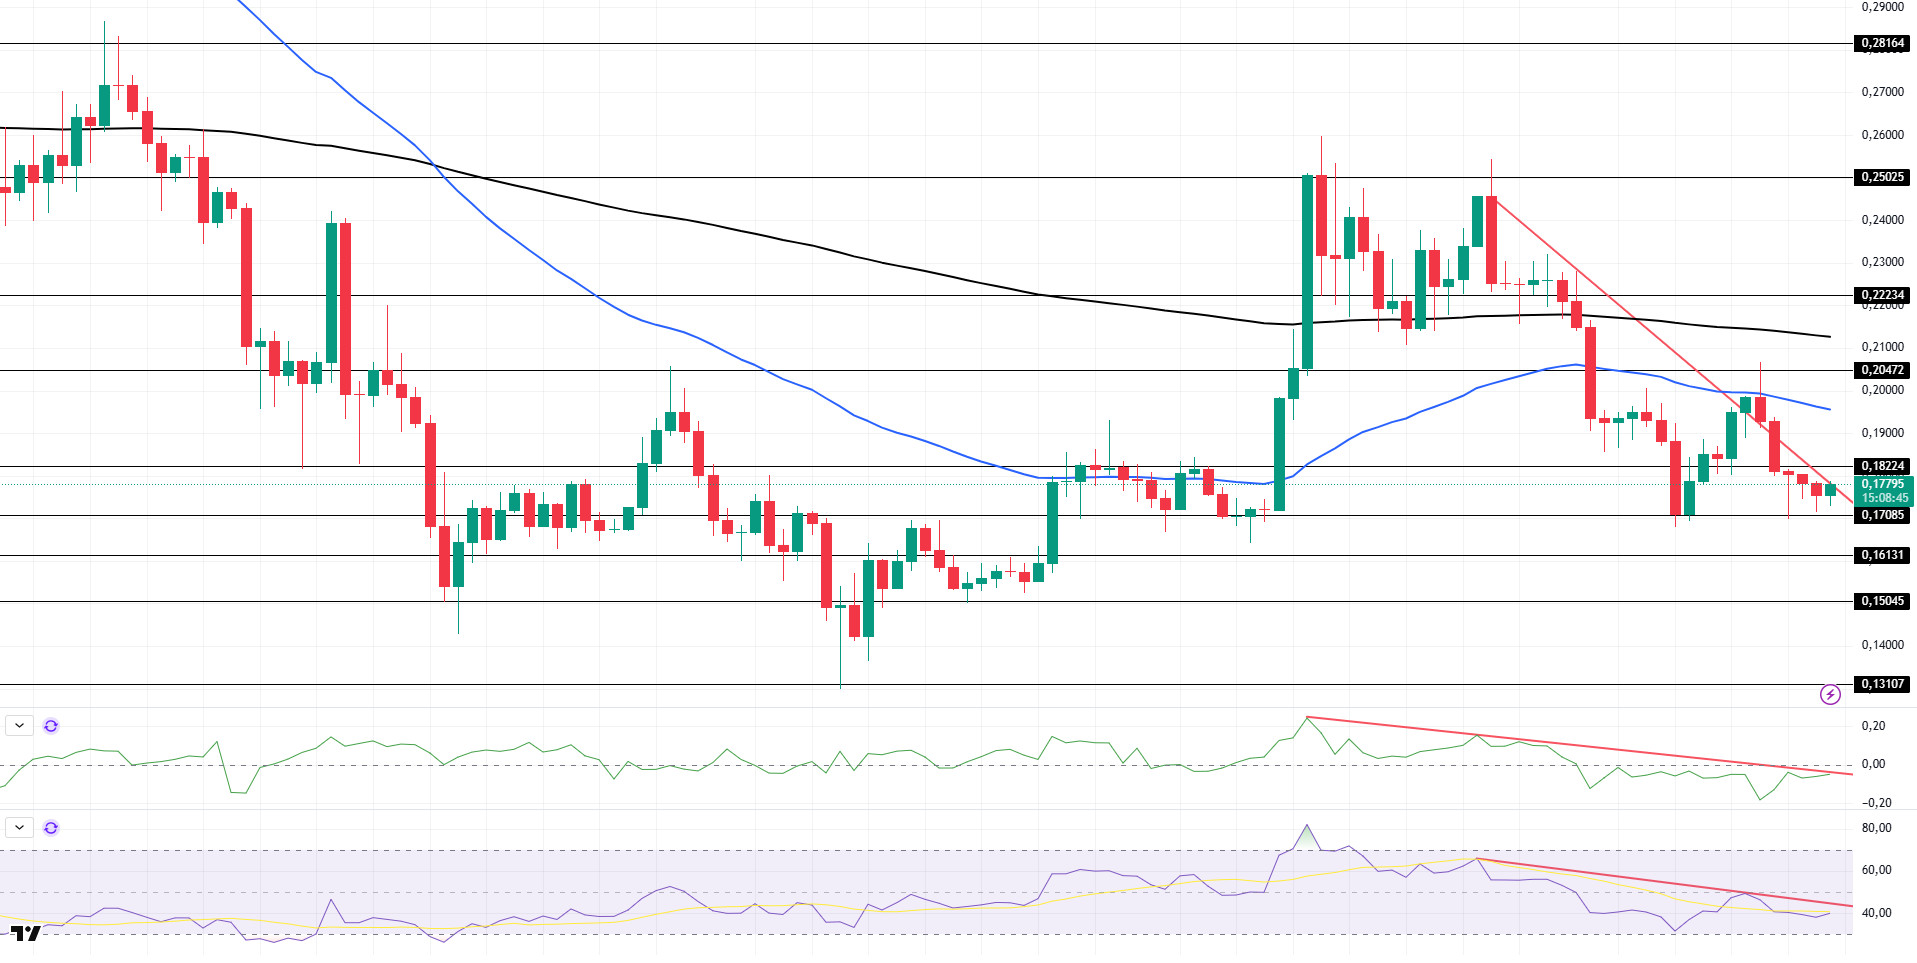
DOGE has declined on the daily chart since last week. After breaking the downtrend that started on May 23 to the upside with a fake breakout, the price deepened its retreat with resistance from the 50 EMA (Blue Line) and failed to stay above the downtrend. It is currently testing the $0.17085 level, which is a strong support. If it breaks this level downwards, the support level of $ 0.16131 may be triggered. On the other hand, the 50 EMA continued to remain below the 200 EMA (Black Line), suggesting that the death cross pattern remains valid. This indicates that bearish pressure may continue in the medium term. Chaikin Money Flow (CMF-20) indicator remained in negative territory. In addition, it remains below the downtrend that started on May 10, but is currently testing it as resistance. If the decline in money inflows continues, it may reach the depths of the negative zone. When we look at the Relative Strength Index (RSI-14) indicator, it continued to be in the negative zone and remains below the downtrend that has been going on since May 22. If it breaks upwards, the 50 EMA moving average could be tested. If the retracements continue, the 0.16131-dollar level should be followed. In case of macroeconomic risks or negative news from the ecosystem, the $0.16131 level can be monitored as a strong support. On the other hand, if the upward movement gains strength, $0.20472 stands out as the first strong resistance level.
Supports: 0.17085 – 0.16131 – 0.15045
Resistances: 0.18224 – 0.20472 – 0.22234
TRX/USDT
Last week, the first minting of USD1, the stablecoin of Trump-backed World Liberty Finance, took place on the TRON blockchain. This development was announced by TRON founder Justin Sun as ‘a small step for USD1 and a giant leap for the stablecoin ecosystem’. With the addition of USD1, Tron has further increased stablecoin liquidity and expanded its capacity to support DeFi protocols, exchange integrations, and decentralized financial products. In addition, with the minting of another 1 billion USDT on the Tron network, the total USDT supply on the network has reached $78.7 billion. These developments reinforced Tron’s leadership in the stablecoin ecosystem.
During the week of June 9-15, 2025, a total of 47.6 million TRX were burned on the TRON network. This process continues to put deflationary pressure on TRX by reducing the supply in circulation.
During the week, the TRON network generated record revenues totaling $129.9 million, maintaining its position as the highest revenue-generating ecosystem among all blockchain networks. This revenue level reflects the strong performance of key network efficiency indicators such as transaction volume, total locked assets (TVL), number of daily active addresses, and user interaction on DeFi protocols.
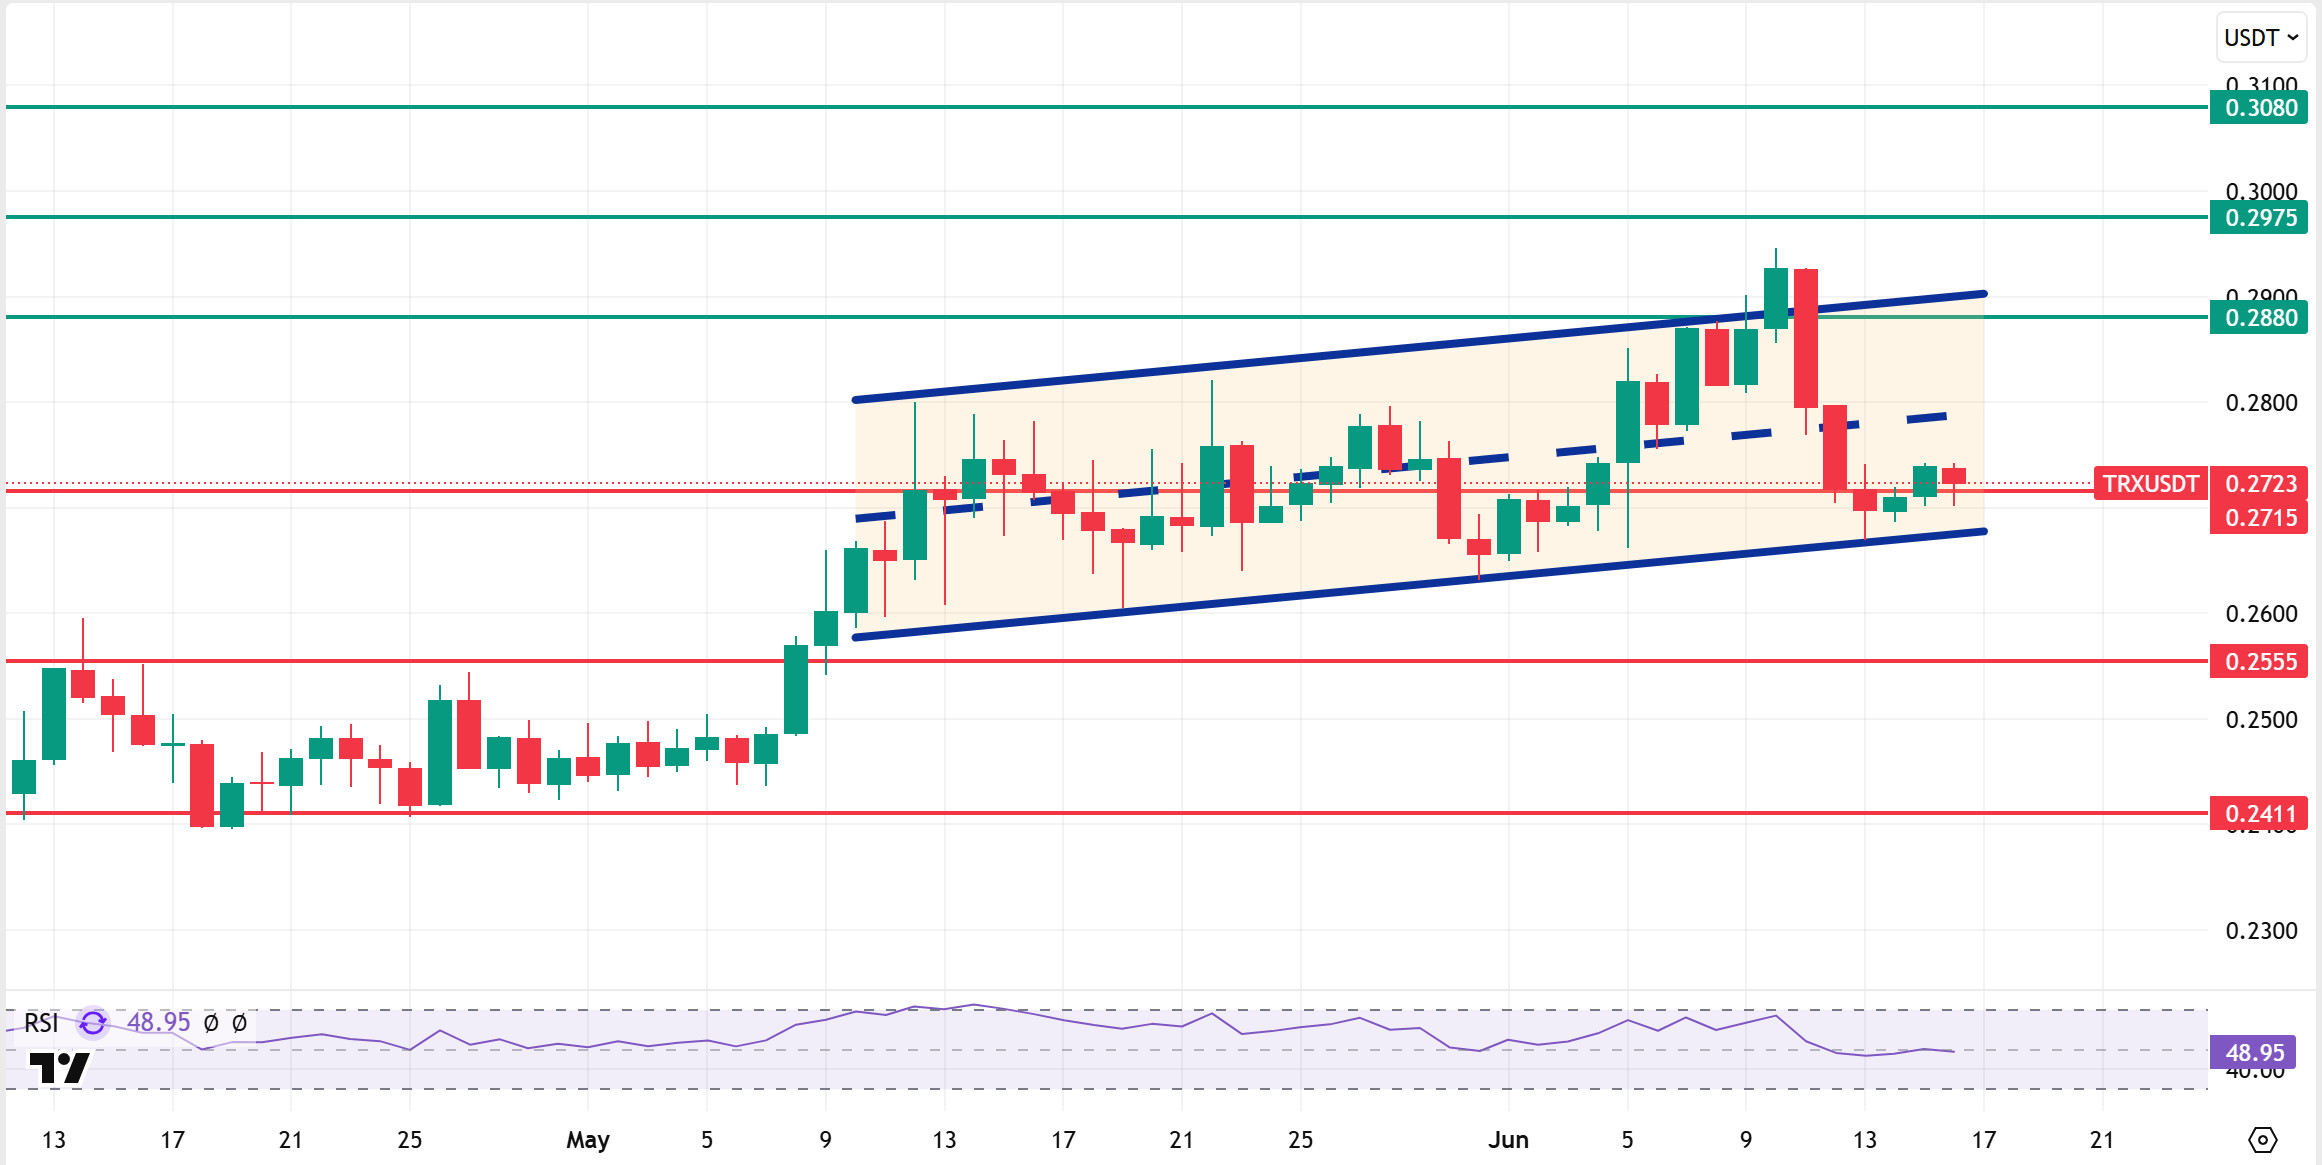
TRX, which started last week at 0.2817, fell by about 3% during the week and closed the week at 0.2739. TRX, which is currently trading at 0.2723, continues its movement within the bullish channel on the daily chart and is in the lower band of the channel. With a Relative Strength Index (RSI) value of 48, TRX price can be expected to rise from its current level and move towards the middle and upper band of the channel. In such a case, it is expected to test the 0.2880 resistance. If it closes daily above the 0.2880 resistance, it may continue to rise and may want to test the 0.2975 resistance. If it cannot make a daily close above the 0.2880 resistance, it may decline with possible selling pressure that may occur. In such a case, it may test the supports of 0.2715 and 0.2555 respectively. On the daily chart, 0.2411 is an important support and as long as it remains above it, the bullish demand can be expected to continue. If this support is broken, selling pressure may increase.
Supports 0.2715 – 0.2555 – 0.2411
Resistances 0.2880 – 0.2975 – 0.3080
AVAX/USDT
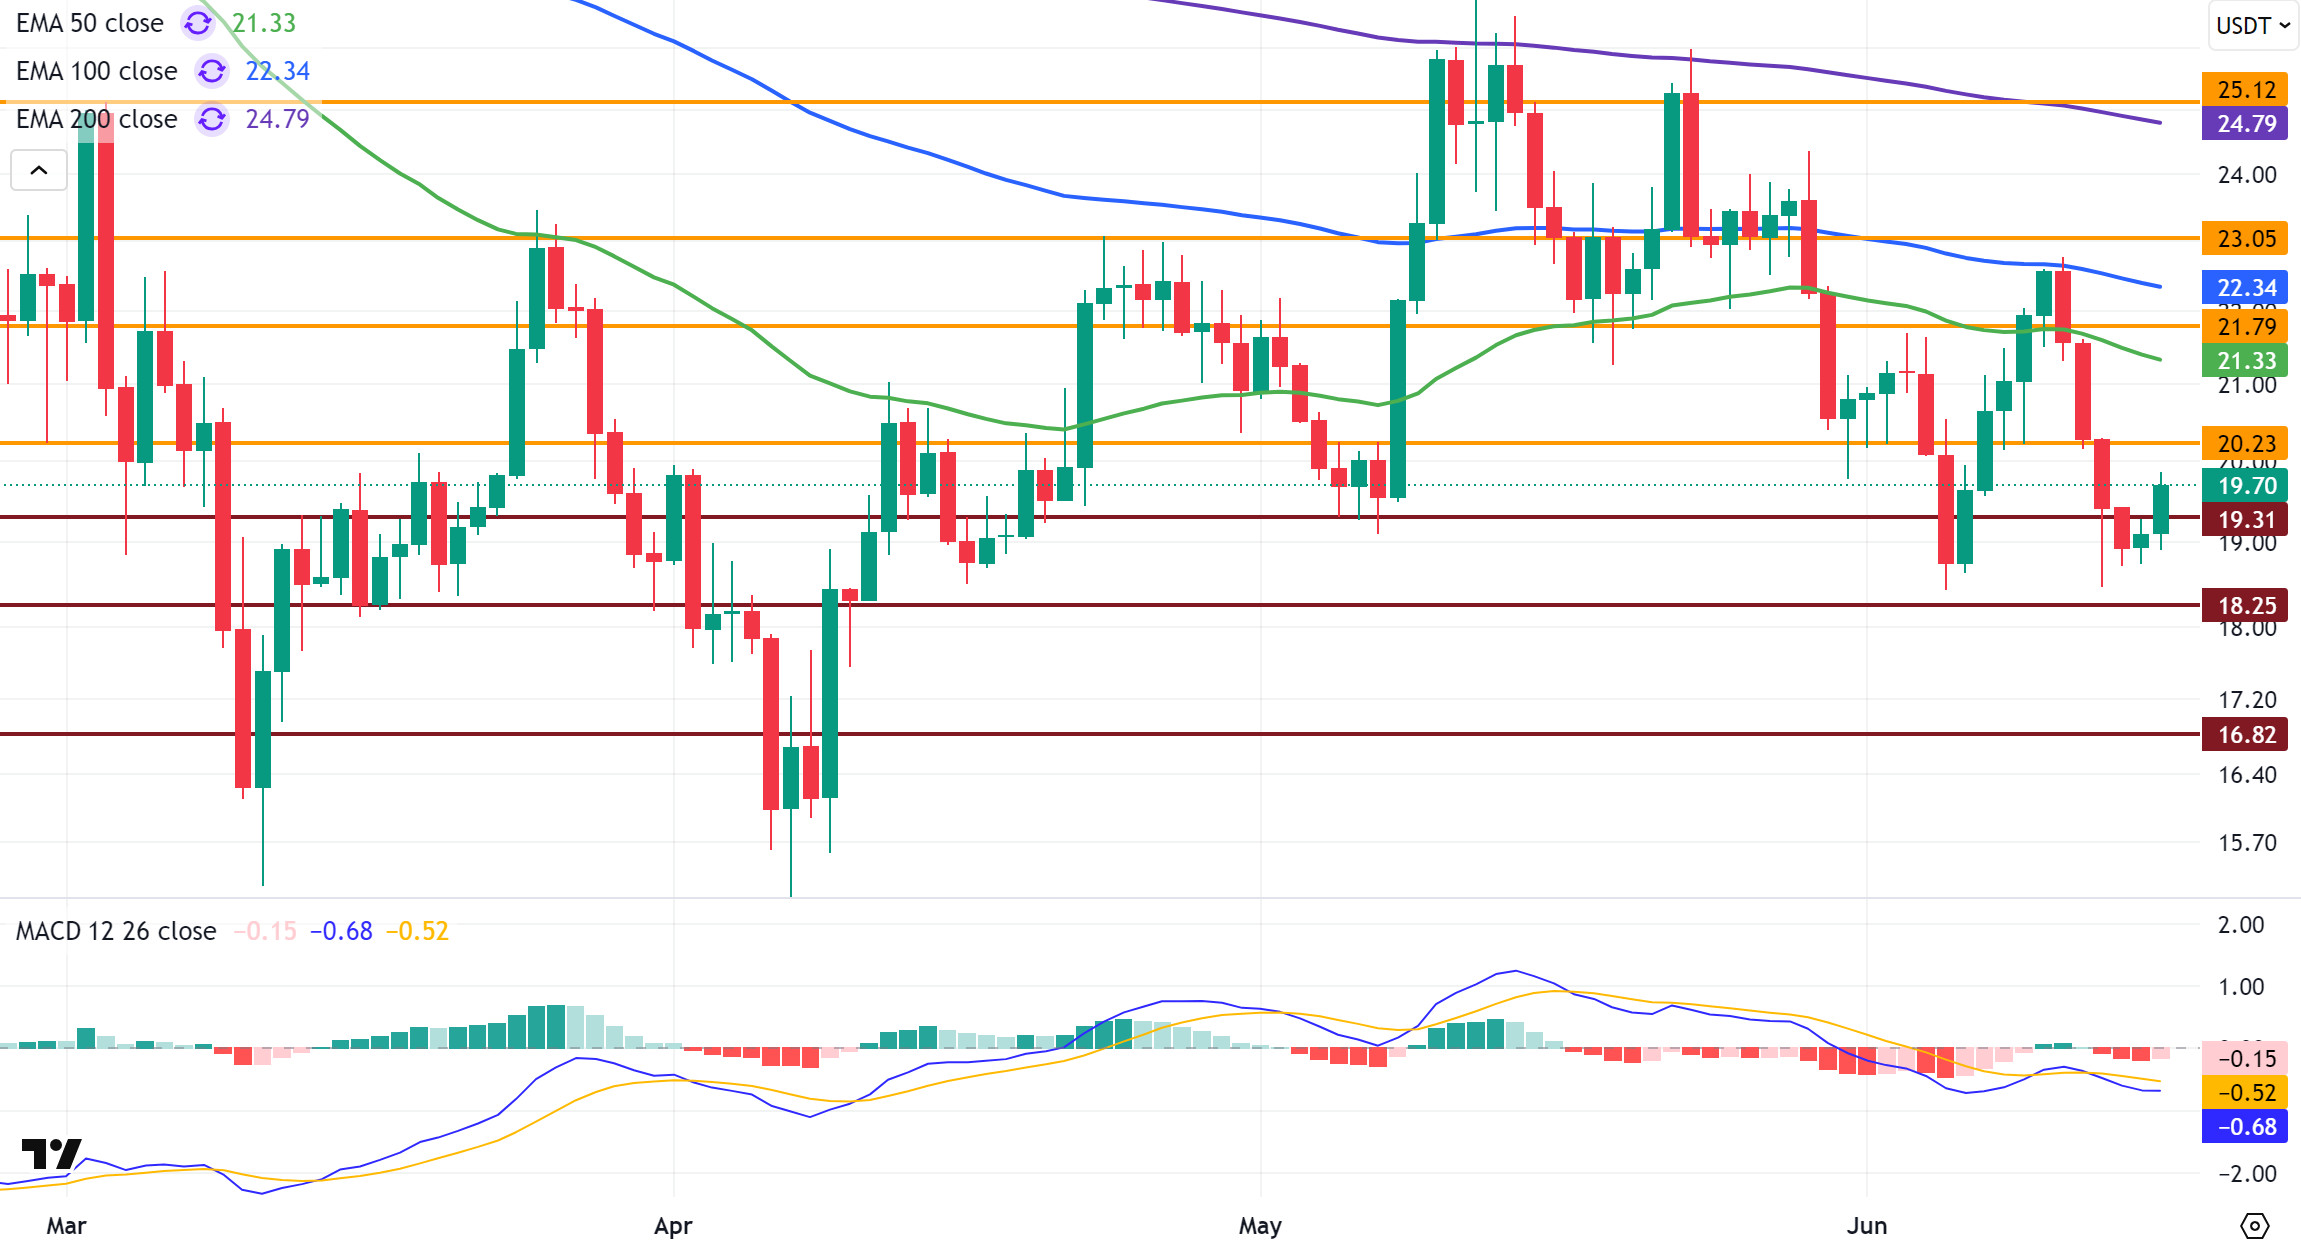
AVAX, which started last week at $ 21.03, lost approximately 9.2% during the week and closed at $ 19.09. AVAX, which broke the 50-period Exponential Moving Average (EMA50) level upwards with the rise in the early days of last week, continued its movement and tested the EMA100 level. However, at this point, it faced increasing selling pressure and failed to exceed the EMA100 level. AVAX, which fell below the EMA50 level again, caused sales to accelerate with this breakout. In addition, rising geopolitical tensions in the Middle East following Israel’s airstrikes against Iran reduced global risk appetite. This led to sharp sales in major coins in the crypto market, deepening the decline in AVAX and falling to $ 18.44. AVAX, which gave signs of recovery, albeit limited, on the last day of last week, started the new week with an increase.
On the daily chart, the Moving Average Convergence/Divergence (MACD) indicator continues to trade below the signal line and in negative territory. Although the MACD line crossed the signal line during the rise at the opening of last week, the rise could not be permanent as the positive momentum remained weak. AVAX is still technically trading under pressure. In the current outlook, the fact that it is below the EMA levels and the loss of momentum in MACD indicates that downside risks are at the forefront in the short term. Strong momentum formation is critical for a permanent upward movement.
If AVAX, which started the new week with a rise, breaks the EMA50 level again with strong purchases and positive news flow, the first target is the $ 21.79 level, followed by the EMA100 and then the $ 23.05 level. In case of persistence above these levels, the EMA200 and $ 25.12 levels will come to the agenda. Of course, here, especially the persistence above the EMA50 is critical in terms of activating possible recovery scenarios. On the contrary, if the persistence below the EMA50 continues and daily closures below the $ 20.23 level are experienced, the rise may give way to a decline. In a bearish scenario, $ 19.31 and then $ 18.25 levels come to the fore. In case of a close below these levels, the decline may deepen further in weakening market conditions and the decline may continue down to $ 16.82.
(EMA50: Green Line , EMA100: Blue Line , EMA200: Purple Line)
Supports 19.31 – 18.25 – 16.82
Resistances 20.23 – 21.79 – 23.05
SHIB/USDT
This week, the Shiba Inu ecosystem was characterized by highlights in terms of supply dynamics and on-chain activity. In particular, the sharp increase in the burn rate and large wallet movements signaled a restructuring in the internal structure of the network. In the last 24 hours, the burn rate increased by an extraordinary 3194% and a total of 521.6 million SHIBs were removed from circulation. Most of these transactions were carried out by a small number of wallets. Some addresses sent hundreds of millions of SHIBs to burn addresses at once. This development shows that the community’s will to reduce the supply continues. However, given that the total supply is over 589 trillion, such burns need to be spread out to have a long-term impact. The sudden jump in on-chain volumes was another point of attention. Especially the increase in high-dollar transactions shows that large wallets have become active again and carry a significant amount of SHIB. Transaction volumes reaching the trillion level strengthen the possibility of strategic repositioning in these wallets. Such activity is often interpreted as a precursor to long-term planning and upcoming structural steps. On the ecosystem side, the Shiba Inu infrastructure entered a new phase this week. The platform called Shib Rollups was launched in beta. Thanks to this new structure, developers can create customizable Layer 2 blockchains on Shibarium. Thanks to the intermediate layer called Shib Alpha Layer, different rollup structures work on a single unified system. This technology offers both high processing capacity and a simplified user experience. This step reinforces Shiba Inu’s goal of becoming not only a community coin, but also a player offering scalable blockchain infrastructure.
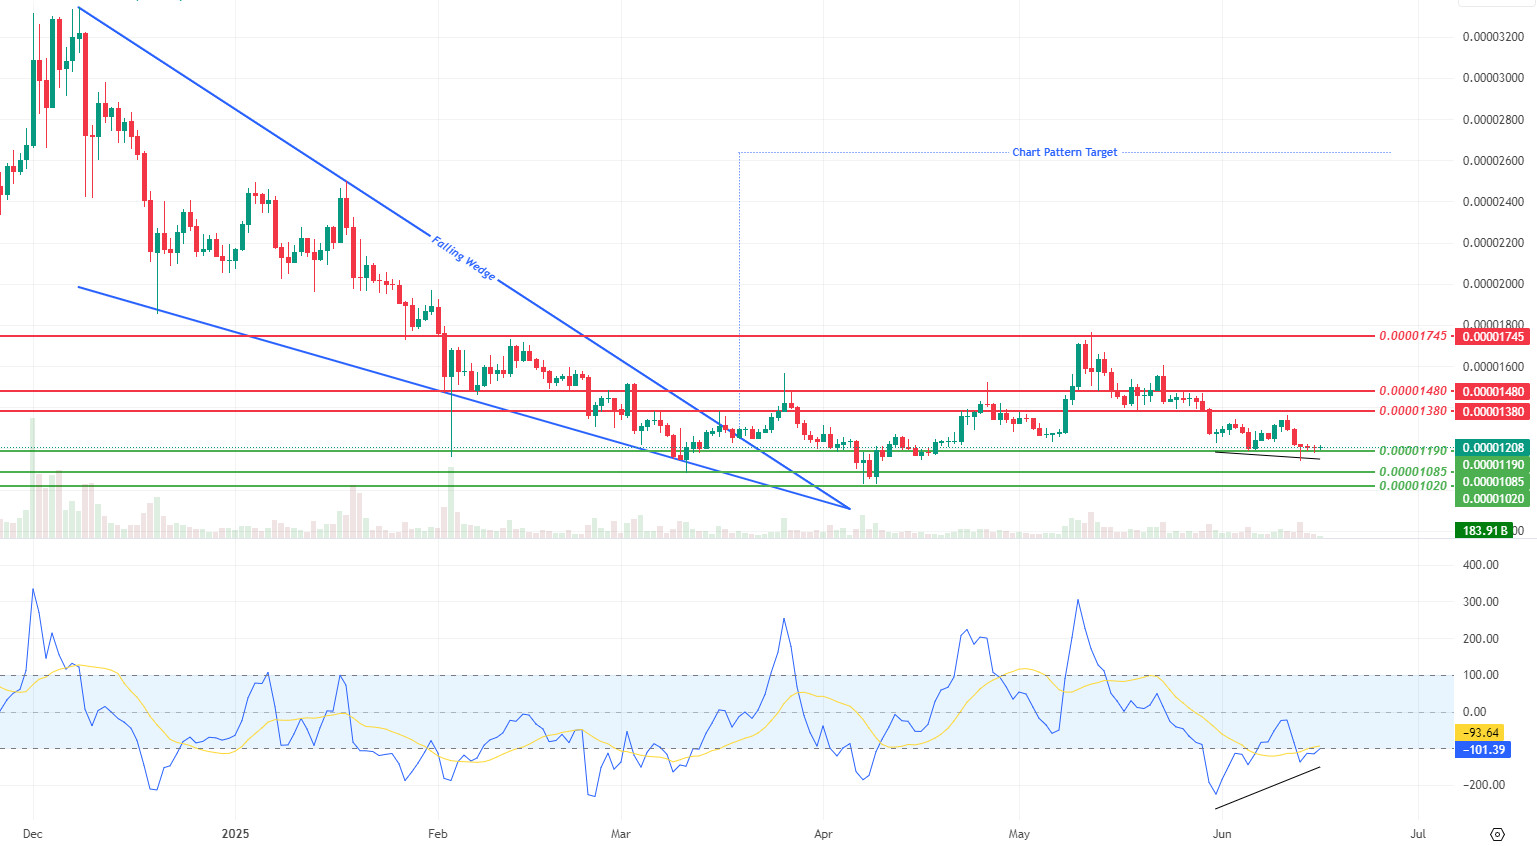
This week, Shiba Inu price action showed a significant decline and volume decrease. After breaking down the support level at $0.00001230, the price rebounded from $0.00001190 and stabilized around $0.00001200. The decline in trading volume indicates that market participants are indecisive and have not yet determined a strong direction. The narrowing of volatility, on the other hand, suggests that the price is moving in the squeeze zone and raises the possibility of an important breakout for the upcoming period. The ongoing positive mismatch (Black Line) on the Commodity Channel Index (CCI) oscillator offers a positive sign that buyers may gain momentum despite the price decline. This could strengthen the price’s recovery potential in the short term and increase the chances of the price initiating a move towards the first resistance point at $0.00001380. However, the weak trading volume suggests that one should be cautious about the sustainability of this uptrend. On the other hand, if the price slips below the $0.00001190 support, the selling pressure may increase and the downtrend may continue. In this scenario, a move towards $0.00001085 and then $0.00001020 supports can be expected.
Supports 0.00001190 – 0.00001085 – 0.00001020
Resistances 0.00001380 – 0.00001480 – 0.00001745
LTC/USDT
Litecoin (LTC) closed last week with a drop of 1.01, marking a four-week negative streak. It started the new week at $86.30. LTC, which also lost 0.85% against Bitcoin in the same period, has a market capitalization of approximately $6.63 billion and maintains its 21st place in the crypto market. This shows that Litecoin is keeping pace with the general market movements and is not resisting the downtrend of the market. On the futures side, there was a $2 million increase in open positions compared to last week, bringing the total open interest to $264 million. Funding rates remain positive.
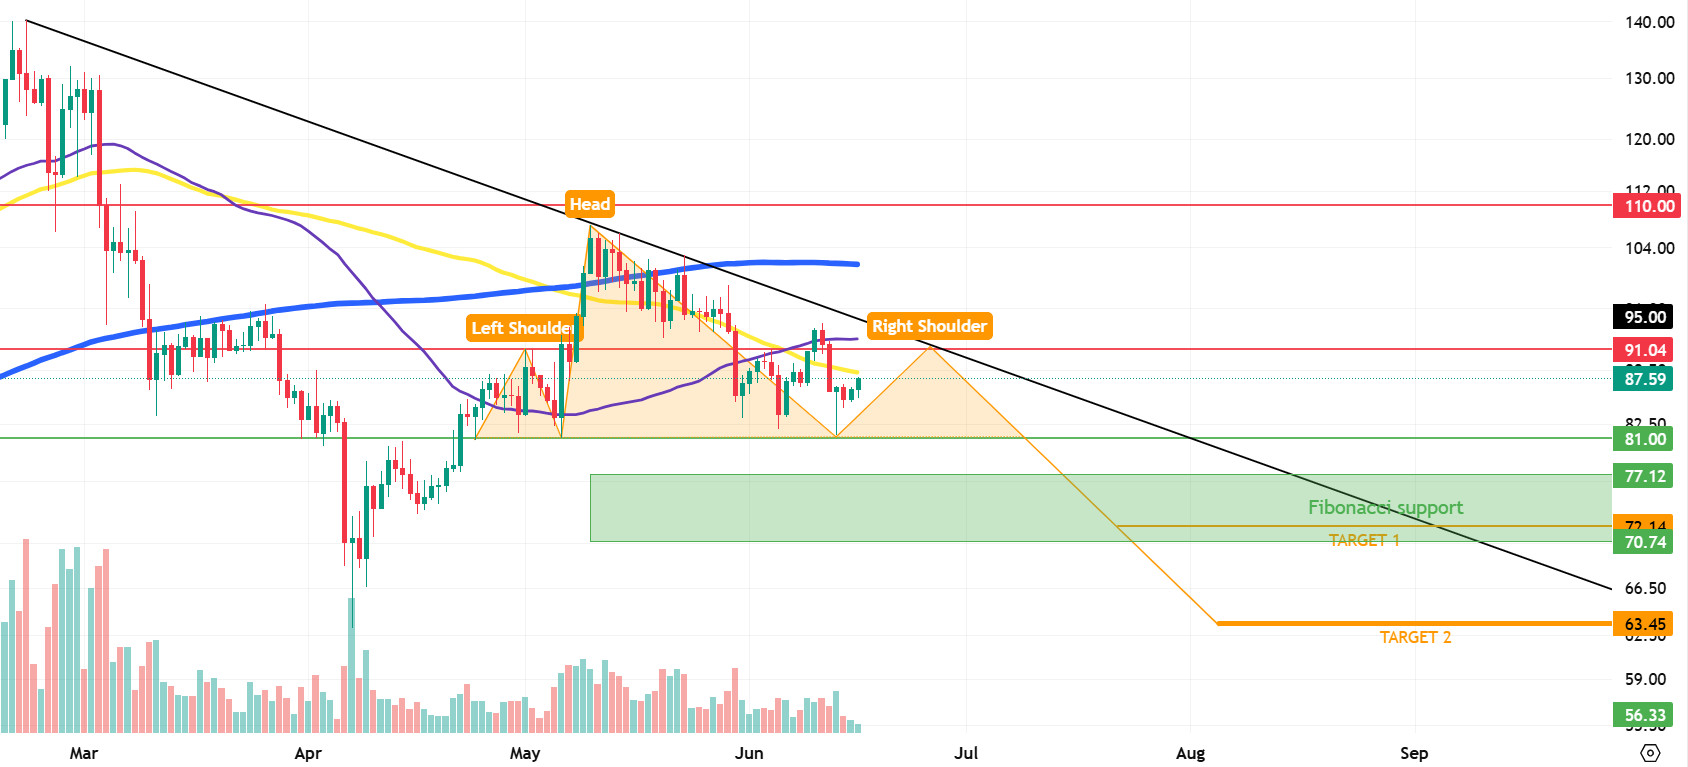
As of this week, Litecoin is trading below its 50-period moving average (purple), 100-period moving average (yellow) and 200-period moving average (blue). This technical structure suggests that the price remains under pressure and upside may remain limited. At the same time, a potential Head and Shoulders – Shoulder Head and Shoulders (H&S) pattern is forming (orange formation). For this pattern to be completed, the price needs to break the 81.00 level downwards first. If the price succumbs to the pressure, the first stop will be 72.14 followed by 63.45. These levels can also be considered as support as they will be potential profit-taking zones for short traders. There is also an important Fibonacci support zone (Green Zone) between 72.12-70.74. Therefore, while the scenario is more likely to reach the first target, the second target may be more likely to be unrealized.
On the upside, the first resistance level is 91.04, which is determined by the horizontal red line. Subsequently, in case of an upside break of the falling trend line (black), the targets in the bearish scenario are no longer valid and only the Fibonacci support level remains. The falling trendline, which is currently crossing at 95.00, is located between the 100 and 200-period averages. This makes an upside breakout more challenging. If the upward movement continues, selling pressure can be expected to intensify at 110.00.
Resistances 91.04 – 95.00 – 110.00
Supports 81.00 – 72.14 – 63.45
LINK/USDT
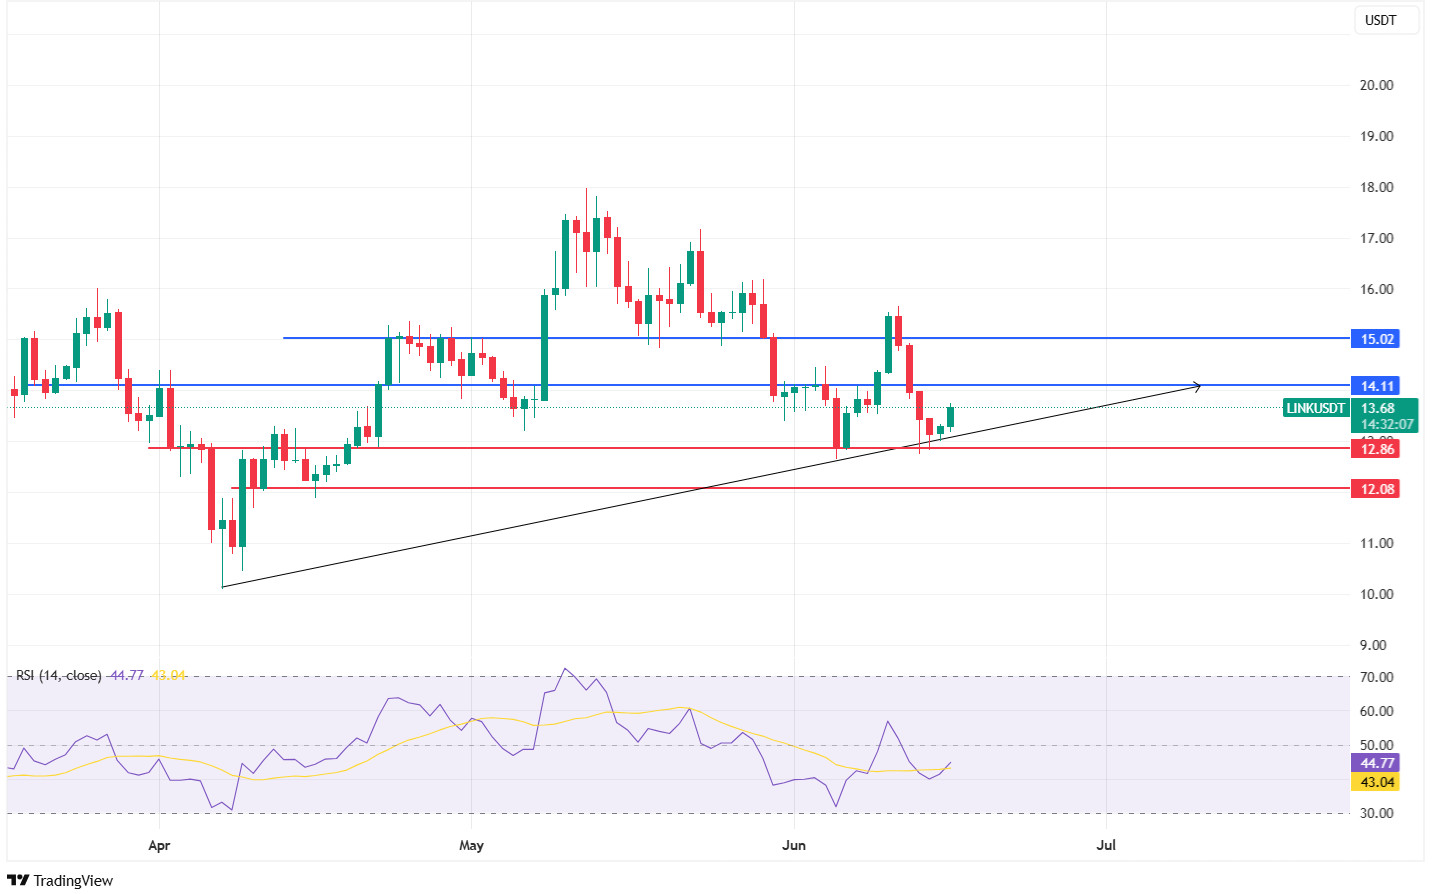
LINK continues to maintain its strong stance in line with the uptrend we mentioned last week and with the reaction it received from the $ 12.86 level, which stands out as a horizontal support line. Despite the negative market pressure due to the increasing political and geopolitical tensions in recent days, LINK’s failure to sag below the specified support level can be interpreted as a desire for a rapid recovery in the coming period.
In this process, the price fluctuated within the band range, which did not cause a significant change in the technical outlook compared to last week. Therefore, the main support level to be followed throughout this week is still $12.86. On the other hand, the $14.11 level stands out as a critical resistance point for the upward movement to gain momentum. In terms of technical indicators, the Relative Strength Index (RSI) is moving upwards again and approaching the positive zone. The fact that the RSI’s 50 level and the $ 14.11 resistance almost overlap indicates that horizontal price movements may be seen in this region. However, the strength from the uptrend from the past and the increase in demand that may occur with the decrease in geopolitical risks may trigger the price to decouple positively from this region.
Supports 12.86 – 12.08 – 11.50
Resistances 14.11 – 15.02 – 15.37
BNB/USDT
This week in the BNB ecosystem, RESOLV, HOME and LAYER projects were listed on Launchpool. These listings are expected to have an overall positive impact on the BNB price as they increase the demand for BNB used in transaction fees and reduce the circulating supply as users stake BNB.
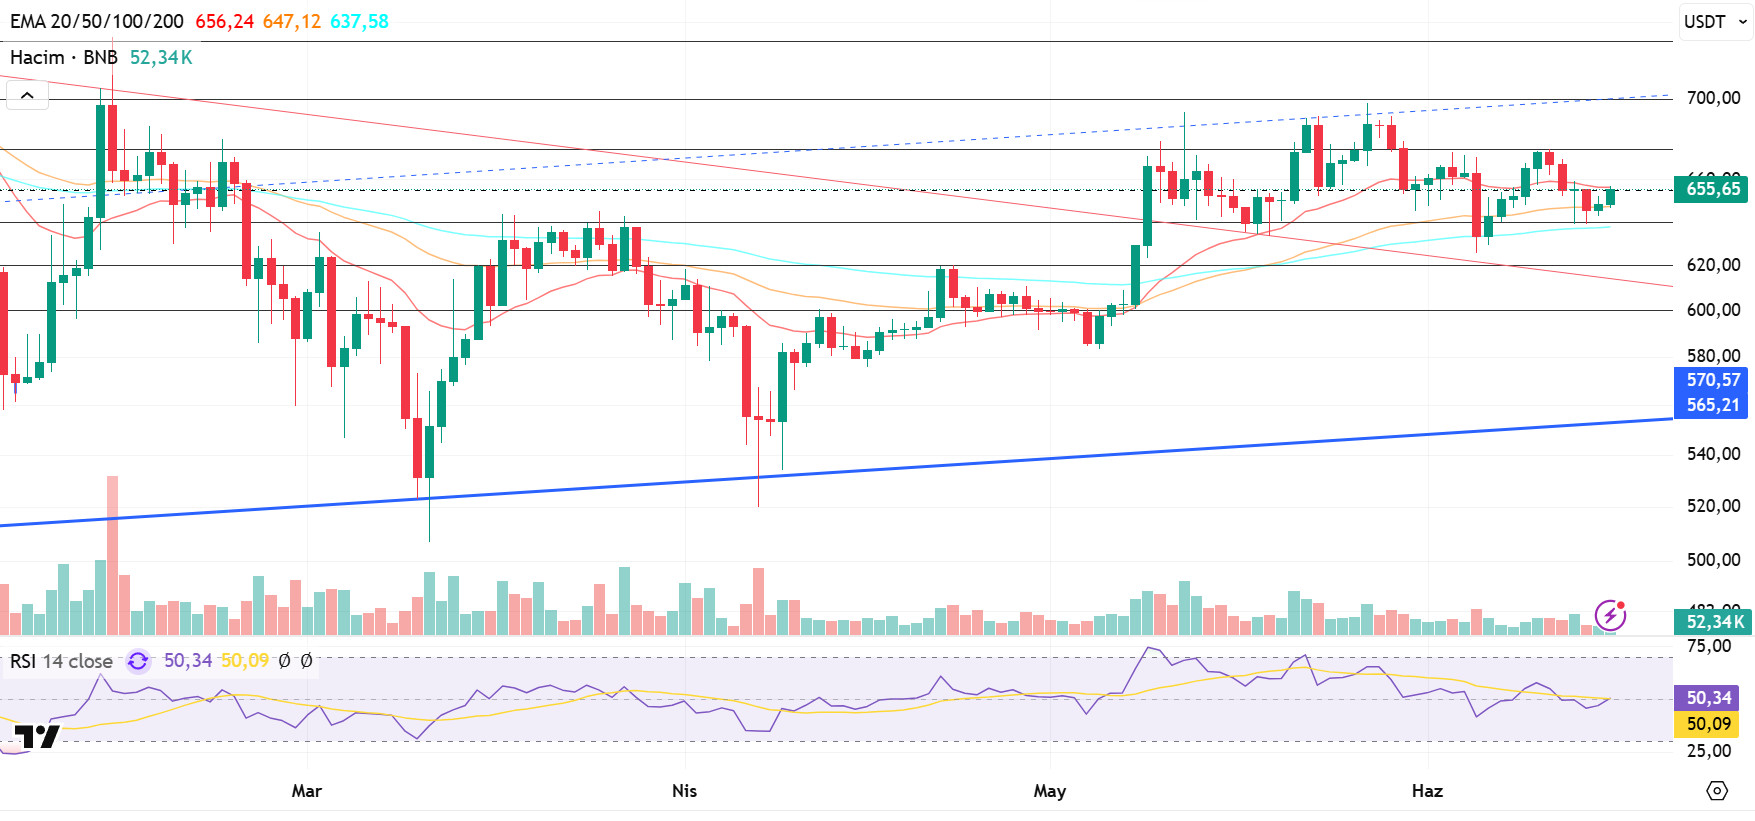
From a technical perspective, the BNB/USDT pair made a positive start to the week on Monday, June 9. With this momentum, it moved towards the $ 675 level; however, it encountered resistance at this level and came under pressure. With the selling pressure, the asset retreated to the $ 640 level, found support from this point, regained an upward momentum and rose to the $ 655 level . In this context, it made a positive start to the new week, reaching the EMA 20 (red line) level.
When the BNB/USDT pair, which is currently trading in the range of 640 to 675 dollars, is analyzed in the light of technical indicators, a weak course in trading volume is observed in the last one-week period. This situation indicates that the buying appetite has decreased. On the other hand, the Relative Strength Index (RSI) has turned down and moved below the average with the recent pullback. This outlook suggests that short-term negative movements are effective.
Within the framework of the current technical structure, if the positive momentum continues, the BNB price is expected to test the $ 675 level in the first place. If this resistance is exceeded, the $700 and $730 levels should be followed as the next strong resistance zones. On the other hand, if the $ 675 level cannot be exceeded and selling pressure increases, the price is likely to retreat back to the $ 640 level. If this level is broken downwards, the 620 and 600 dollar levels stand out as important support zones, respectively.
Supports 640 – 620 – 600
Resistances 675 – 700 – 730
SUI/USDT
Sui started the week with network updates and supply dynamics. On June 30, approximately $450 million worth of tokens will be unlocked. The information that Nasdaq filed an official application with the US Securities and Exchange Commission (SEC) for the 21Shares SUI ETF based on the Sui network to be traded on the stock exchange had a positive impact on Sui’s price. After the hack, work was initiated to optimize network performance errors and expand cross-chain capabilities. In addition, financial media platform Real Vision partnered with Sui blockchain to expand on-chain user engagement, launching crypto-backed rewards and a blockchain-based membership experience. Phantom Wallet announced that it has started supporting the Sui blockchain. This integration allows users to easily perform transactions such as staking, token swaps and NFT storage. Some Sui ecosystem tokens have entered the top 10 in exchange fund flows, indicating increased Sui capital activity in the ecosystem. Sui’s rapid rise up the DeFi rankings, with Total Value Locked (TVL) exceeding $1.9 billion, has pushed Sui’s weekly trading volume to over $750 million.
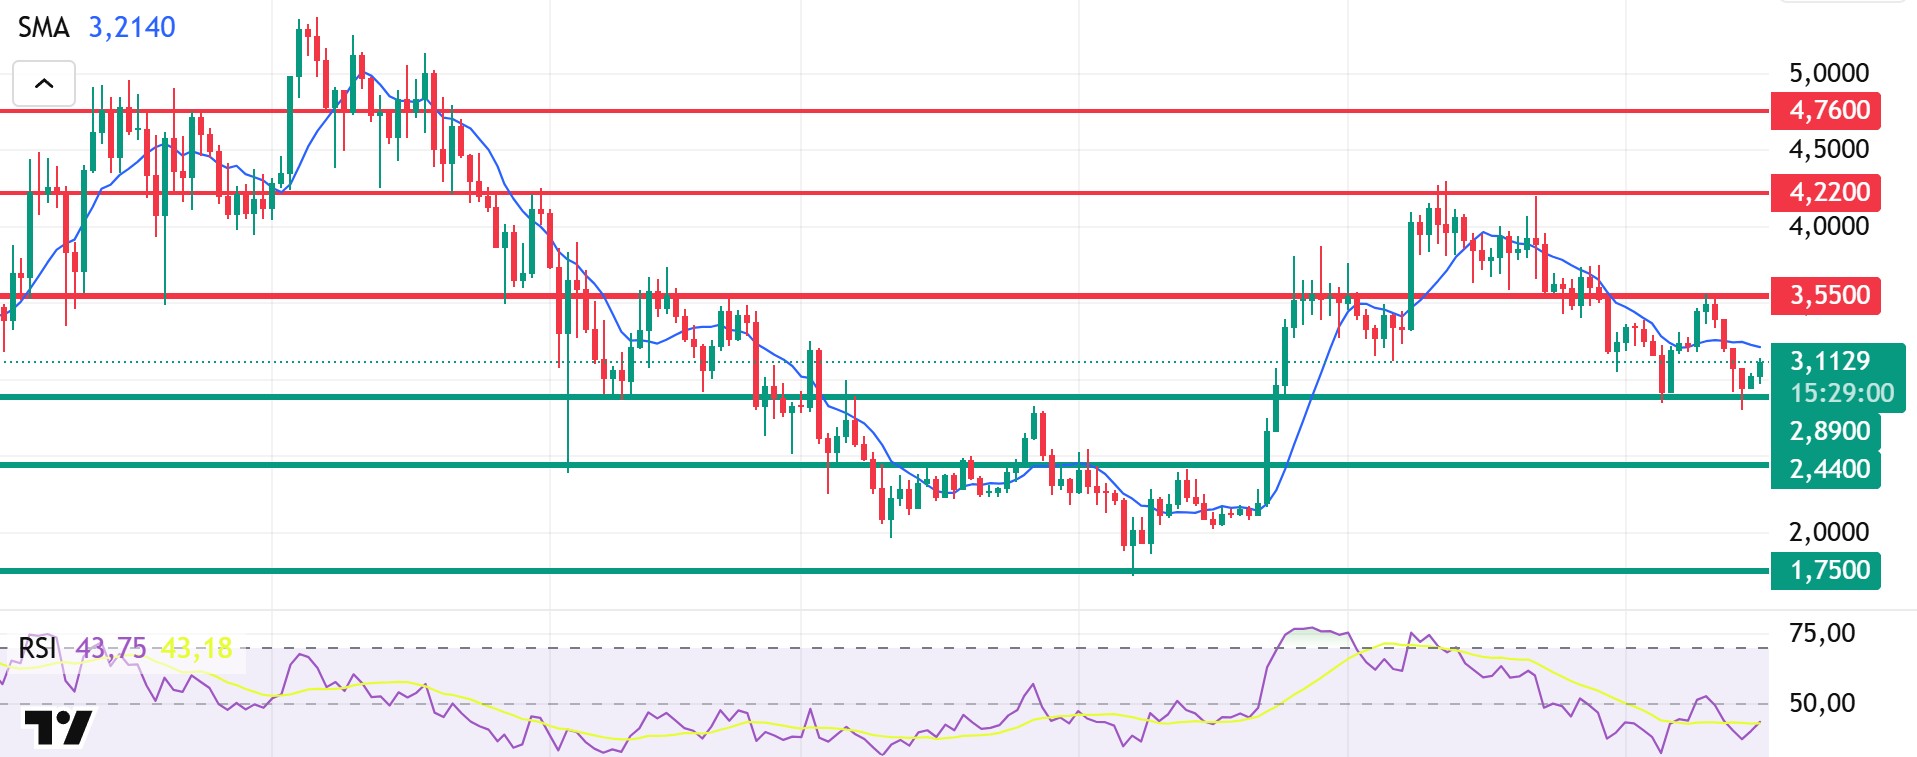
When we look at the technical outlook after the recent developments, the positive outlook formed in a short time with the effect of fundamental developments brought Sui to $3.11. It has been observed that the Relative Strength Index (RSI) value is in the range of 43.75 – 43.18. This value range may reflect positively on the price. A movement towards the resistance levels of 3.55 – 4.22 – 4.76 dollars can be expected in Sui, respectively. In case the price makes new lows, the support levels of 2.89 – 2.44 dollars can be tested. If the technical details are positive, Sui may reach the $3.55 level. When the Simple Moving Averages (SMA) indicator is analyzed, it is seen that the simple moving average is at $3.21 on the Sui chart. An intersection with the SMA line above $3.21 could put Sui price in an uptrend.
Supports 1.75 – 2.44 – 2.89
Resistances 3.55 – 4.22 – 4.76
ADA/USDT
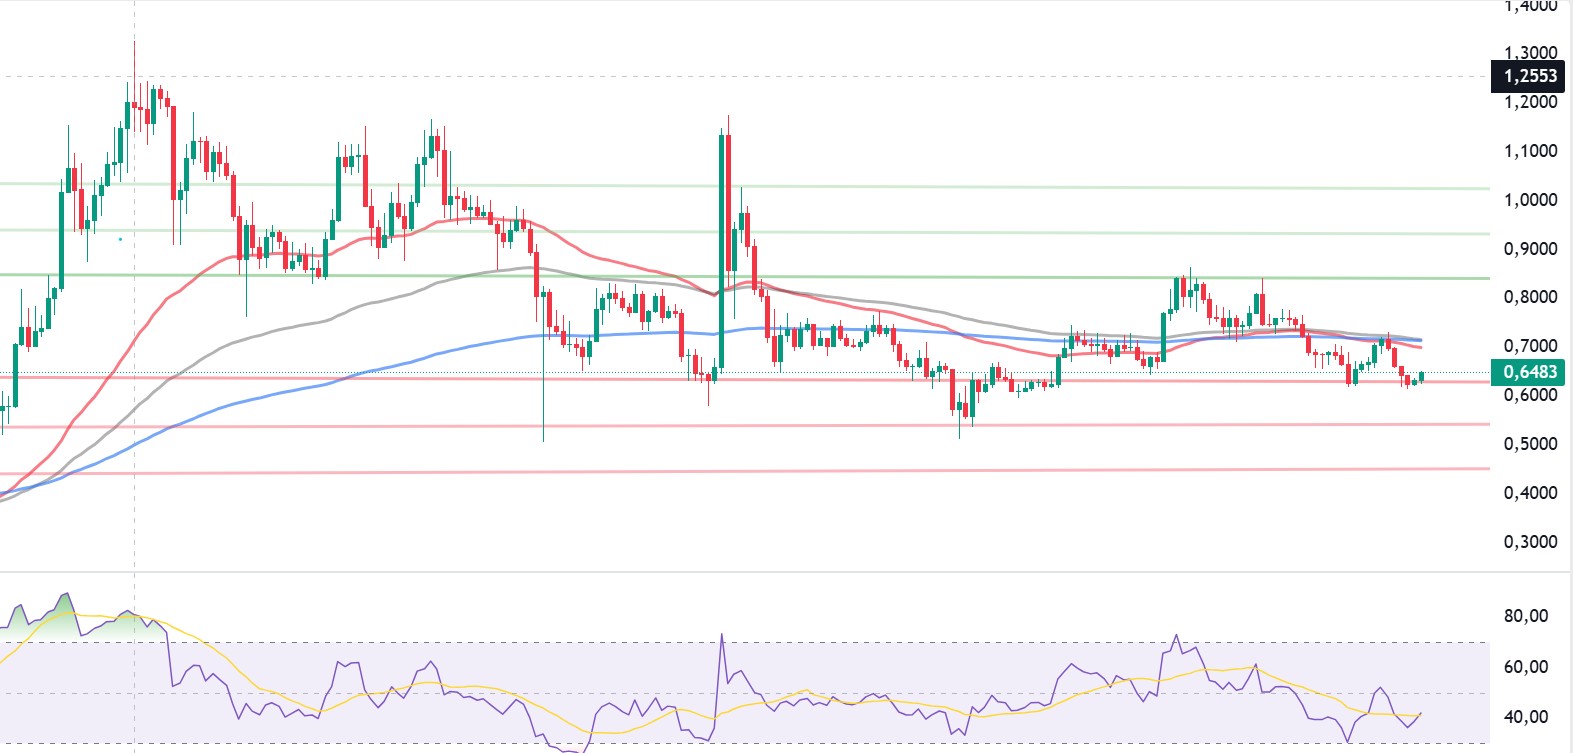
There has been an important development for the Cardano ecosystem. Input Output Global (IOG) announced the successful completion of the testnet phase of “Hydra Phase 2”, a new scaling update to the Cardano blockchain. This update aims to increase the network’s transaction capacity from 1,000 to 10,000 transactions per second and offers increased efficiency for DeFi applications and NFT marketplaces. Additionally, the Cardano network burned a total of 12.3 million ADA during the first week of June. This process continues to put deflationary pressure on ADA by reducing the supply of ADA in circulation. The Israeli-Iranian war that started last week continued over the weekend. ADA, which started last week at 0.6467, closed the week at 0.6312, down about 2.37% during the week.
Technically, on the daily chart, it continues to move within the bullish channel and is close to the lower band of the channel. On the weekly chart, it continues its daily move higher to complete a double bottom pattern after the intersection of the 100 and 50 period moving averages. Relative Strength Index (RSI) shows that ADA is approaching the horizontal zone from the oversold zone, but there is no clear turnaround signal . When the ADA price completes the double bottom pattern, it can be expected to move up from its current level and move towards the middle and upper band of the channel.
If the $0.7000 level for ADA’s price breaks the nearest uptrend, the $0.8200 levels stand out as the area of strong selling pressure, where the price has been rejected several times in the past. The 50-day moving average (Red Line) and the 200-day moving average (Blue Line) provide support above the price. If the price falls below these averages, selling pressure may increase. In such a scenario, if the price of ADA falls, the support levels of $0.5544 and $0.5049 could be retested. In case these supports are broken, the fall could deepen.
Supports 0.5544 – 0.5049 – 0.4158
Resistances 1.0627 – 0.8200 – 0.7000
Legal notice
The investment information, comments and recommendations contained in this document do not constitute investment advisory services. Investment advisory services are provided by authorized institutions on a personal basis, taking into account the risk and return preferences of individuals. The comments and recommendations contained in this document are of a general type. These recommendations may not be suitable for your financial situation and risk and return preferences. Therefore, making an investment decision based solely on the information contained in this document may not result in results that are in line with your expectations.