Active Addresses
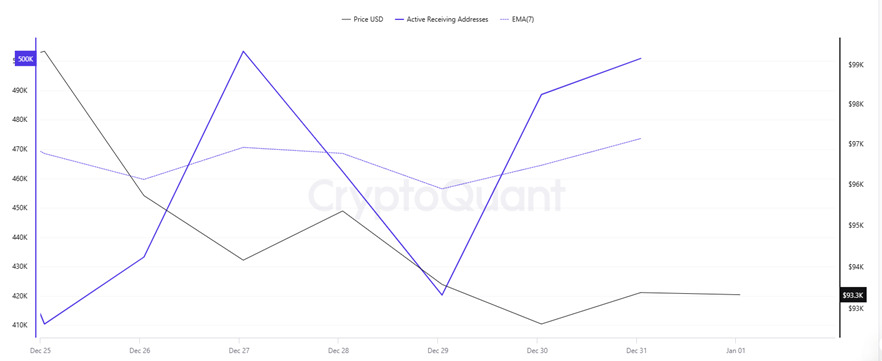
This week, $859,000 in active addresses entered exchanges between December 25 and December 31, 2024. Bitcoin fell from a price of $99,000 to a price of $92,000 during this period. The intersection of price and the number of active addresses in the area marked on the chart of addresses ready to trade, the lowest number of active addresses since December, supported Bitcoin purchases as of December 23. After December 27, the inflows of active addresses to Bitcoin seem to have increased. The increase in the number of addresses when the price is low tells us that investors are re-costing their positions at low prices. It may indicate that the market is strengthening and investors are showing more interest. When we follow the 7-day simple moving average, we have the impression that this average is also on an upward trend. Bitcoin reached 932,033,557 in correlation with the active address EMA (7). This indicates that the Bitcoin price is entering the address count at $ 93,000 levels.
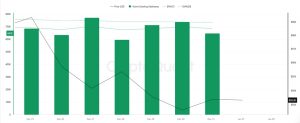 On the outflows, there was a significant increase in active shipping addresses towards December 30, along with the Black Line (price line). On the day of the price peak, active shipping addresses rose as high as 737,691 , indicating that buyers sold their positions as Bitcoin fell to $92,000. The rise in active shipping addresses marks the day when the Bitcoin price started to fall to $92,000
Active Receiving Addresses show that as of December 27 and 31, the price is nearing the peak of the number of buyers (420,500) and investors are increasing their bitcoin positions. Bitcoin shows the $94,000 level as the longest buying level for traders. The EMA (7-Day) 456,402,0000 seems to change the trend direction at the intersection with the price.

Breakdowns
-
MRVR
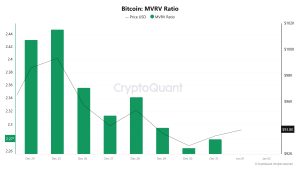
As of December 31, the Bitcoin price decreased to 93,384 while the MVRV Ratio decreased to 2.27. This represents a 6.00% decrease in Bitcoin price and a 6.97% decrease in MVRV Ratio compared to December 25. This decline in price and MVRV Ratio indicates that market participants continue to engage in short-term profit realization and confidence in valuations has weakened. In particular, the decline in the MVRV Ratio to 2.27 may indicate that Bitcoin’s market capitalization is lower than historical averages and that investors are taking a more cautious approach to current price levels. However, the fact that the MVRV is not at extremely low levels suggests that the market is not facing severe selling pressure and that the search for balance continues. This may indicate that investors are closely monitoring the current state of the market and waiting for prices to form a more pronounced trend. The decline in the price of Bitcoin and the fact that the MVRV Ratio remains at moderate levels suggest that the market is in the process of a correction, but long-term investors’ confidence in the market is not completely lost.
-
Realized Price
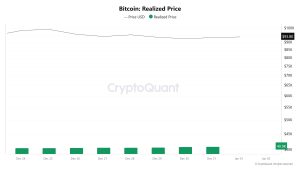
As of December 31, the Bitcoin price decreased to 93,384 while the Realized Price increased to 40,987. The 6% drop in price and 1.00% increase in Realized Price suggests that the sell-off may have been largely driven by short-term investors. The fact that the Bitcoin price is approaching Realized Price suggests that confidence in market valuations may be waning. However, the increase in Realized Price that long-term investors continue to support the market and continue to accumulate at these levels.This relationship between price and Realized Price may indicate that the market is in search of an equilibrium and that the sales of short-term investors are being met by long-term investors. This suggests that the market may be in the process of a gradual recovery rather than a sharp change in direction.
-
Spent Output Profit Ratio (SOPR)
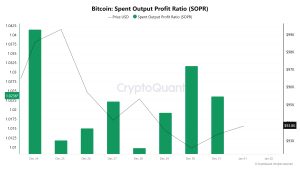
As of December 31, the Bitcoin price decreased to 93,384, while the SOPR (Spent Output Profit Ratio) metric reached 1.02. During this period, the Bitcoin price decreased by 6.00% since December 25, while the SOPR increased by 0.99%. The rise of the SOPR indicates that investors continue profit realizations and market participants are generally profitable. As long as the SOPR value remains above 1, it is possible to say that the market is in a profitable environment and investor sentiment remains positive. However, the increase in SOPR despite the price decline suggests that profit realizations are taking place in a controlled manner and market dynamics are largely in balance. This may indicate that the market is in a correction process, but overall profitability remains intact.
Derivatives
-
Open Interest
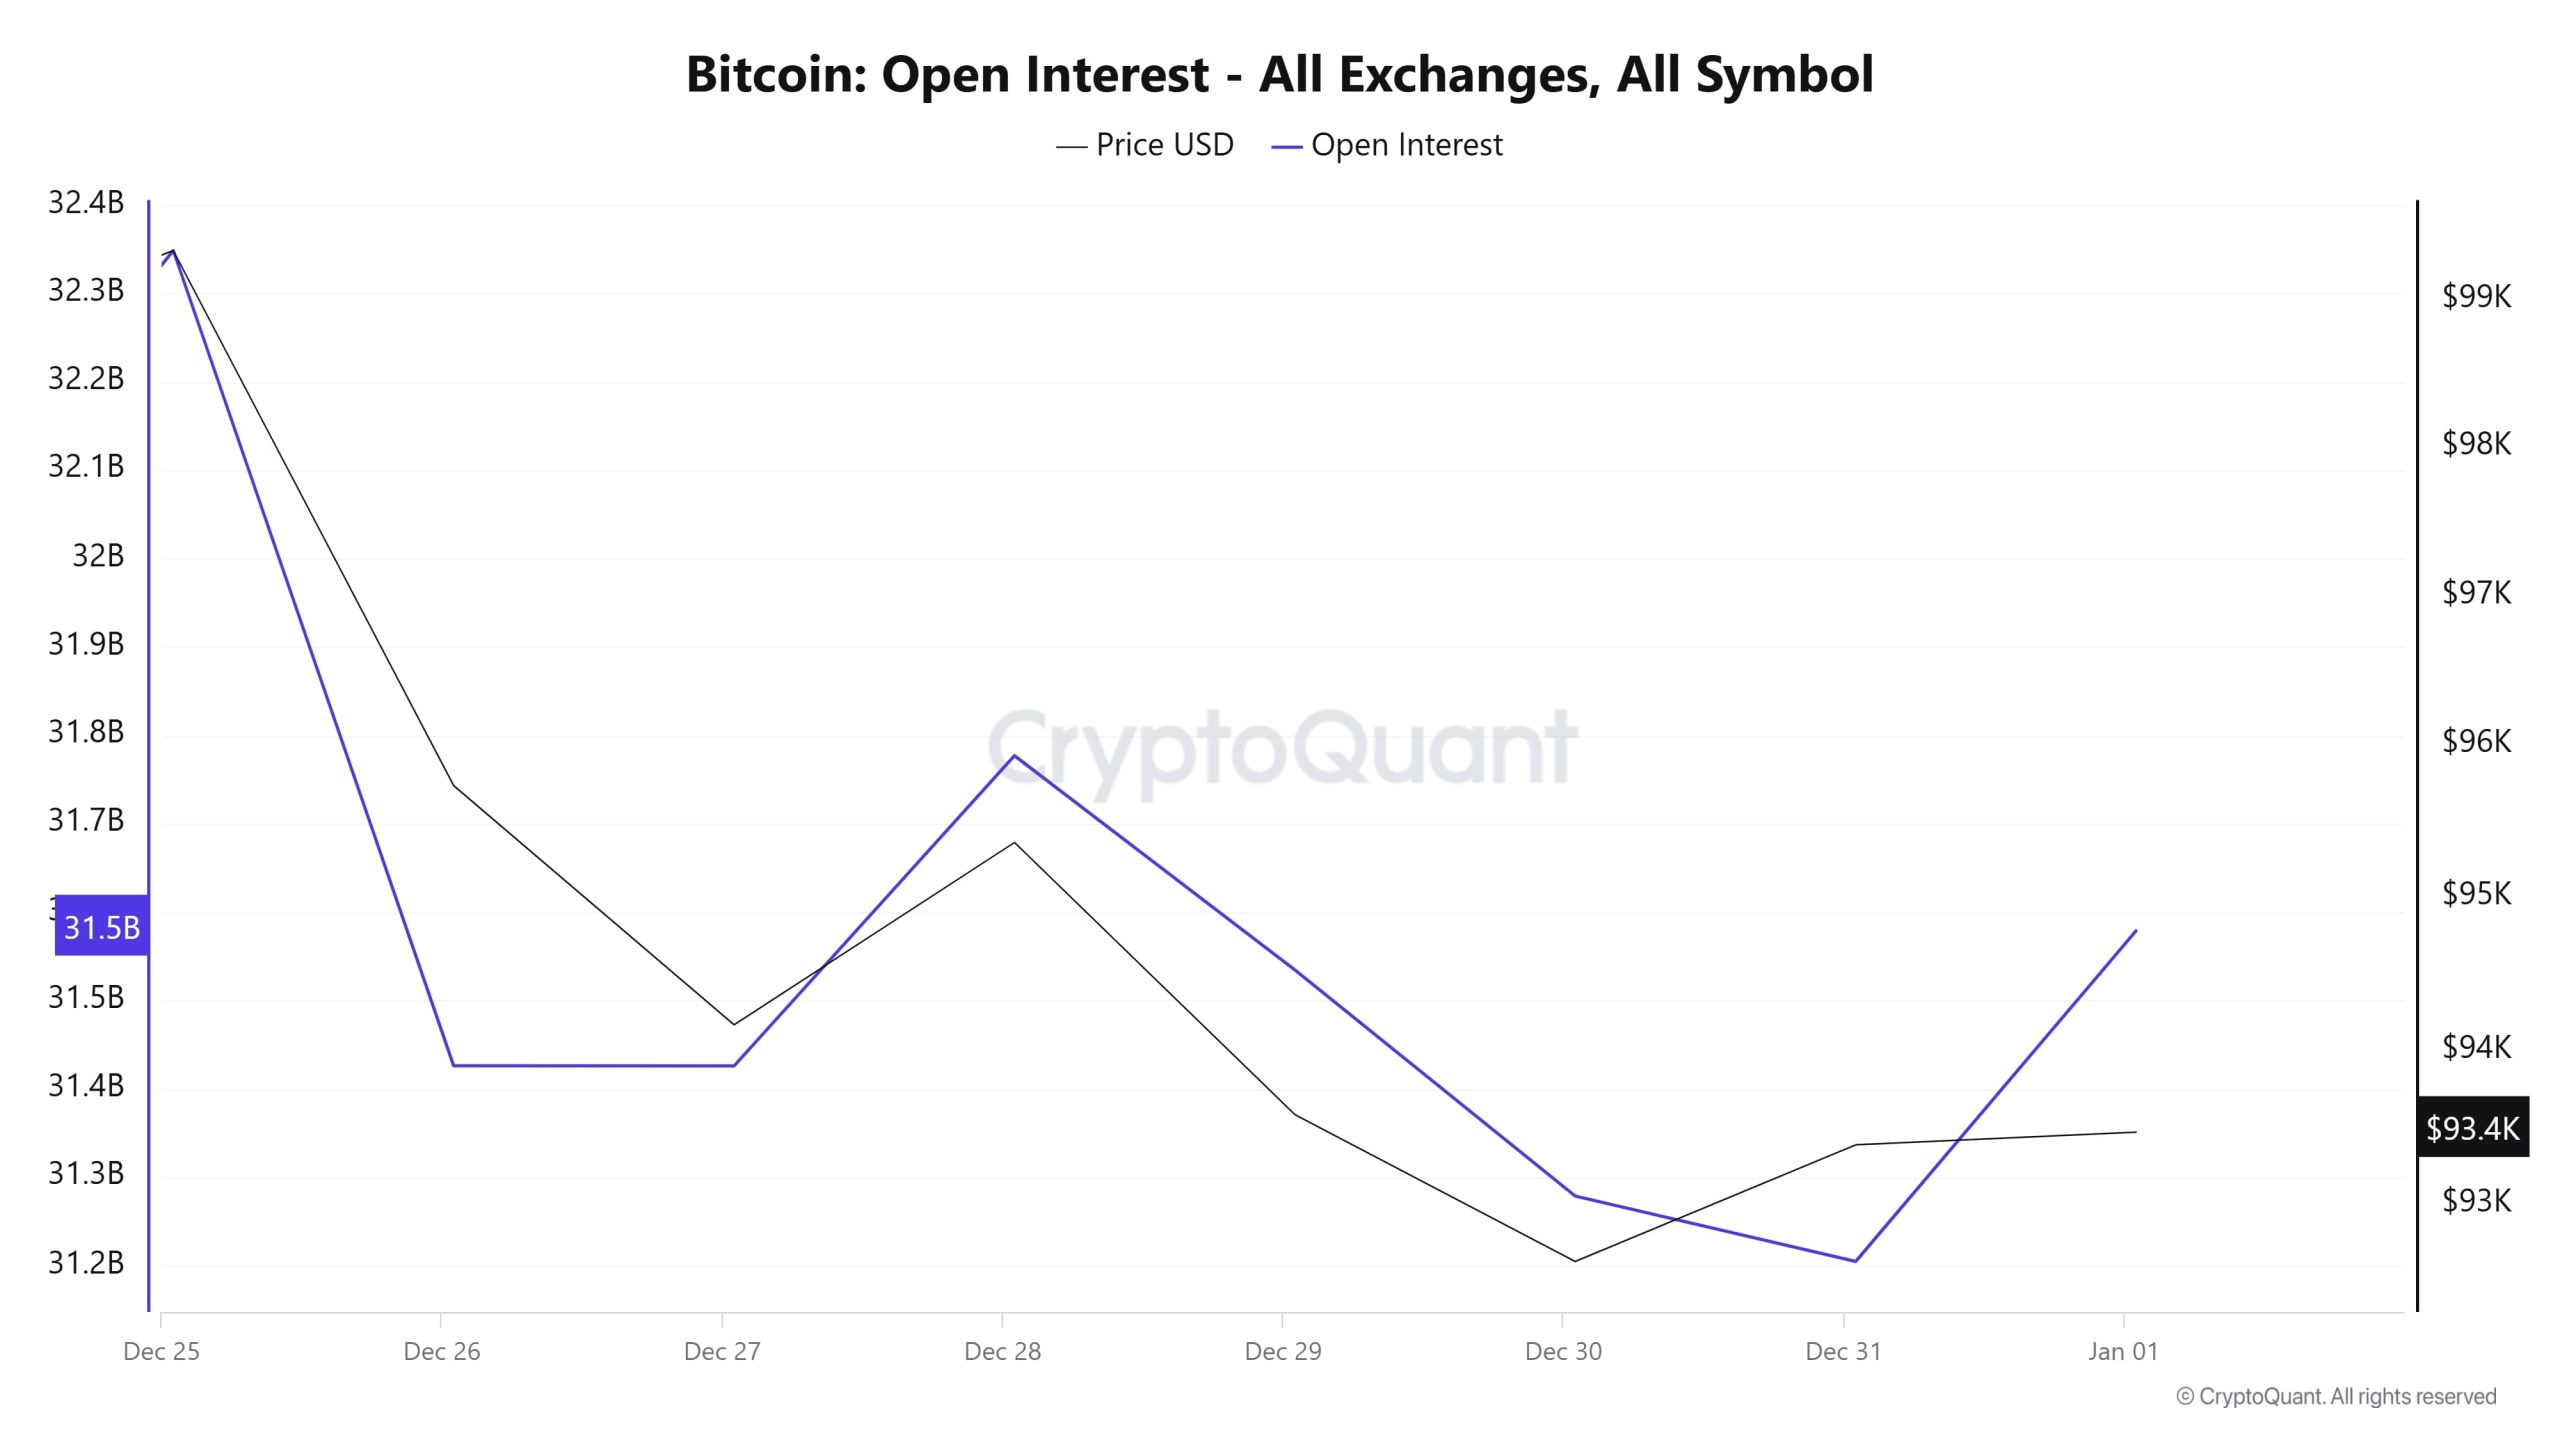
During the December 25-27 period, there was a parallel decline between OI and price, which could be an indication of position closures or the market being under liquidation pressure. Between December 27-29, the OI rebounded while price action failed to respond adequately, suggesting an uncertain directional bias despite the increasing open interest in the market. On December 30-31, both OI and price hit their lows, indicating that the market had entered a relatively quiet period. As of January 1, the OI increased sharply, but the price increase was not as strong. This suggests that the market may be characterized by highly leveraged positions or speculative movements. An increase in OI is usually accompanied by an increase in liquidity and volatility, so price movements are to be sharper in the coming days. In anticipation of increased volatility in the market, it is critical to carefully implement risk management and stop-loss strategies. The OI exceeding the 32 billion level and its impact on the price should be closely monitored. If the price increase is not supported by the OI increase, this may indicate that the market action is weak.
-
Funding Rate
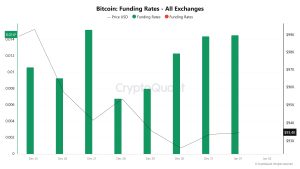
Funding ratios are generally positive. This suggests that the market is dominated by long positions and investors believe that the price will rise. However, during the December 25-31 period, the price did not show a significant rise despite the positive funding ratios, suggesting that there was not enough buying power in the market or that trading volume remained weak.
On December 27-28, funding rates fell briefly while the price also declined. This may indicate a short-term uncertainty in the market or short positions gaining weight. However, this did not last long and funding rates returned to positive territory.
As of January 1, funding rates increased again and it was understood that long positions regained strength. However, the price did not show a rise to support this increase. This may suggest that the market has been speculative or that investors are taking too much risk.
A prolonged period of positive funding ratios may increase the likelihood of a correction in the market. This is because high funding ratios increase the costs of long position holders, which may increase selling pressure. If funding ratios move into the negative territory, this time, selling pressure on the price may occur as short positions gain weight.
-
Long & Short Liquidations
After a week of slight declines, the total liquidation of long positions in Bitcoin reached $67.6 million, while short liquidations remained at $34.83 million. The fact that long liquidations were almost twice as high as short liquidations suggests that market participants acted with the expectation that prices would rise, but price fluctuations did not meet these expectations. The highest amount of liquidations took place on December 30, with $24.13 million worth of long positions and $8.78 million worth of short positions liquidated. This stands out as a day of high volatility in the market. In contrast, on December 28, long liquidations remained low, while short liquidations increased more significantly ($6.56 million). These differences reflect the market’s sudden and unpredictable shifts in direction. The heavy liquidation of long positions suggests that investors were faced with price movements contrary to market expectations.
| Date | Long Amount (Million $) | Short Amount (Million $) |
|---|---|---|
| December 26 | 10.86 | 4.23 |
| December 27 | 19.03 | 7.70 |
| December 28 | 1.05 | 6.56 |
| December 29 | 4.72 | 1.80 |
| December 30 | 24.13 | 8.78 |
| December 31 | 7.92 | 5.76 |
| Total | 67.61 | 34.83 |
Supply Distribution
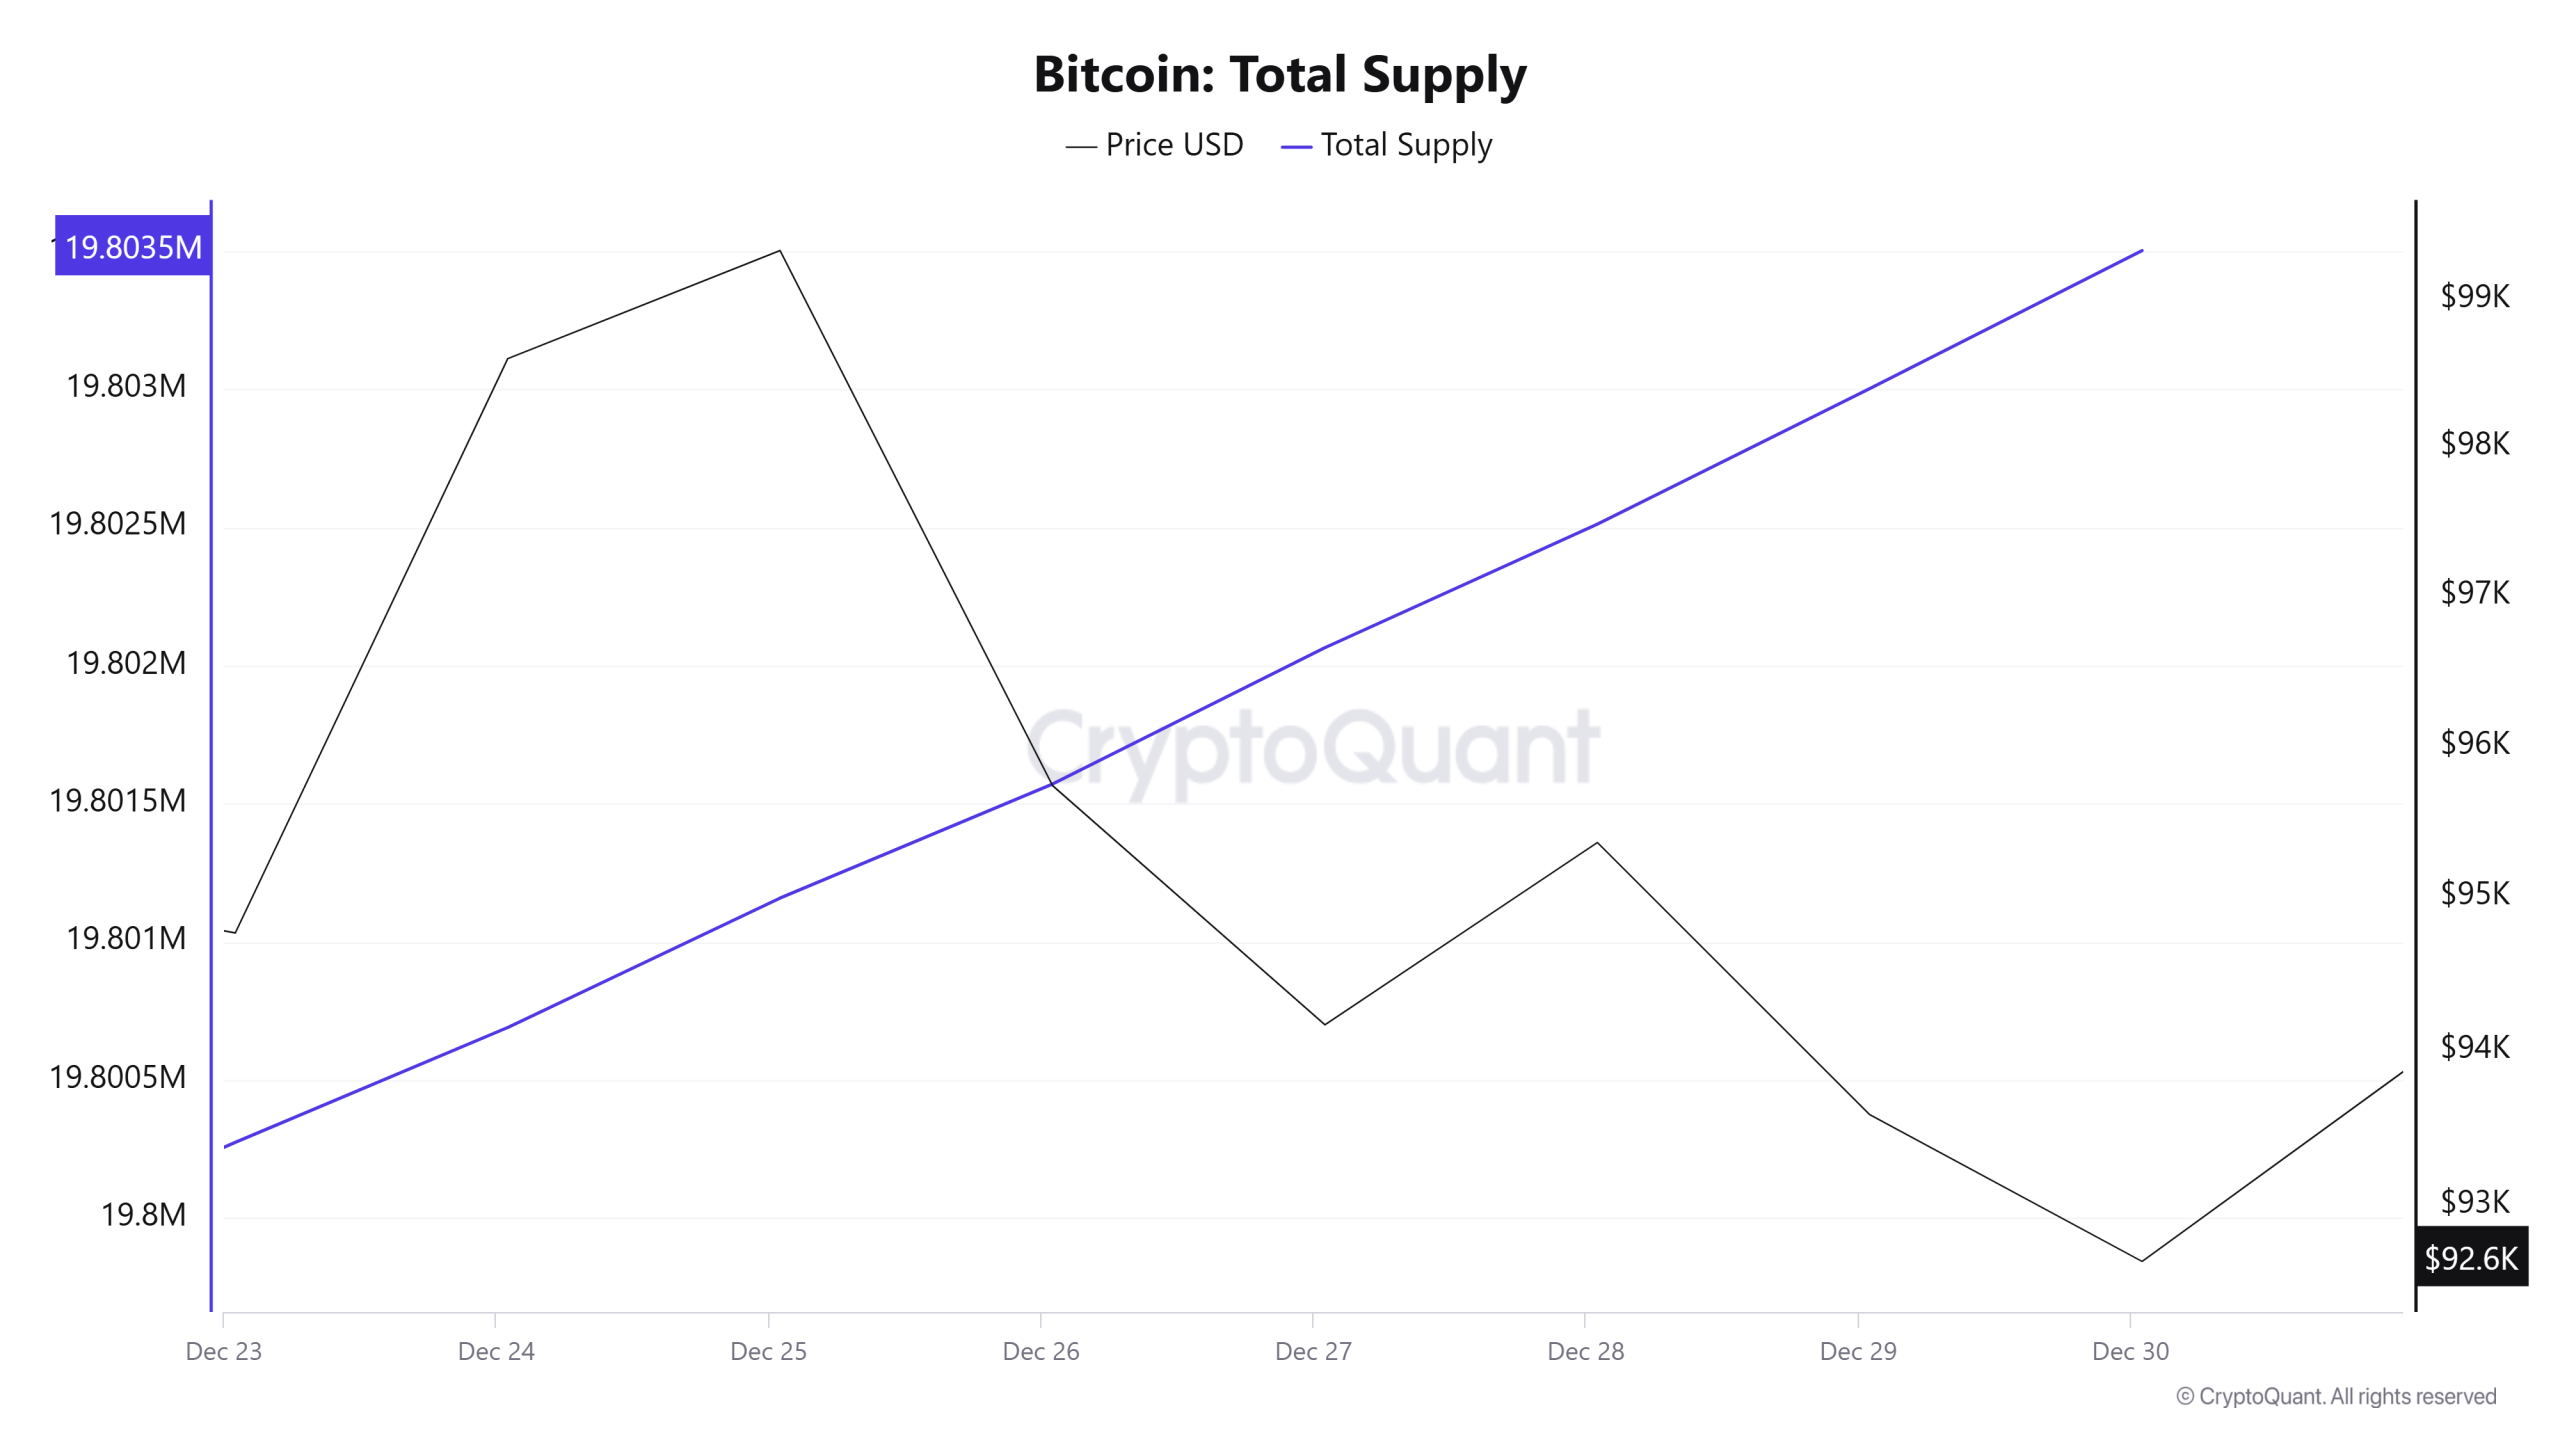
Total Supply: It reached 19,803,520 units, up about 0.0163% from last week.
New Supply: The amount of BTC produced this week was 3,228.Artı yüzdelik değerleri ye
Velocity: There was a small decline in the data compared to last week.
| Wallet Category | 23.12.2024 | 30.12.2024 | Change (%) |
|---|---|---|---|
| < 0.1 BTC | 1.596% | 1.587% | -0.56% |
| 0.1 – 1 BTC | 5.417% | 5.415% | -0.04% |
| 1 – 100 BTC | 32.261% | 32.299% | 0.12% |
| 100 – 1k BTC | 22.553% | 22.491% | -0.27% |
| 1k – 100k BTC | 34.901% | 34.915% | 0.04% |
| > 100k BTC | 3.272% | 3.271% | -0.03% |
Evaluation
The decline in the share of small investors in the total supply suggests that individual participants are adopting a more cautious attitude towards market risks or profit realization at current price levels. On the other hand, the increase in positions of large investor groups (especially wallets in the 1-100 BTC range) may indicate that institutional or high-capitalization buyers are entering the market at these price levels or consolidating their existing holdings.
The decline in Velocity, on the other hand, indicates that the trading speed and cycle of the market has slowed down. This could be due to a decrease in overall trading volume due to the year-end holidays, or it could indicate that investors are opting for a “wait-and-see” strategy where they are uncertain about the direction of the market in the short term. The limited amount of BTC newly supplied and the fact that large investors have increased their positions slightly suggests that the market remains confident in the long-term potential but cautiously optimistic in the short term.
Exchange Reserve
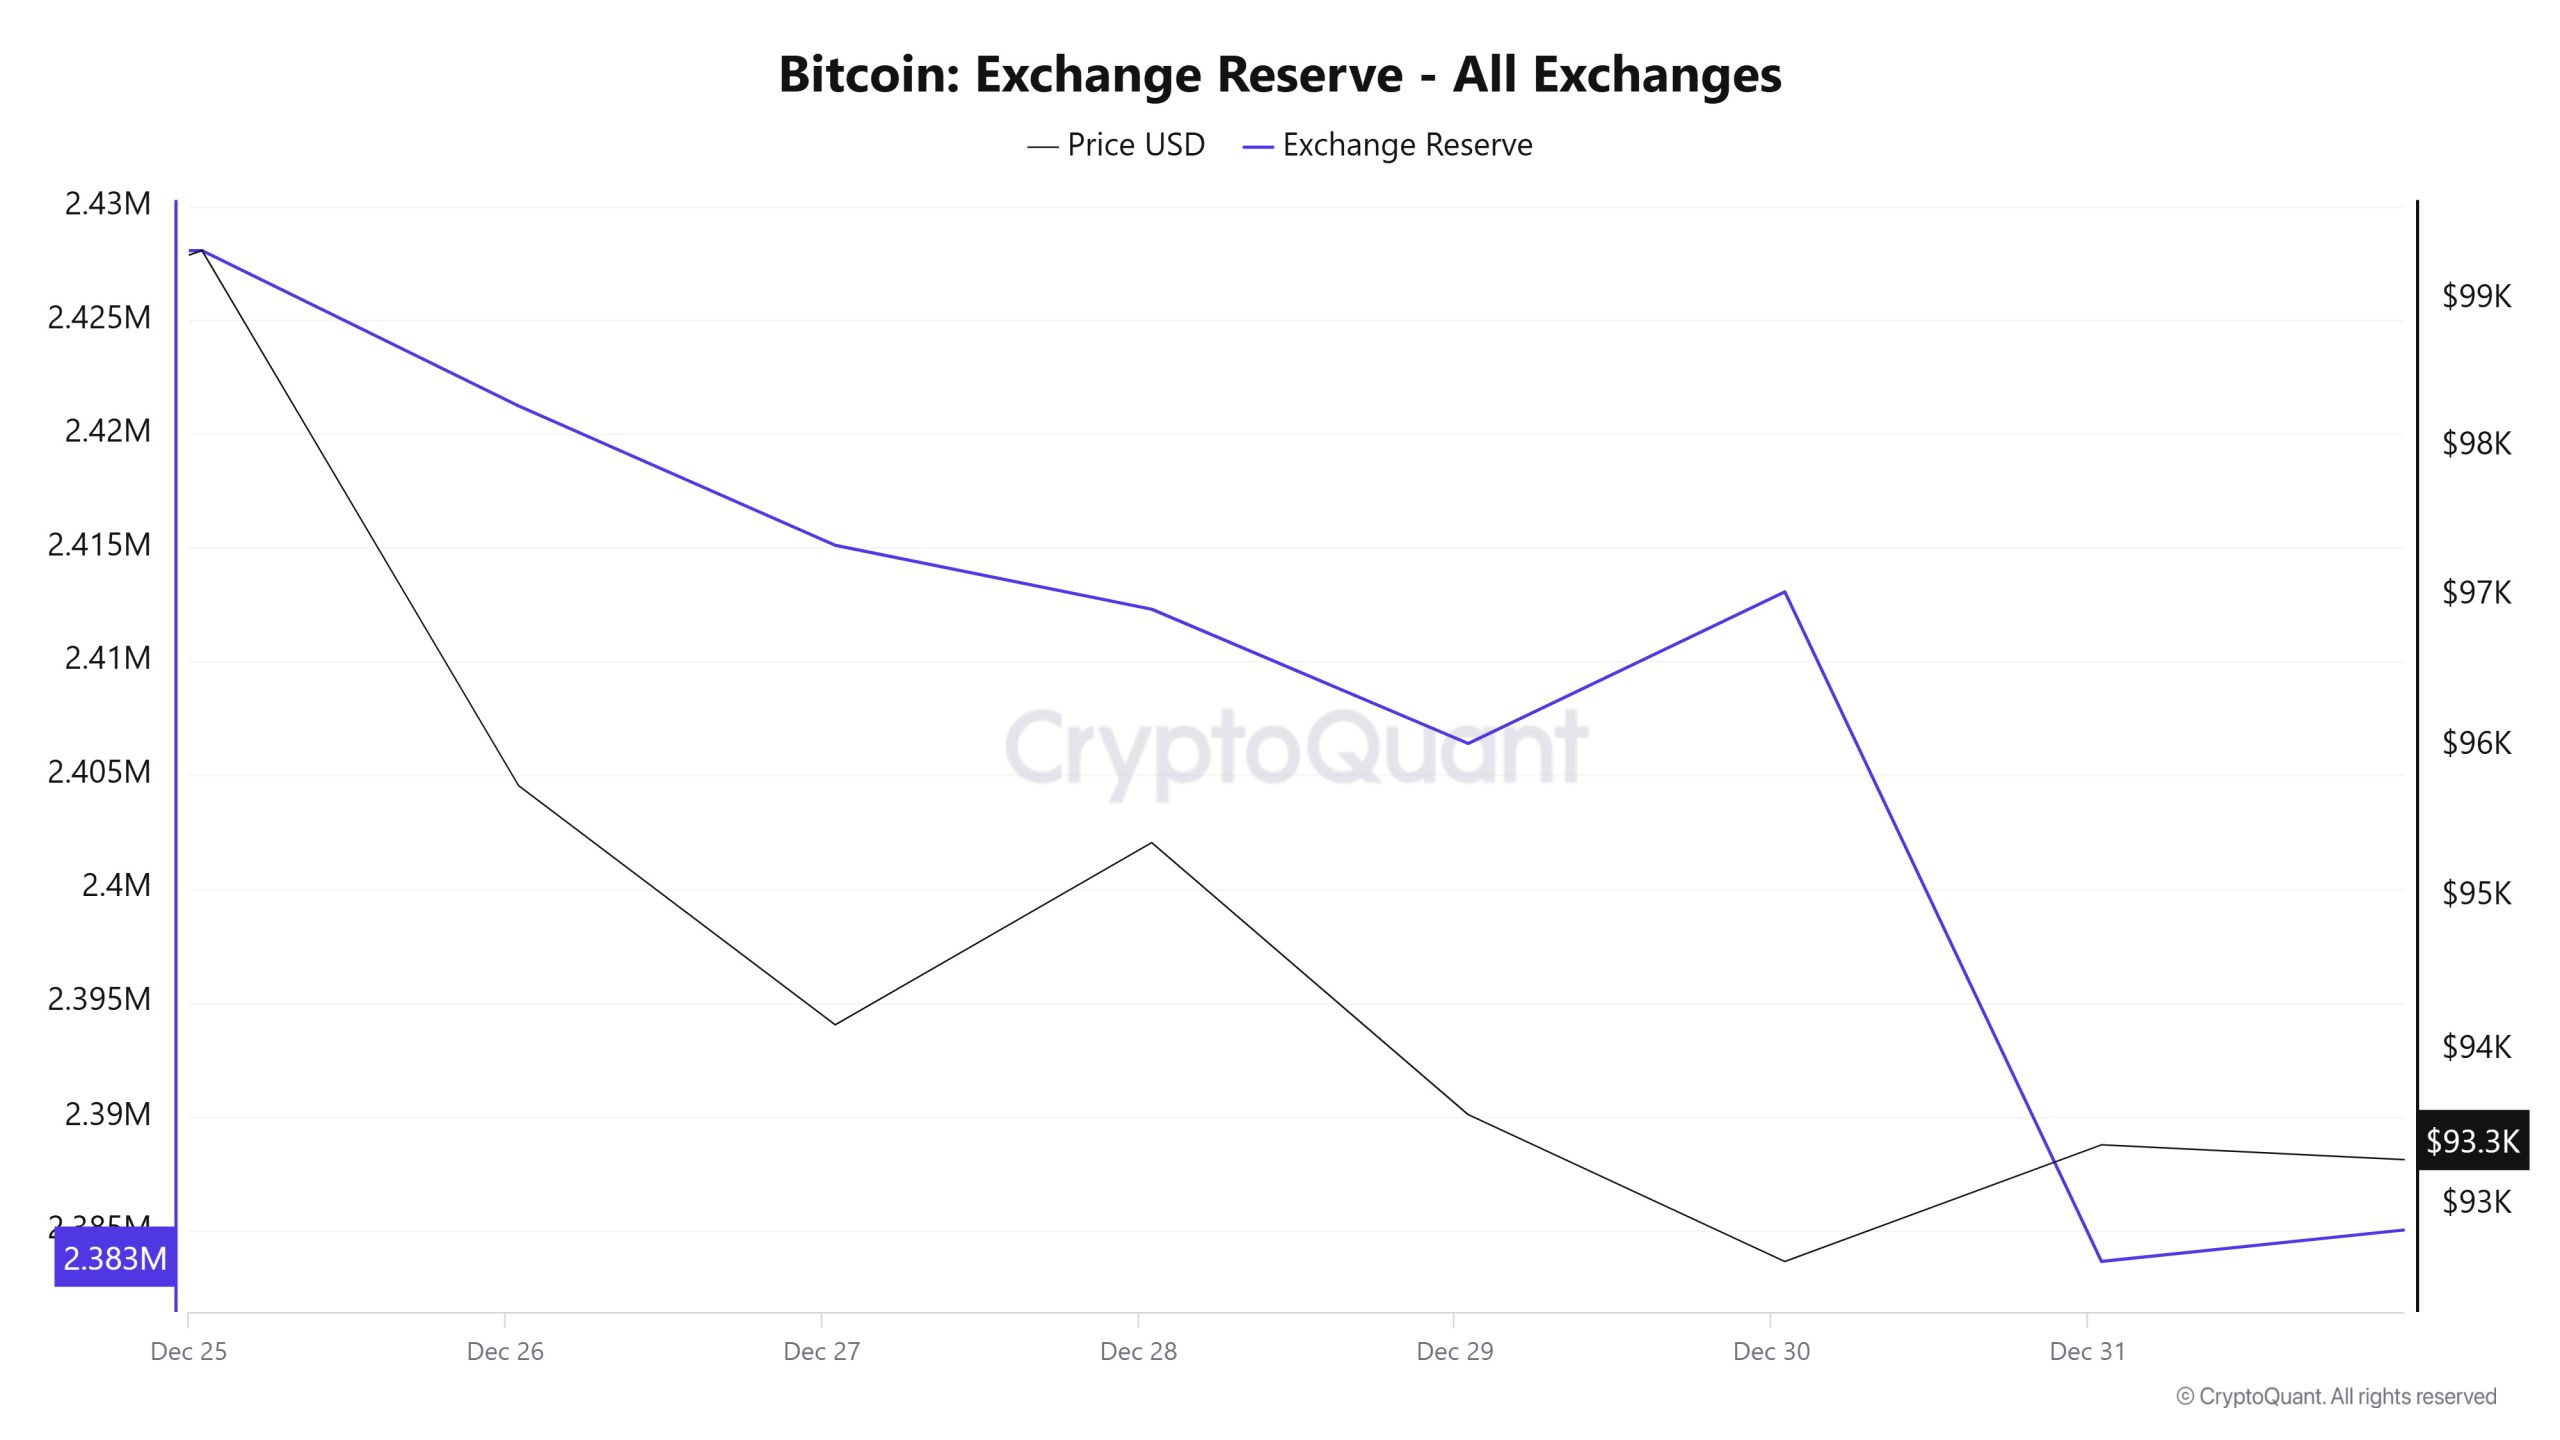
On December 25, 2024, the total Bitcoin reserve on exchanges was 2,428,049 BTC, while as of December 31, it fell to 2,383,636 BTC, a decrease of 1.85% and a total net outflow of 44,413 BTC. The daily net outflow of 29,422 BTC on December 31 was particularly noteworthy. During the same period, the price of Bitcoin was on a downward trend, with a daily closing price of $99,341 on December 25, falling to $93,385 on December 31. Despite the decrease in reserves, the Bitcoin price lost nearly $6,000 in value during this period.
| Date | Exchange Inflow | Exchange Outflow | Exchange Netflow | Exchange Reserve | BTC Price |
|---|---|---|---|---|---|
| 25-Dec | 18,381 | 18,275 | 106 | 2,428,049 | 99,341 |
| 26-Dec | 36,418 | 43,242 | -6,824 | 2,421,225 | 95,733 |
| 27-Dec | 38,134 | 44,257 | -6,123 | 2,415,102 | 94,163 |
| 28-Dec | 11,725 | 14,534 | -2,809 | 2,412,293 | 95,357 |
| 29-Dec | 12,050 | 17,951 | -5,902 | 2,406,392 | 93,580 |
| 30-Dec | 43,800 | 37,133 | 6,666 | 2,413,058 | 92,635 |
| 31-Dec | 37,164 | 66,586 | -29,422 | 2,383,636 | 93,385 |
Between December 25th and 31st, 2024, as exchanges’ Bitcoin reserves fell, the Bitcoin price also experienced a significant decline. Normally, reserve declines support price growth by reducing supply, but in this case, selling pressure was decisive and the price continued to decline. In the short term, the Bitcoin price was more affected by market sentiment and selling pressure than the supply-demand balance. However, in the longer term, the decline in reserves could provide a positive backdrop for a potential price increase.
Fees and Revenues
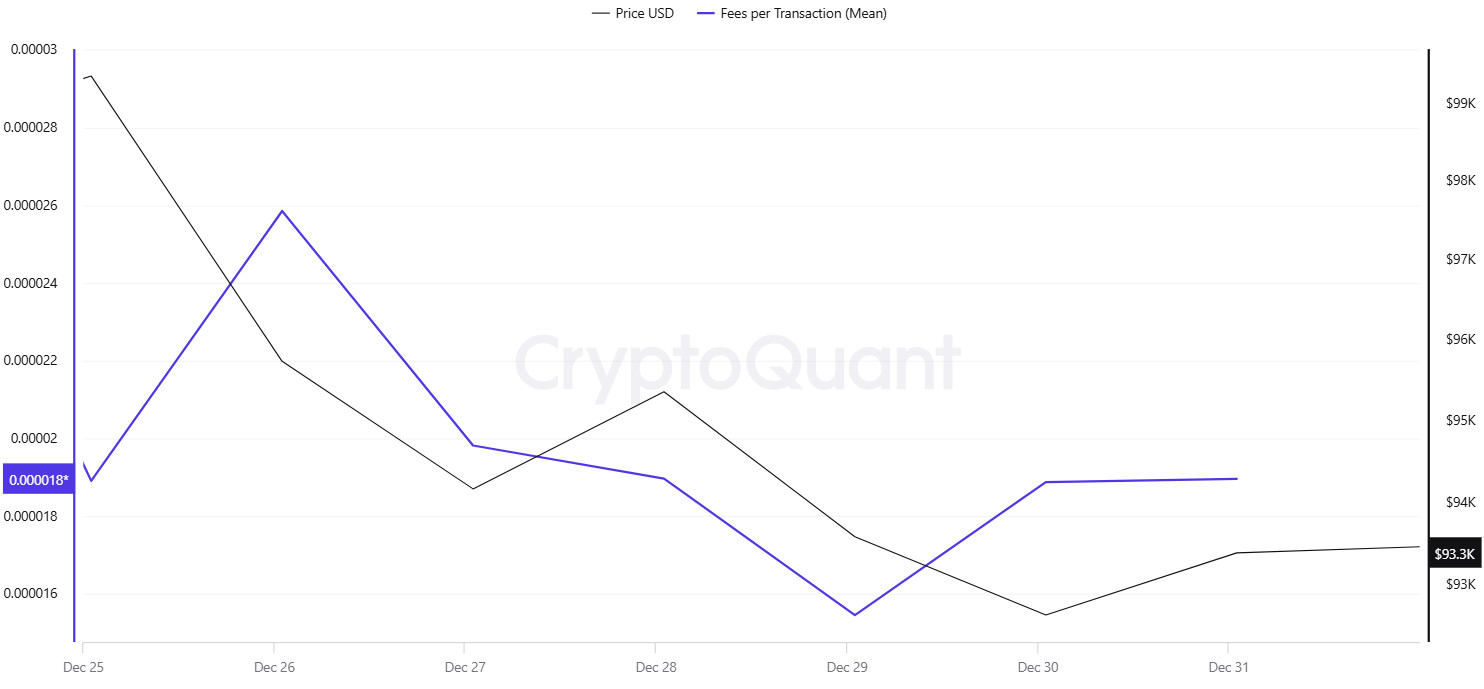
When Bitcoin Fees per Transaction (Mean) data between December 25-31 are analyzed, it is determined that the Fees per Transaction (Mean) value, which was at 0.00001891 on December 25, increased and reached 0.00002585 on December 26, with the increased volatility after the sharp retracement in Bitcoin price on December 26. This value was also recorded as the highest level of the week.
As the volatility in the Bitcoin price relatively decreased during the week, Fees per Transaction (Mean) followed a calmer course and stood at 0.00001896 on December 31.
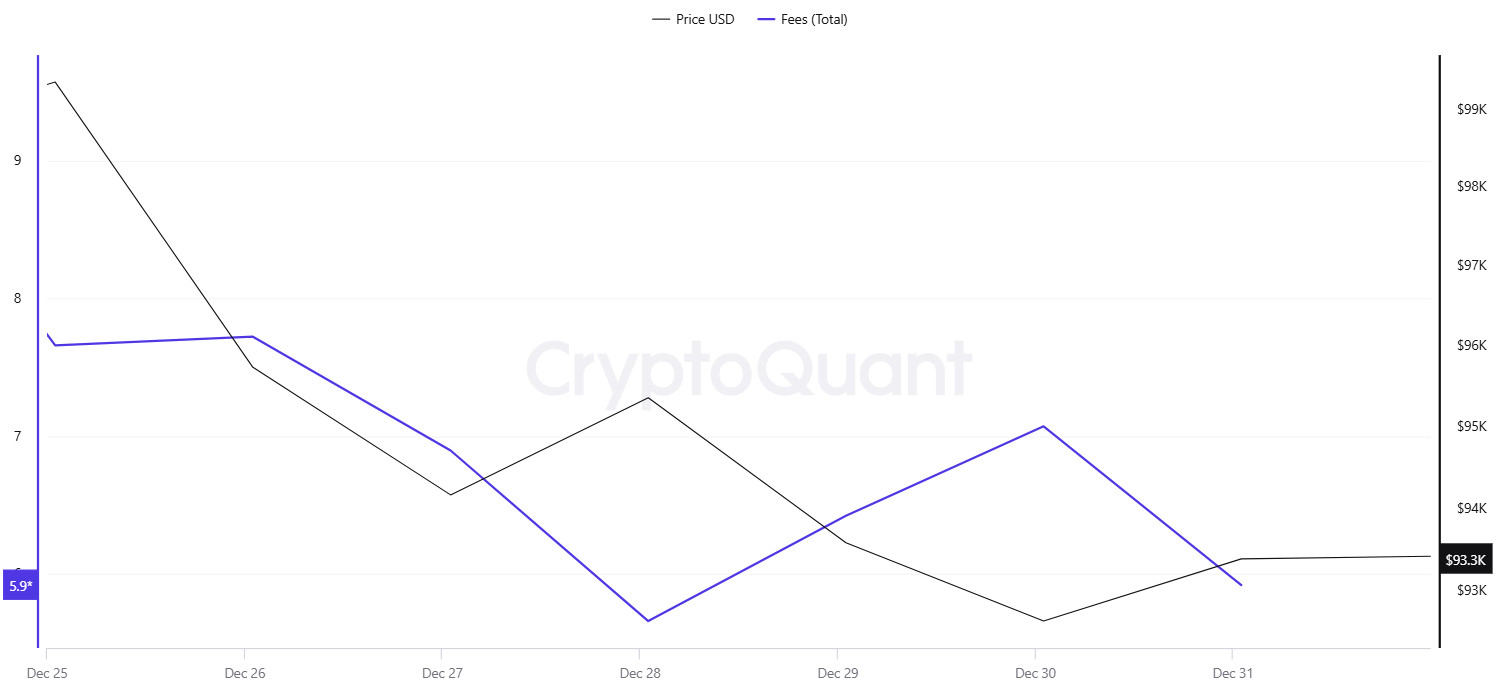
Similarly, when Bitcoin Fees (Total) data between December 25-31 were analyzed, it was seen that the volatile course that started in Bitcoin price on December 26 led to an increase. On this date, Fees (Total) rose to 7,72374614, the highest value of the week.
Fees (Total), which stabilized later in the week as the volatility in Bitcoin price decreased, was realized at 5.92137861 on December 31.
Miner Flows
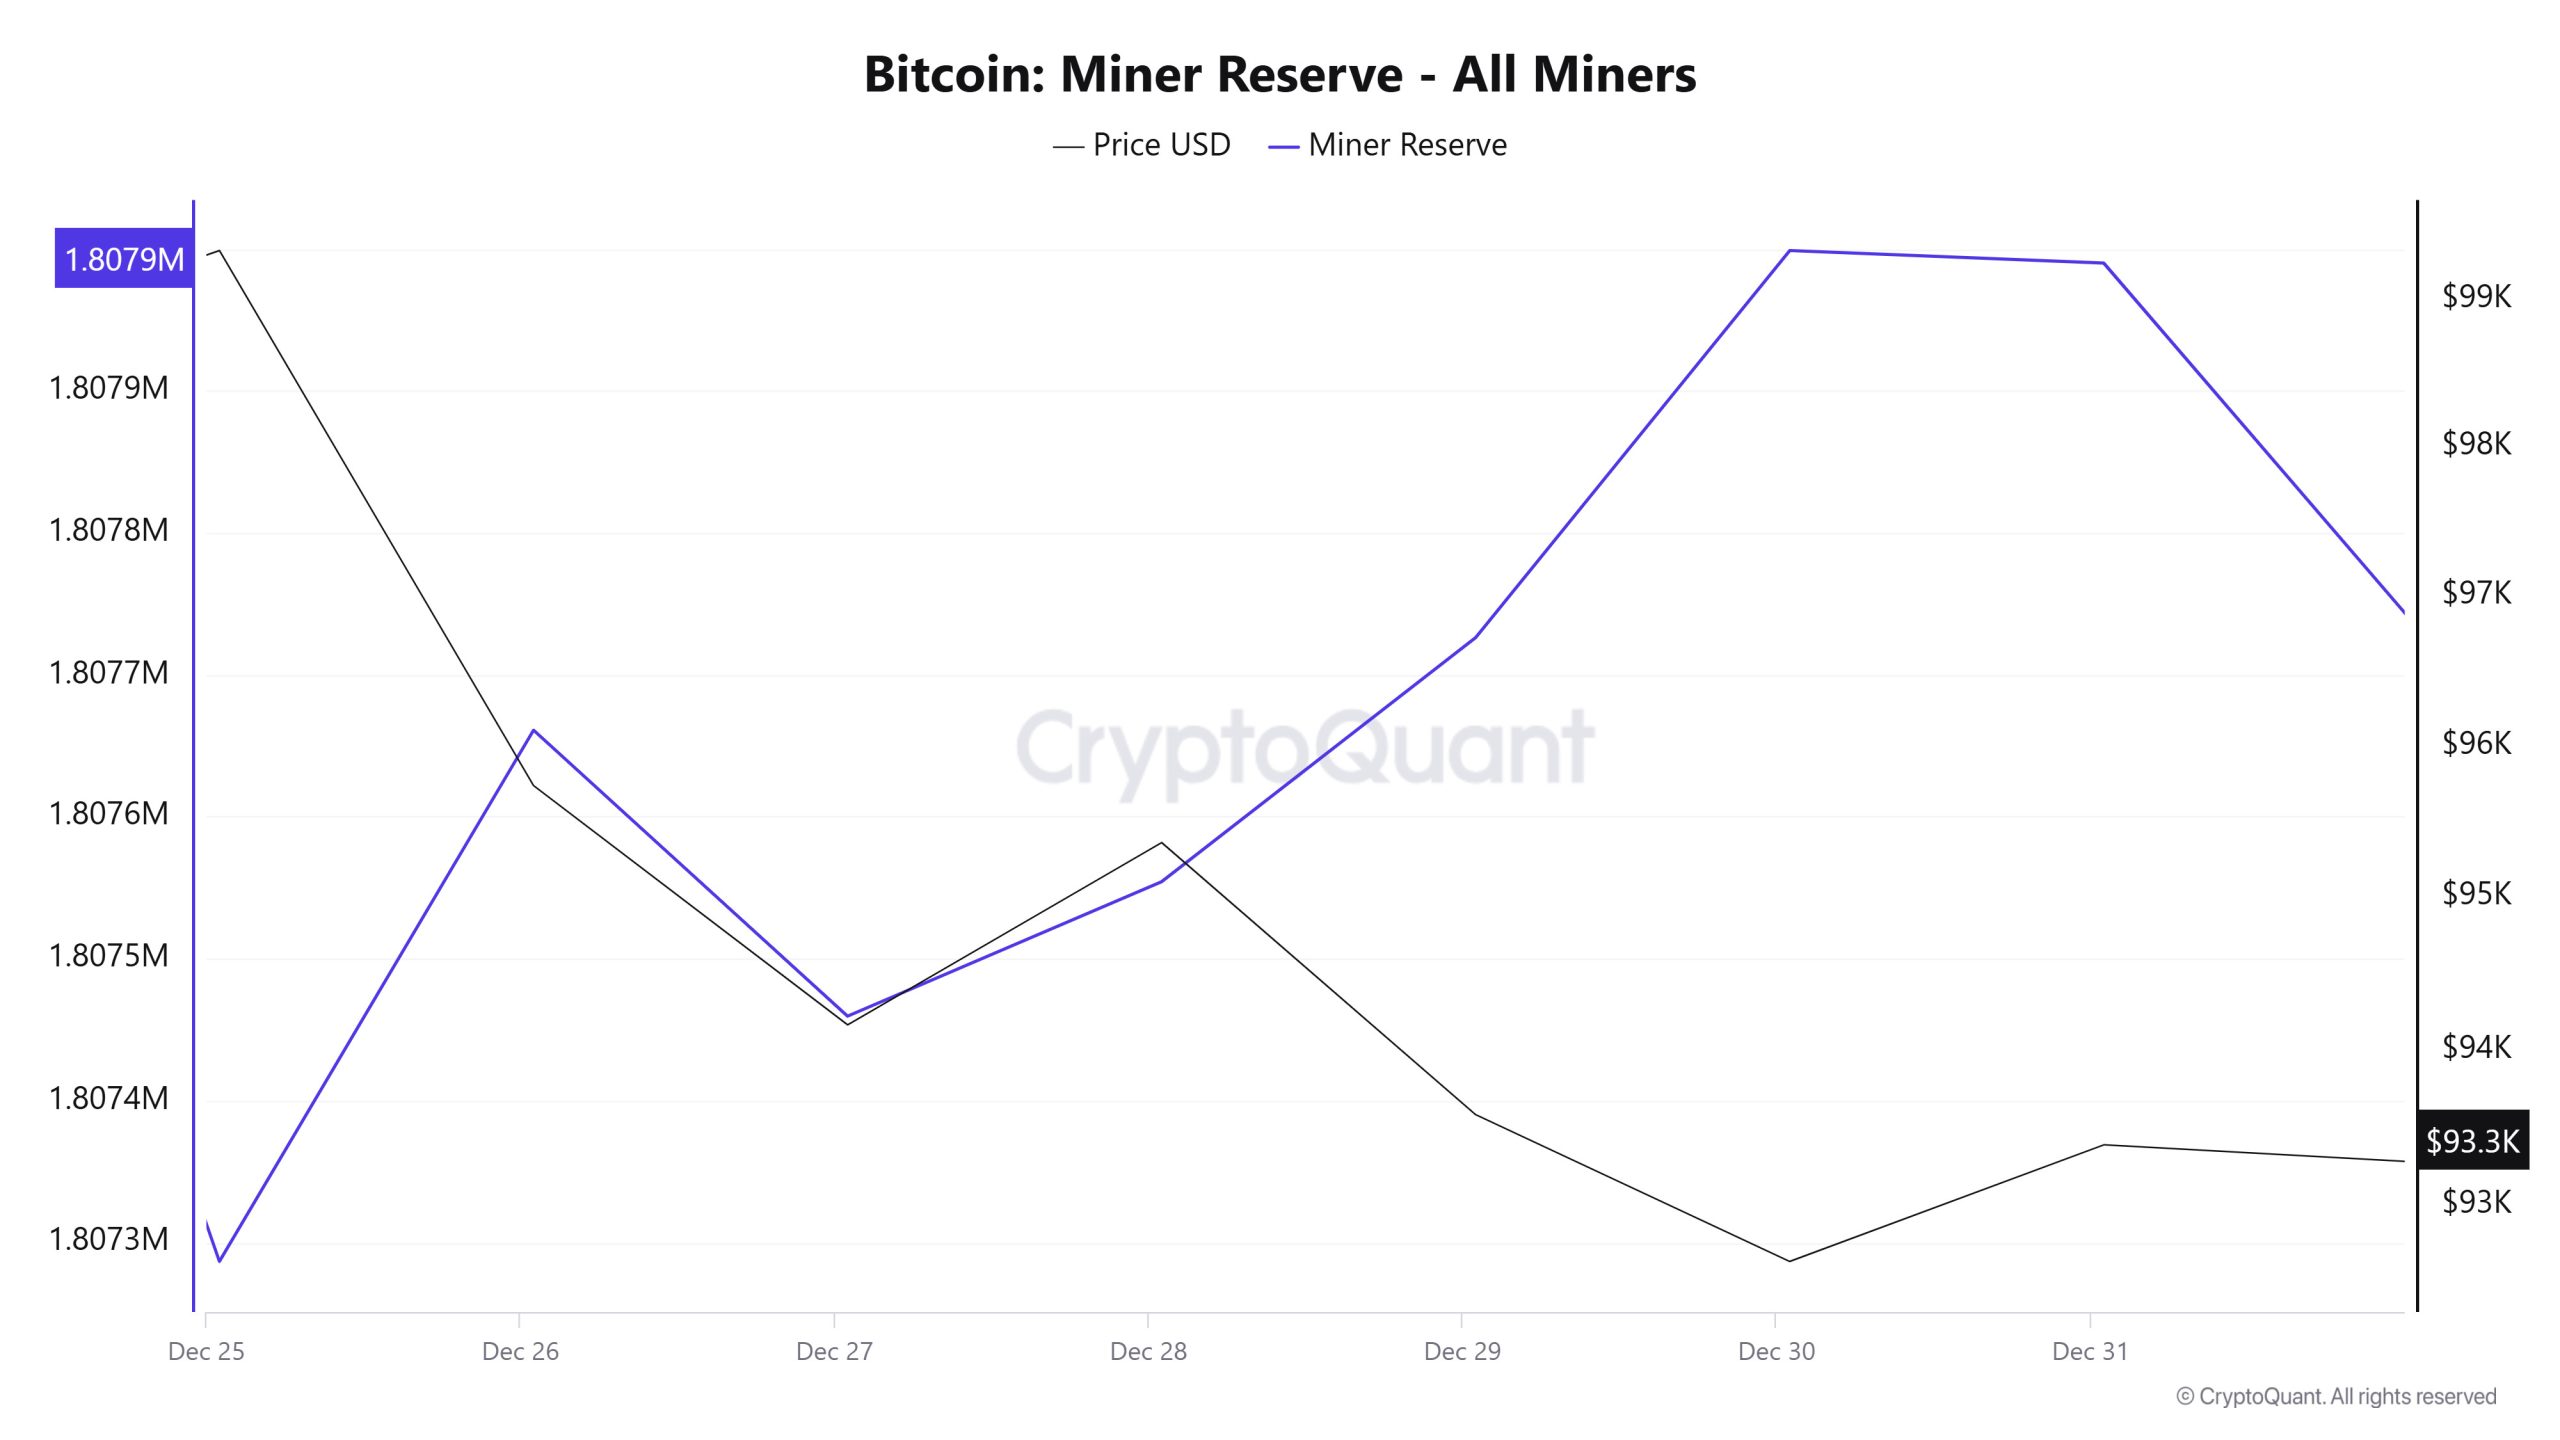
As seen in the Miner Reserve table, the number of Bitcoins in miners’ wallets increased throughout the week. At the beginning of the week, Miner Reserve and Bitcoin price were negatively correlated, but the correlation turned positive towards the end of the week.
Miner Inflow, Outflow and NetFlow
Between December 25 and December 31, 39,203 Bitcoins exited miners’ wallets and 39,267 Bitcoins entered miners’ wallets between the same dates. This week’s Miner Netflow was 64 Bitcoin. On December 25, the Bitcoin price was $99,341, while on December 31 it was $93,384.
During the week, the net flow (Miner Netflow) was generally positive as the inflow of Bitcoin into miner wallets (Miner Inflow) exceeded the outflow of Bitcoin from miner wallets (Miner Outflow).
If the recent negative correlation between Miner Reserve and Bitcoin price continues in the coming week, increased inflows to miner wallets may create a selling reaction in the market, and possible increases in Miner Netflow may have a downward impact on Bitcoin price.
Transactions
Transaction Count
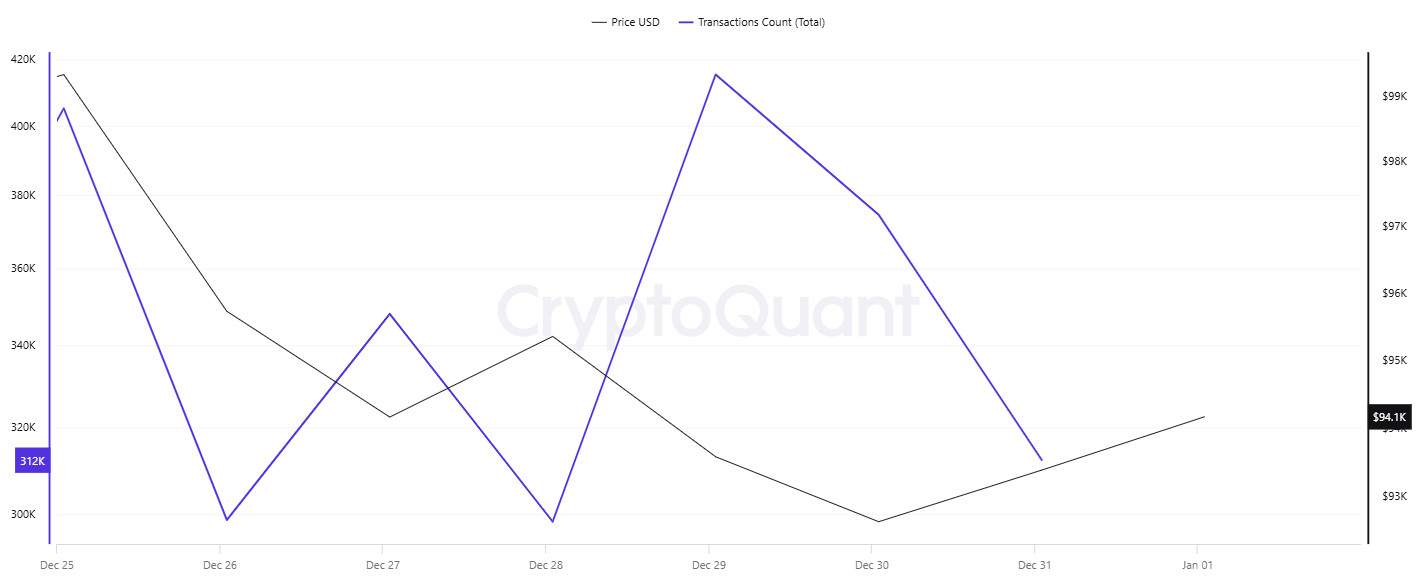
When examining Bitcoin transfers between December 25-31, fluctuations in both the Bitcoin price and the number of transfers on the network have been observed. Click here to view the bitcoin transfers on this date. On December 29, despite it being a weekend, the highest number of transfers was recorded with 415.000 transactions. Normally, weekends tend to have the lowest number of transfers, but the high transfer volume on December 29 could be linked to the end-of-year closure. During this period, transfers driven by profit-taking seem noteworthy.
In addition to the number of transfers, when looking at the daily Bitcoin transfer amounts, it is observed that on December 30, 871.000 Bitcoins were transferred, making it the day with the highest Bitcoin transfer amount of the week. Despite the lower Bitcoin transfer amounts on December 29, the high number of transfers suggests that small amounts of Bitcoin were transferred across various wallets, indicating a potential profit-taking activity.
Whale Activities
According to Chain Catcher, CryptoQuant CEO Ki Young Ju shared that by combining on-chain and off-chain data on the X platform, the Bitcoin network’s current total store of value has reached $1.03 trillion this year, an 85% increase. This shows us that whale accumulations have become the norm and that the Bitcoin bull market will continue. On the other hand, $72 million was deposited into a centralized exchange by a Bitcoin whale in the last 24 hours. This caused price fluctuations.
Whale Data
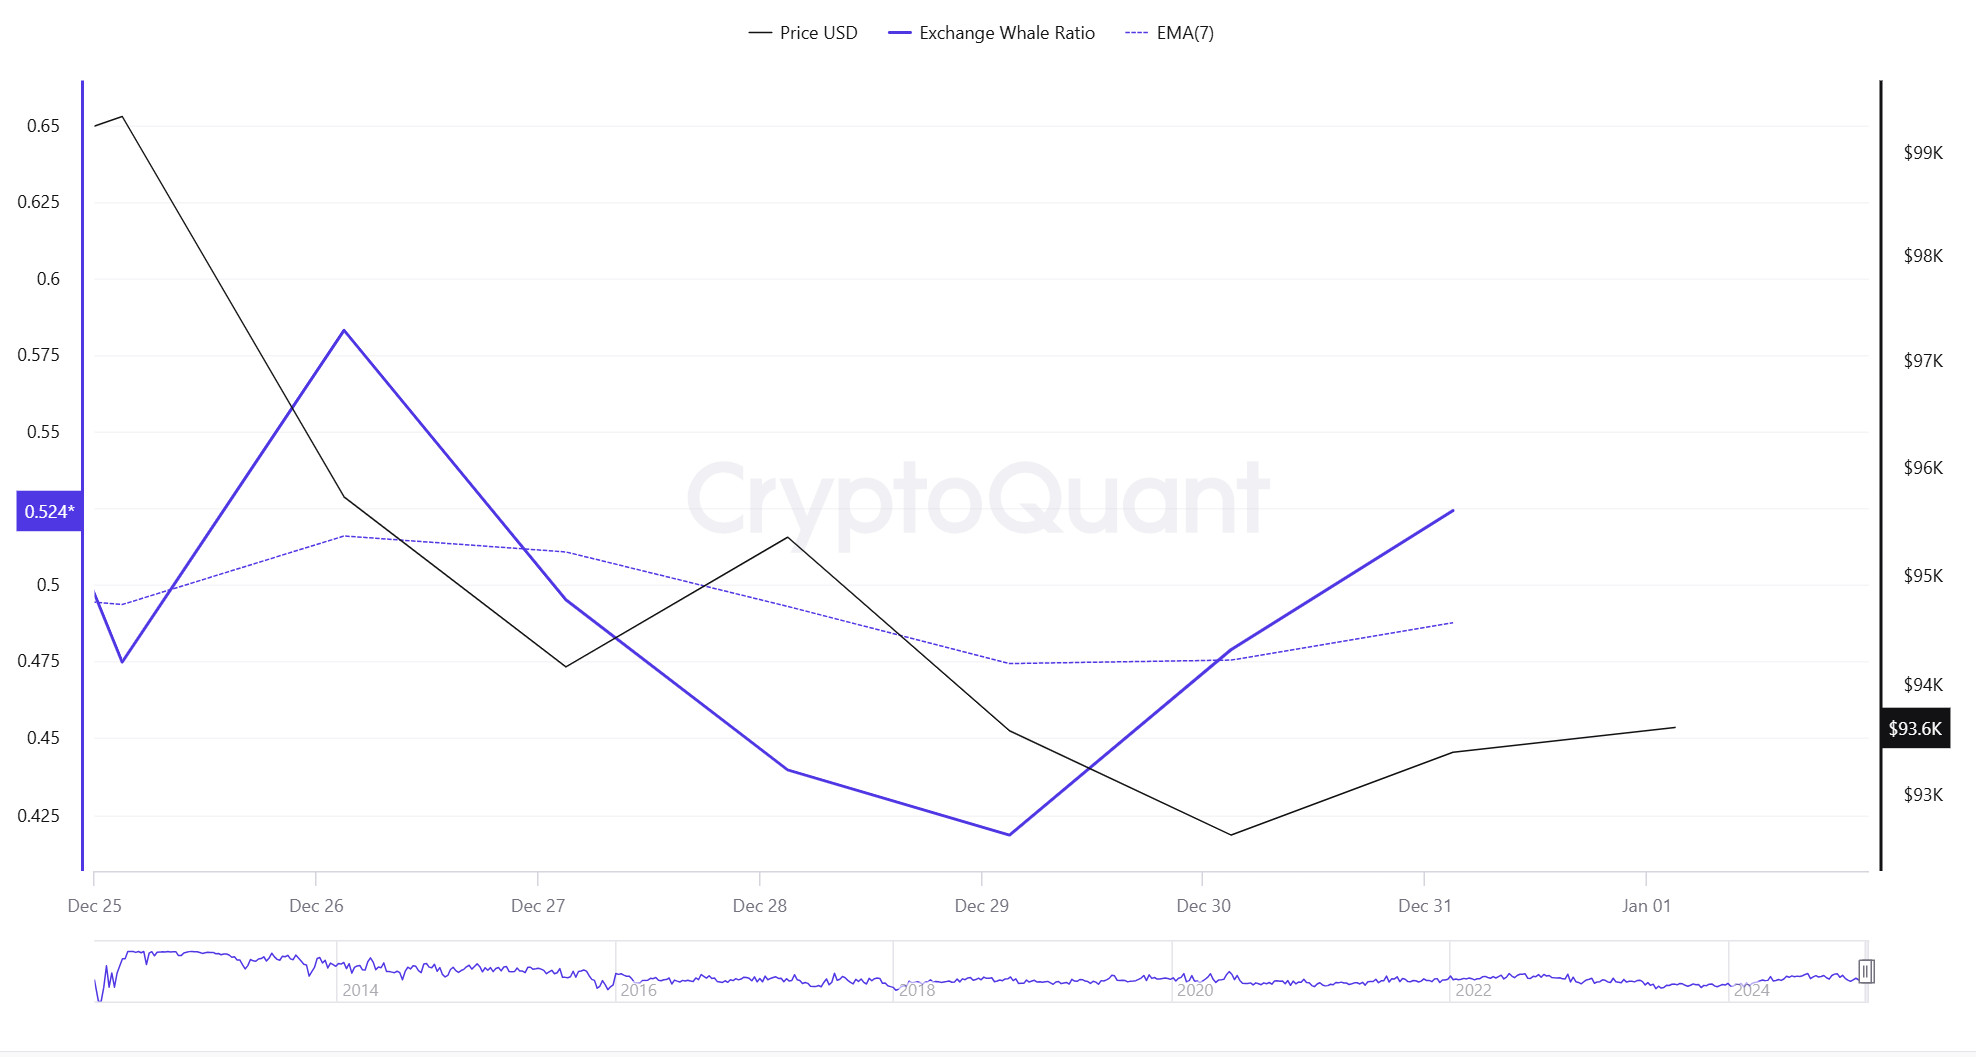
When we look at the last 7 days of whale movements, it shows that centralized exchanges are used more by whales. When we look at this rate, it is seen at a rate of 0.524, while central exchanges have been used less than the last 7 days. When this ratio is above 0.350, it usually means that whales often use central exchanges. This may mean that there may be selling pressure at any time. This week, more BTC sellers used centralized exchanges. At the same time, when we look at the total BTC transfer, we see that approximately 4,370,767 BTC moved, down from last week.
LEGAL NOTICE
The investment information, comments and recommendations contained in this document do not constitute investment advisory services. Investment advisory services are provided by authorized institutions on a personal basis, taking into account the risk and return preferences of individuals. The comments and recommendations contained in this document are of a general type. These recommendations may not be suitable for your financial situation and risk and return preferences. Therefore, making an investment decision based solely on the information contained in this document may not result in results that are in line with your expectations.
NOTE: All data used in Bitcoin onchain analysis is based on Cryptoqaunt.


