
Active Adresses
Active Sending Addresses
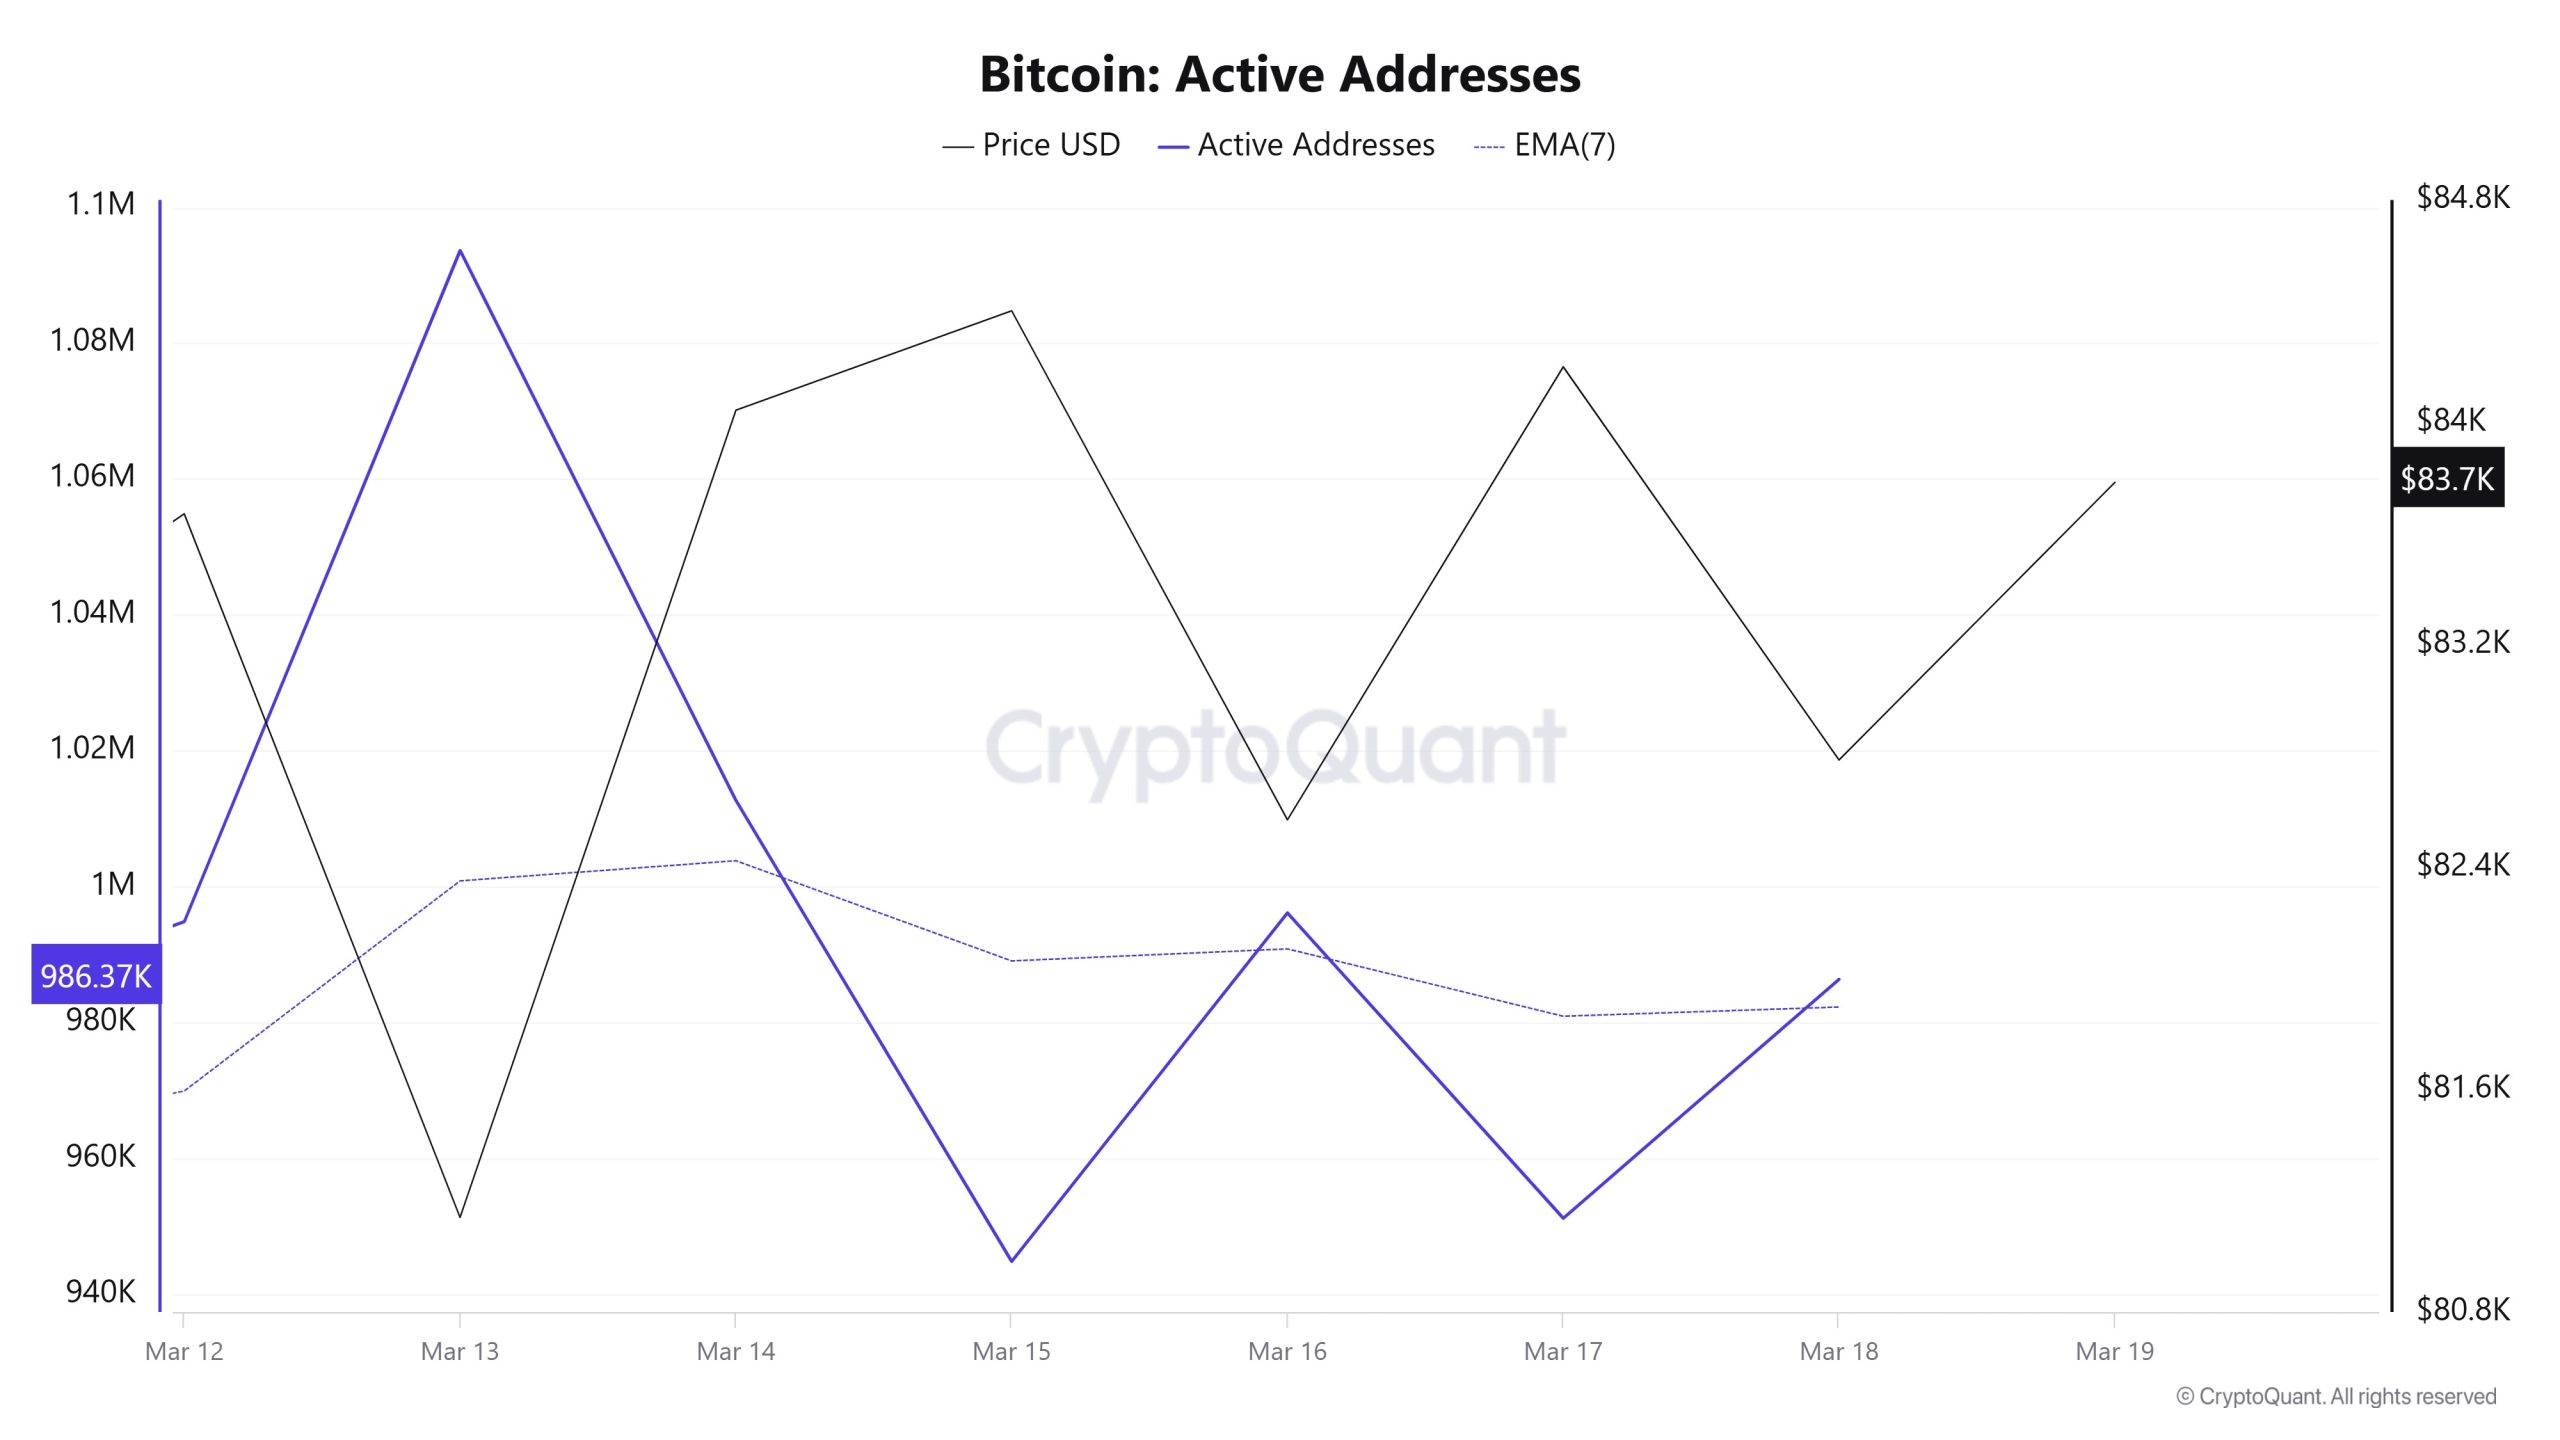
In terms of active addresses, there were 1,093,362 active entries to the BTC network between March 12 and March 19, 2025 this week. During this period, Bitcoin rose from $82,000 to $84,000. In the region marked on the chart, where the price and the number of active addresses intersect, we see that Bitcoin purchases have changed direction. When we follow the 7-day simple moving average, we observe that the price followed an upward trend on the dates when this average also crossed the price. This situation indicates that the Bitcoin price is experiencing entries at $ 82,000 levels.
Active Receiving Addresses
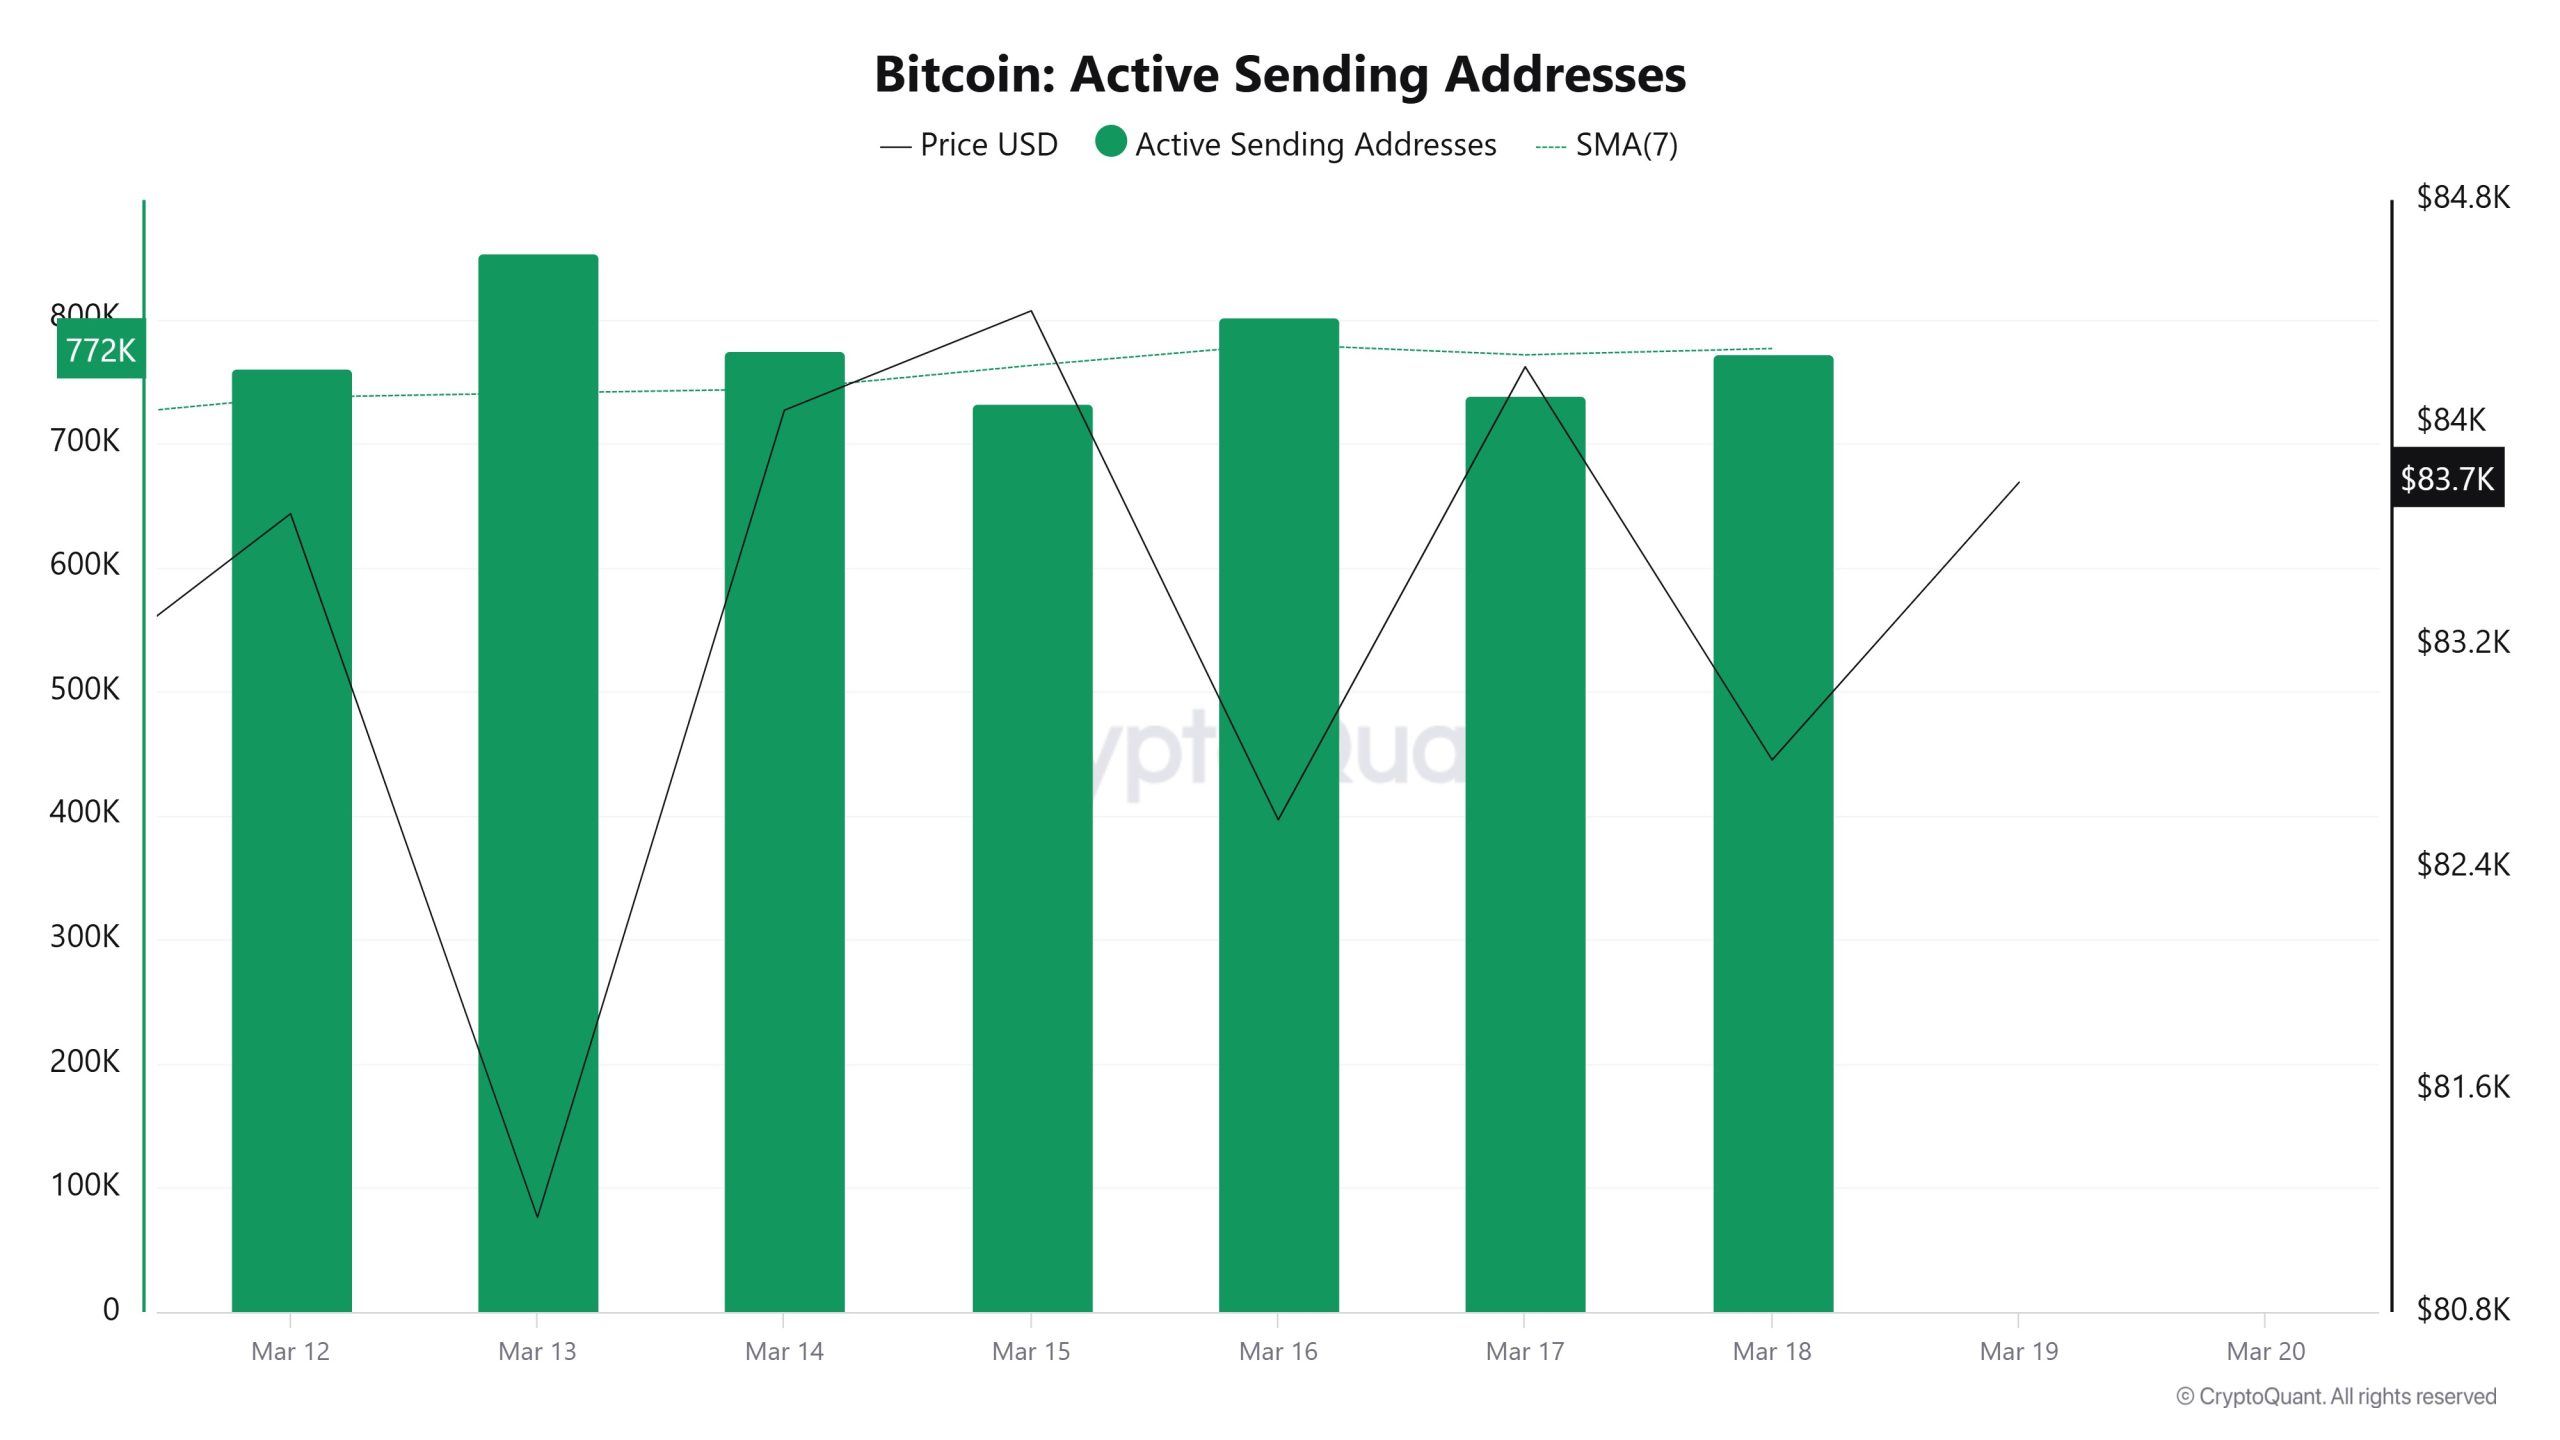
With the Black Line (price line) in active shipping addresses, there has been a significant drop in active shipping addresses after March 13. On the day when the price hit its lowest point, active sending addresses rose as high as 853,483 , indicating that buyers sold their positions as Bitcoin stayed around the $81,000 level for a while. As a result, price drops seem to cause an acceleration in sending addresses.
Breakdowns
MRVR
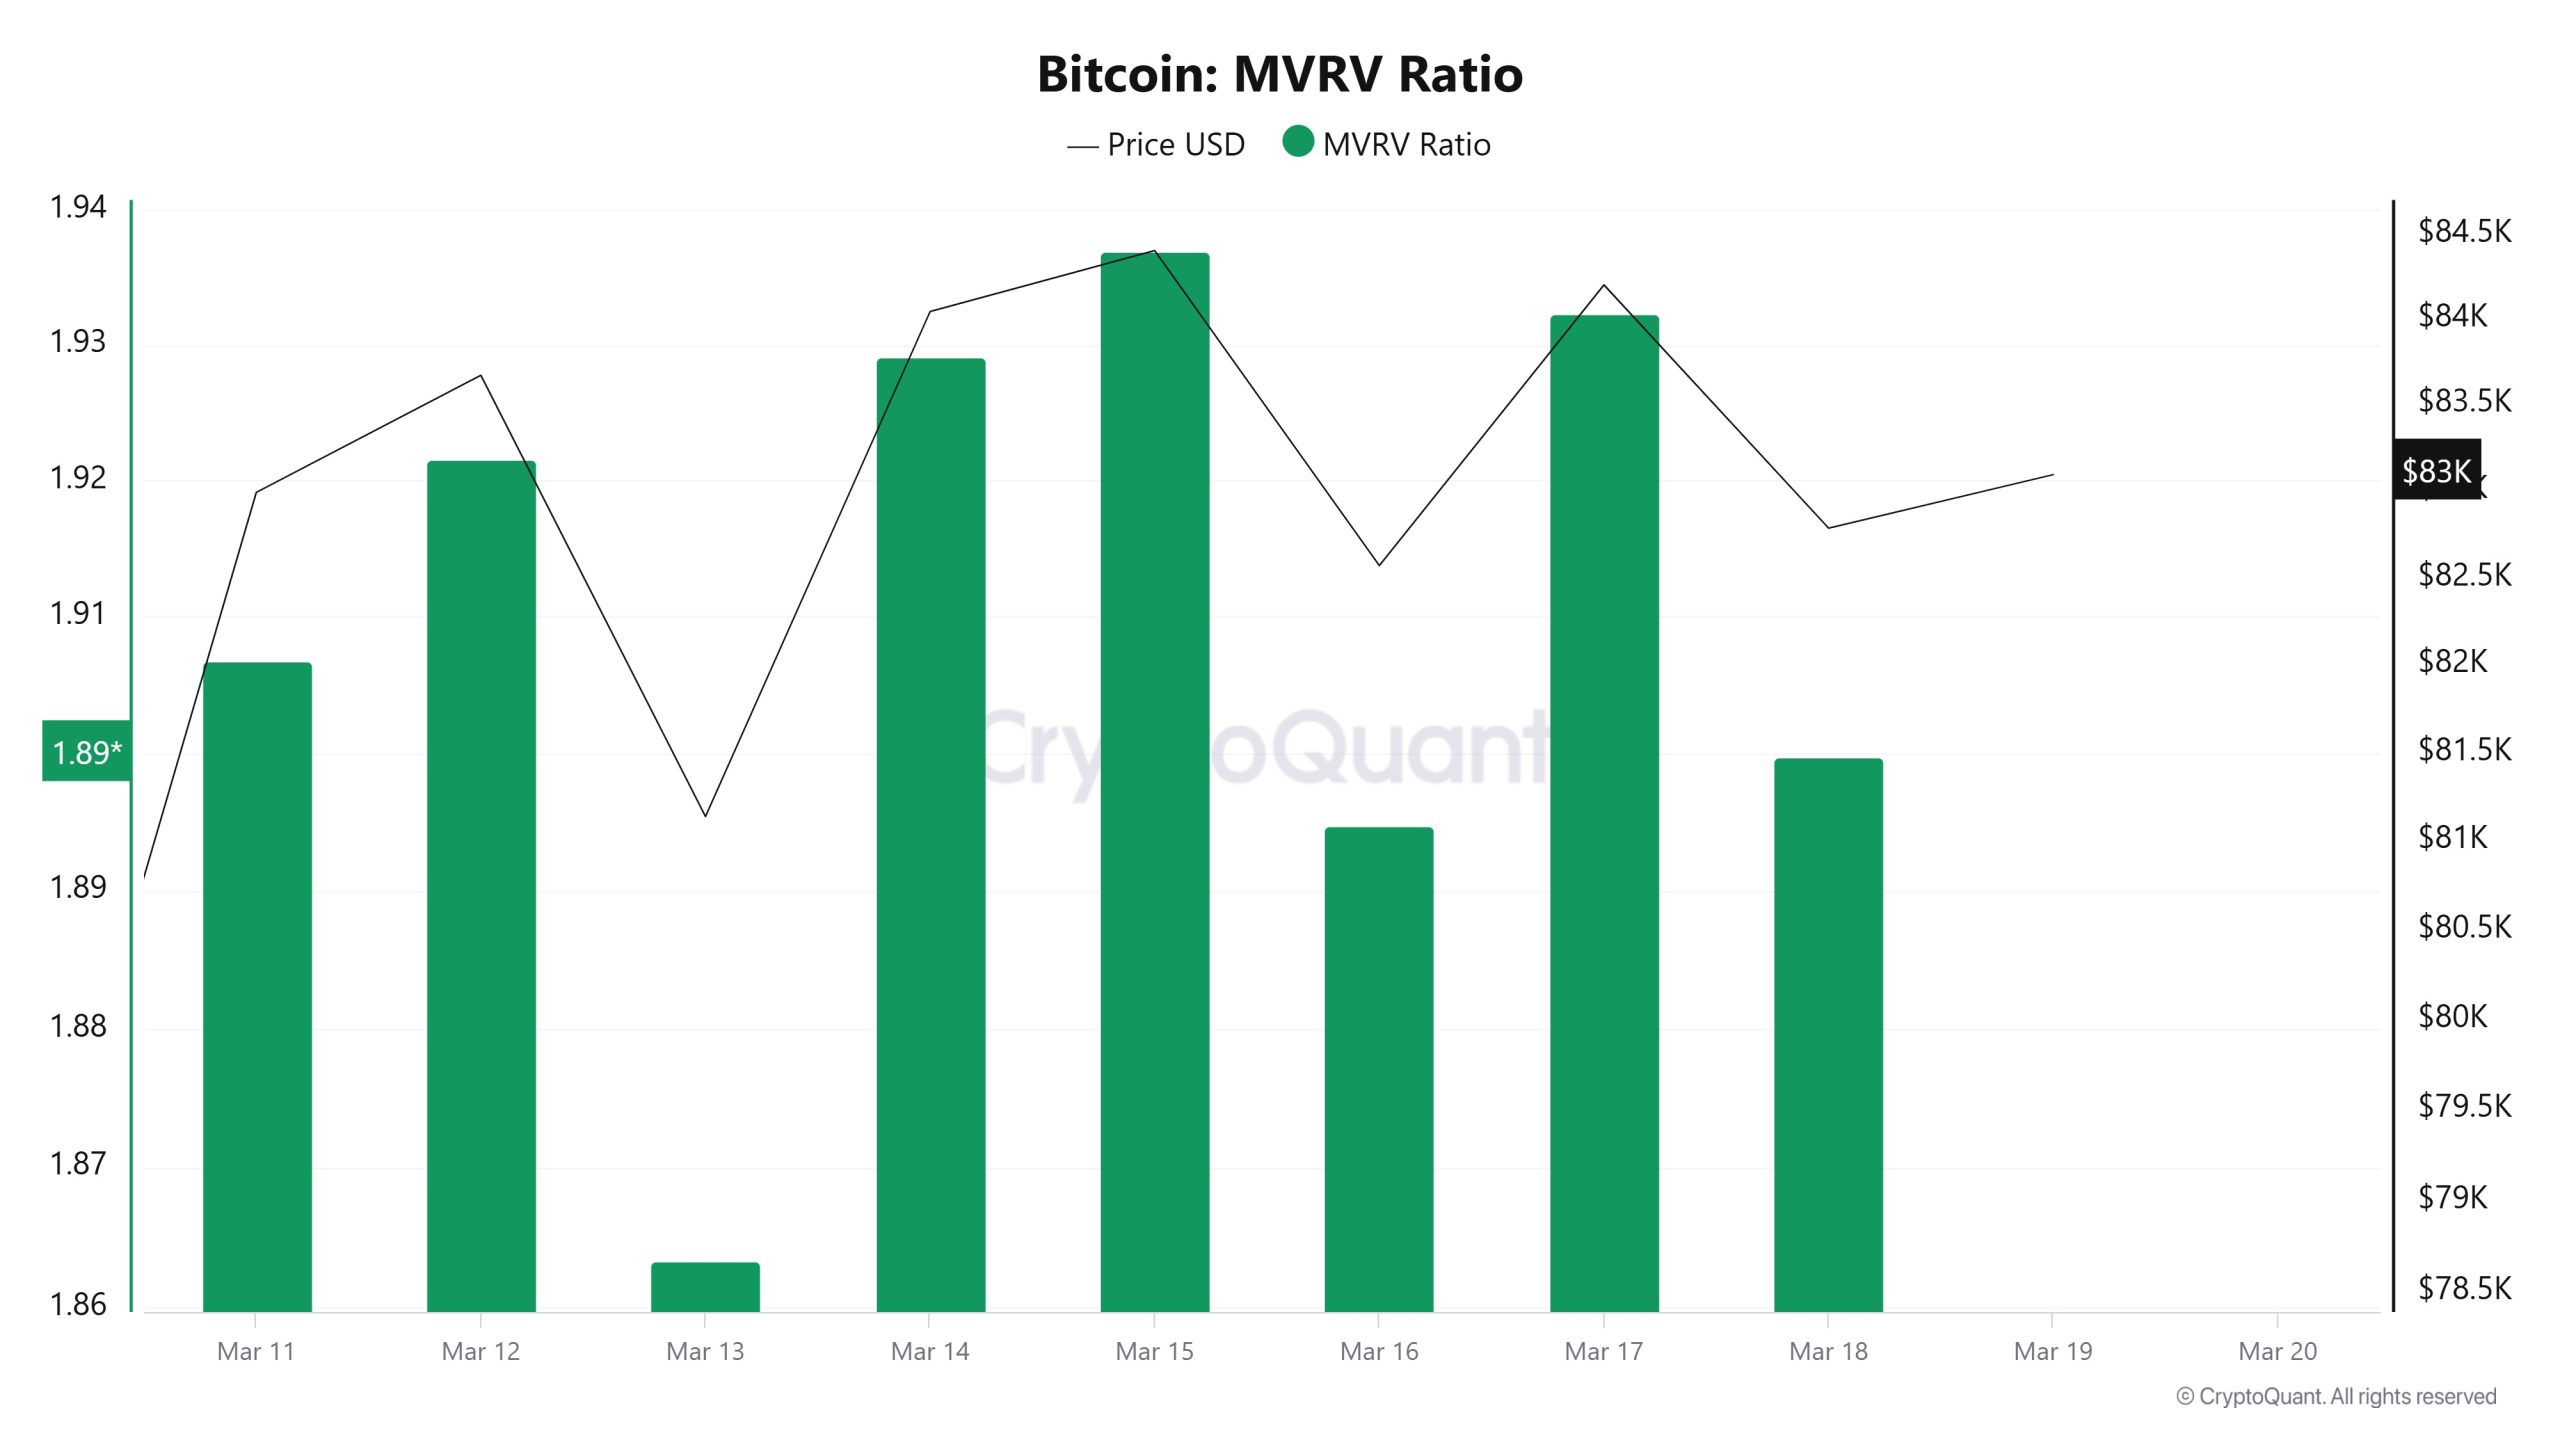
On March 12, the Bitcoin price was 83,671 while the MVRV Ratio was 1.92. As of March 18, the Bitcoin price was at 82,785, while the MVRV Ratio was at 1.89. Compared to last week, Bitcoin price decreased by 1.06% and MVRV Ratio decreased by 1.56%.
Realized Price
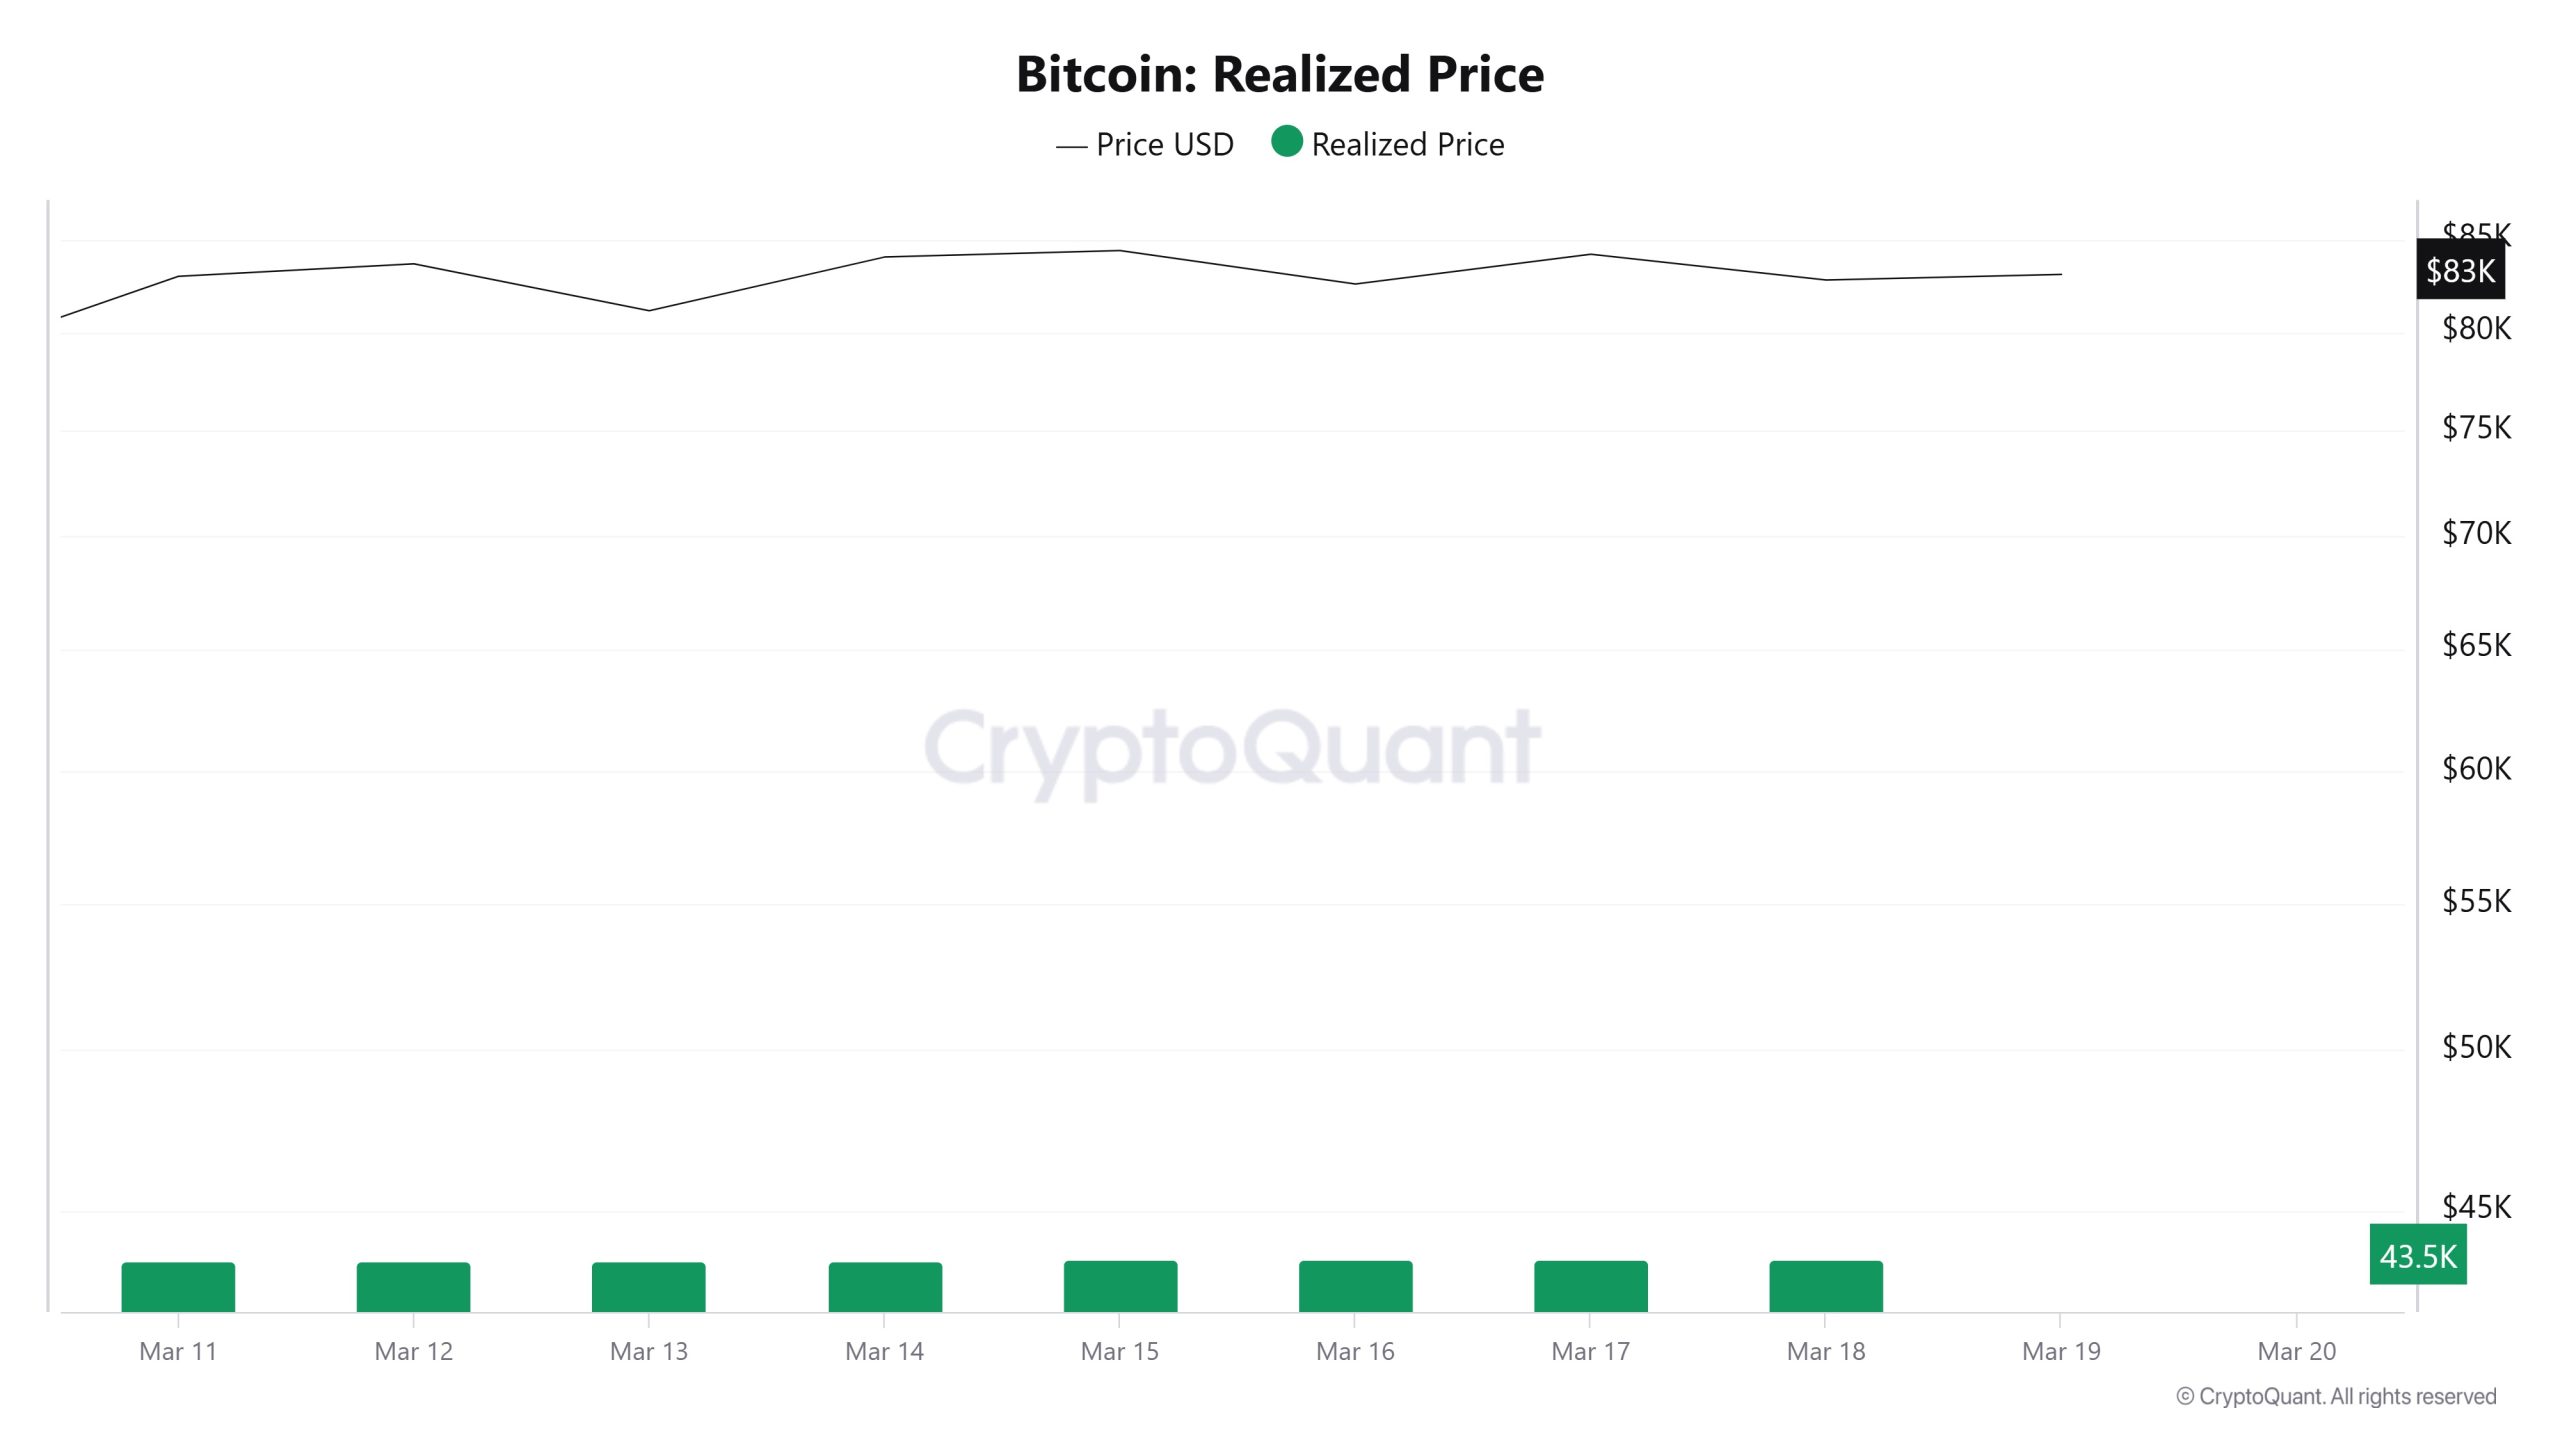
On March 12, Bitcoin price was 83,671 while Realized Price was 43,545. As of March 18, Bitcoin price was down to 82,785 while Realized Price was up to 43,576. Compared to last week, Bitcoin price decreased by 1.06% while Realized Price increased by 0.071%
Spent Output Profit Ratio (SOPR)
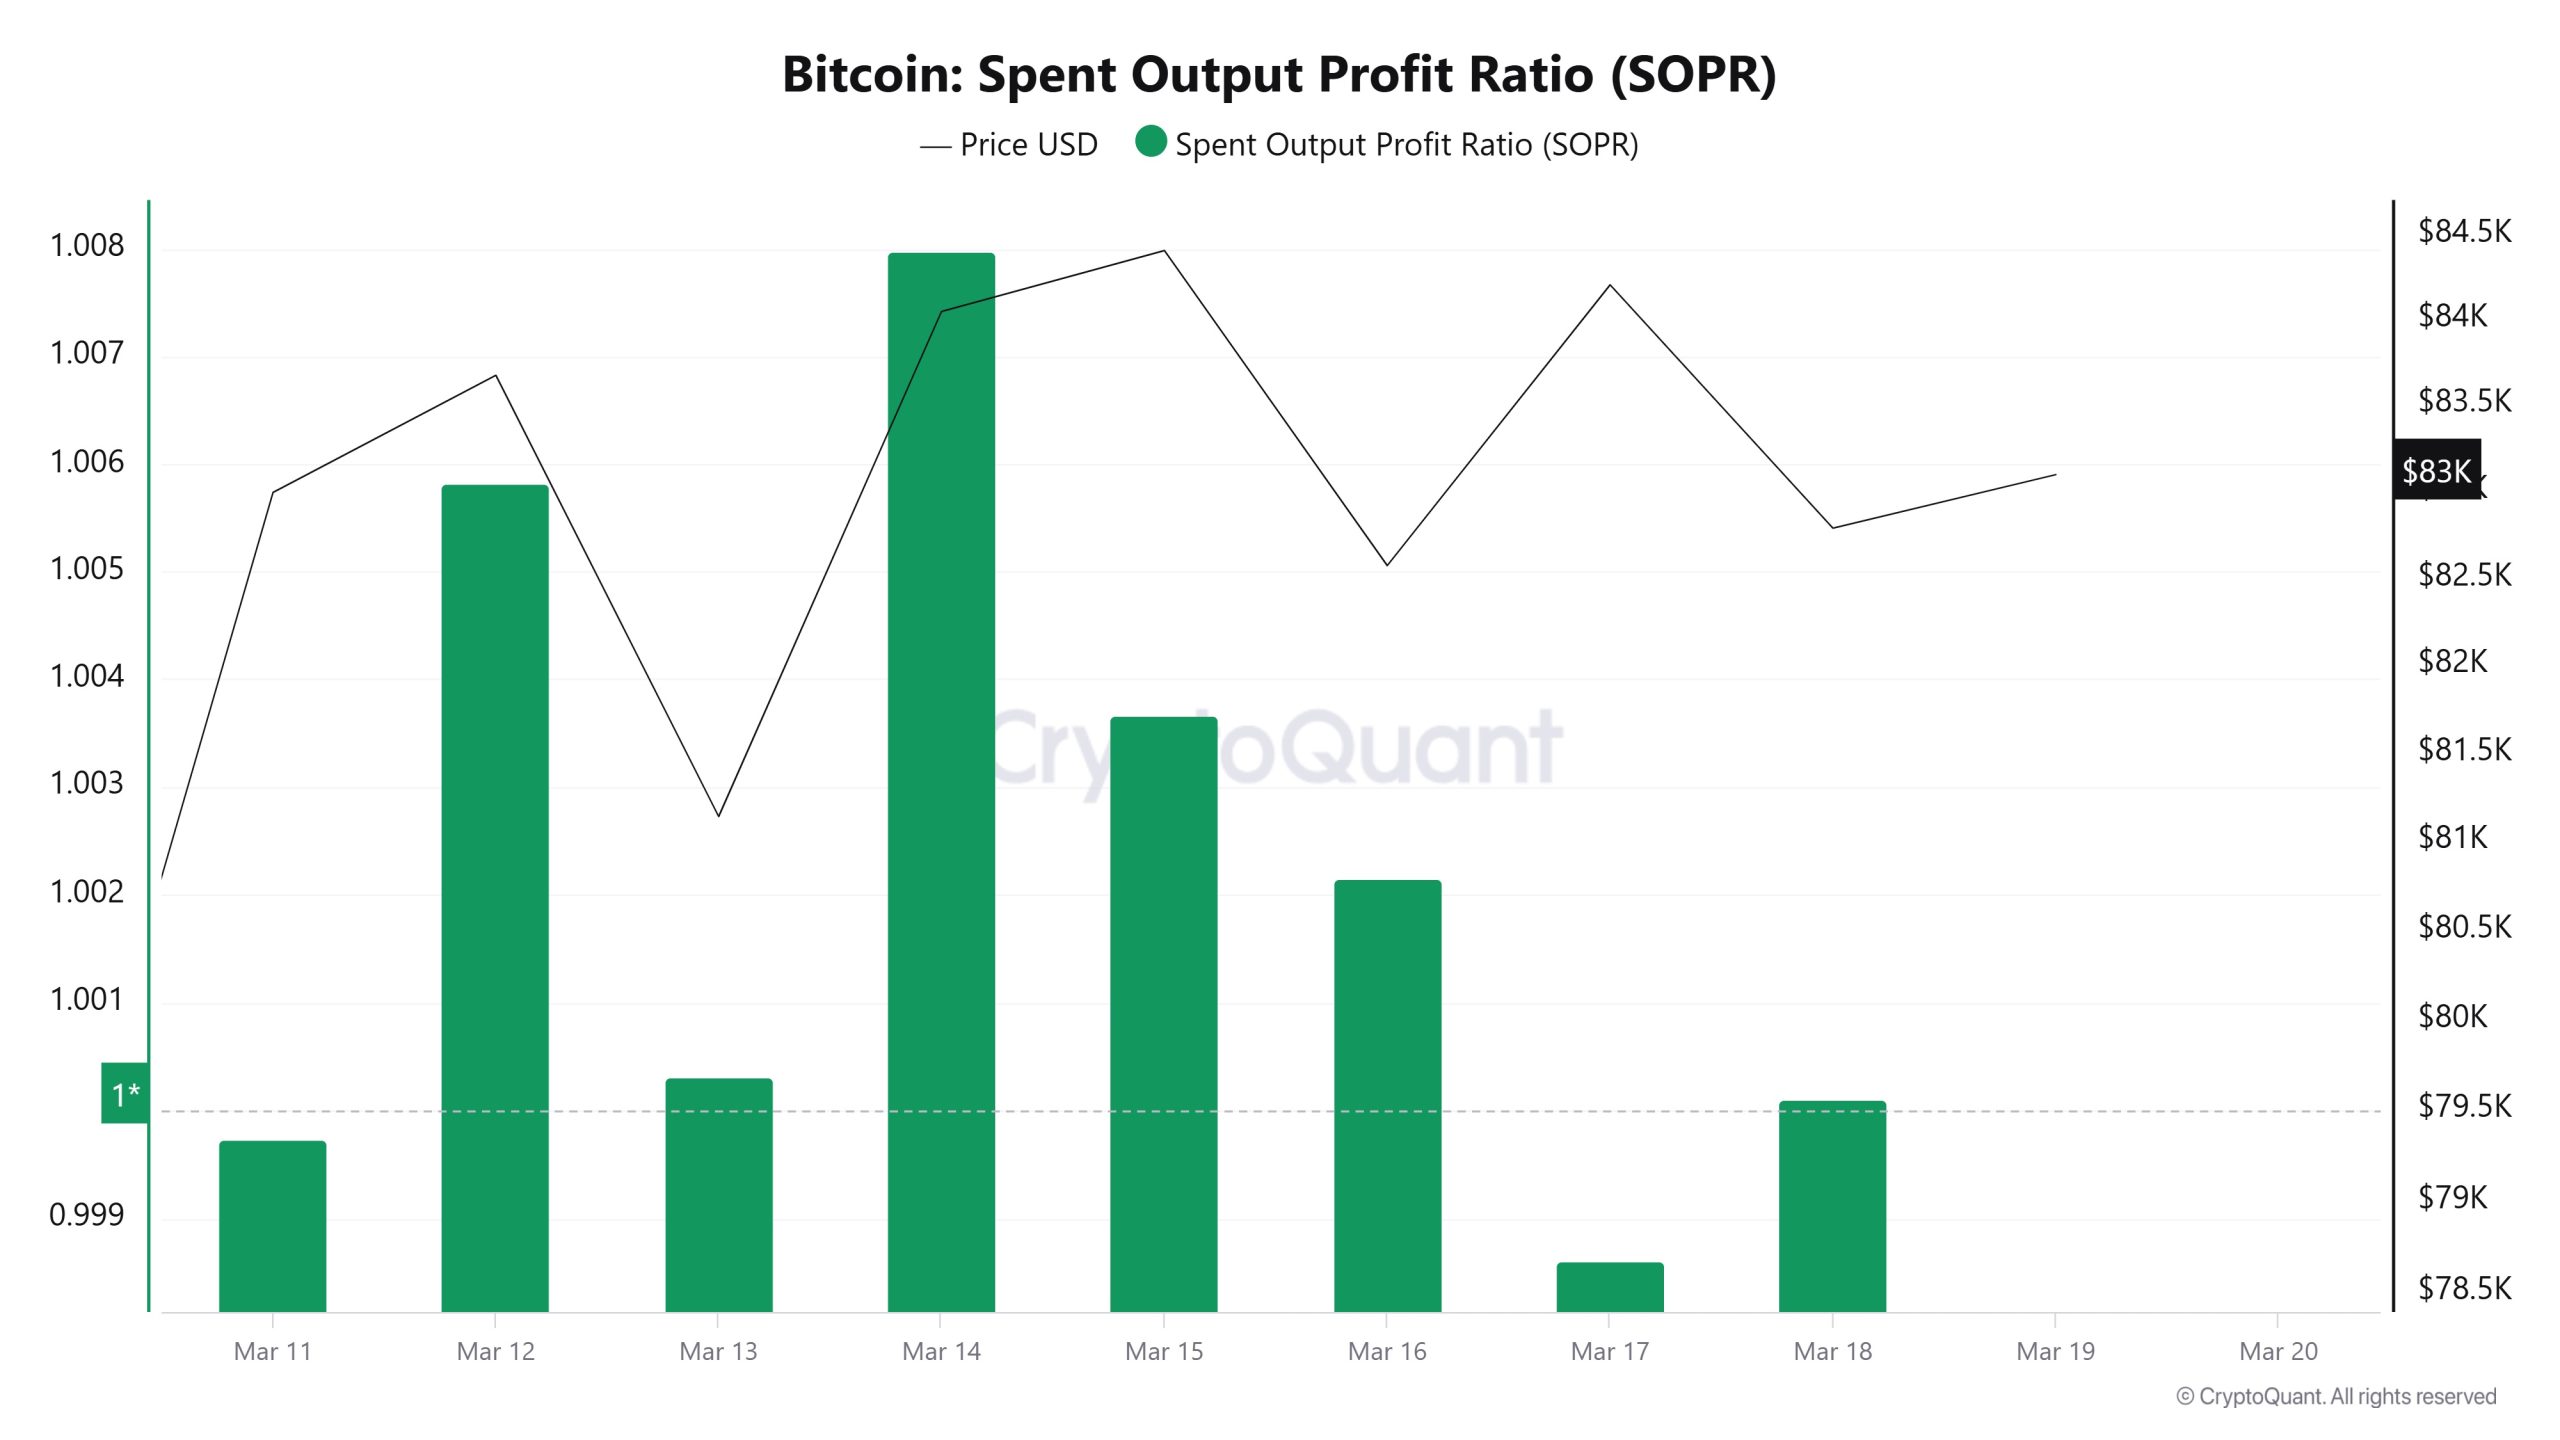
On March 12, the Bitcoin price was at 83,671, while the S
OPR metric was at 1. As of March 18, the Bitcoin price was down to 82,785 while the SOPR metric was stable at 1. Compared to last week, the Bitcoin price decreased by 1.06%, while the SOPR metric remained stable at the same level.
Derivatives
Open Interest
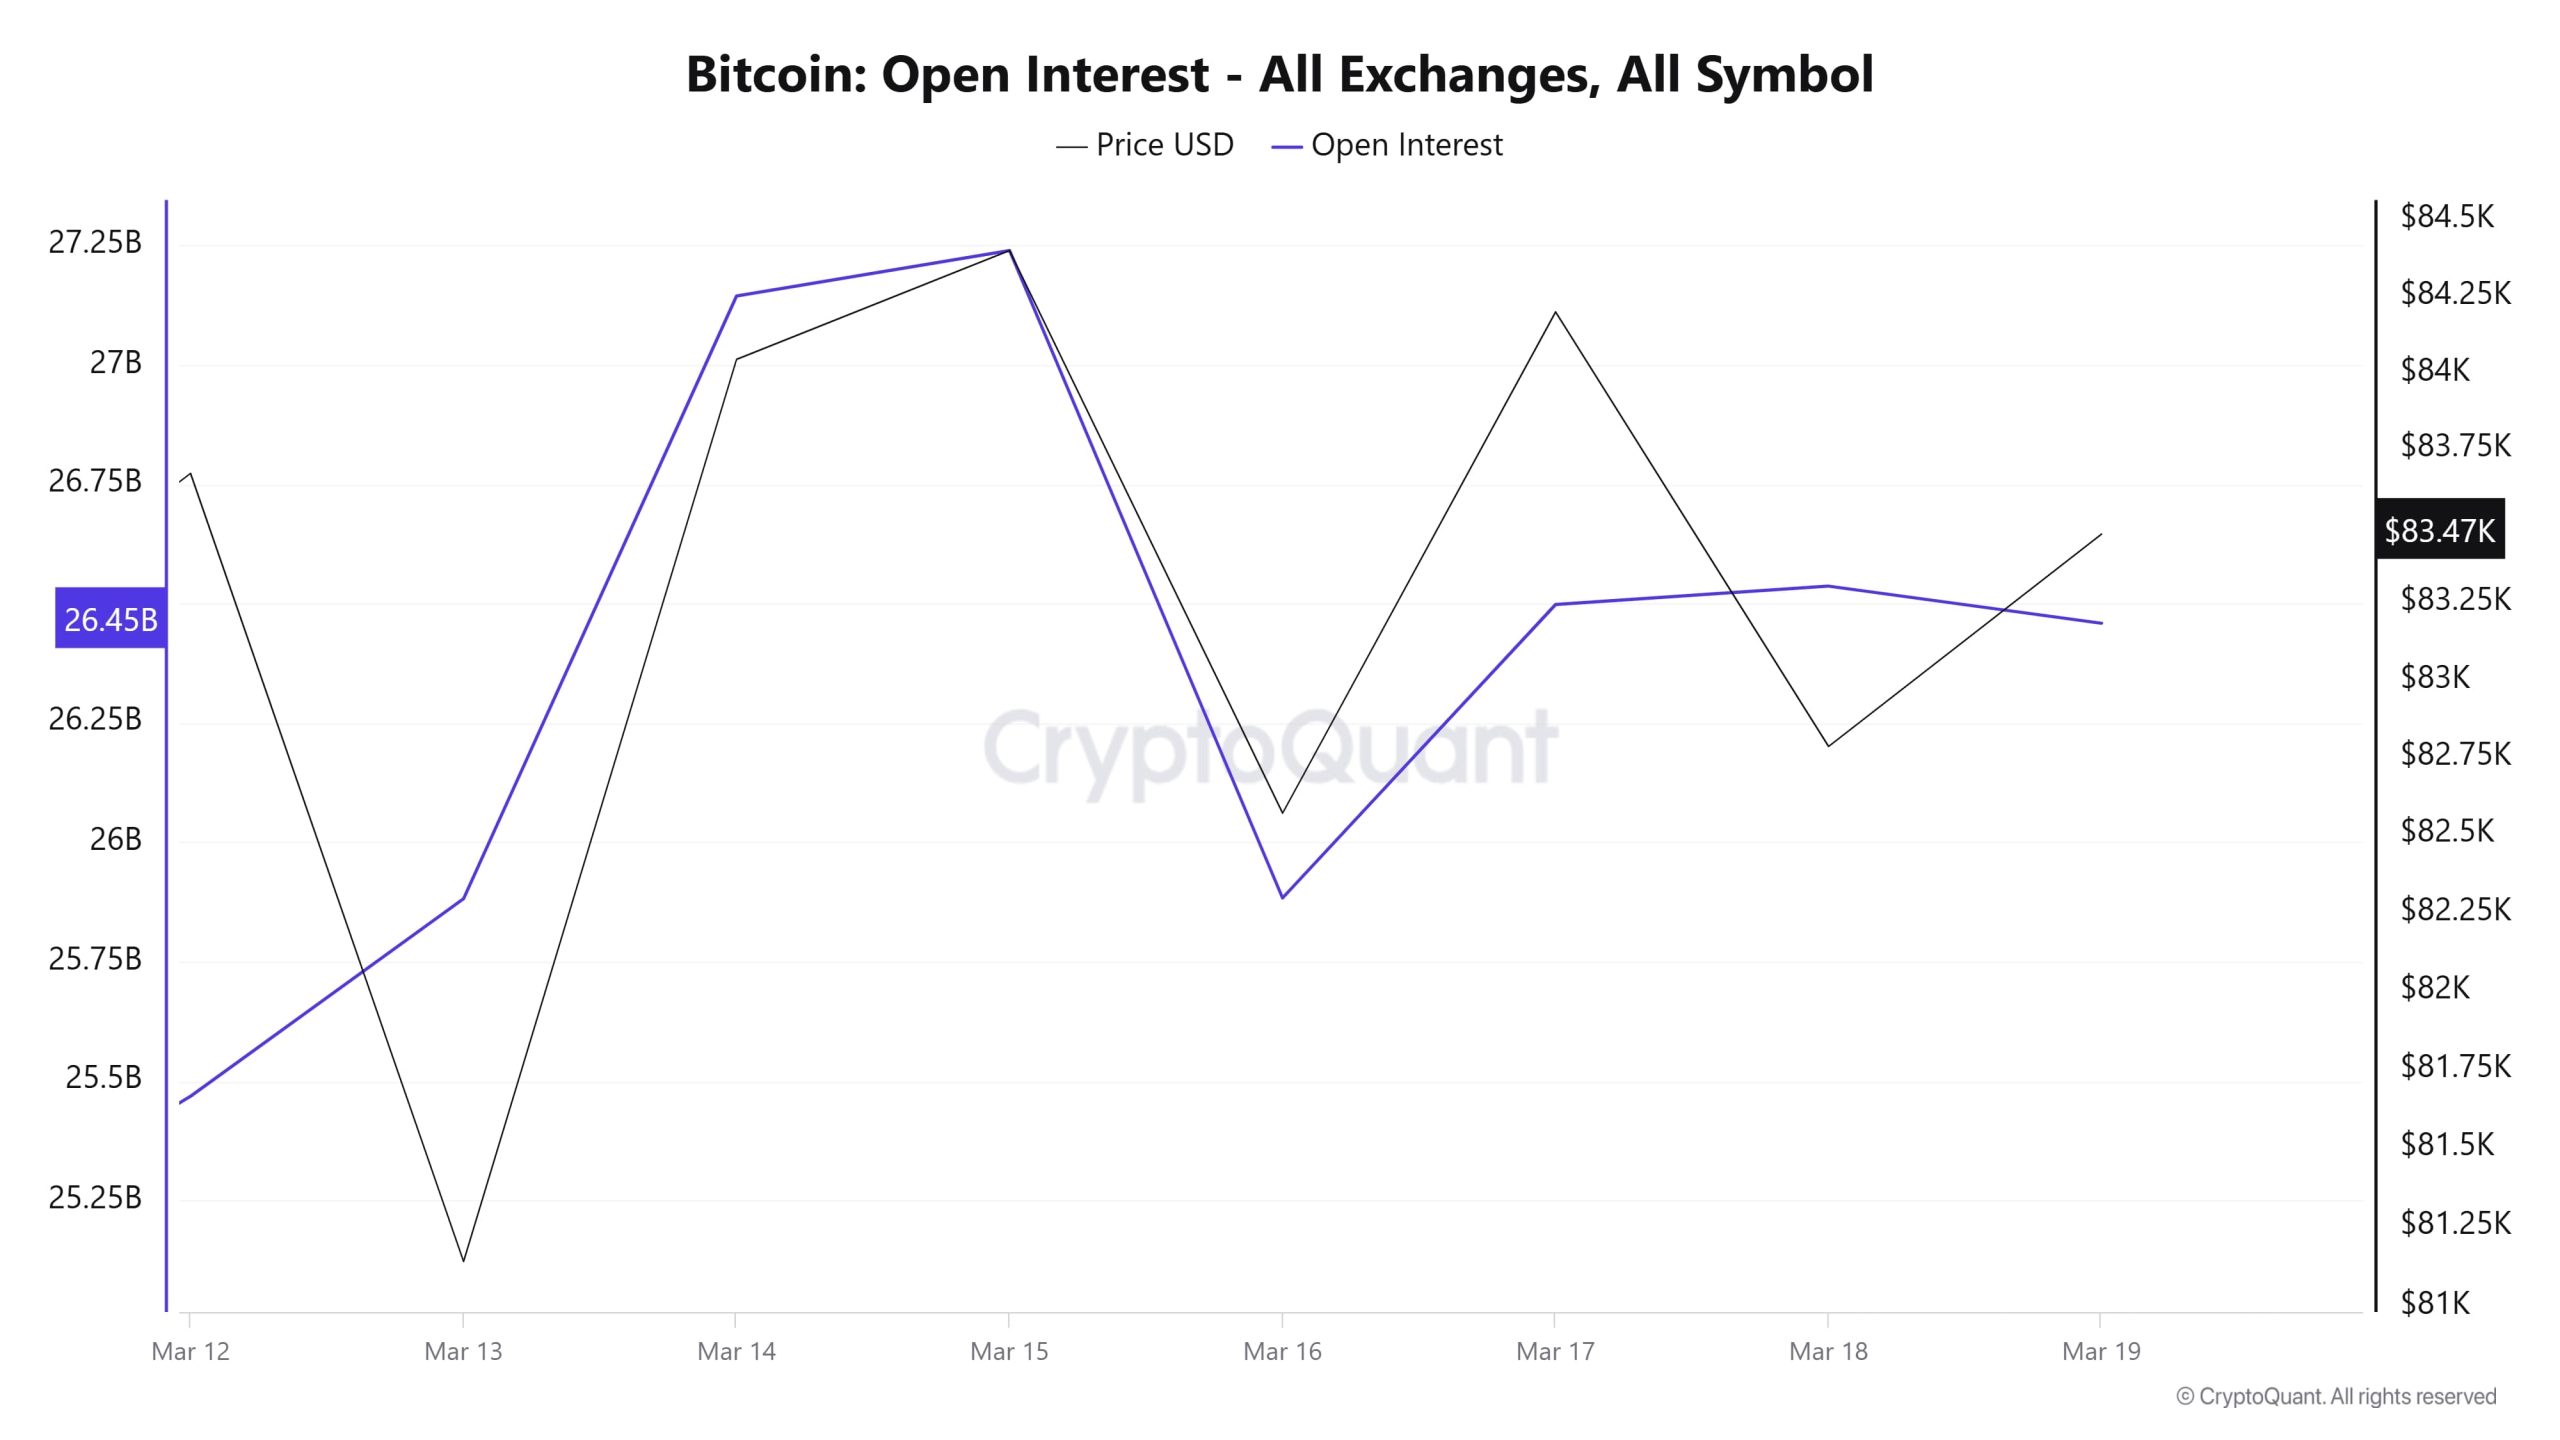
Looking at the data, open interest exhibits a fluctuating movement starting from 25.50 billion dollars. With a strong recovery, it rises above $27 billion. This also shows that some positions were closed in the short term but then re-entered the market. Around March 16, open interest declines again and then flattens out. The relationship between price and open interest is also remarkable. The fact that the price moves in parallel with the rise in open interest suggests that new liquidity is entering the market. On the other hand, the upward movement of the price at some points while open interest declines may indicate that leveraged positions are being liquidated or spot purchases are coming into play. The fact that open interest has moved sideways in recent days suggests that there is no clear directional preference in the market and investors are waiting.
Funding Rate
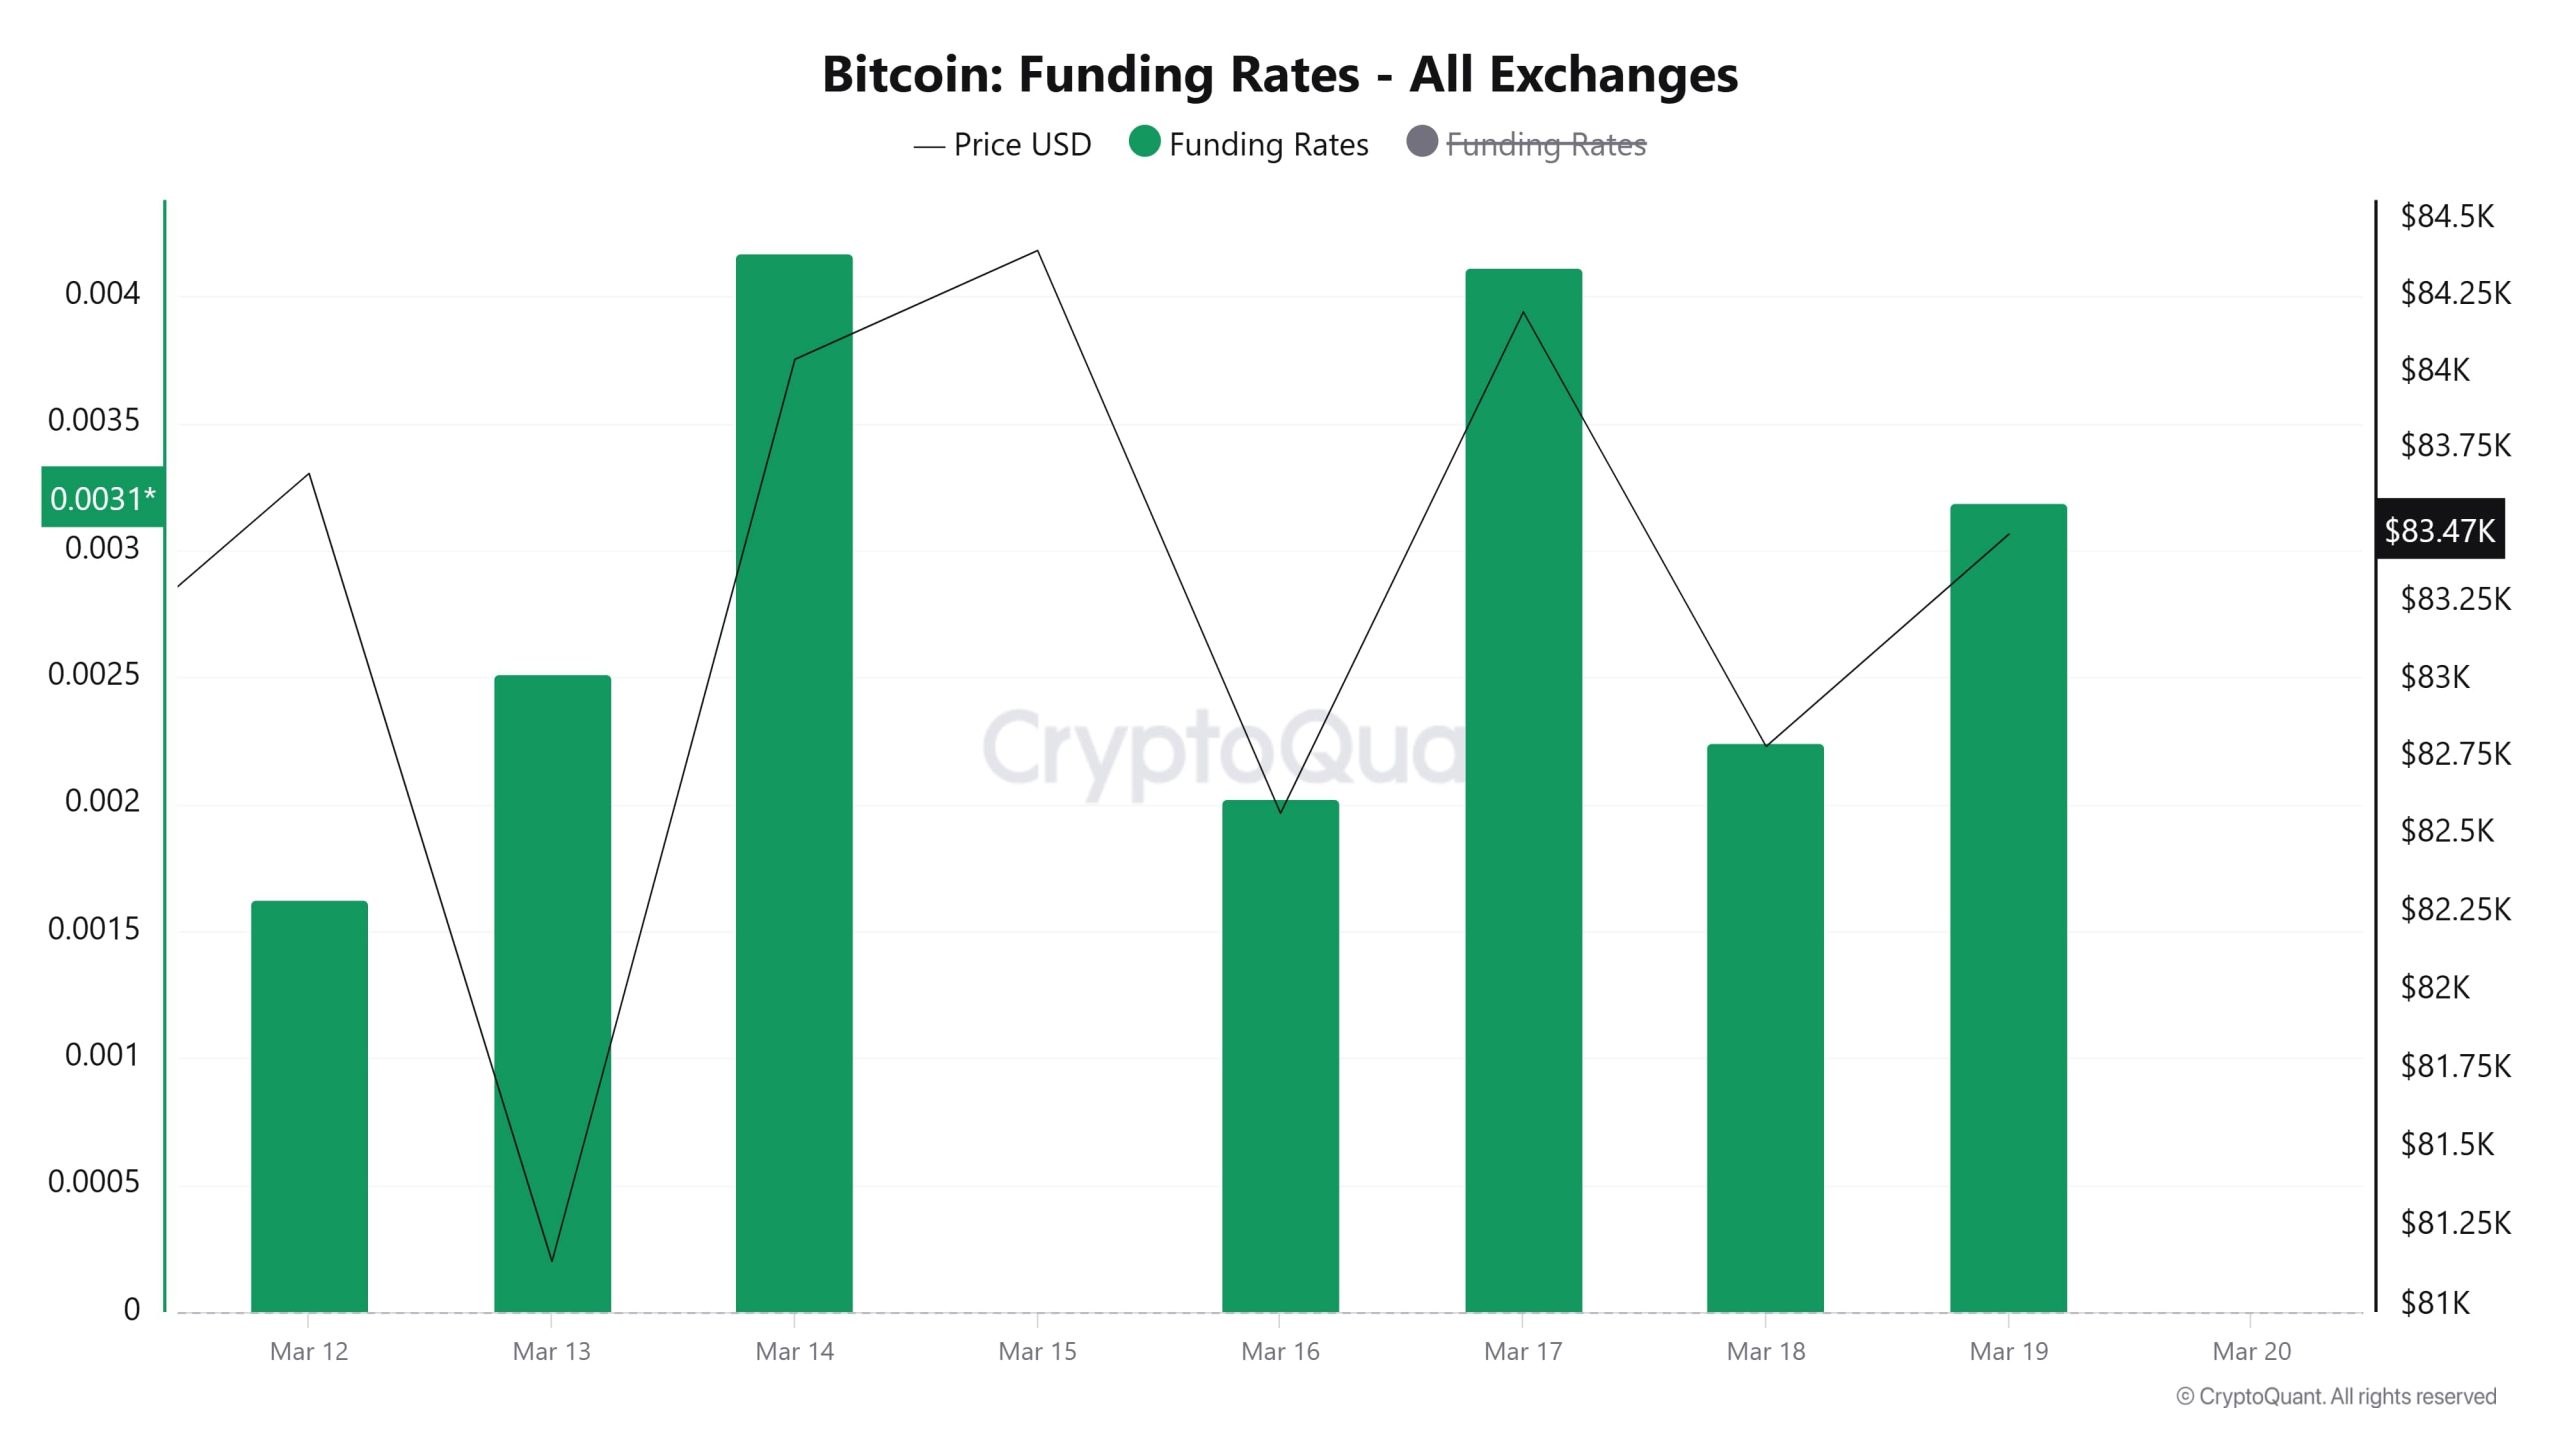
Over the last few days, funding rates have been generally positive. On March 13, there was a sudden drop, followed by a rebound in funding rates, reaching a peak on March 14. On March 16 , there was a decline, but funding rates recovered from this level and rose again on March 17. The rise in funding rates indicates that leveraged long positions have become dominant in the market. This activity may suggest that investors have high expectations that the price will move upwards. However, persistently high funding ratios may also indicate that the market has become overleveraged and potential liquidation risks have increased. As of March 19, funding ratios remained positive, indicating that the market is still long weighted.
Long & Short Liquidations
BTC, which moved sideways in a narrow range last week, rose as high as $84,000. With this price activity, long and short liquidations remained at low levels compared to previous weeks. 315 million dollars of long positions and 209 million dollars of short positions were liquidated.
| Date | Long Amount (Million $) | Short Amount (Million $) |
|---|---|---|
| March 12 | 74.98 | 52.82 |
| March 13 | 56.24 | 25.49 |
| March 14 | 23.45 | 50.10 |
| March 15 | 4.11 | 3.52 |
| March 16 | 76.56 | 26.04 |
| March 17 | 15.52 | 37.34 |
| March 18 | 64.80 | 13.97 |
| Total | 315.66 | 209.28 |
Supply Distribution
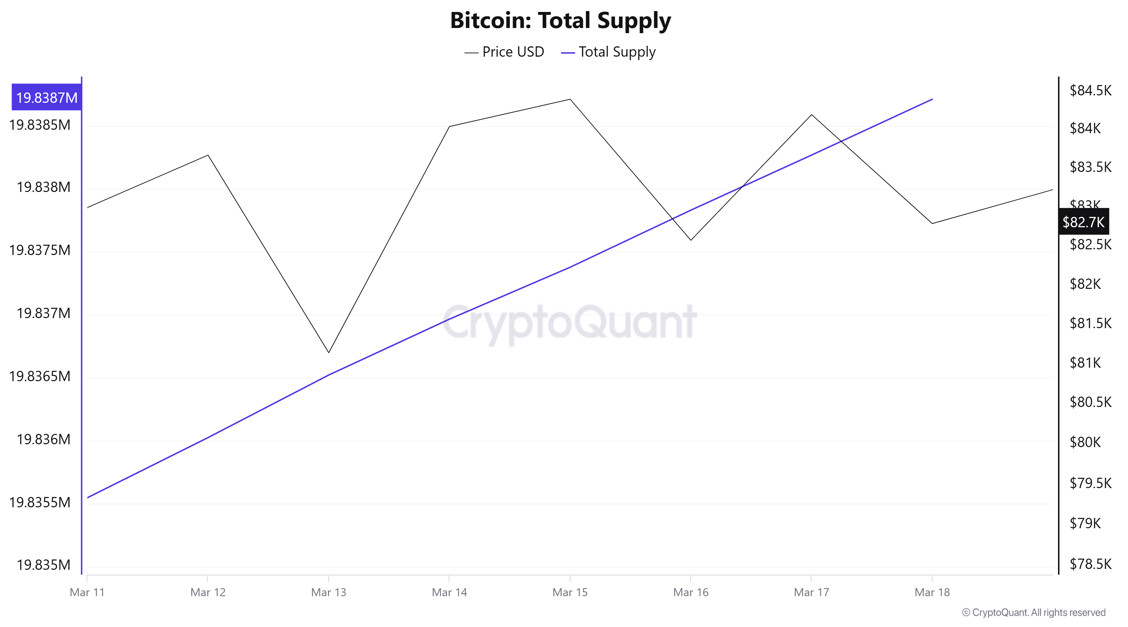
Total Supply: It reached 19,838,711 units, up about 0.01596% from last week.
New Supply: The amount of BTC produced this week was 3,165.
Velocity: Velocity, which was 13.74 last week, was 13.54 as of March 18.
| Wallet Category | 11.03.2025 | 18.03.2025 | Change (%) |
|---|---|---|---|
| < 1 BTC | 8.5343% | 8.5373% | 0.035% |
| 1 – 10 BTC | 11.759% | 11.77% | 0.094% |
| 10 – 100 BTC | 24.844% | 24.837% | -0.028% |
| 100 – 1k BTC | 28.17% | 28.064% | -0.0376% |
| 1k – 10k BTC | 18.258% | 18.417% | 0.0871% |
| 10k+ BTC | 8.431% | 8.373% | -0.688% |
When we look at the wallet distribution of the current supply, it is seen that there is an increase of 0.035% in the “< 1 BTC” category, where small investors are located. In the 1 – 10 BTC range, an increase of 0.094% is observed. While there was a slight decrease of 0.028% in the 10 – 100 BTC segment, it can be said that investors in this group remained largely stable. The 100 – 1K BTC category experienced a decrease of 0.376%, indicating that some of the mid-large investors reduced their holdings. 1K – 10K BTC holders saw an increase of 0.871%, while the 10K+ BTC category saw a decrease of 0.688%. This suggests that some of the large-scale investors changed their allocation, but there was no major movement overall
Exchange Reserve
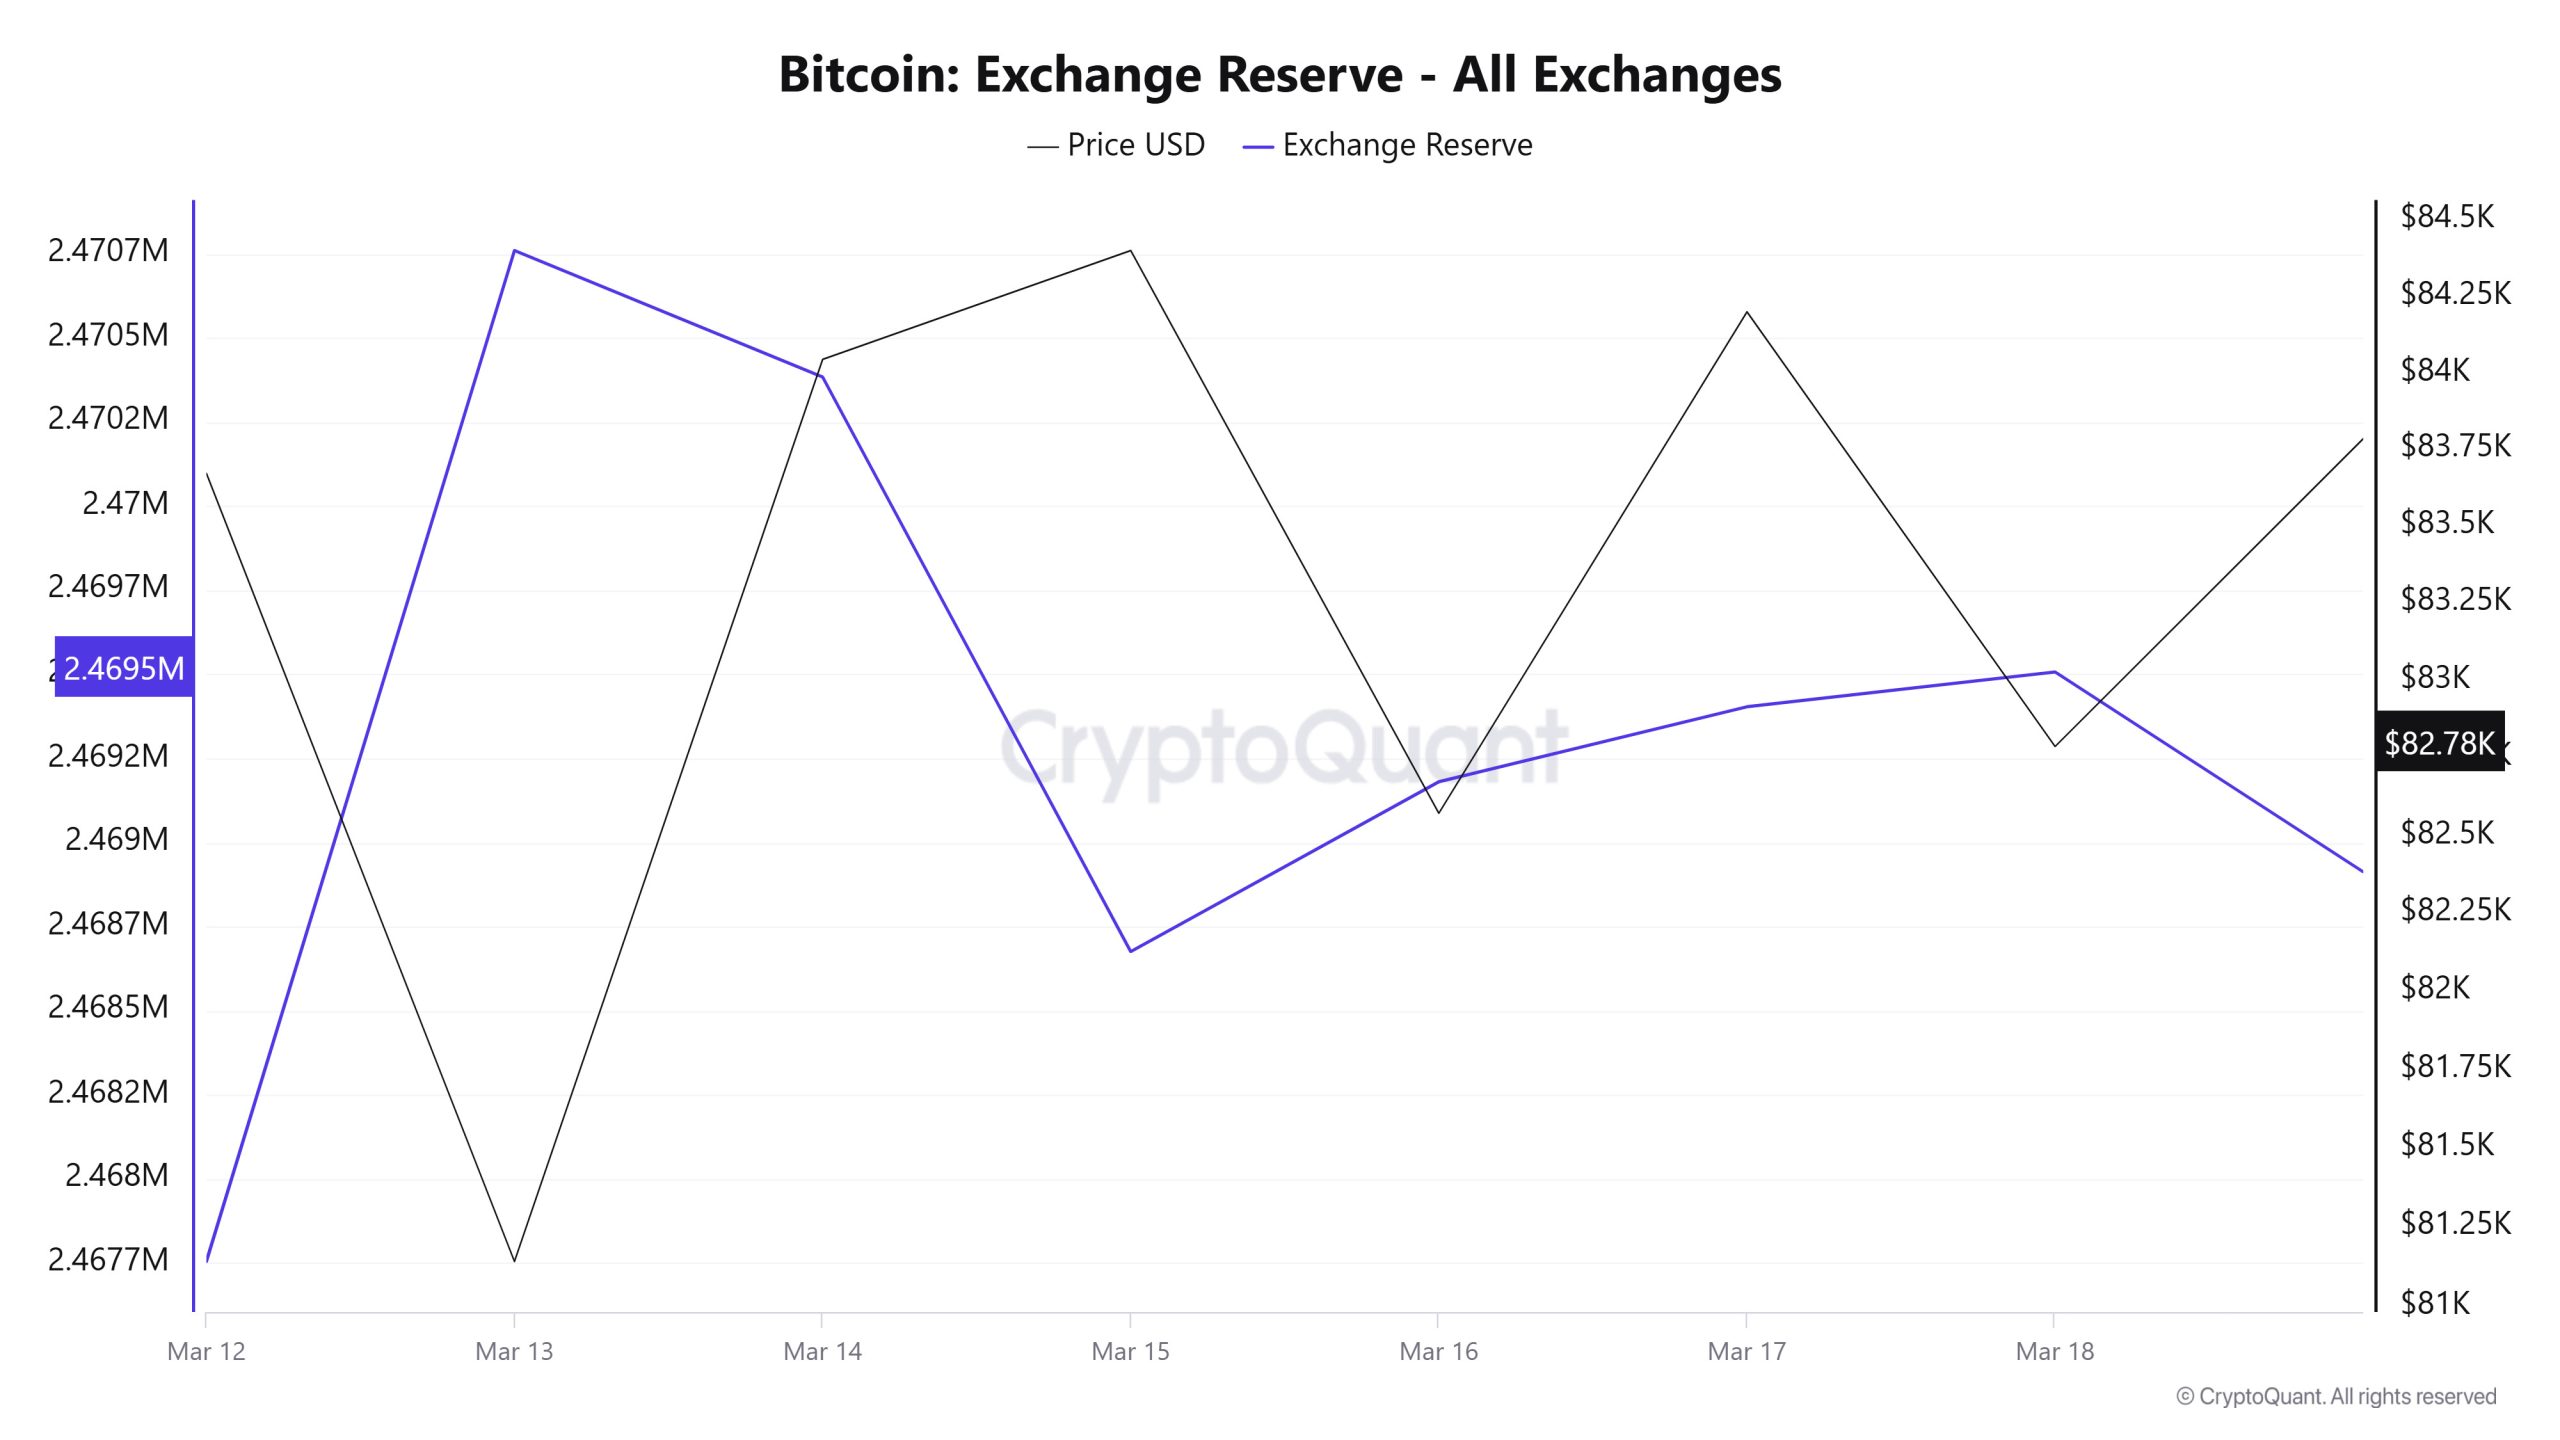
Between March 12-18, 2025, Bitcoin reserves on exchanges increased from 2,467,754 BTC to 2,469,507 BTC. During this period, there was a total net inflow of 1,753 BTC and the Bitcoin reserves of exchanges increased by 0.07%. The Bitcoin price decreased by approximately 1.06% during this period. On March 12, 2025, Bitcoin closed at $83,672, and on March 18, 2025, it closed at $82,786. Net inflows to the stock markets suggest that investors may be inclined to sell. This could put a slight selling pressure on the price. (Decline)
| Date | 12-Mar | 13-Mar | 14-Mar | 15-Mar | 16-Mar | 17-Mar | 18-Mar |
|---|---|---|---|---|---|---|---|
| Exchange Inflow | 33,034 | 51,191 | 31,787 | 8,578 | 8,530 | 22,961 | 24,567 |
| Exchange Outflow | 33,772 | 48,186 | 32,163 | 10,286 | 8,025 | 22,738 | 24,463 |
| Exchange Netflow | -737 | 3,005 | -376 | -1,708 | 505 | 223 | 103 |
| Exchange Reserve | 2,467,754 | 2,470,760 | 2,470,384 | 2,468,675 | 2,469,180 | 2,469,403 | 2,469,507 |
| BTC Price | 83,672 | 81,140 | 84,044 | 84,401 | 82,570 | 84,200 | 82,786 |
Fees and Revenues
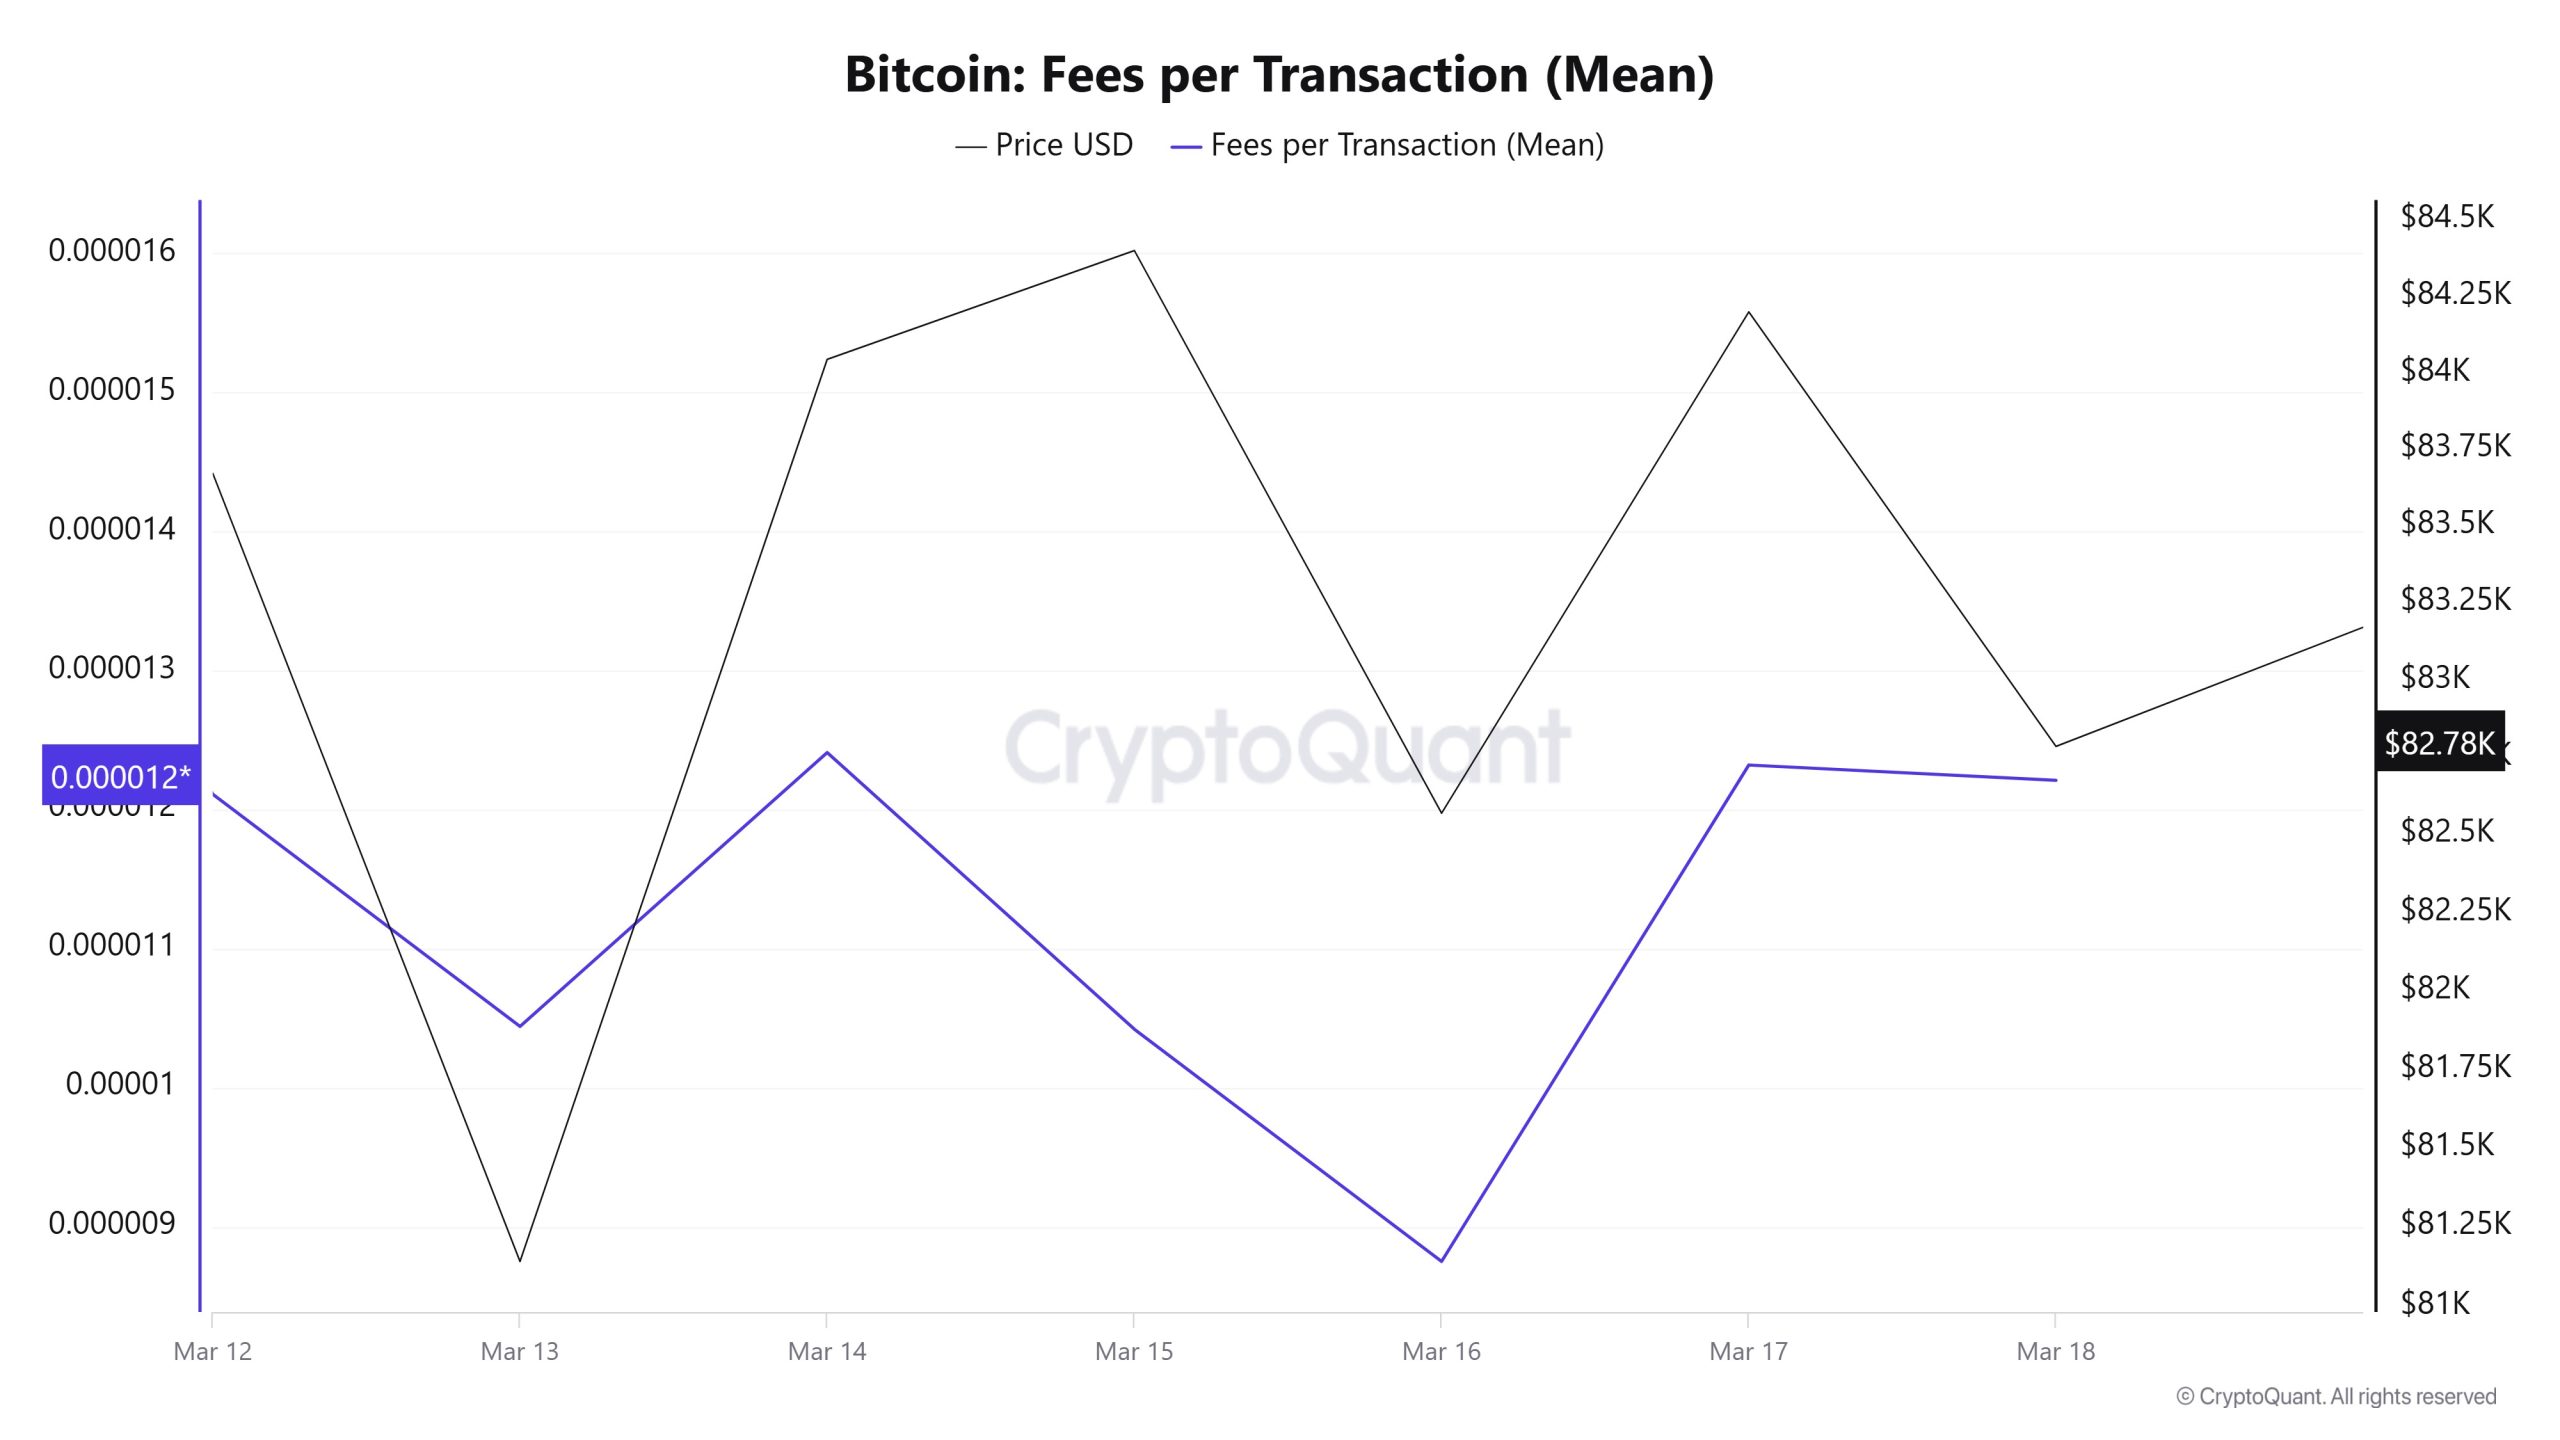
When the data of Bitcoin Fees per Transaction (Mean) between March 12 and 18 is analyzed, it is seen that this value was at the level of 0.00001211 on March 12, the first day of the week. On March 13, Bitcoin Fees per Transaction (Mean) value, which saw some retracement, increased the next day with the volatility seen in Bitcoin price and reached 0.00001241 on March 14. With this value, it reached the highest level of the weekly period. The value, which moved in correlation with the Bitcoin price in the following days, was recorded as the lowest value of the week with the level of 0.00000875 on March 16.
However, on March 18, the last day of the weekly period, the value increased again to close at 0.00001221.
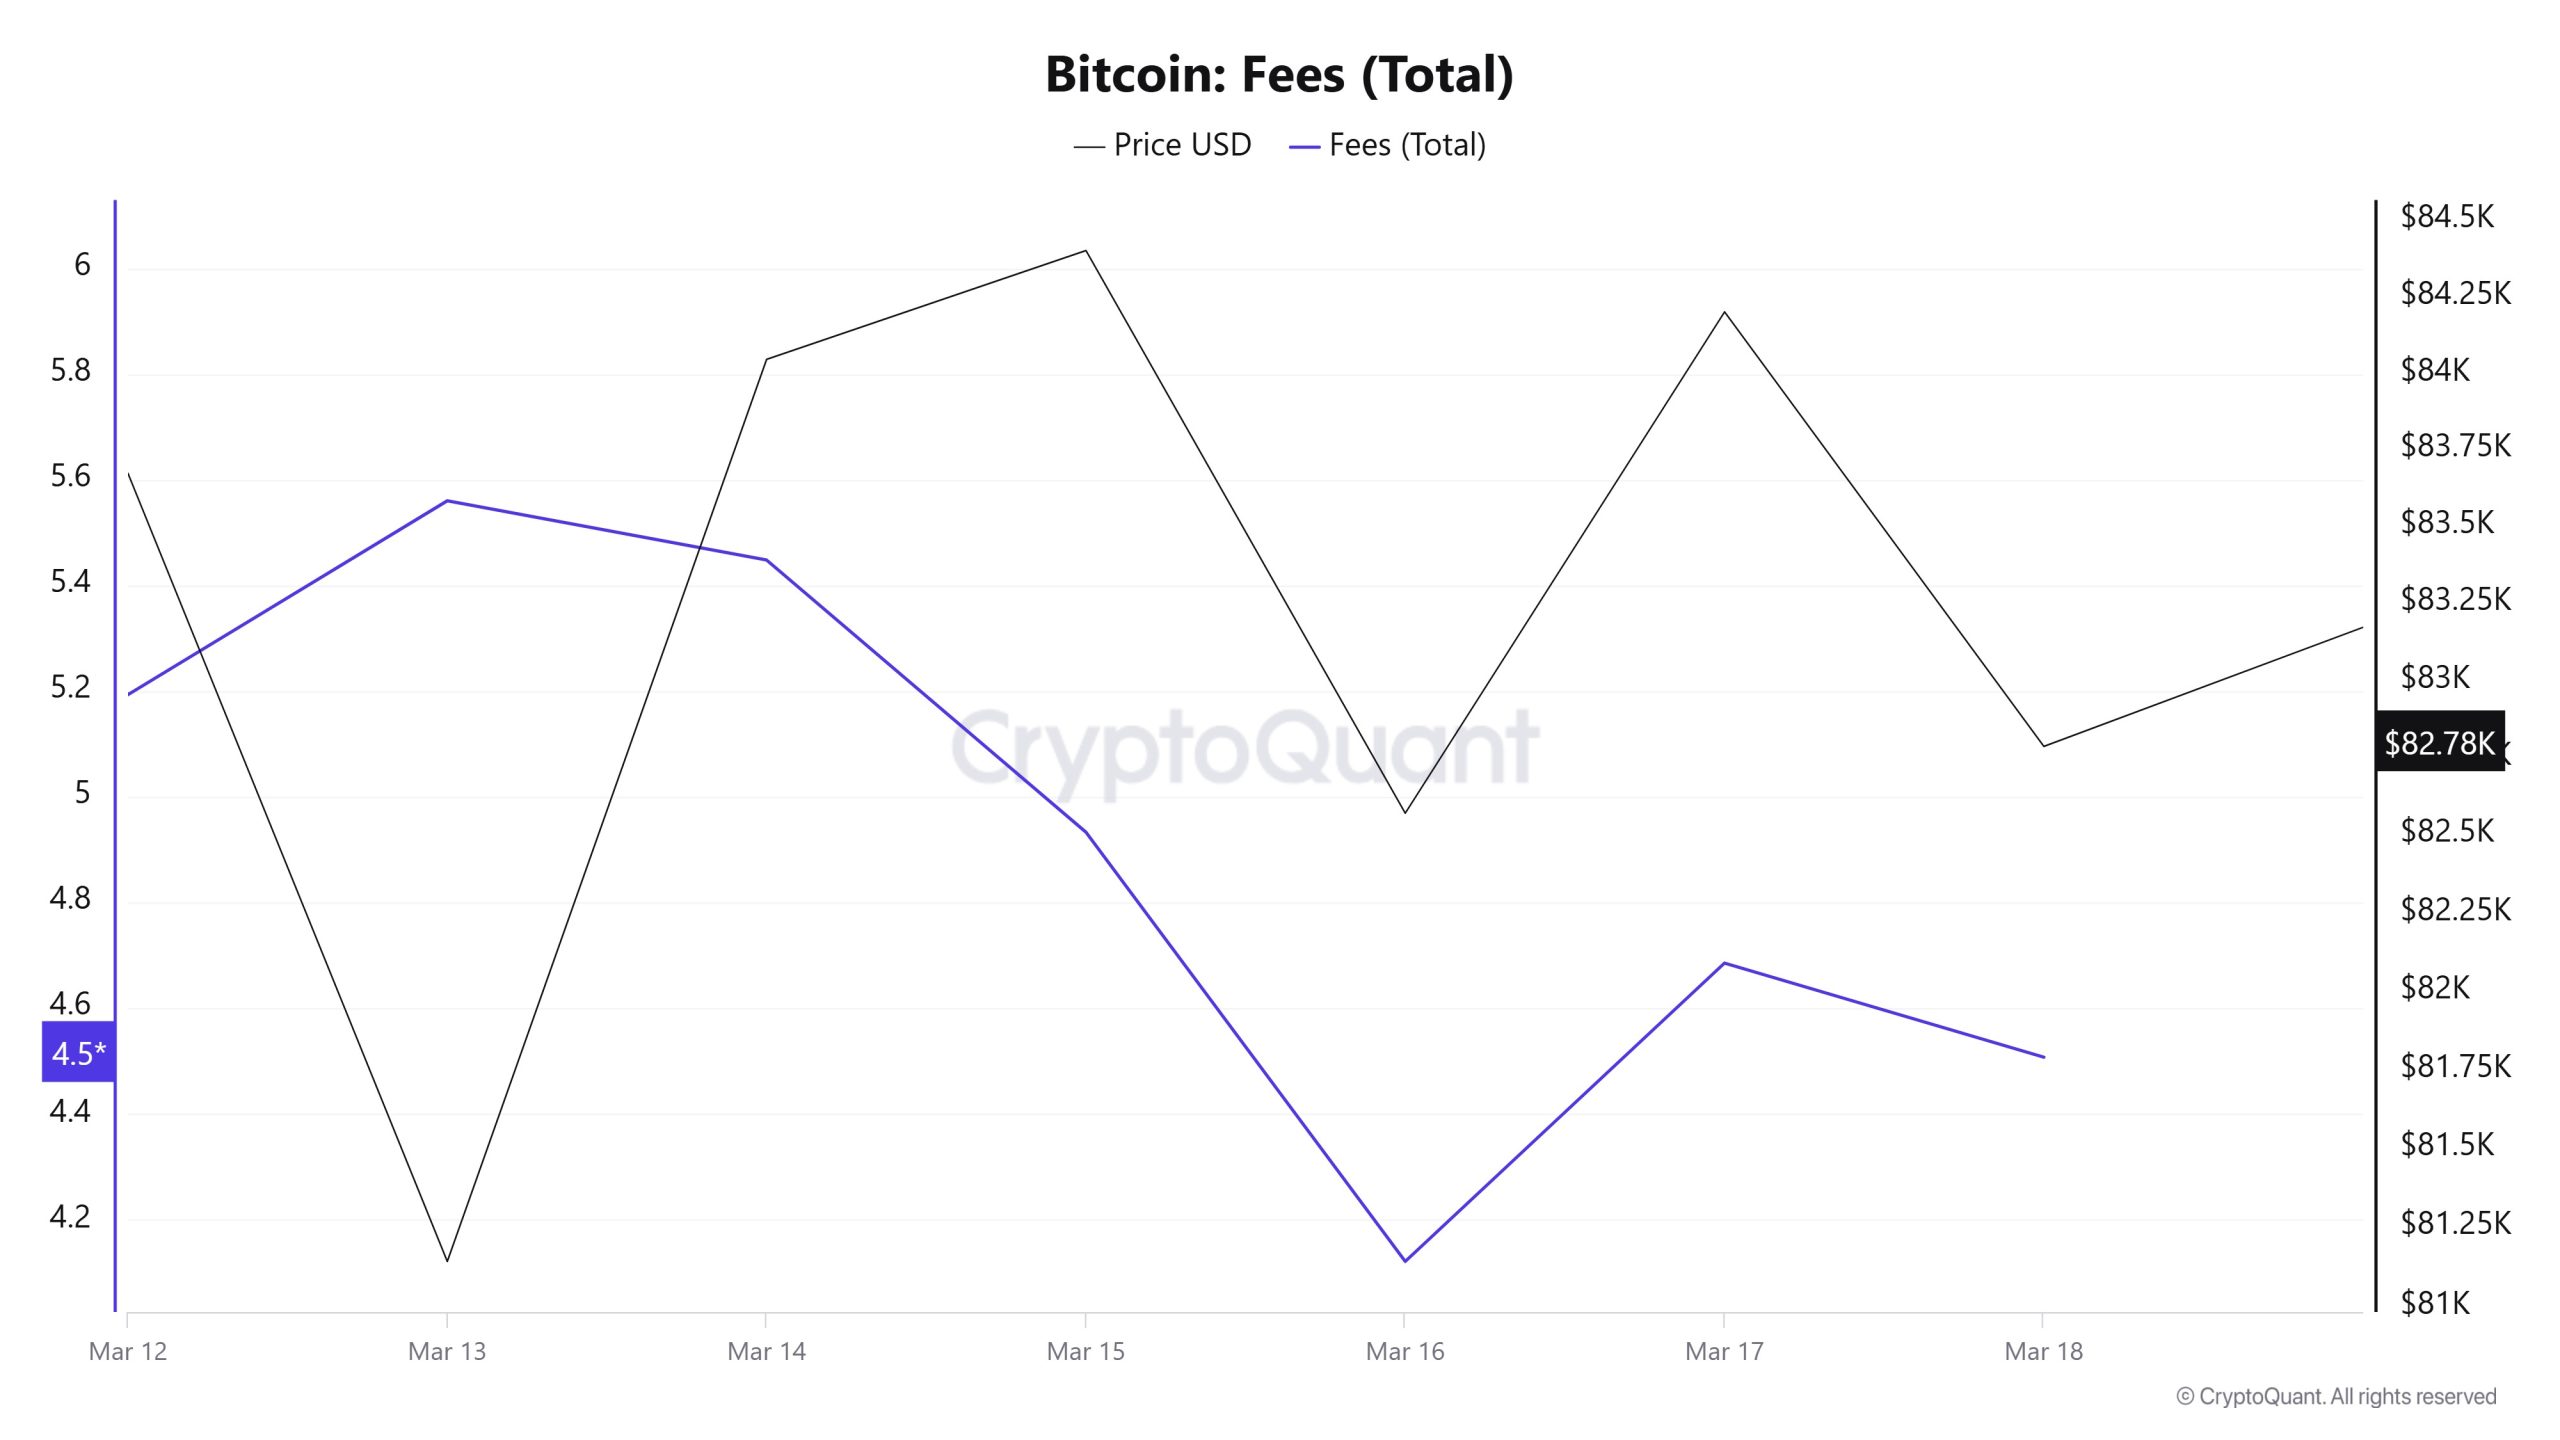
Similarly, when the data of Bitcoin Fees (Total) between March 12 and 18 is analyzed, it is seen that this value was at the level of 5.19284074 on March 12, the first day of the week. Until March 13, the value increased, reaching 5.55966839 on this date. After this date, Bitcoin Fees (Total) decreased and fell to 4.12027733 on March 16. With this value, it recorded the lowest level of the weekly period.
However, on March 18, the last day of the weekly period, the value closed at 4.
Miner Flows
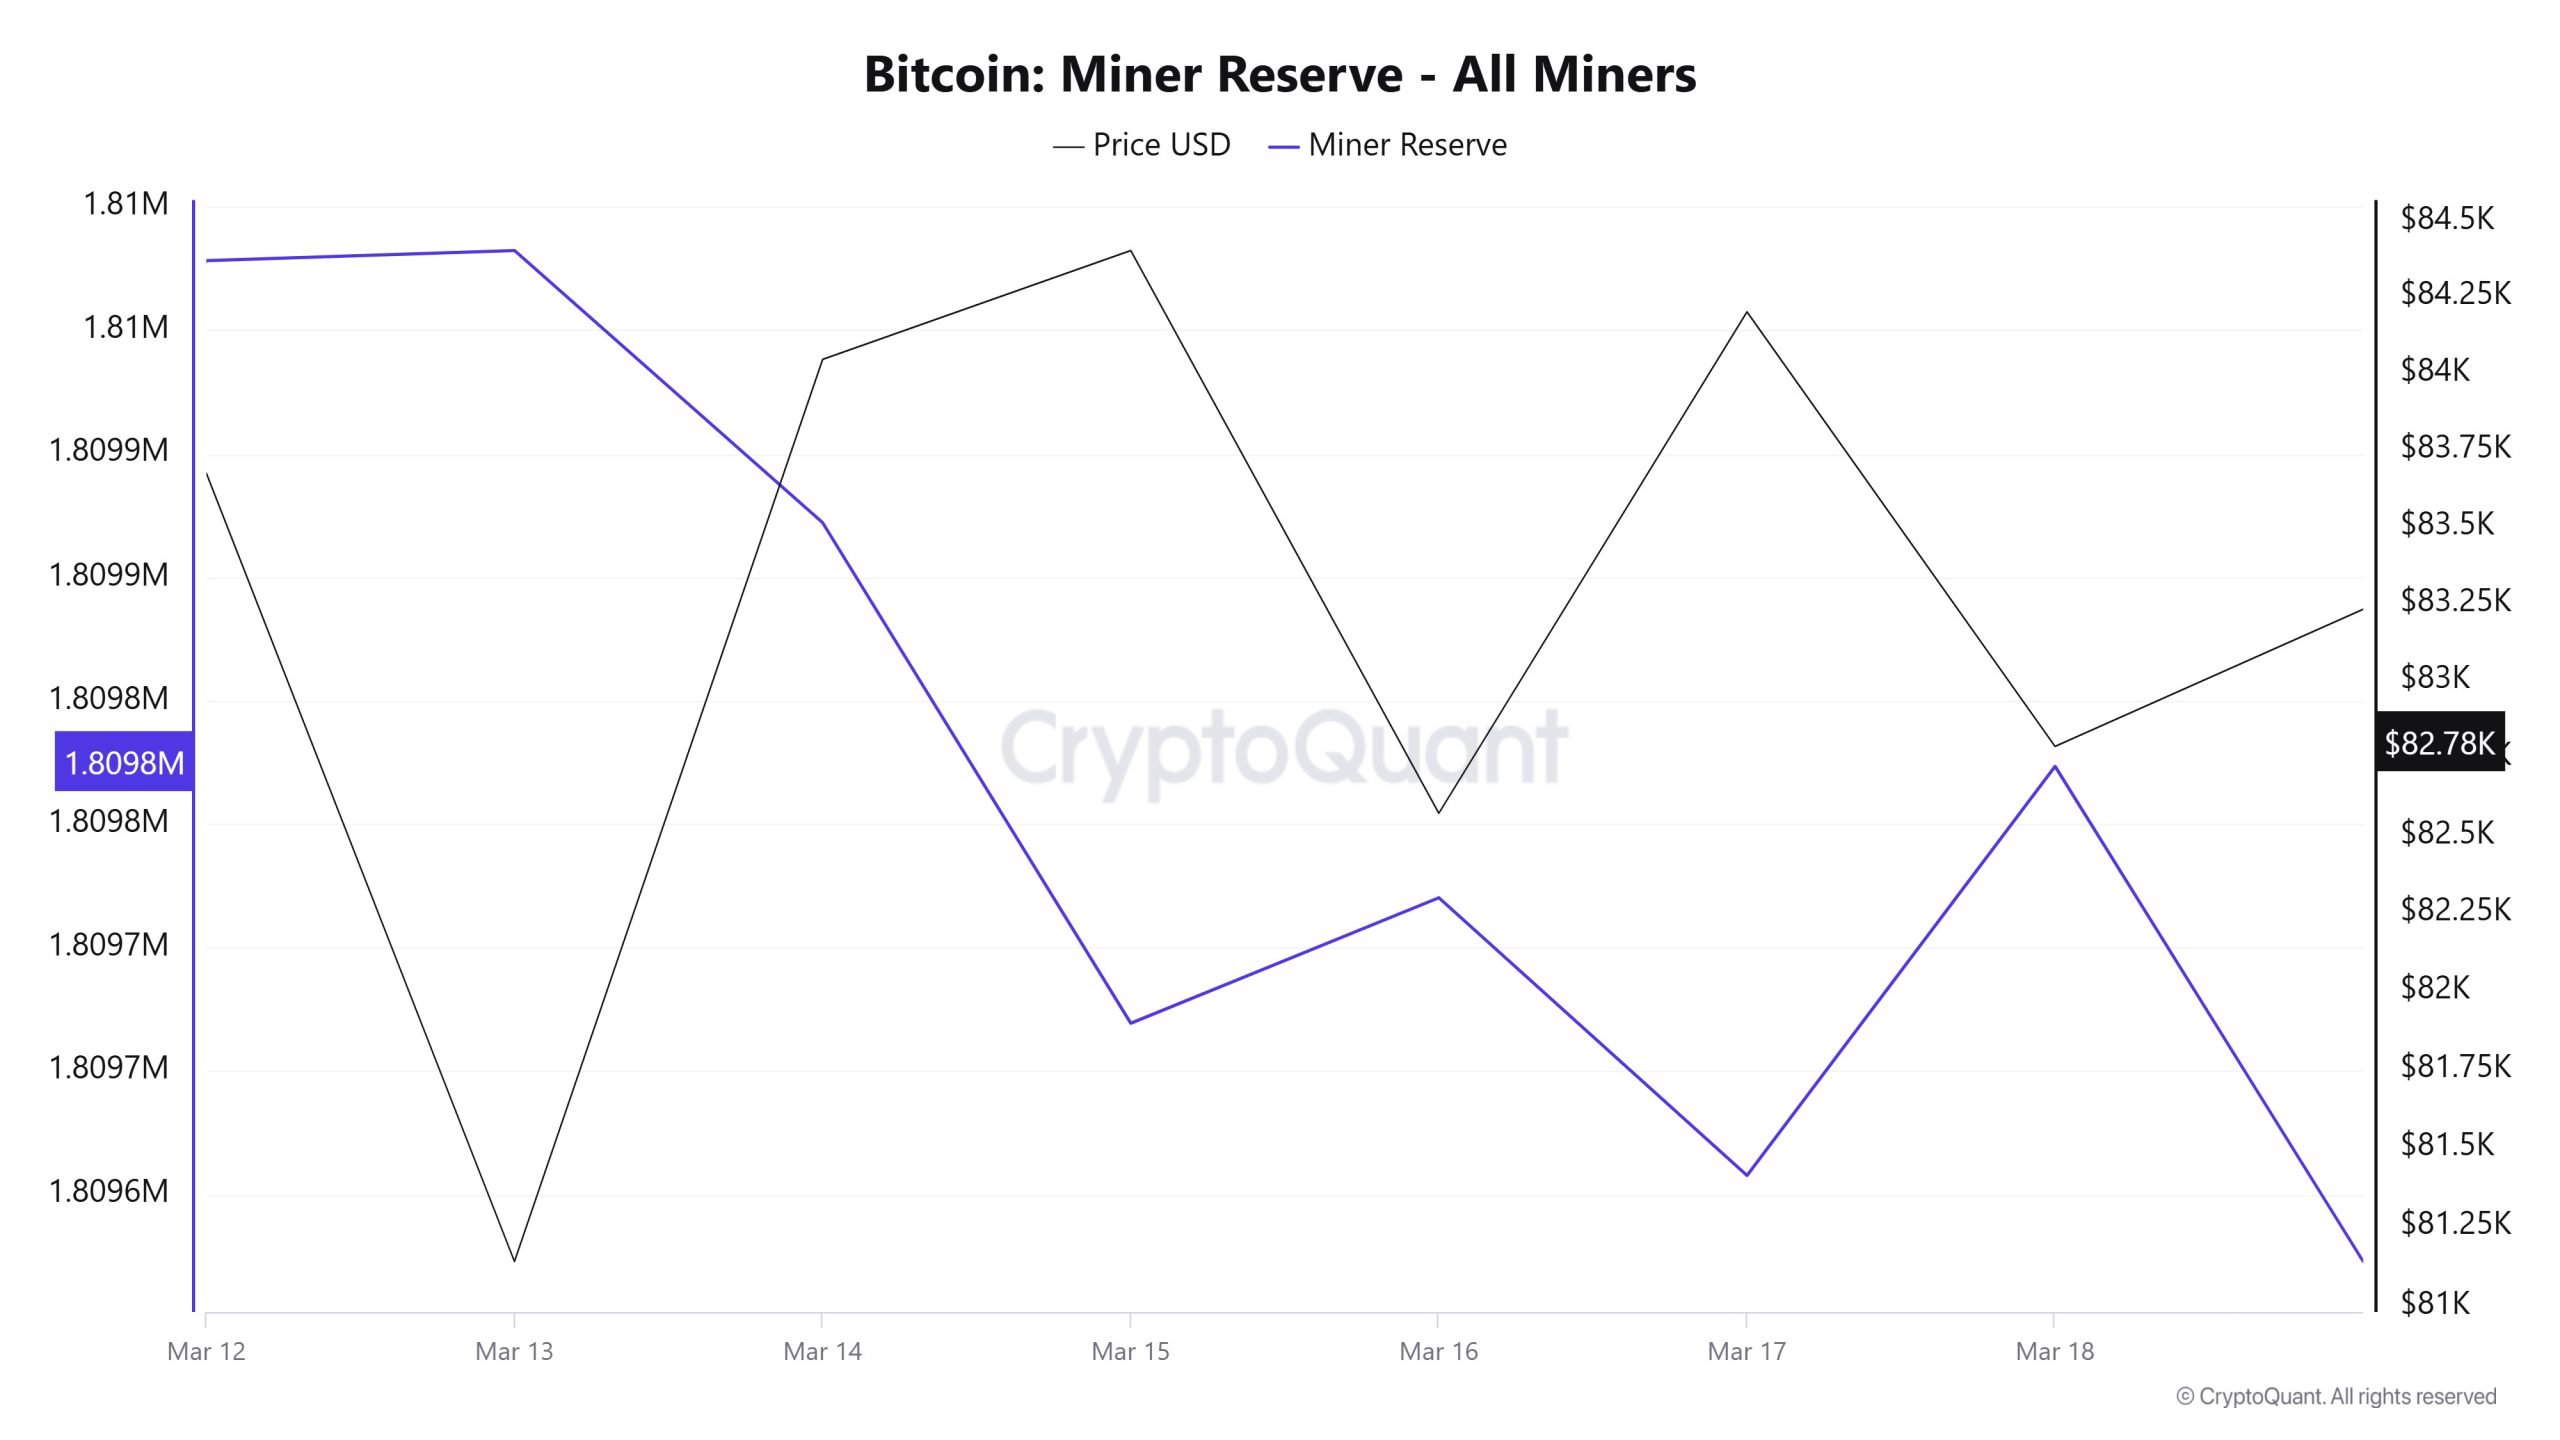
As can be seen in the Miner Reserve table, the number of Bitcoins in miners’ wallets decreased this week. Miner Reserve and Bitcoin price have been negatively correlated throughout this week.
Miner Inflow, Outflow and Netflow
Between March 12-18, 36,089 Bitcoins exited miners’ wallets and 36,061 Bitcoins entered miners’ wallets between the same dates. The Miner Netflow for this week was -28 Bitcoin. Meanwhile, the Bitcoin price was $83,671 on March 12 and $82,785 on March 18.
For the week, the net flow (Miner Netflow) was negative as Bitcoin inflow into miner wallets (Miner Inflow) was less than Bitcoin outflow from miner wallets (Miner Outflow).
| March 12 | March 13 | March 14 | March 15 | March 16 | March 17 | March 18 | |
|---|---|---|---|---|---|---|---|
| Miner Inflow | 6,130.43 | 6,956.54 | 5,964.27 | 2,978.00 | 2,846.47 | 5,088.05 | 6,097.74 |
| Miner Outflow | 5,960.86 | 6,944.14 | 6,076.88 | 3,178.43 | 2,794.25 | 5,202.57 | 5,932.02 |
| Miner Netflow | 169.58 | 12.40 | -112.62 | -200.43 | 52.22 | -114.52 | 165.72 |
Transaction
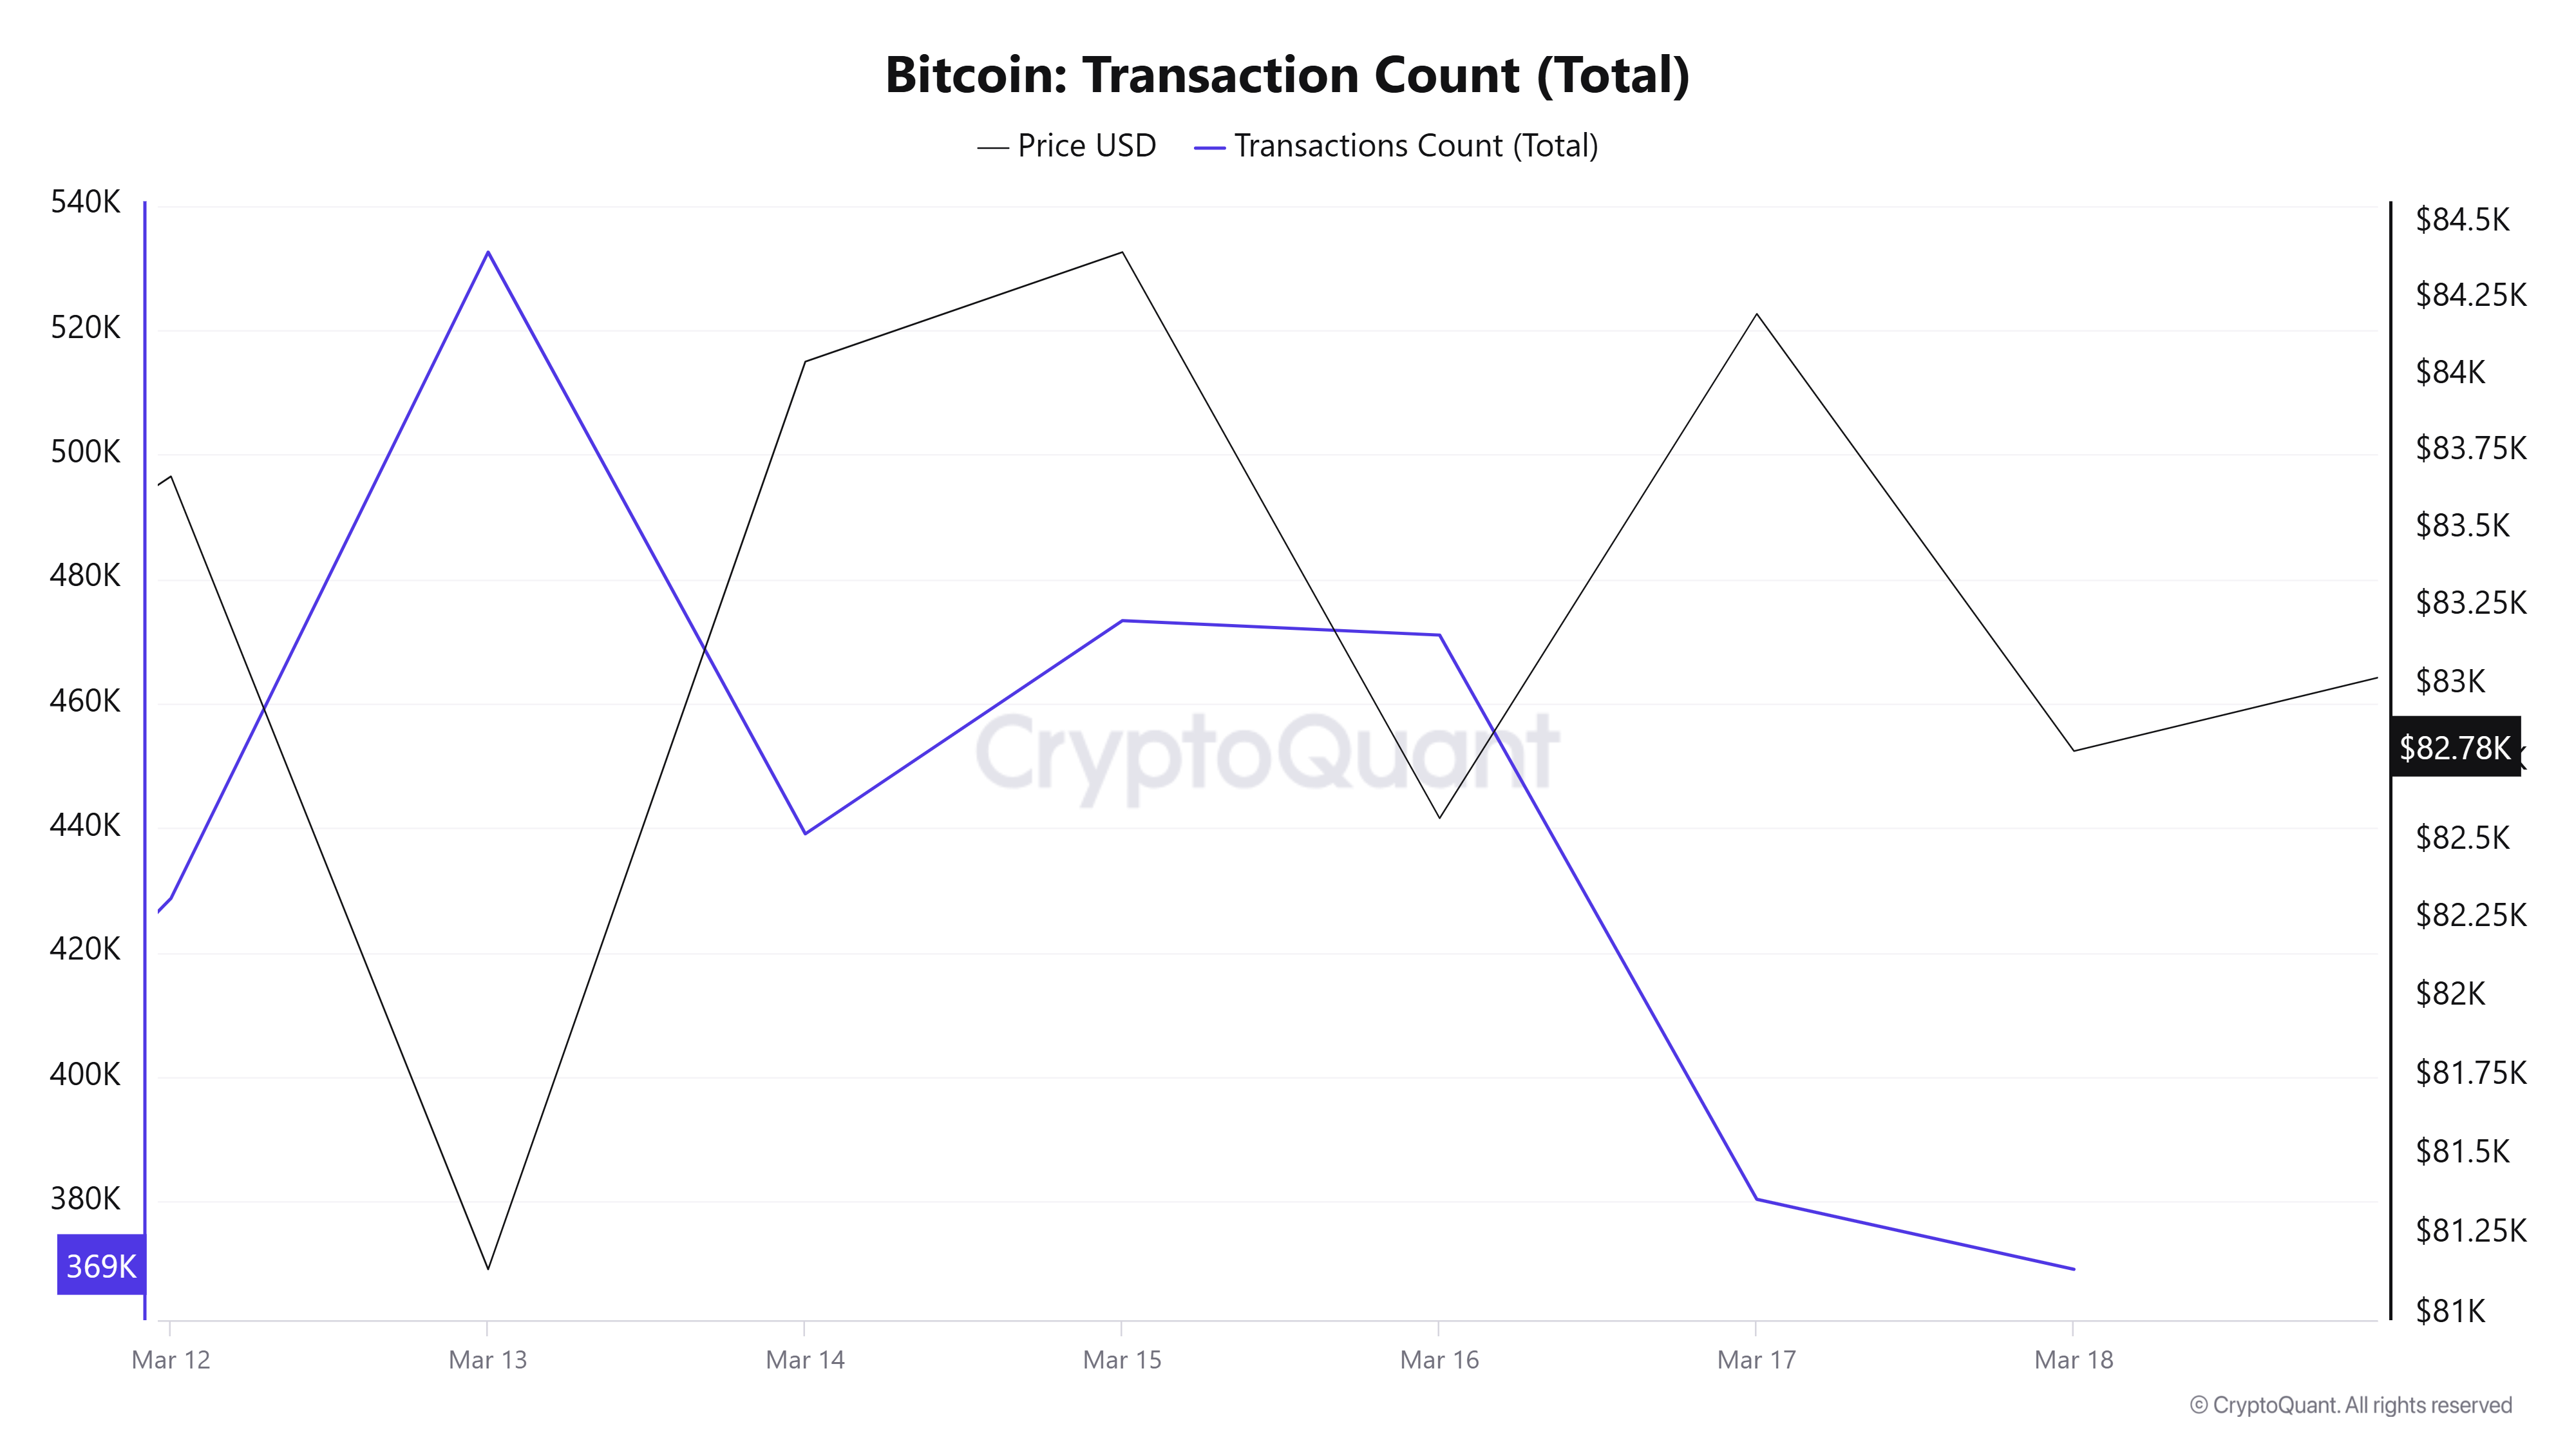
Last week, there were 2,407,874 transactions on the Bitcoin network, up 28.5% to 3,093,915 transactions this week. The 532,479 transactions recorded on March 13 was the highest trading volume of the week, while the lowest number of transactions was 369,095 on March 18.
The “number of transactions – price” relationship, which is usually positively correlated, was positively correlated on March 15-16, but continued to show an inverse correlation for the rest of the week, as in the previous week. Although the remarkable increase in the number of transactions is open to positive interpretation, the fact that inverse correlations are seen more frequently, especially in downtrends, is a reminder that the negative trend may continue.
Tokens Transferred
While 4,792,242 BTC was transferred last week, it decreased by 19.1% to 3,878,263 BTC this week. On March 12, 728,429 BTC were transferred, the highest token volume of the week, while March 15 saw the lowest transfer volume of 404,491 BTC. As it is the weekend, this is considered normal and it can be said that the role of institutions this week is less than in previous weeks.
Despite a significant increase in the number of transactions this week compared to the previous week, the amount of Bitcoin transferred decreased significantly, indicating a massive decrease in the amount of BTC per transaction. This indicates that small-scale transfers continue to increase, while large transfers for sale are decreasing. Assuming that the profit realizations of large investors are close to completion, but that small investors cannot back the products alone at these prices, the possibility of seeing horizontal movements for a while is strengthening.
Whale Activities
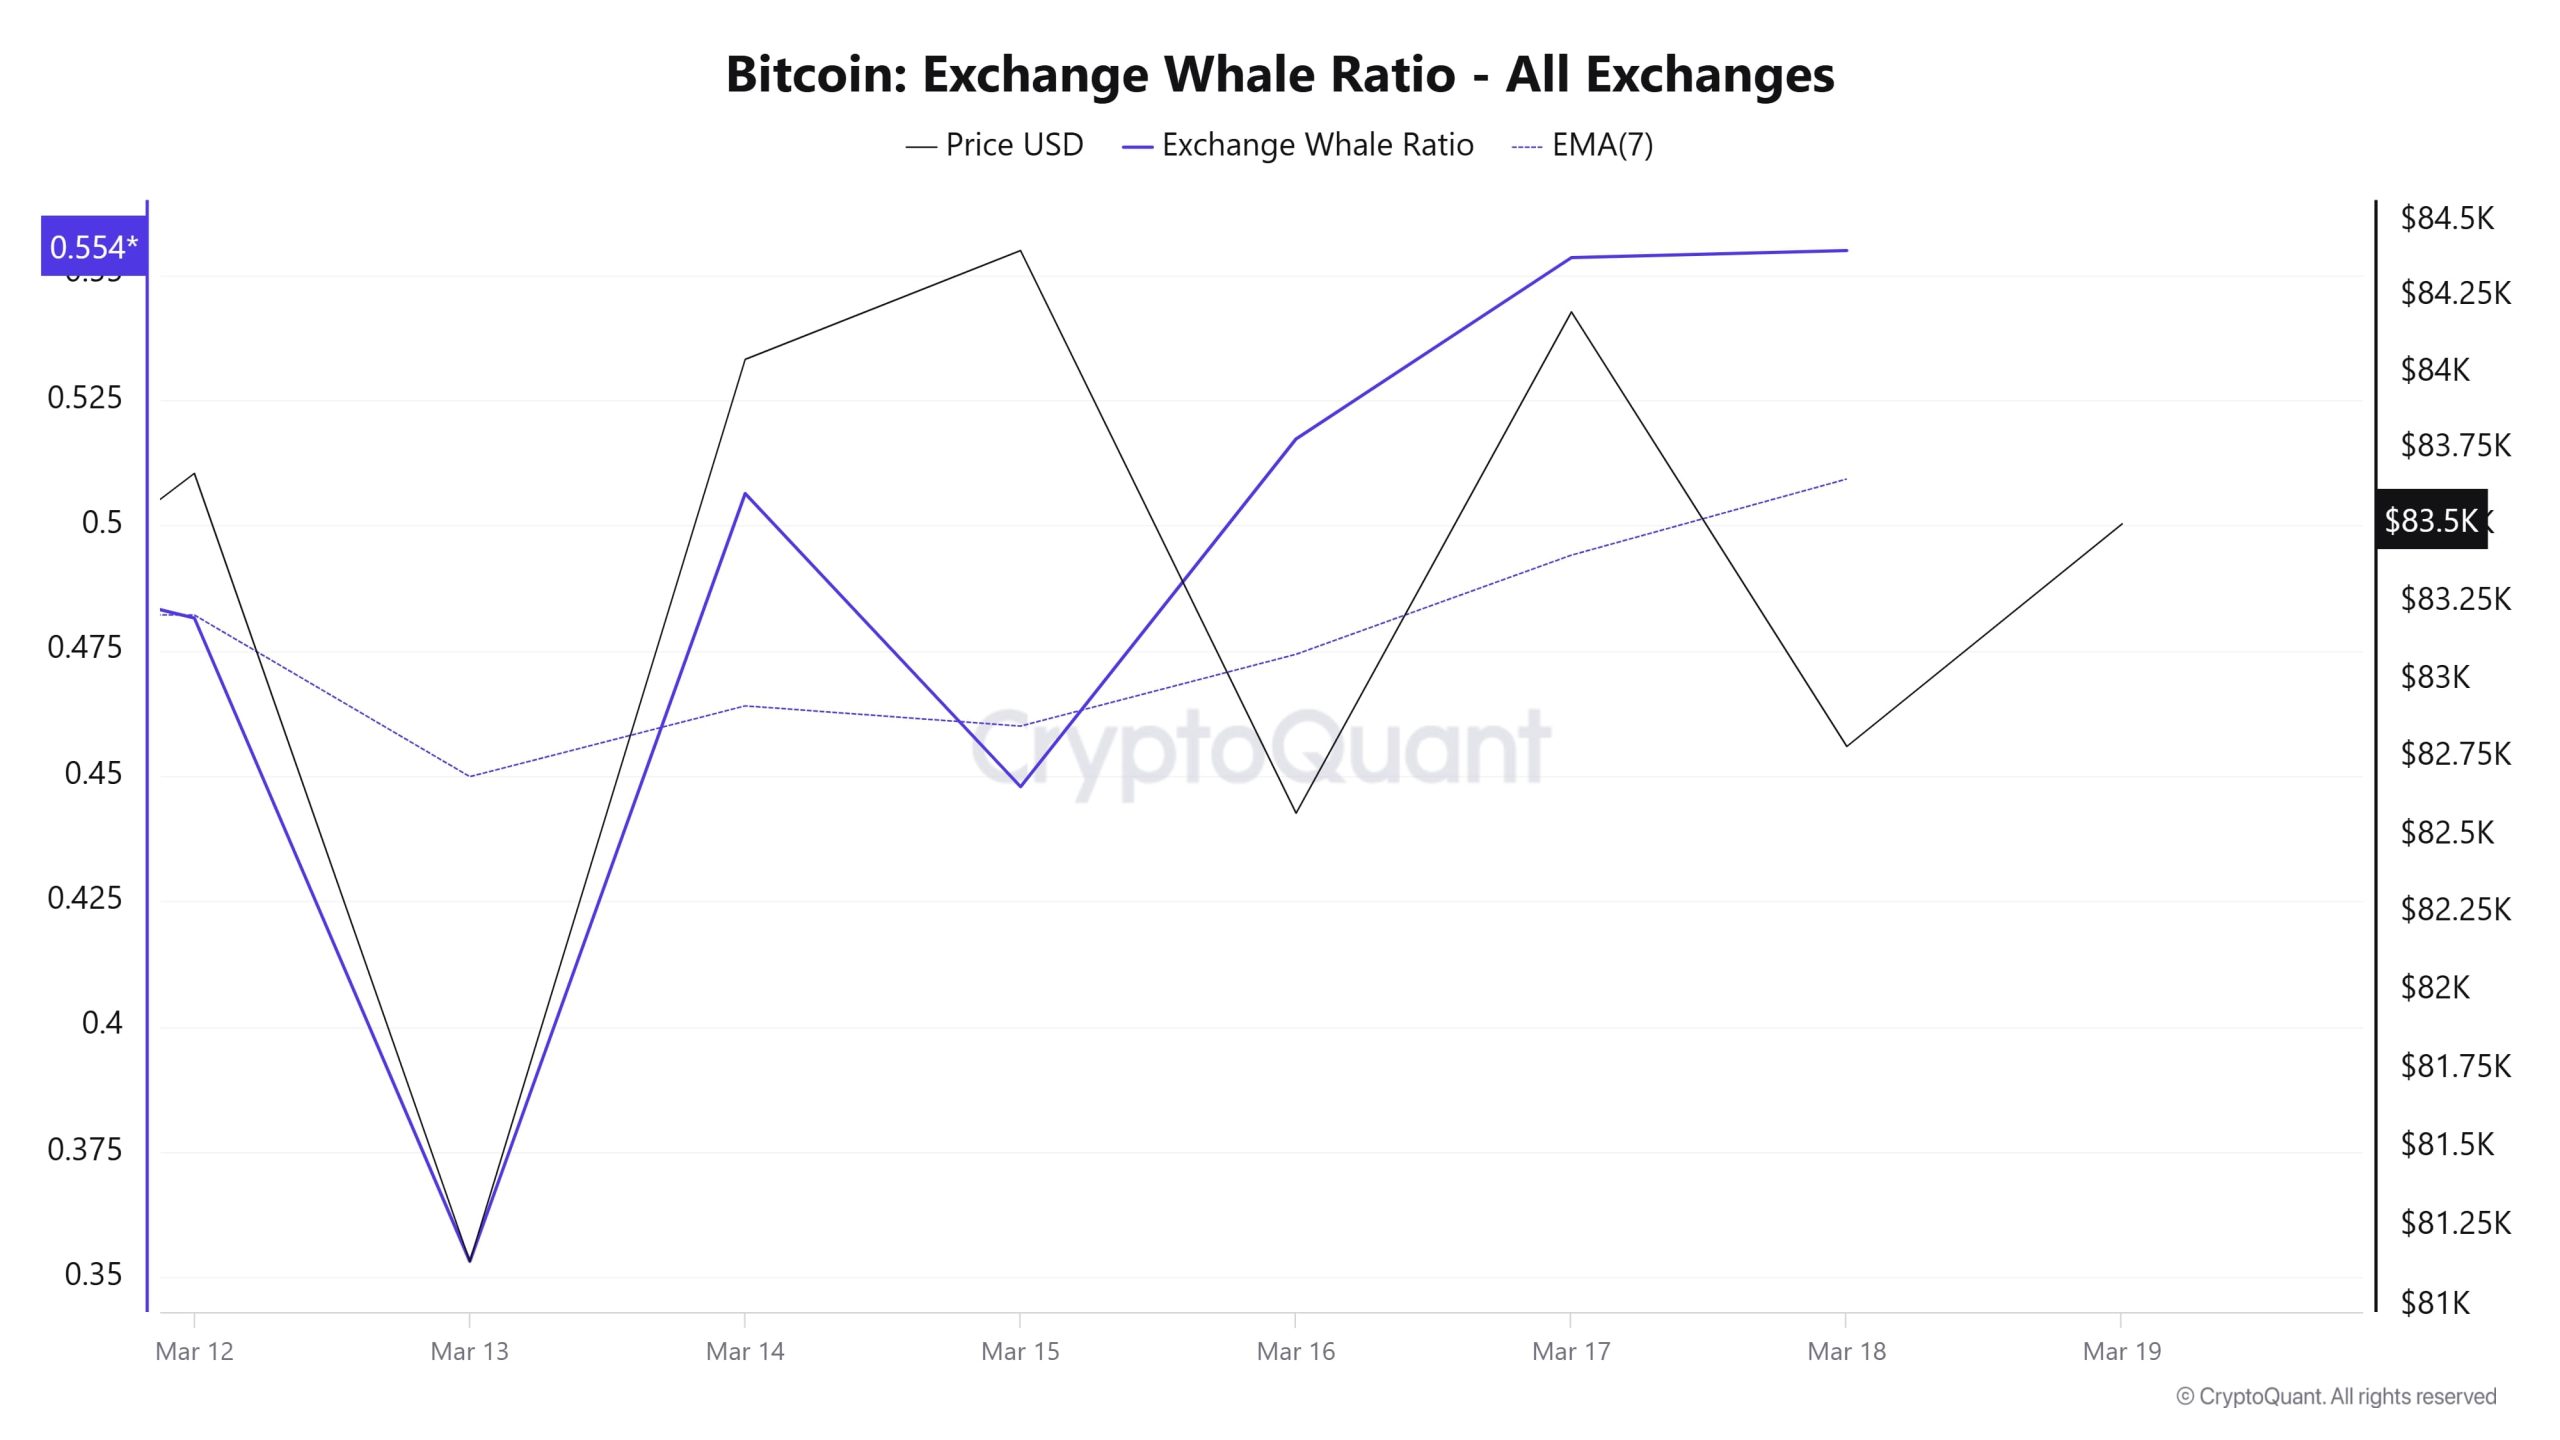
Whales Data
According to the data that has attracted attention in the cryptocurrency market in the last 7 days, whale activities on the central stock exchange are balanced at the beginning of the process, but the use of the central stock exchange has increased according to the end of the process. When we look at the Exchange Whale Ratio metric, it showed that the whales used the central exchanges balanced at the beginning of the 7-day process and the value was measured as 0.353. This measurement reached 0.459 in the middle of the process, showing that whales started to use the central exchange more than at the beginning of the process. At the time of writing, the value is 0.554, indicating that whales are using the centralized exchange even more than in the middle of the process. When this ratio is above 0.350, it usually means that whales use centralized exchanges frequently. At the same time, the total BTC transfer saw 3,878,263 BTC moved, a decrease of about 19% compared to last week. In conclusion, the fact that whales are starting to use centralized exchanges more, as well as the fact that the amount of transfers is trending downward, means that the market could point to very slight declines, but the presence of whales saving could stabilize the market
BTC Onchain Overall
| Metric | Rise 📈 | Decline 📉 | Neutral ➖ |
|---|---|---|---|
| Active Addresses | ✓ | ||
| Breakdowns | ✓ | ||
| Derivatives | ✓ | ||
| Supply Distribution | ✓ | ||
| Exchange Reserve | ✓ | ||
| Fees and Revenues | ✓ | ||
| Miner Flows | ✓ | ||
| Transaction | ✓ | ||
| Whale Activities | ✓ |
LEGAL NOTICE
The investment information, comments and recommendations contained in this document do not constitute investment advisory services. Investment advisory services are provided by authorized institutions on a personal basis, taking into account the risk and return preferences of individuals. The comments and recommendations contained in this document are of a general type. These recommendations may not be suitable for your financial situation and risk and return preferences. Therefore, making an investment decision based solely on the information contained in this document may not result in results that are in line with your expectations.
NOTE: All data used in Bitcoin onchain analysis is based on Cryptoqaunt.
