
Active Addresses
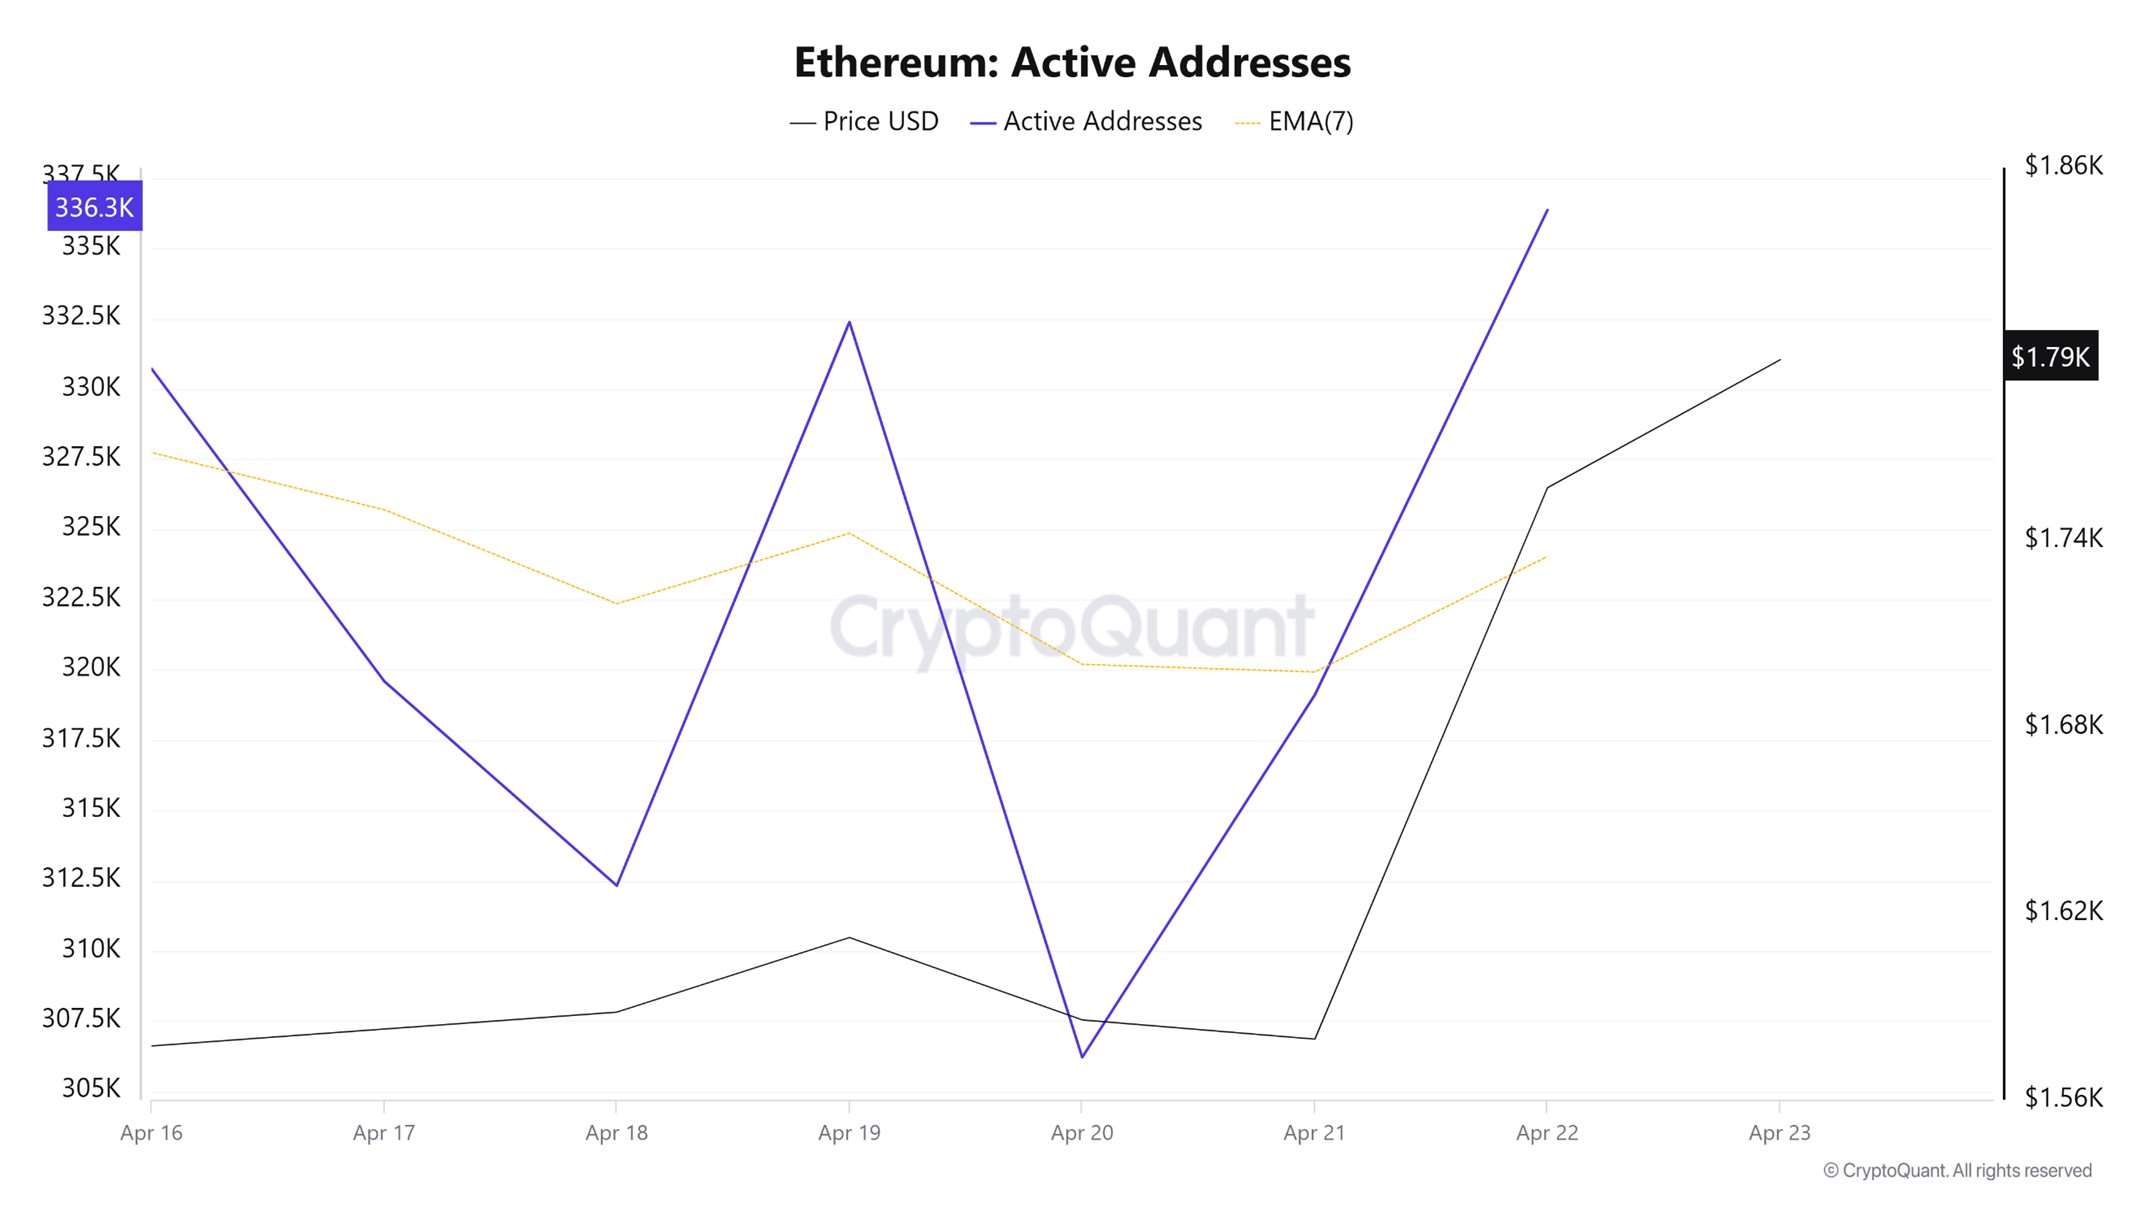
In the number of active addresses, there were 336,366 active entries to the ETH network between April 16 and April 23, 2025, this week. During this period, Ethereum rose to $1,756. The chart shows that Ethereum purchases are gradually decreasing in the area where the price and the number of active addresses intersect. When we follow the 7-day simple moving average, it is observed that the price follows an upward trend on the dates when this average cut the price. This situation indicates that the Ethereum price is experiencing inflows at $1,585 levels.
Active Sending Addresses
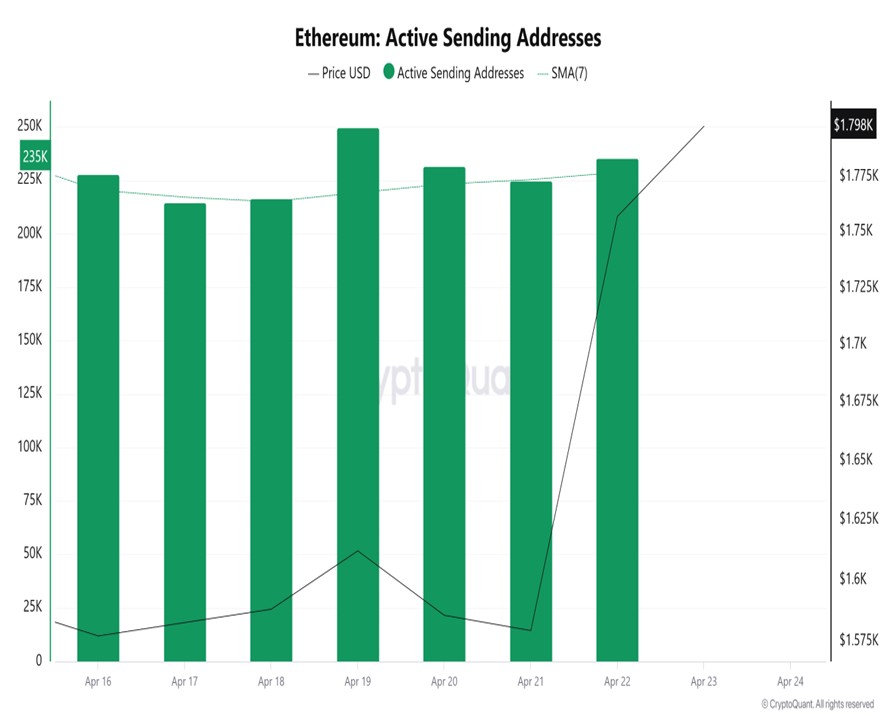
With the Black Line (price line) in active shipping addresses, there was a significant drop in active shipping addresses on April 21. On the day when the price hit its lowest point, active shipping addresses fell as low as 224,746, indicating that buyers sold their positions as Ethereum remained at 1,529 for a while. As a result, it is seen that price drops cause an acceleration in sending addresses.
Active Receiving Addresses
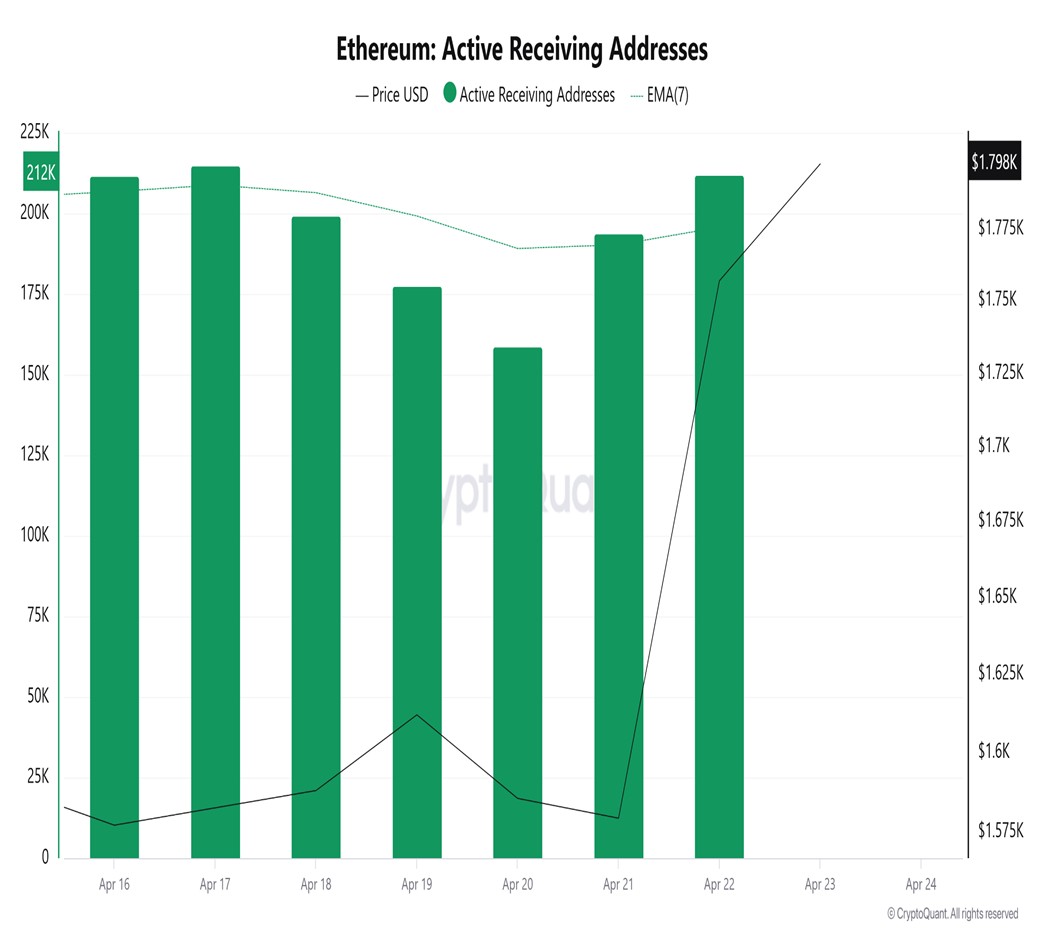
Along with the Black Line (price line) in active sending addresses, there was a significant rise in active receiving addresses after April 22. On the day of the price high, active receiving addresses rose as high as 225,256 , indicating that buyers took their positions at Ethereum’s $1,752 level.
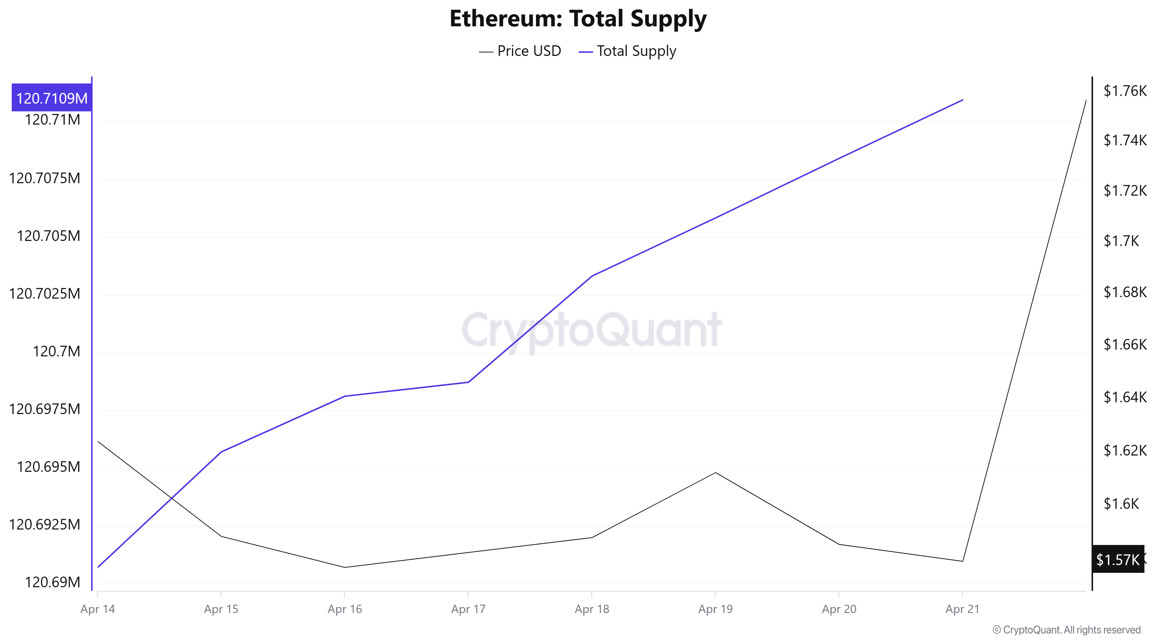
Total Value Staked
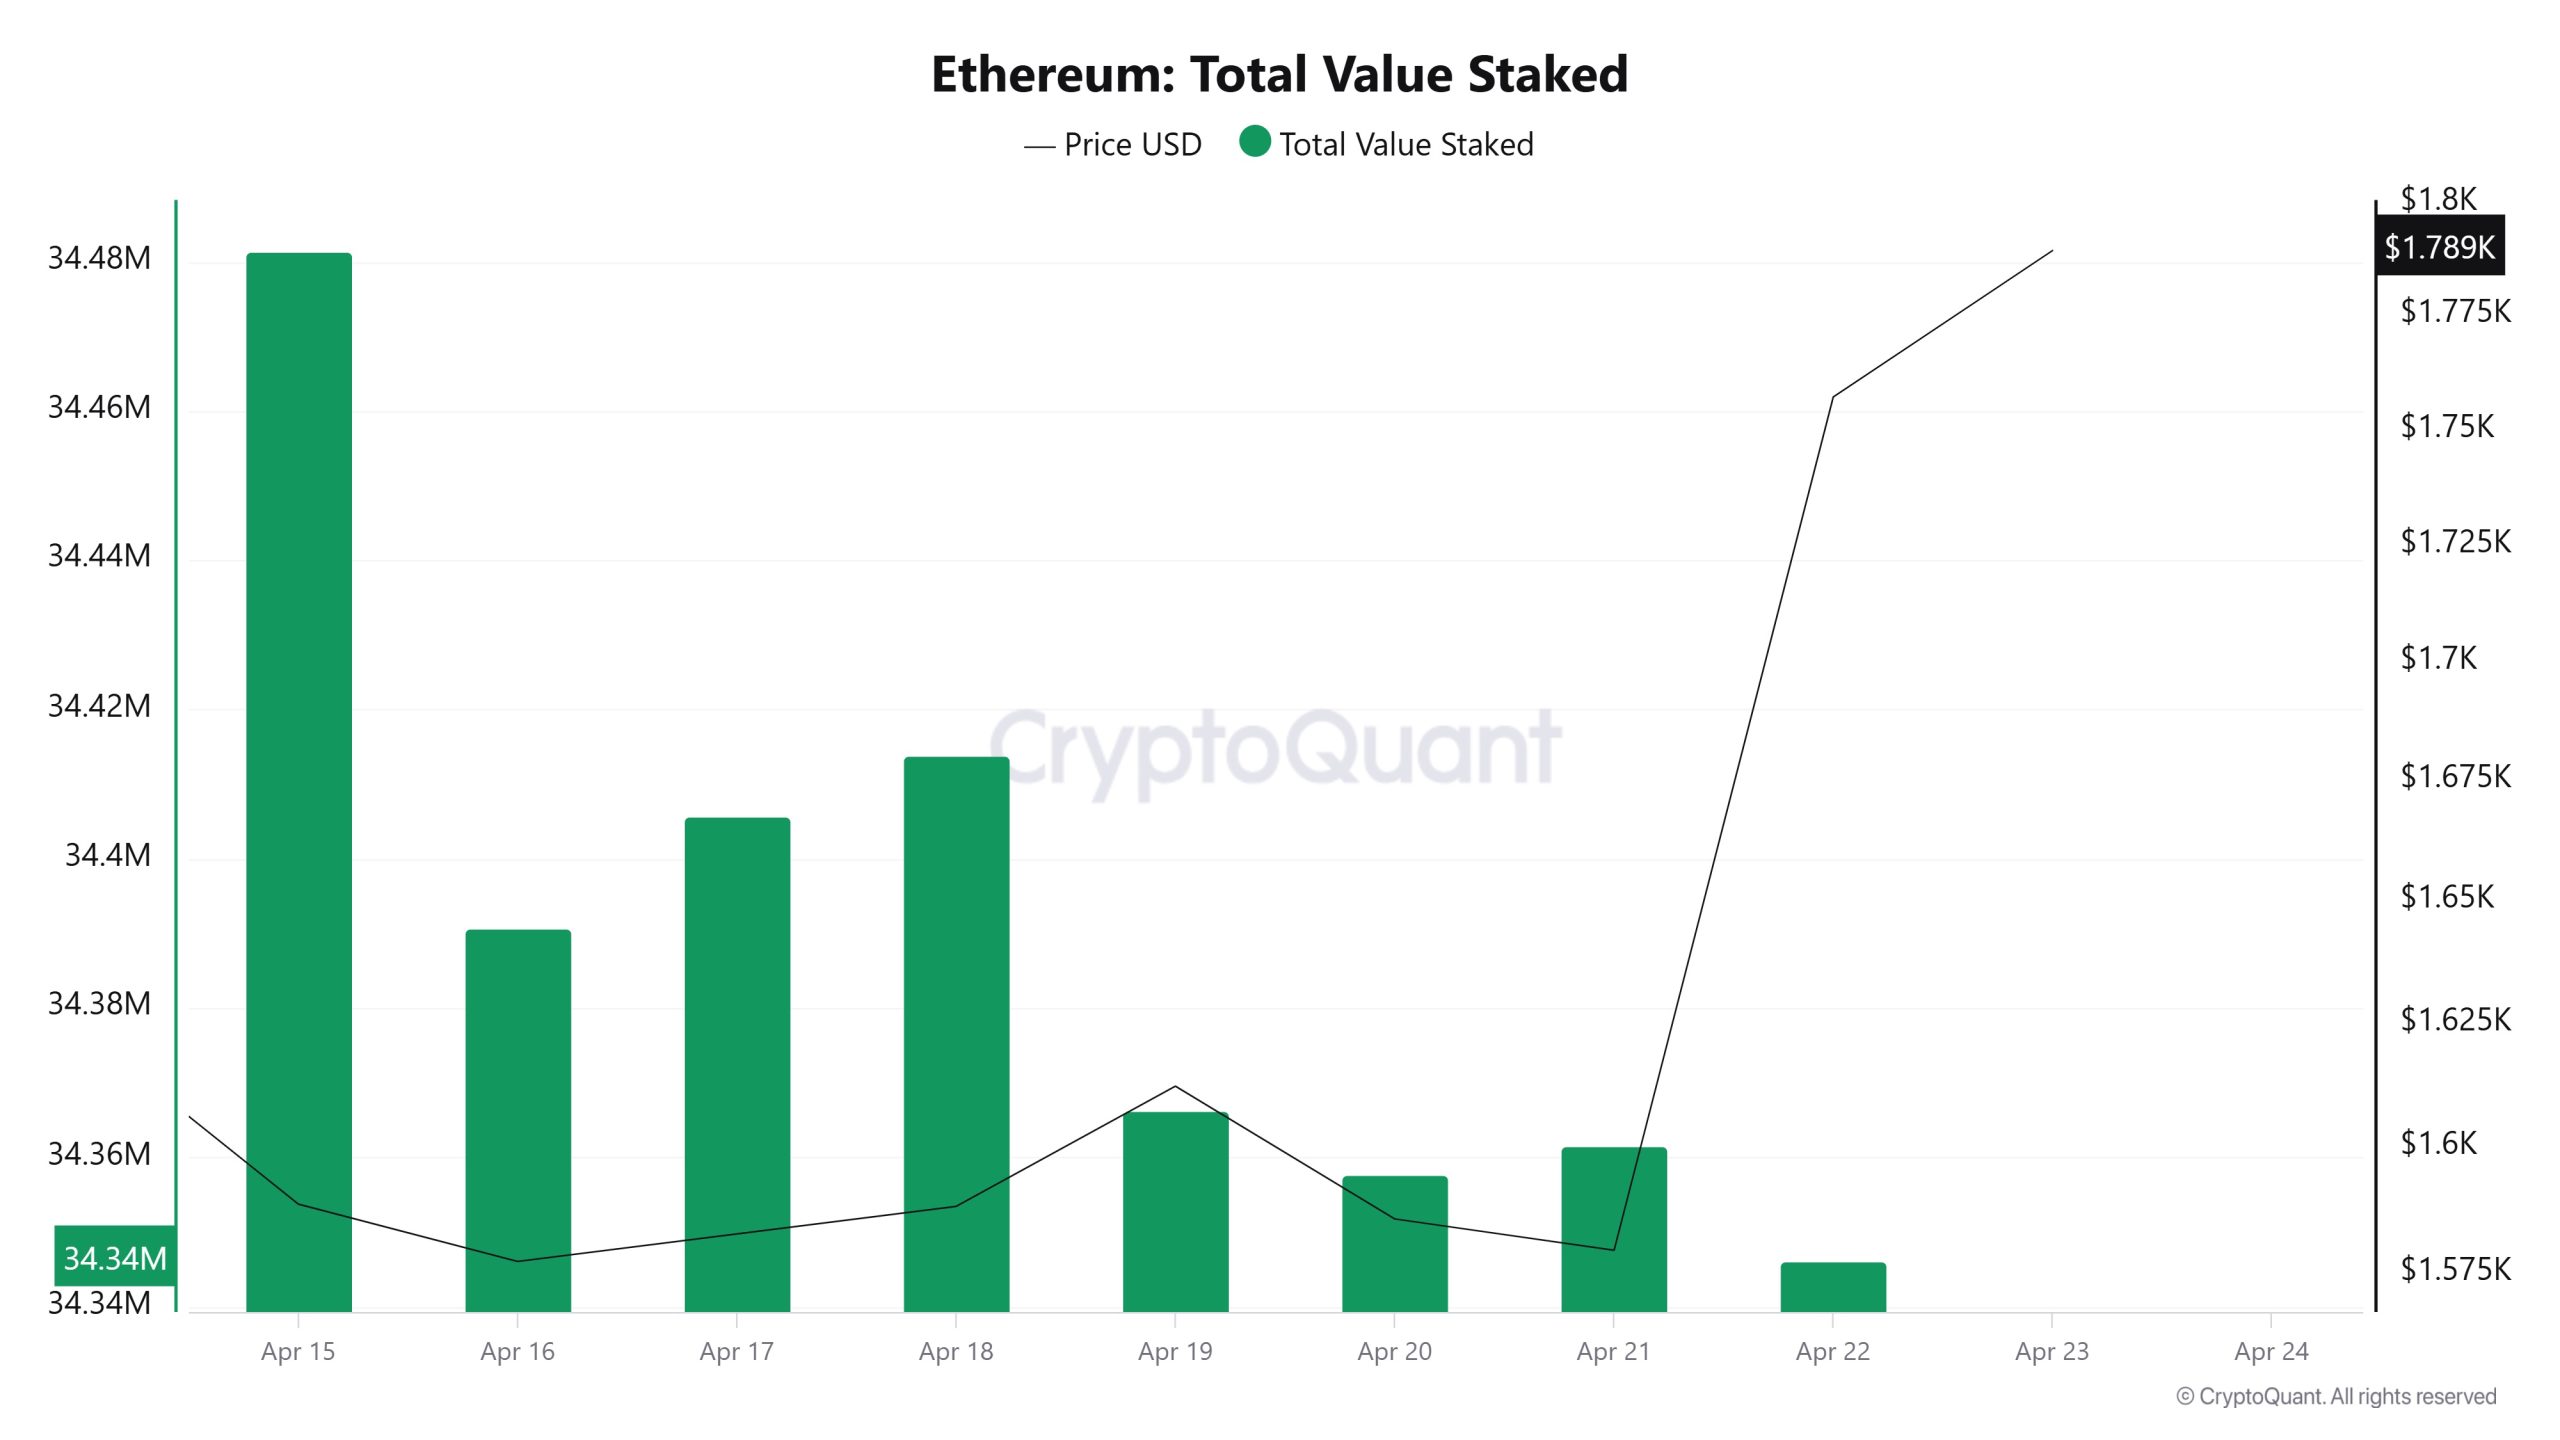
On April 16, ETH price was 1,577 while Total Value Staked was 34,390,726. As of April 22, ETH price was at 1,756 while Total Value Staked Ratio was 34,346,088. Compared to last week, ETH price increased by 11.35% while Total Value Staked Ratio decreased by 0.13%.
Staking Inflows
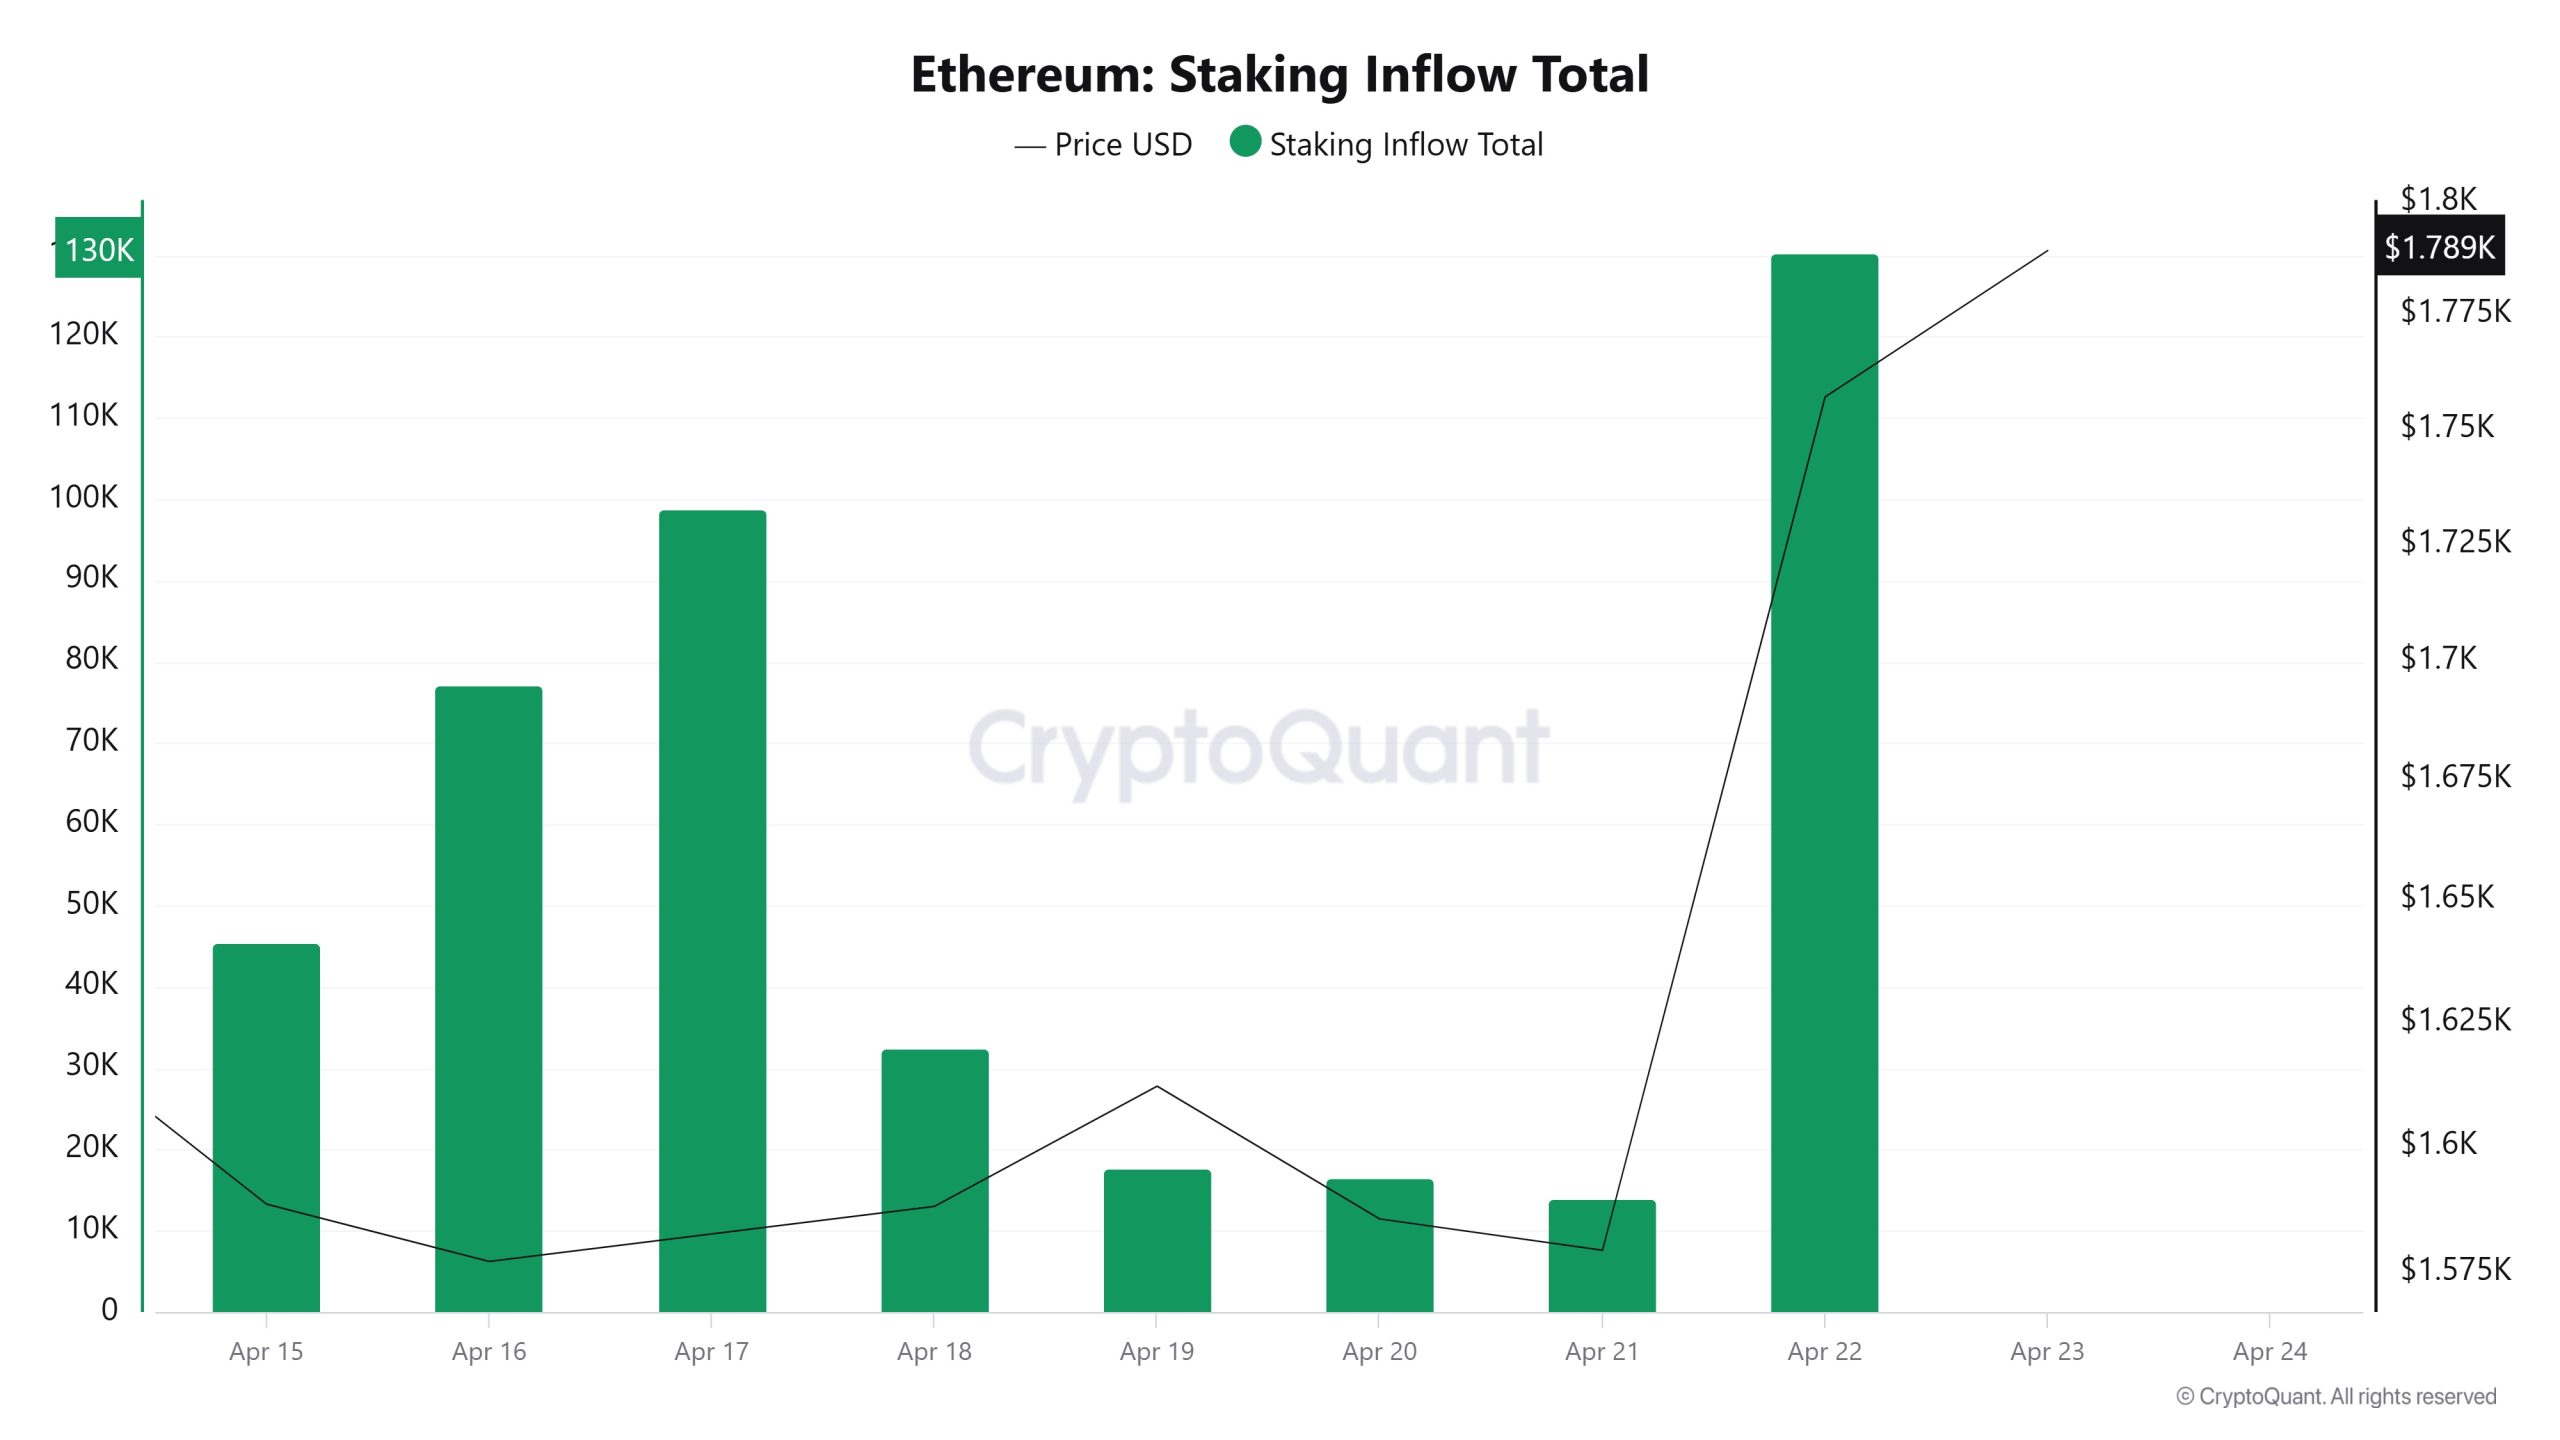
On April 16, ETH price was at 1,577, while the Staking Inflow Ratio was 77,191. As of April 22, ETH price rose to 1,756, while the Staking Inflow Ratio increased to 130,301. Compared to last week, there was an 11.35% increase in ETH price and a 68.81% increase in Staking Inflow Ratio .
Derivatives
Open Interest
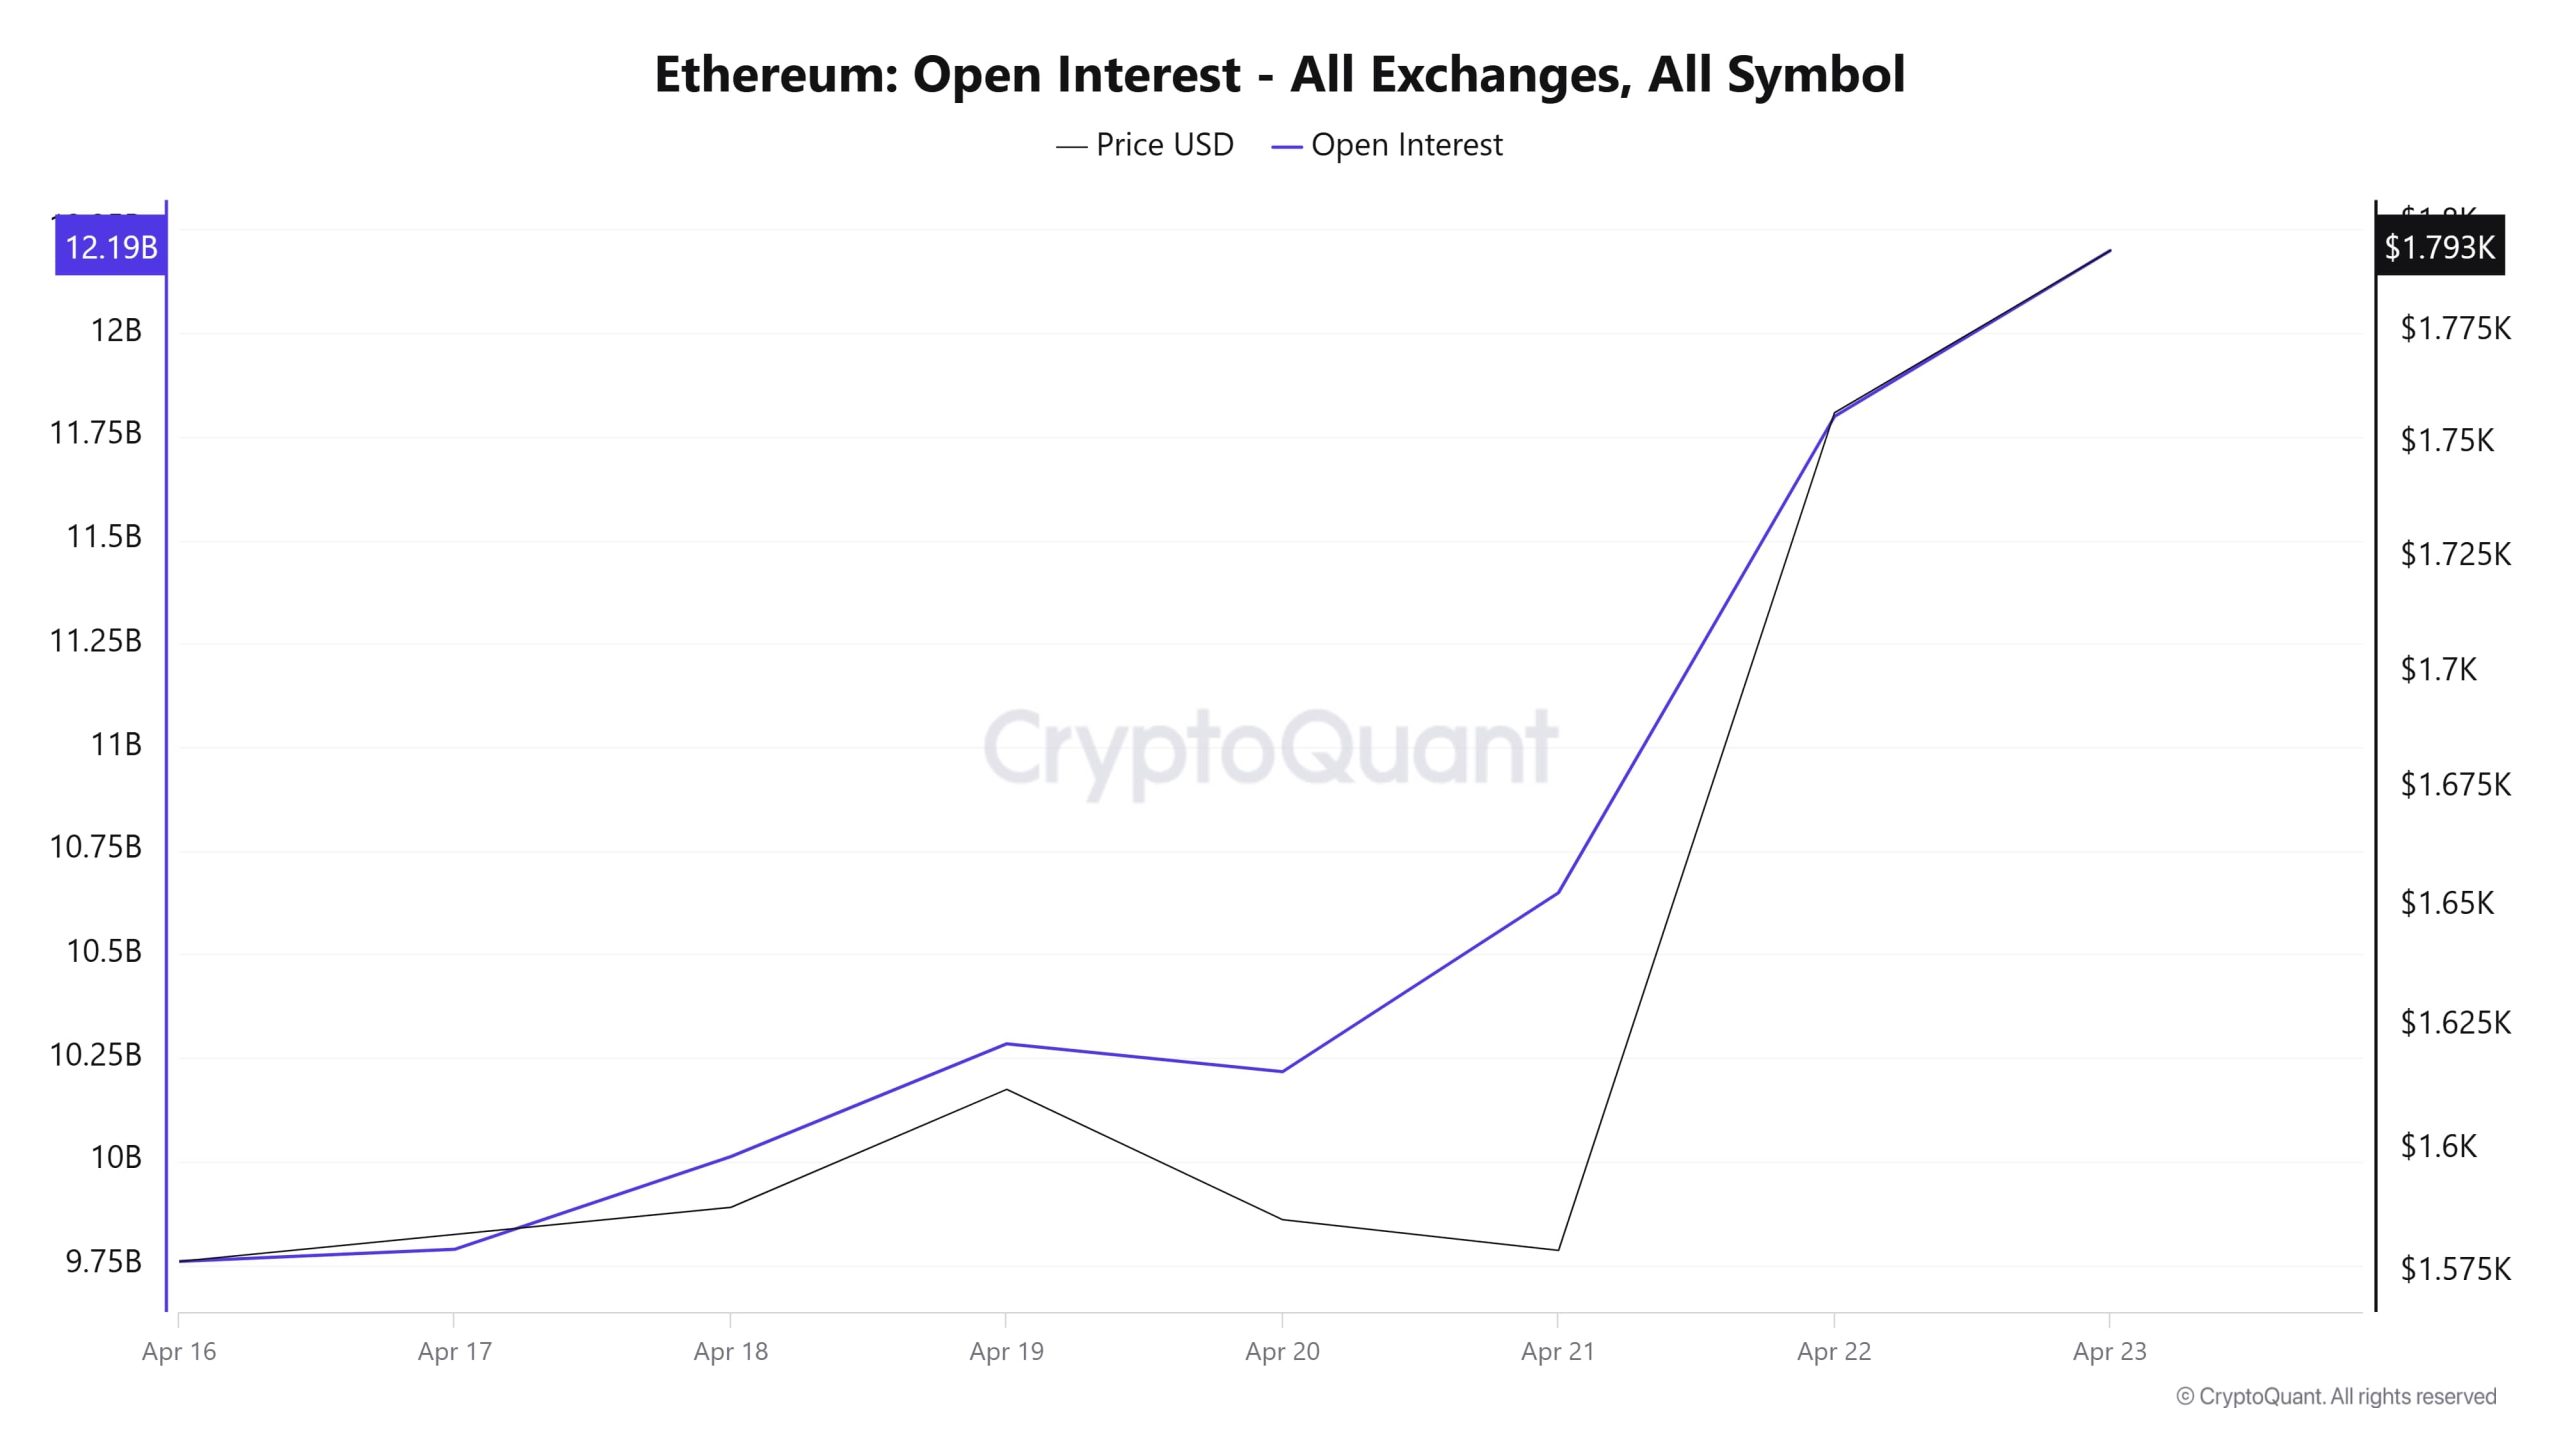
ETH price rose from $1,575 to $1,793, while open interest data showed a steady increase from $9.75 billion to $12.19 billion. An increase in open interest indicates that traders are expanding their positions or opening new long and short positions. However, the fact that the price accompanies this increase suggests that the positions are predominantly long and that bullish expectations are at the forefront. Especially after April 21, both the price and open interest rose aggressively together, suggesting that bullish confidence among market participants has increased. This also indicates that leveraged trading volume is growing and the market is becoming more volatile. As of April 23, both ETH price and open interest have reached their highest levels, indicating that the upside is still strong, but at the same time, the risk of a possible correction is growing. The concentration of highly leveraged long positions, especially at these levels, could lead to aggressive liquidations in the event of a price reversal.
Funding Rate
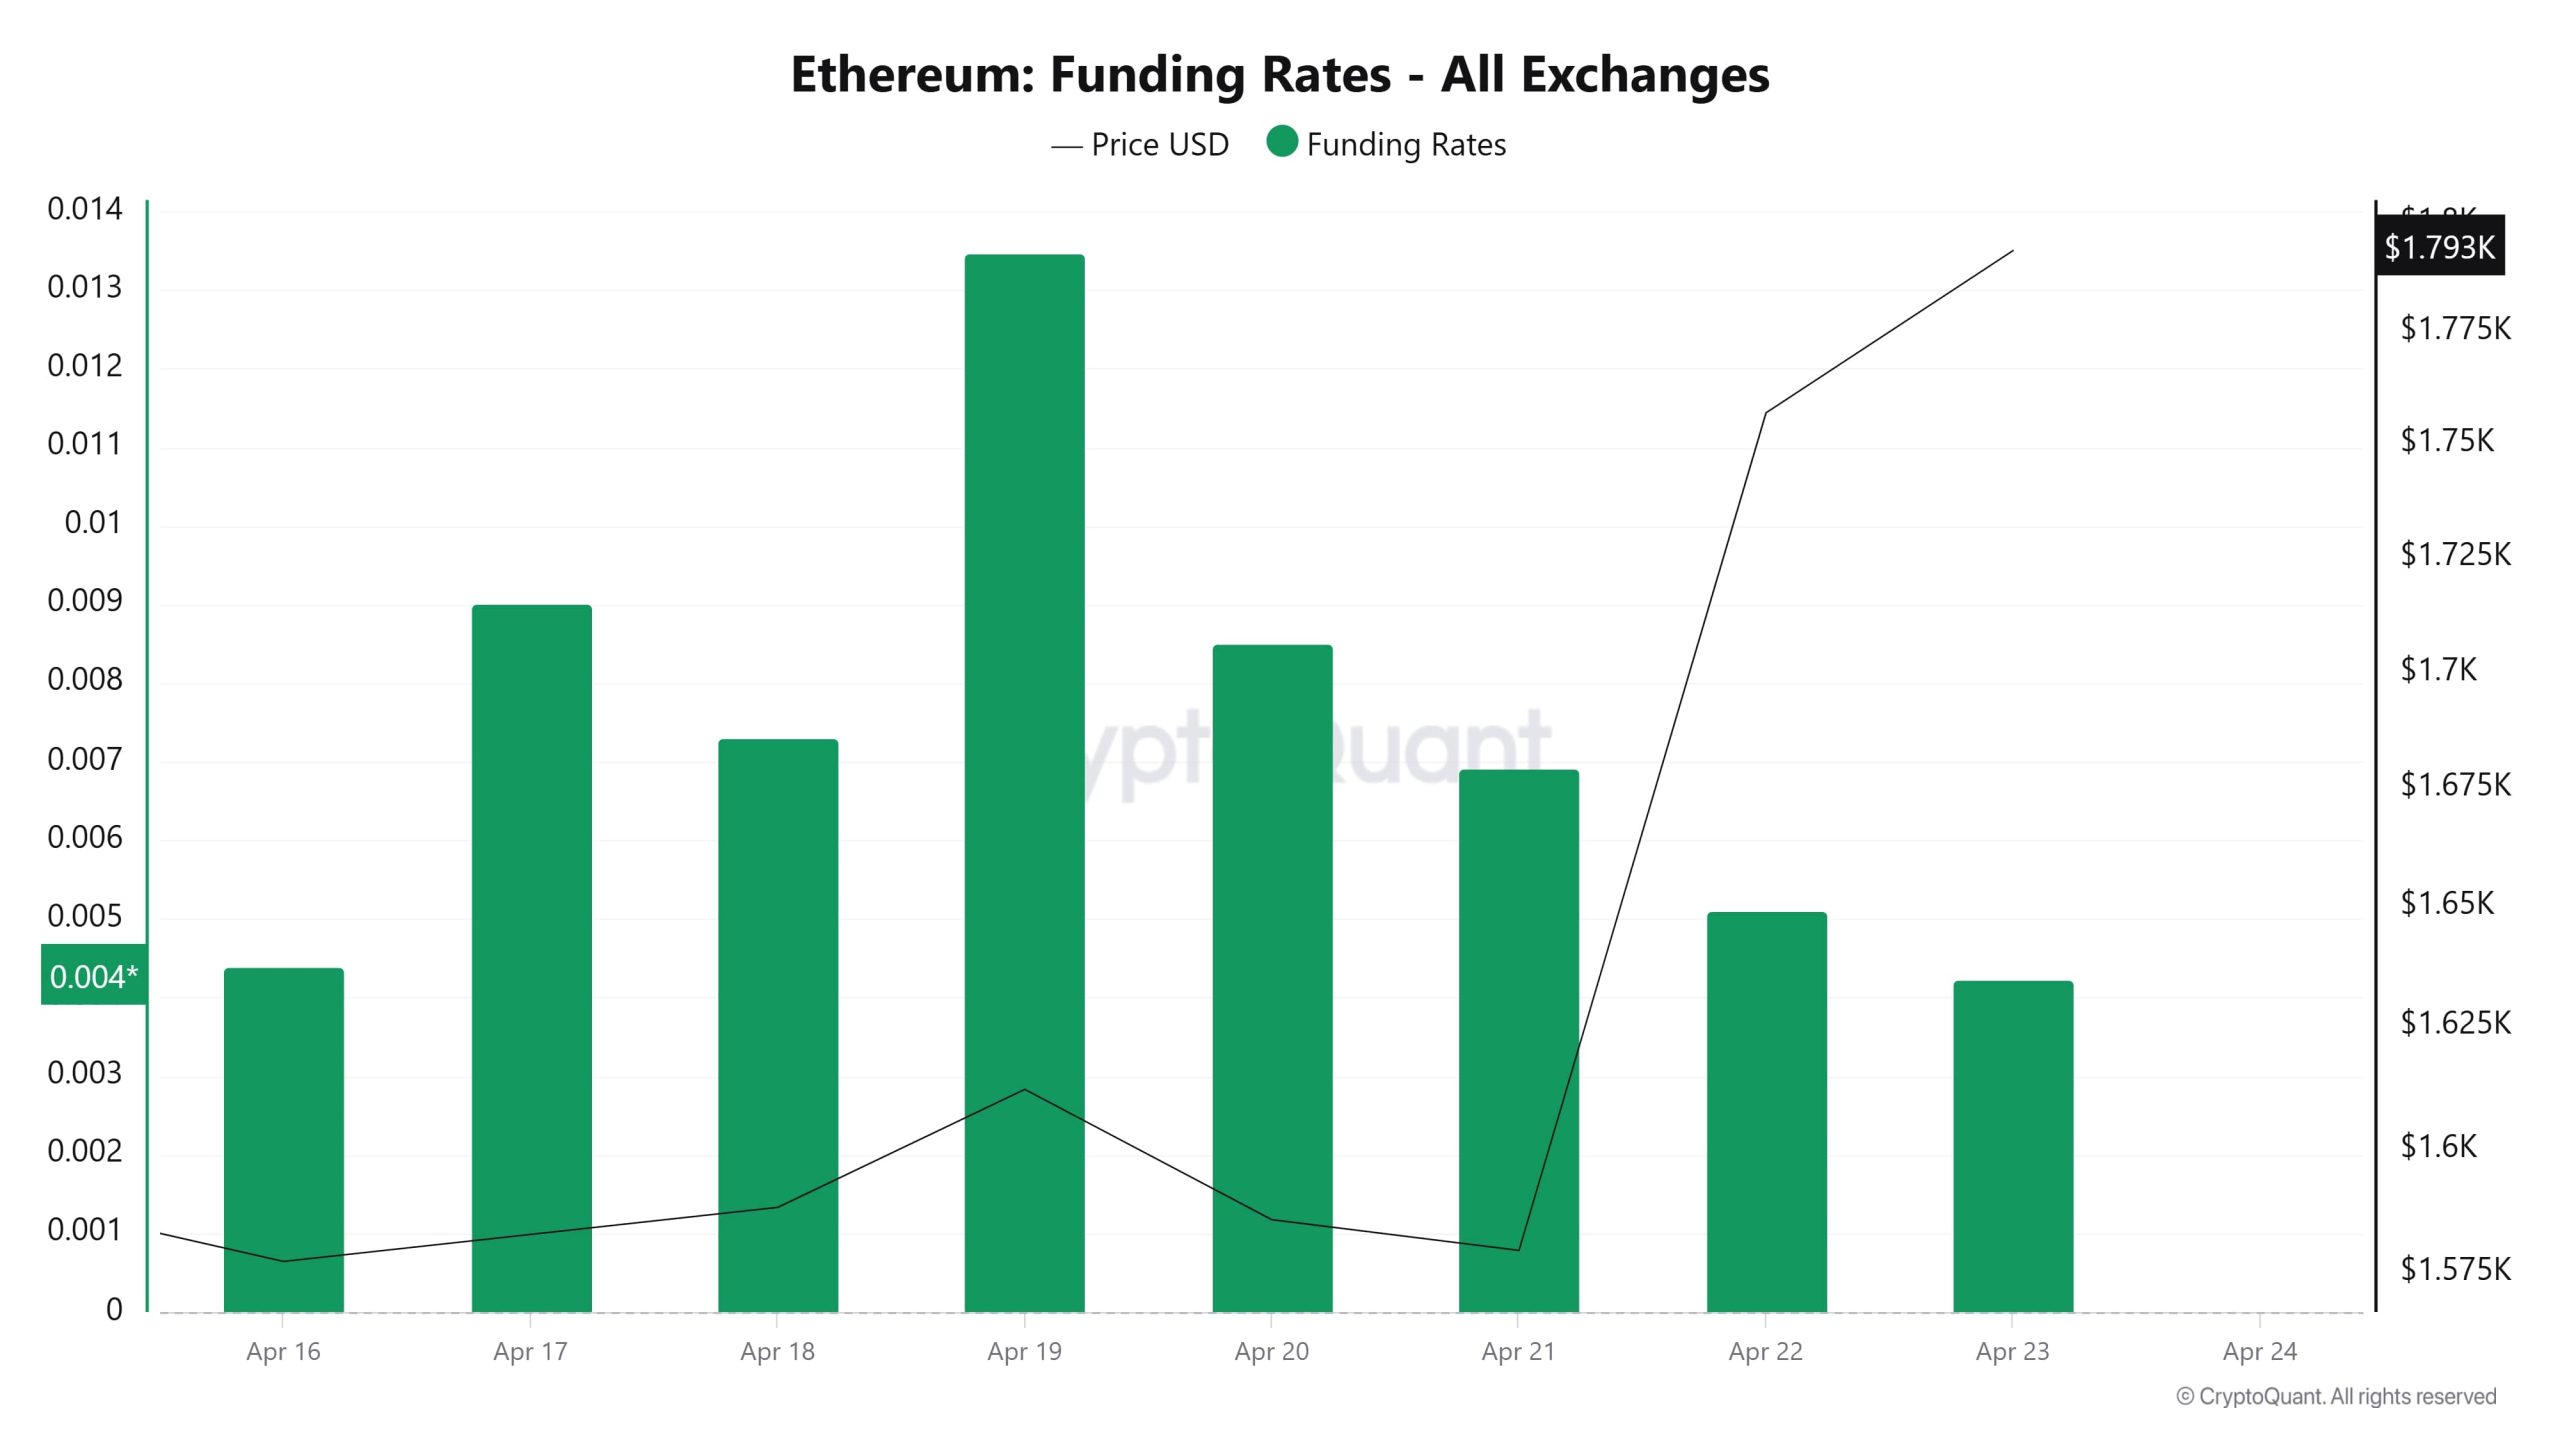
The chart shows that on April 19, funding rates peaked at around 1.34% (0.0134). It can be said that market participants were largely long on this date, expecting a bullish ETH price. However, on the following days, April 20 and 21, there was a significant drop in funding rates. This indicates that either long positions have started to be closed or short positions have started to increase. ETH price followed a sideways-moderate trend until April 21, after which it rose sharply. On April 21, the price was around $1,600, while as of April 23, it reached $1,793. This sudden price increase is likely to have been caused by short squeeze (liquidation of short positions). Because while funding rates continued to fall on April 22 and 23, the price continued to rise. This shows that the ratio of short positions increased while the price was rising.
To summarize, there may have been a peak in funding rates on April 19 due to excessive long positioning and a correction in the market with the subsequent decline. However, the rapid rise in prices after April 21 suggests that the market has resumed an upward trend and short positions have increased. Funding ratios do not move with the price, suggesting that market participants are cautious but looking for direction. Such divergences may be the leading signal of volatile movements.
Long & Short Liquidations
With ETH rising to the level of $ 1,800 during the week, a short position of $ 231.04 million was liquidated. In the same period, a long position of 150.1 million dollars was liquidated.
| Date | Long Amount (Million $) | Short Amount (Million $) |
|---|---|---|
| April 16 | 38.71 | 24.90 |
| April 17 | 14.88 | 16.91 |
| April 18 | 5.03 | 3.91 |
| April 19 | 3.66 | 15.83 |
| April 20 | 15.74 | 7.58 |
| April 21 | 37.33 | 37.15 |
| April 22 | 34.75 | 124.76 |
| Total | 150.10 | 231.04 |
Supply Distribution
Total Supply: It reached 120,710,936 units, up about 0.0488% from last week.
New Supply: The amount of ETH produced this week was 58,873.
Velocity: Velocity, which was 7.73 last week, has not shown any change as of April 21.
| Wallet Category | 14.04.2025 | 21.04.2025 | Change (%) |
|---|---|---|---|
| 100 – 1k ETH | 9.2894M | 9.2773M | -0.1303% |
| 1k – 10k ETH | 12.565M | 12.4525M | -0.8956% |
| 10k – 100k ETH | 16.1504M | 16.149M | -0.0087% |
| 100k+ ETH | 5.1282M | 4.6361M | -9.5955% |
According to the latest data, there was a limited decrease of 0.13% in 100 – 1k ETH wallets, while the 1k – 10k ETH category saw a remarkable decline of 0.89%. In the 10k – 100k ETH range, a near-flat decrease of 0.0087% was observed, while the most significant change occurred in 100k+ ETH wallets with a strong decrease of 9.59%.
Exchange Reserve
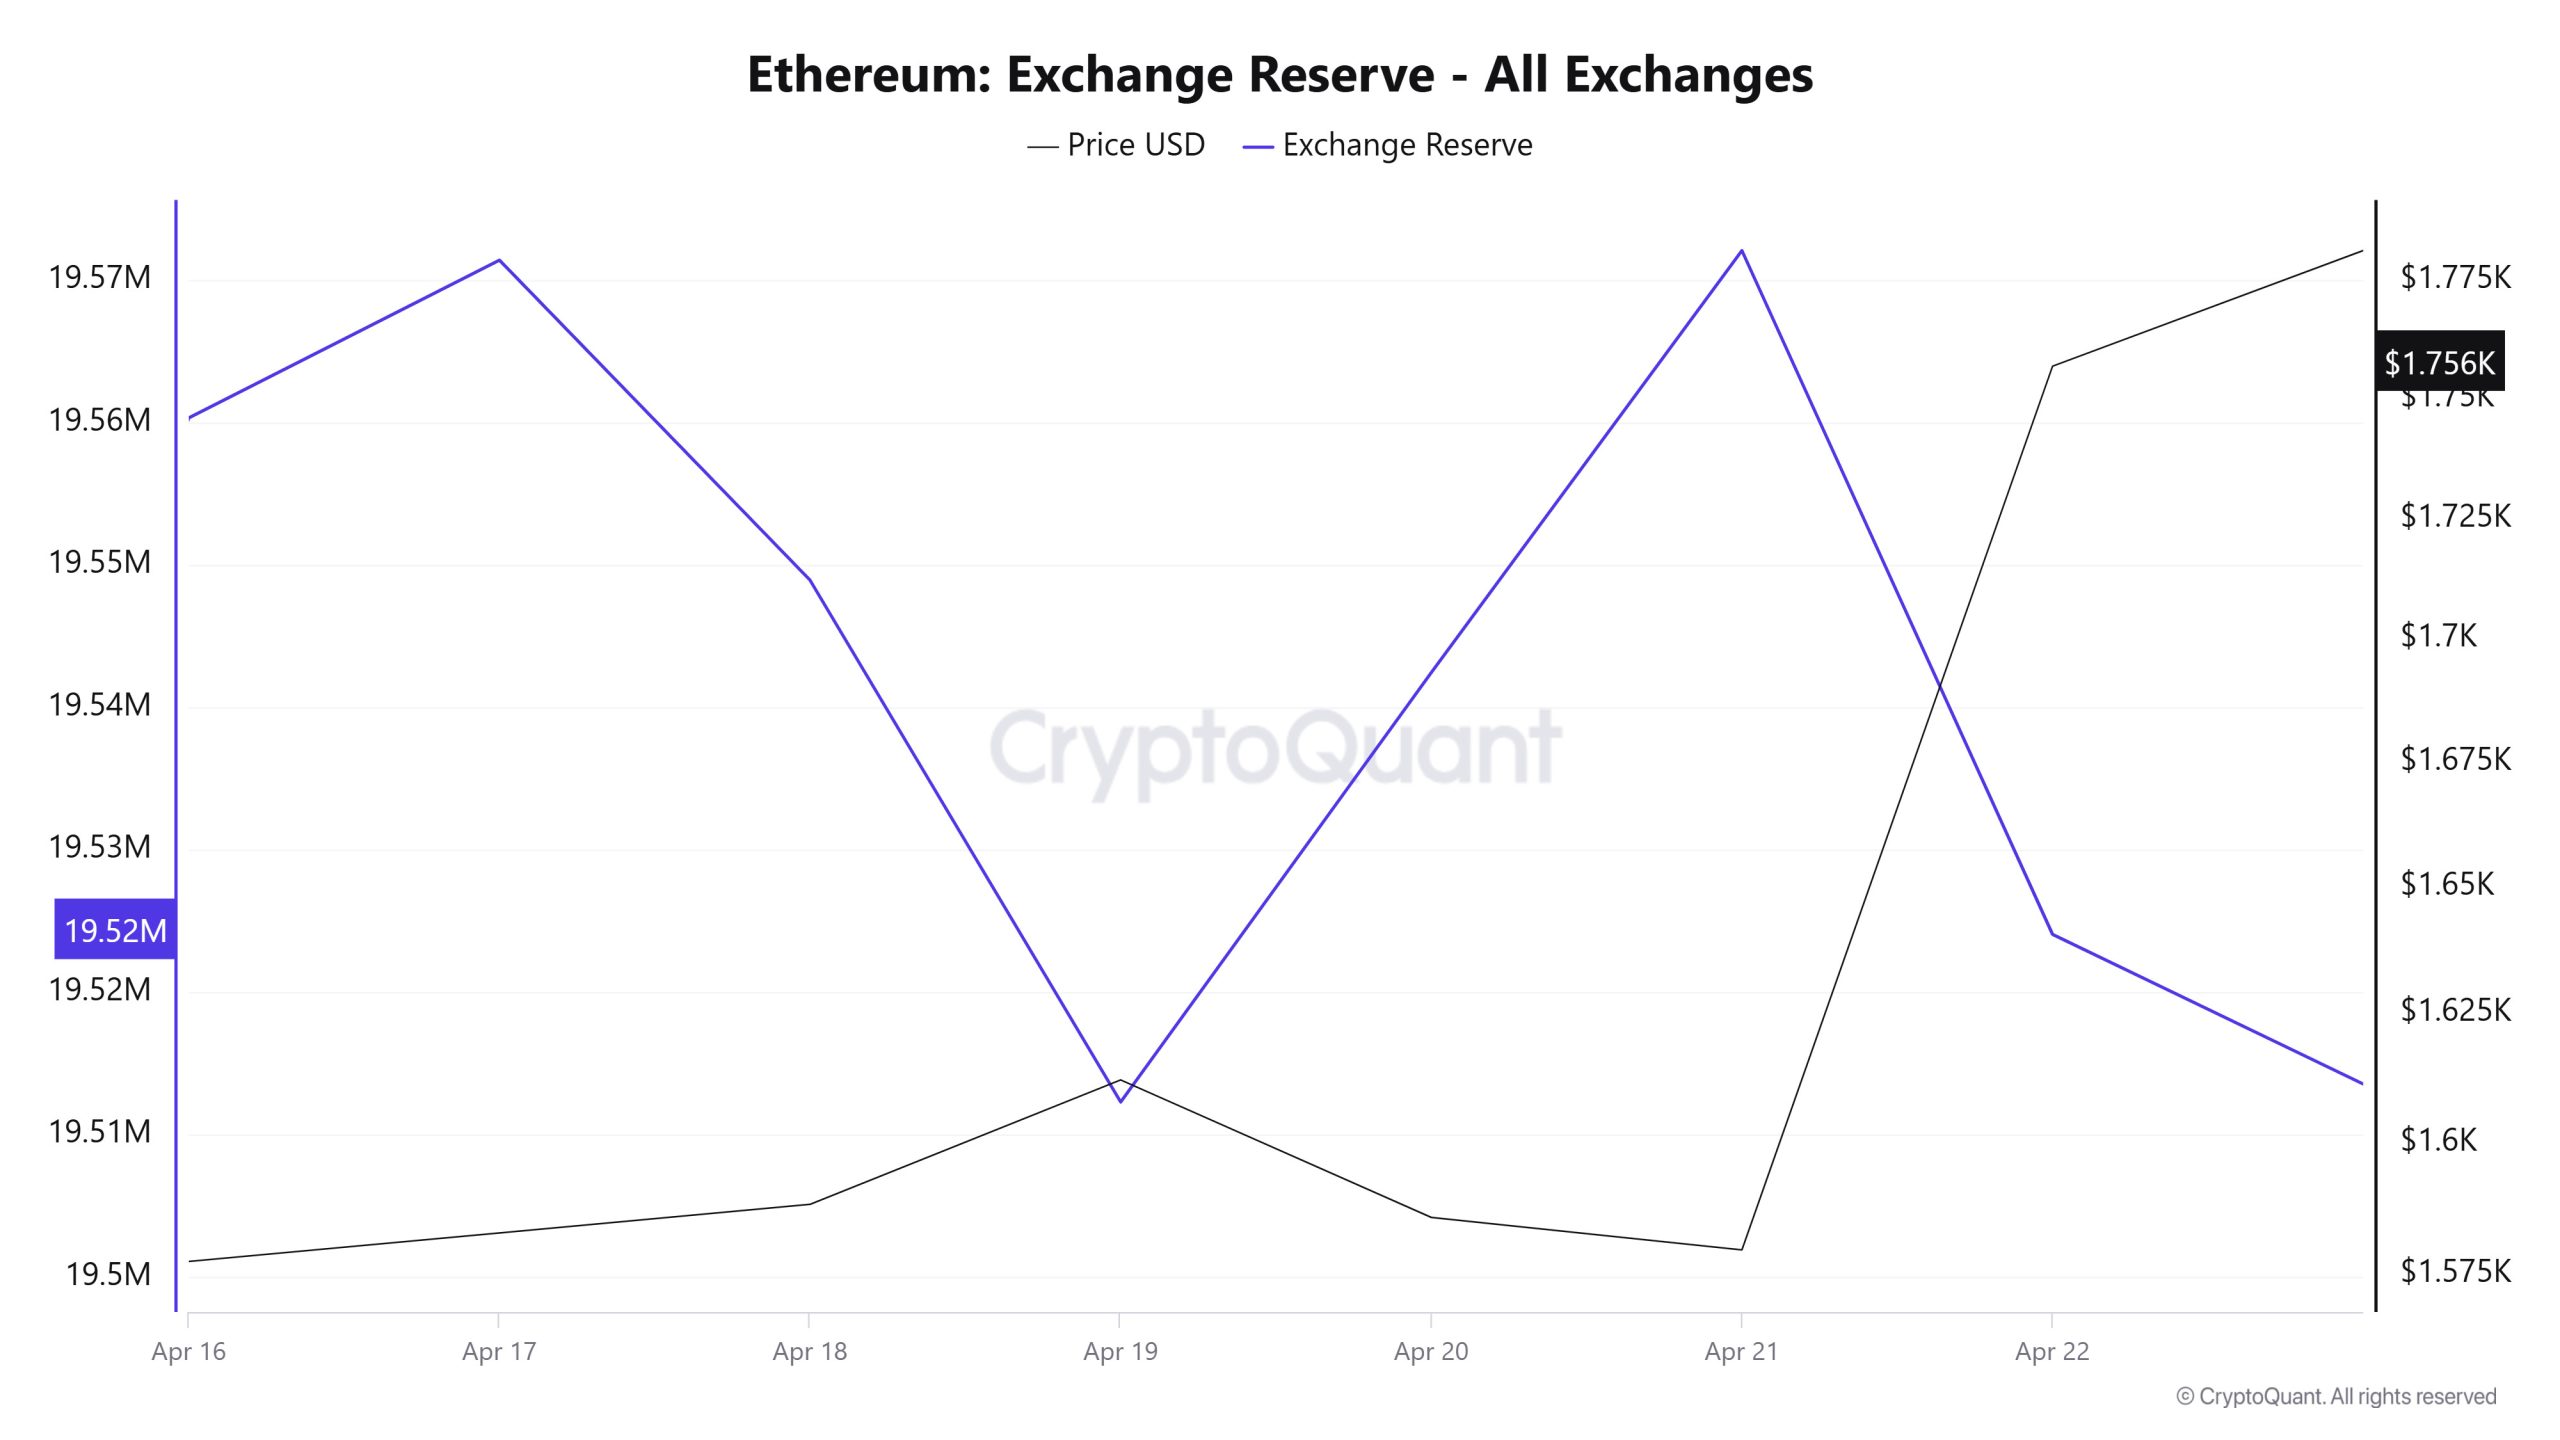
Between April 16-22, 2025, Ethereum reserves on exchanges decreased from 19,560,348 ETH to 19,524,075 ETH. During this period, there was a total net outflow of 36,273 ETH and the Ethereum reserves of the exchanges decreased by 0.19%. The Ethereum price increased by approximately 11.4% during the same period. Ethereum, which closed at $1,577 on April 16, 2025, closed at $1,757 on April 22, 2025. Outflows from exchanges may indicate that selling pressure has subsided and investors are taking more long-term custody positions. This trend could shift Ethereum supply off-exchange, putting upward pressure on the price. (Bullish)
| Metric / Date | 16-Apr | 17-Apr | 18-Apr | 19-Apr | 20-Apr | 21-Apr | 22-Apr |
|---|---|---|---|---|---|---|---|
| Exchange Inflow | 616,862 | 593,008 | 509,850 | 461,115 | 593,173 | 1,115,453 | 1,575,286 |
| Exchange Outflow | 557,614 | 581,925 | 532,325 | 497,779 | 562,997 | 1,085,814 | 1,623,316 |
| Exchange Netflow | 59,248 | 11,083 | -22,475 | -36,664 | 30,176 | 29,639 | -48,031 |
| Exchange Reserve | 19,560,348 | 19,571,430 | 19,548,956 | 19,512,291 | 19,542,467 | 19,572,106 | 19,524,075 |
| ETH Price ($) | 1,577 | 1,583 | 1,588 | 1,612 | 1,586 | 1,580 | 1,757 |
Fees and Revenues
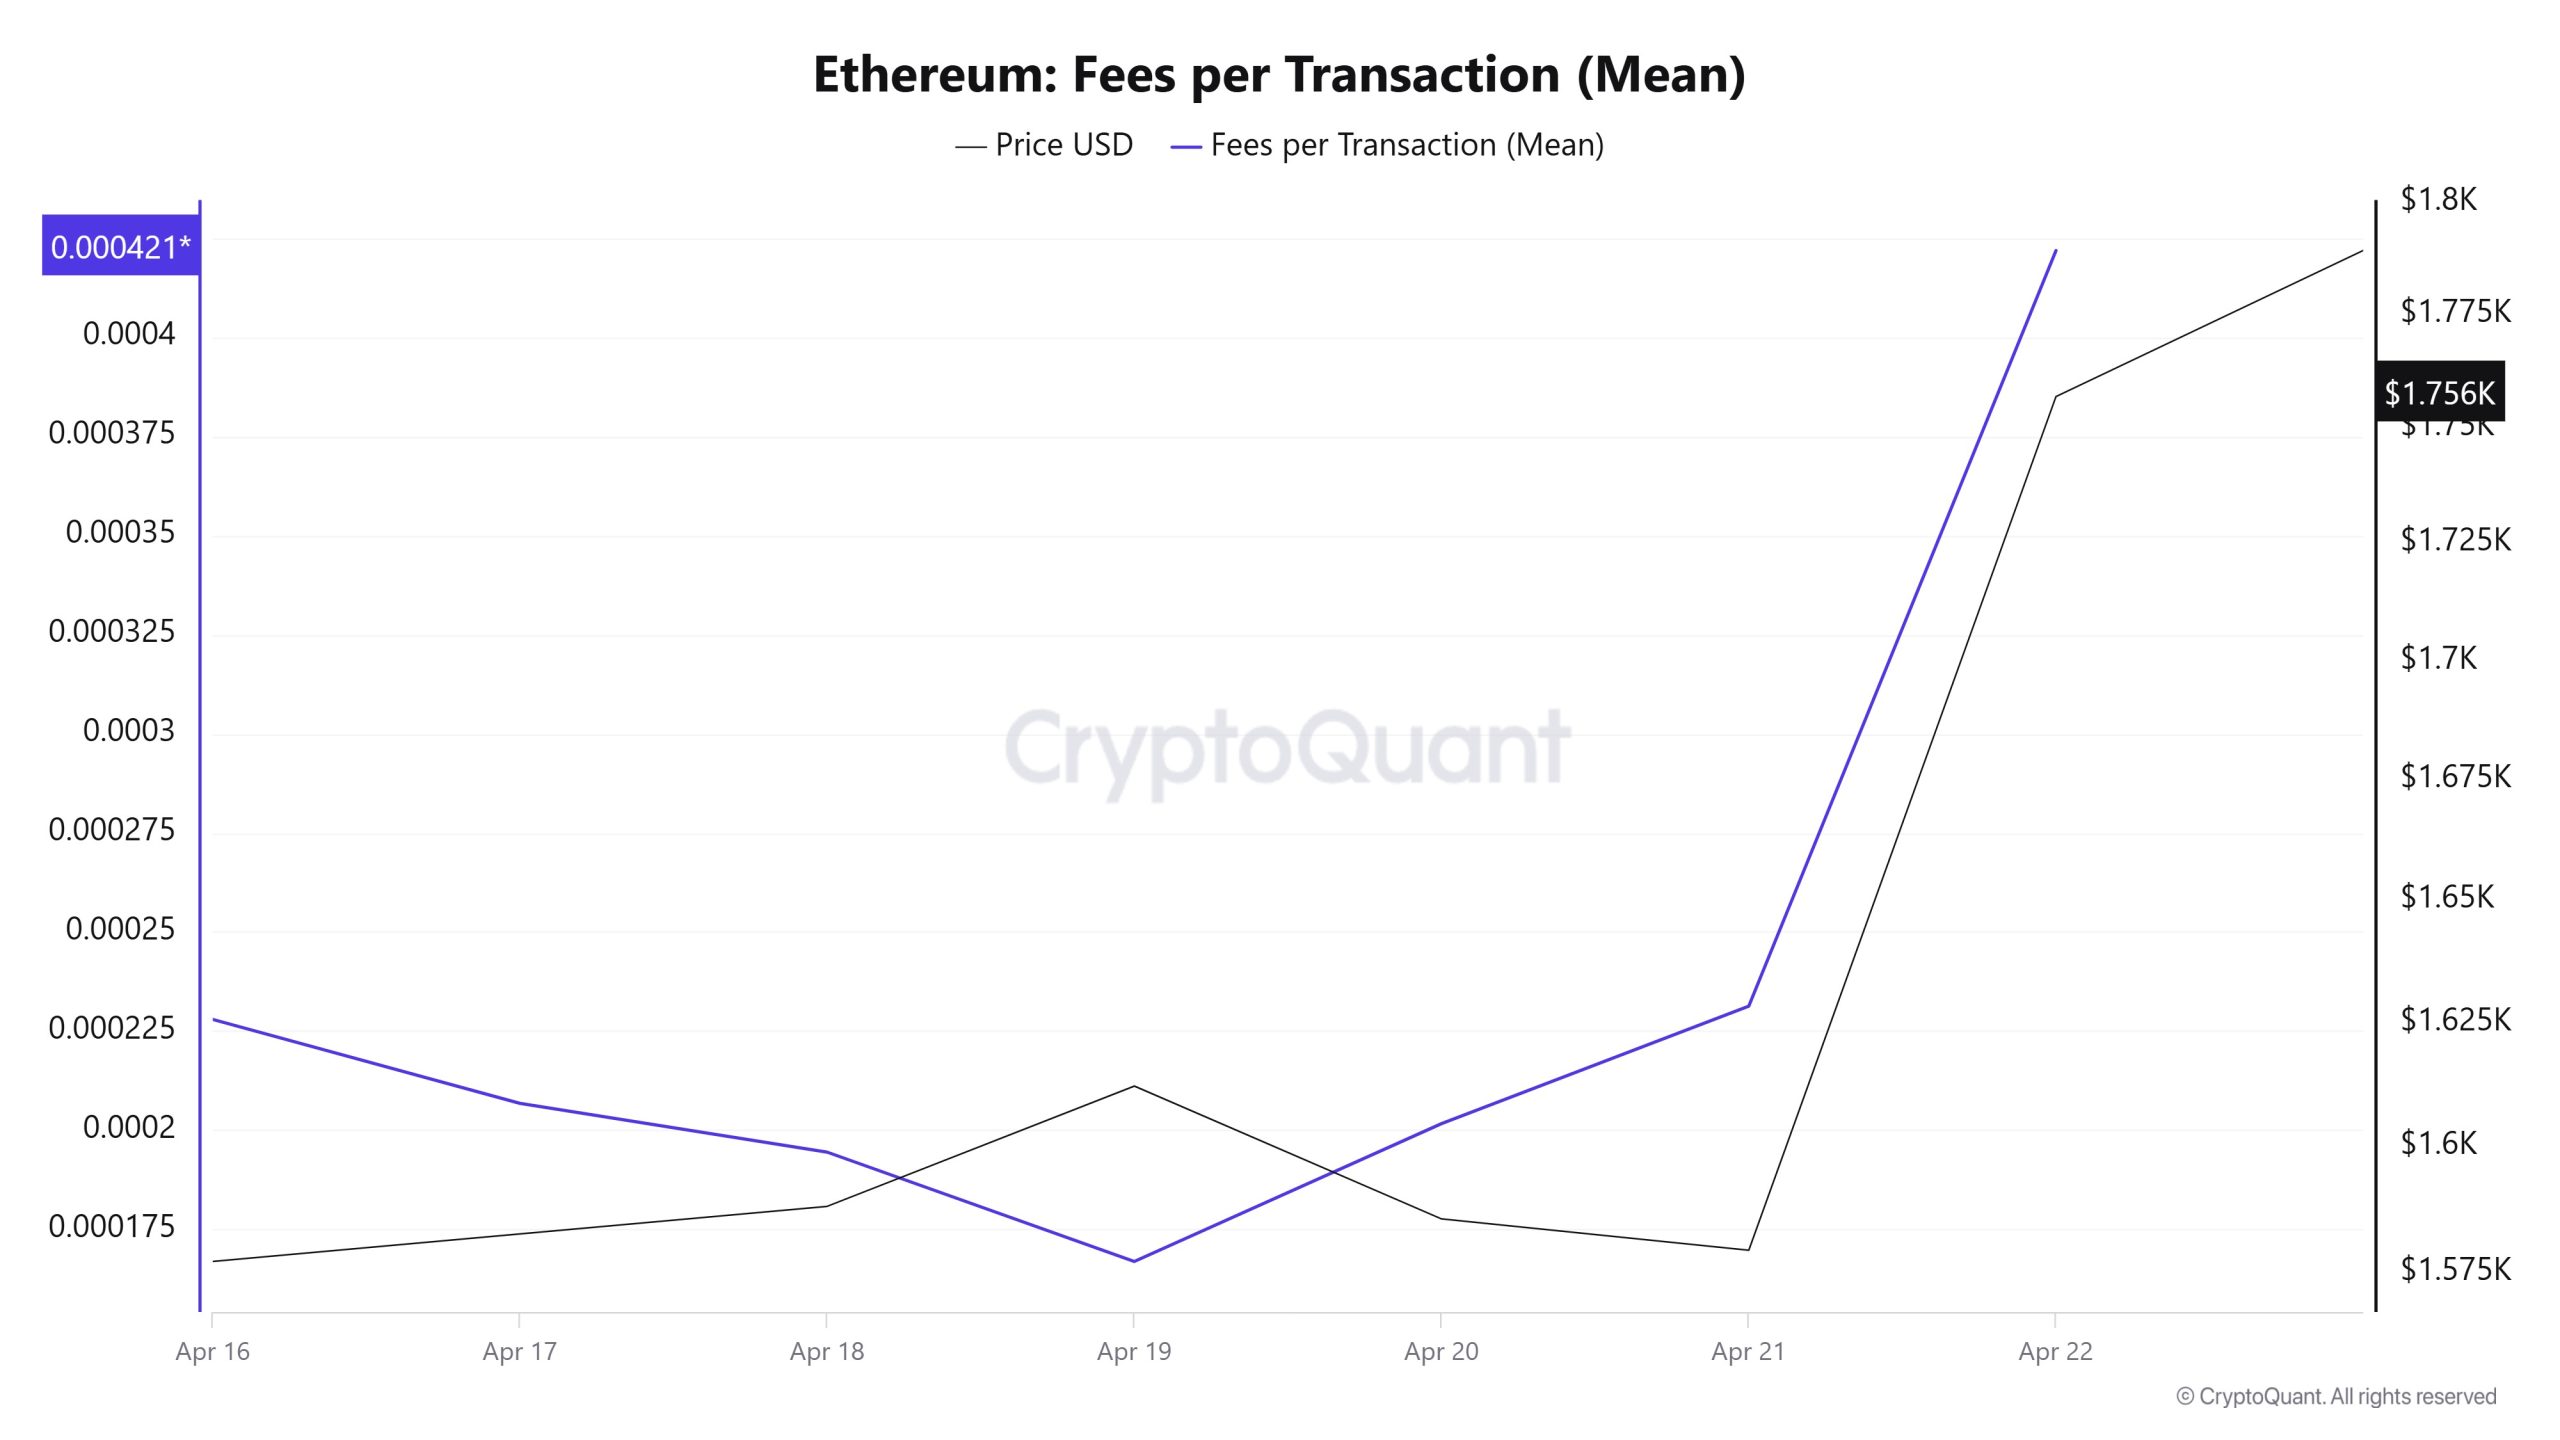
Analysing the Ethereum Fees per Transaction (Mean) data between April 16 and 22, it was seen that this value was at the level of 0.000227927398228008 on April 16, the first day of the weekly period. Until April 21, the value, which showed a horizontal trend, was realized at 0.000231281577362603 on this date.
On April 22, the last day of the weekly period, the value gained upward momentum again with the fluctuations in the Ethereum price, reaching 0.000421904253984217 on this date. This level was the highest value recorded on a weekly basis.
Bitcoin: Fees (Total)
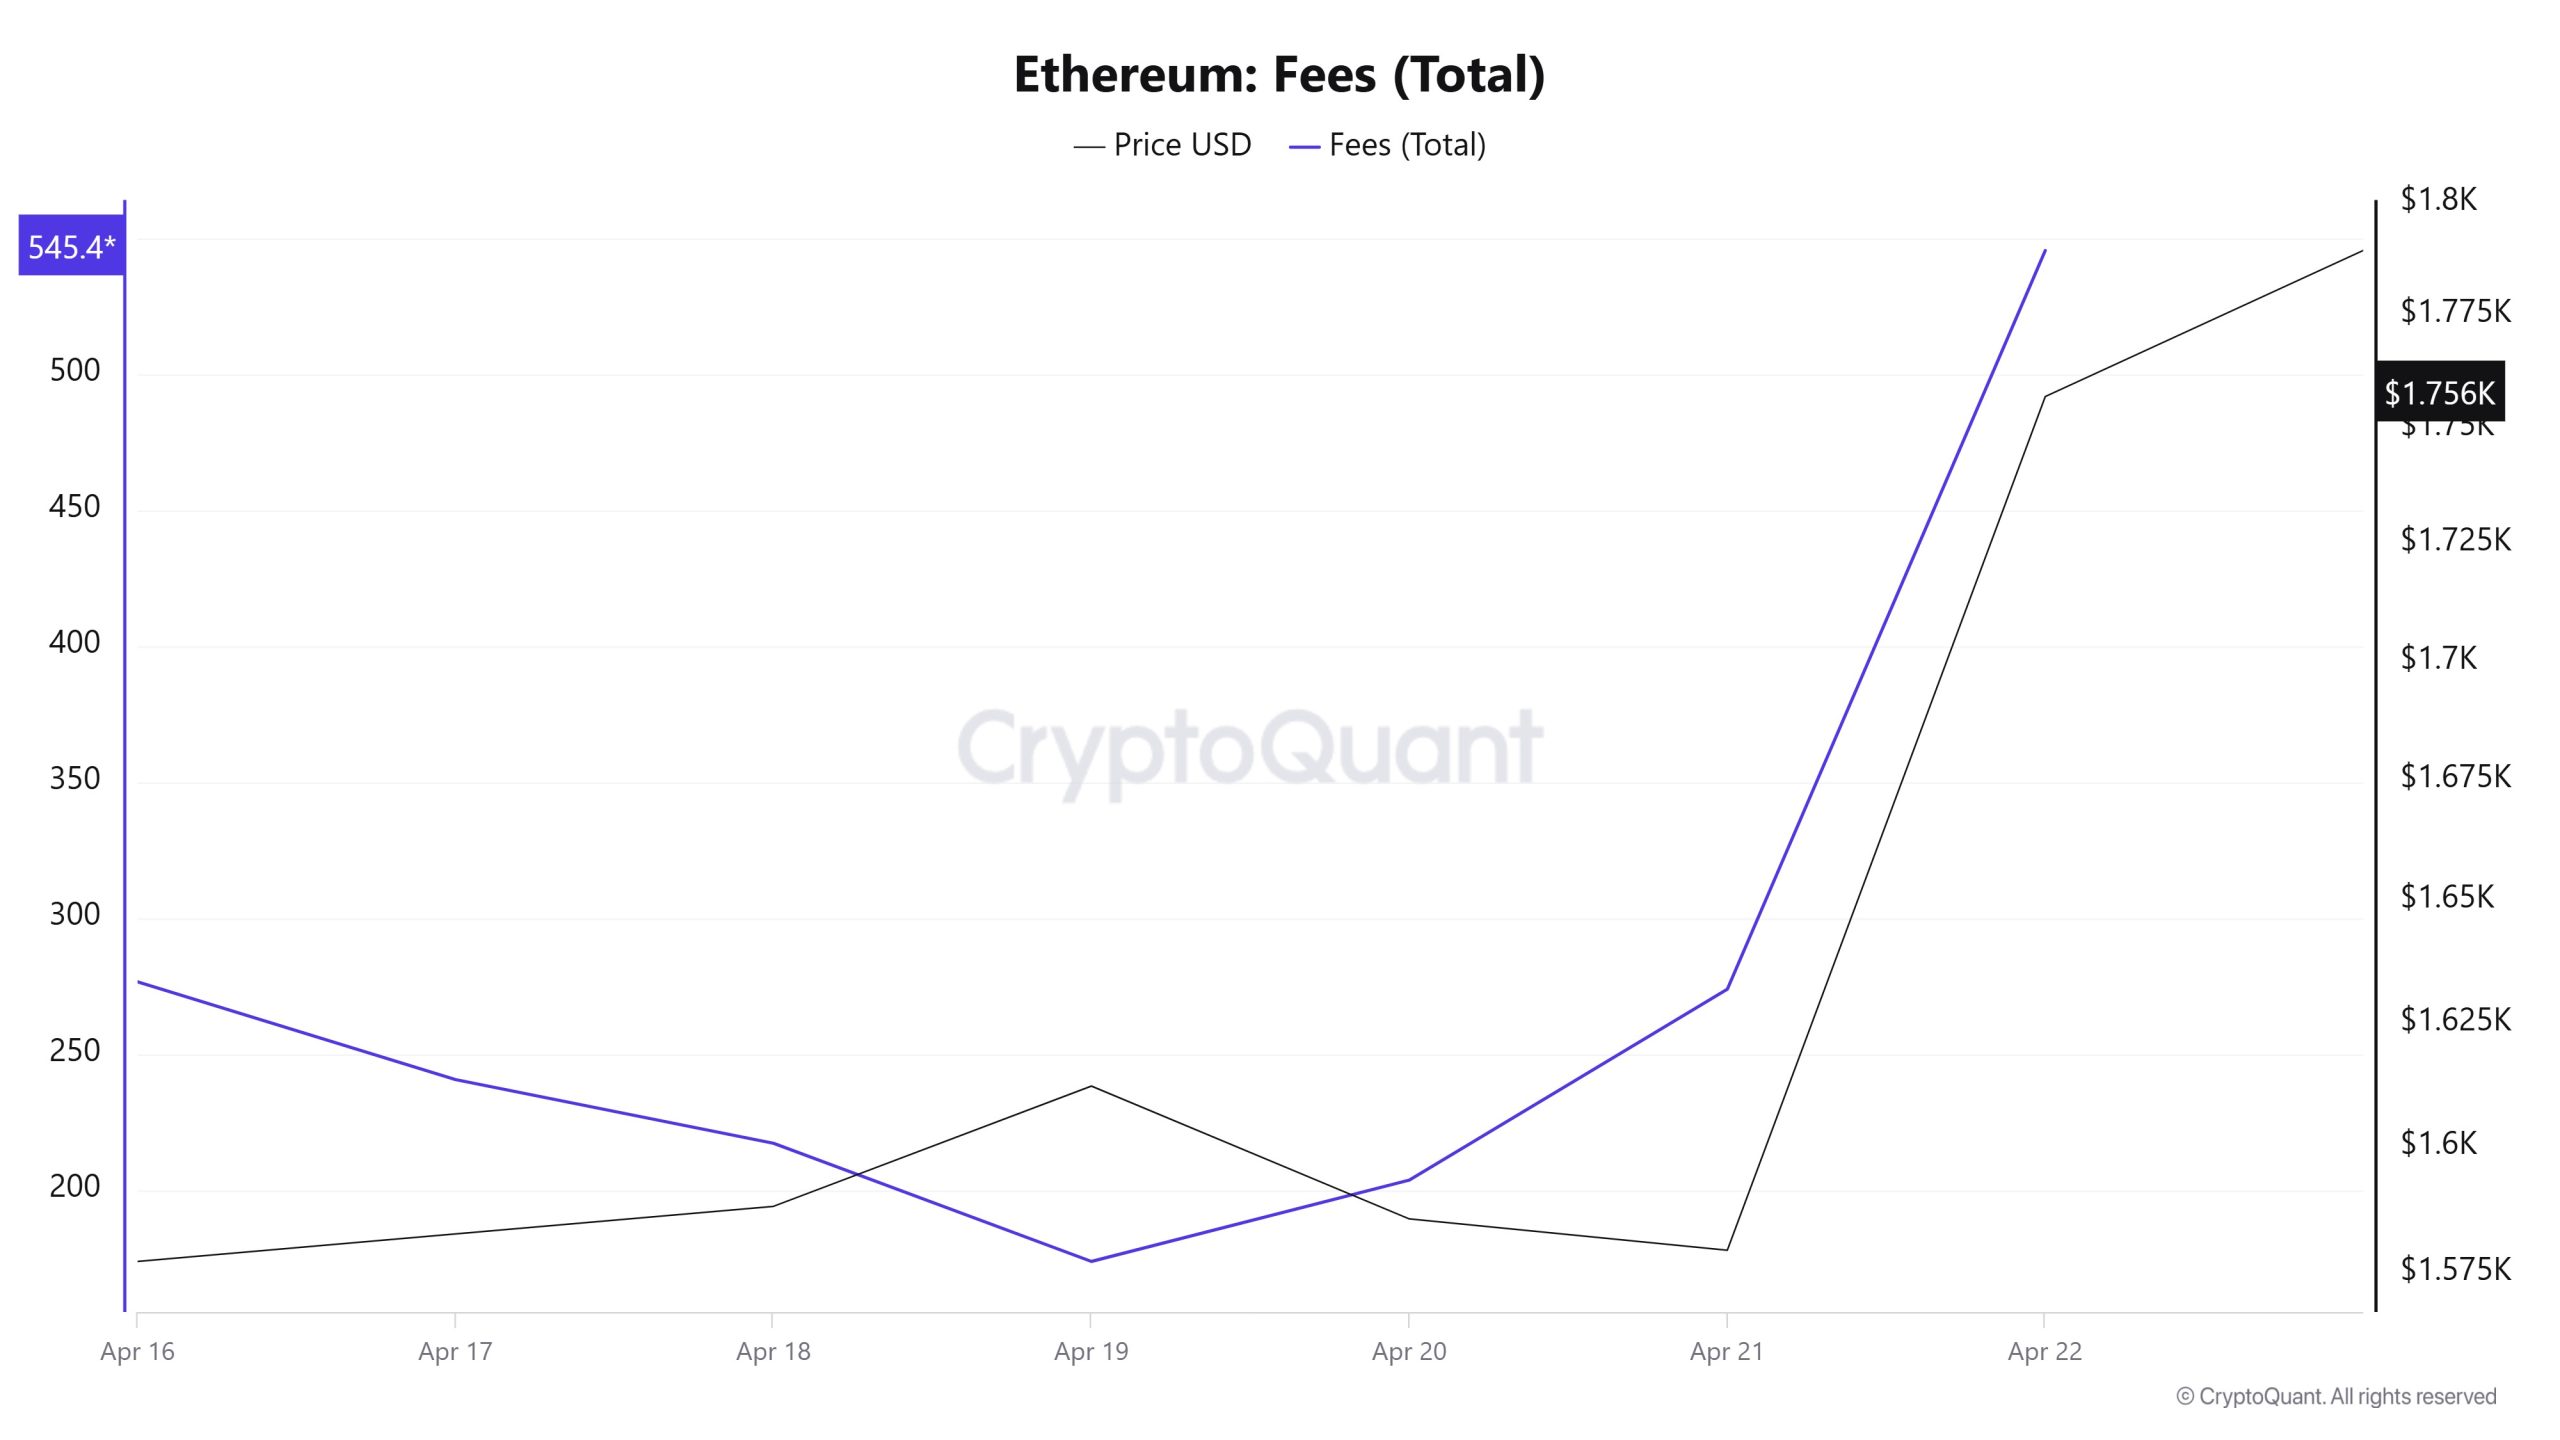
Similarly, when the Ethereum Fees (Total) data between April 16 and 22 were analyzed, it was seen that this value was at 276.6797011445899 on April 16, the first day of the weekly period. Until April 21, the value, which showed a horizontal trend, was 273.95094685180646 on this date.
On April 22, the last day of the weekly period, the value gained upward momentum again with the fluctuations in the Ethereum price, reaching 545,4884480612735 on this date. This level was the highest value recorded on a weekly basis.
Blocks Mined
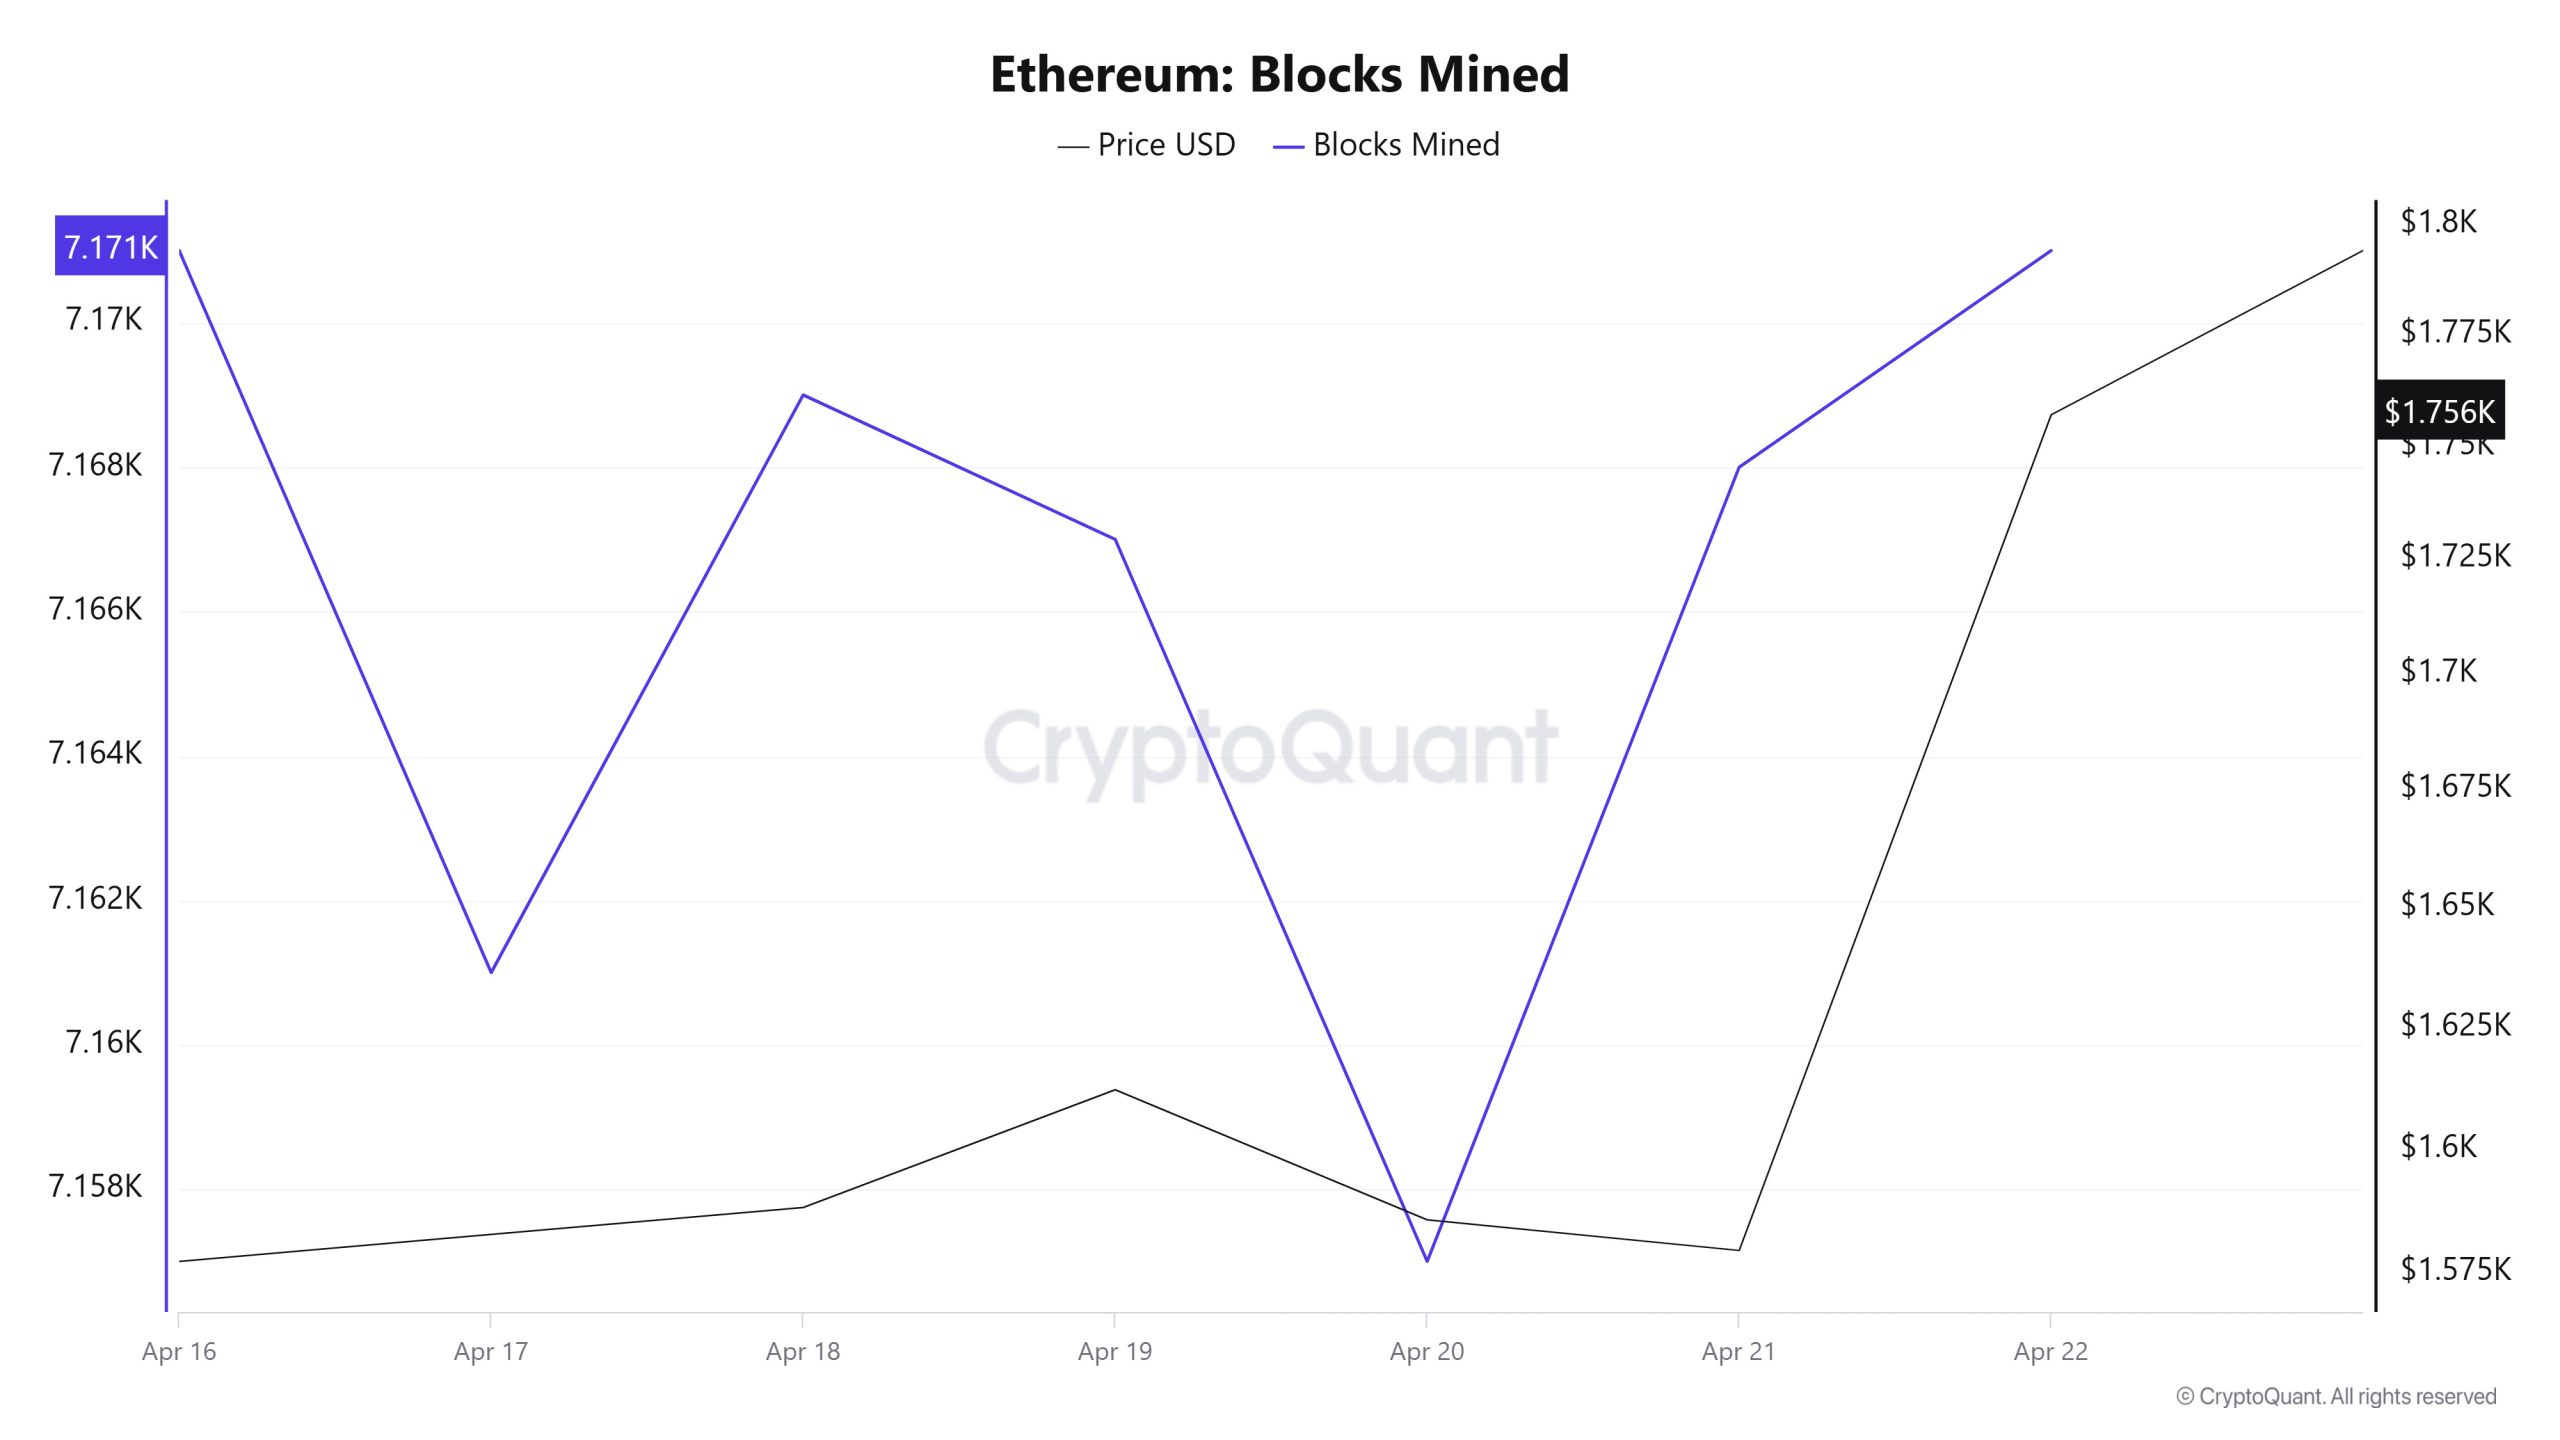
When we examine the Ethereum Blocks Mined table between April 16 – 22, the number of blocks produced decreased towards the middle of the week but increased towards the end of the week. While 7,171 blocks were produced on April 16, this number was 7,171 again on April 22. Although there was a negative correlation between Blocks Mined and Ethereum price at the beginning of the week, the correlation turned positive by mid-week.
Block Size
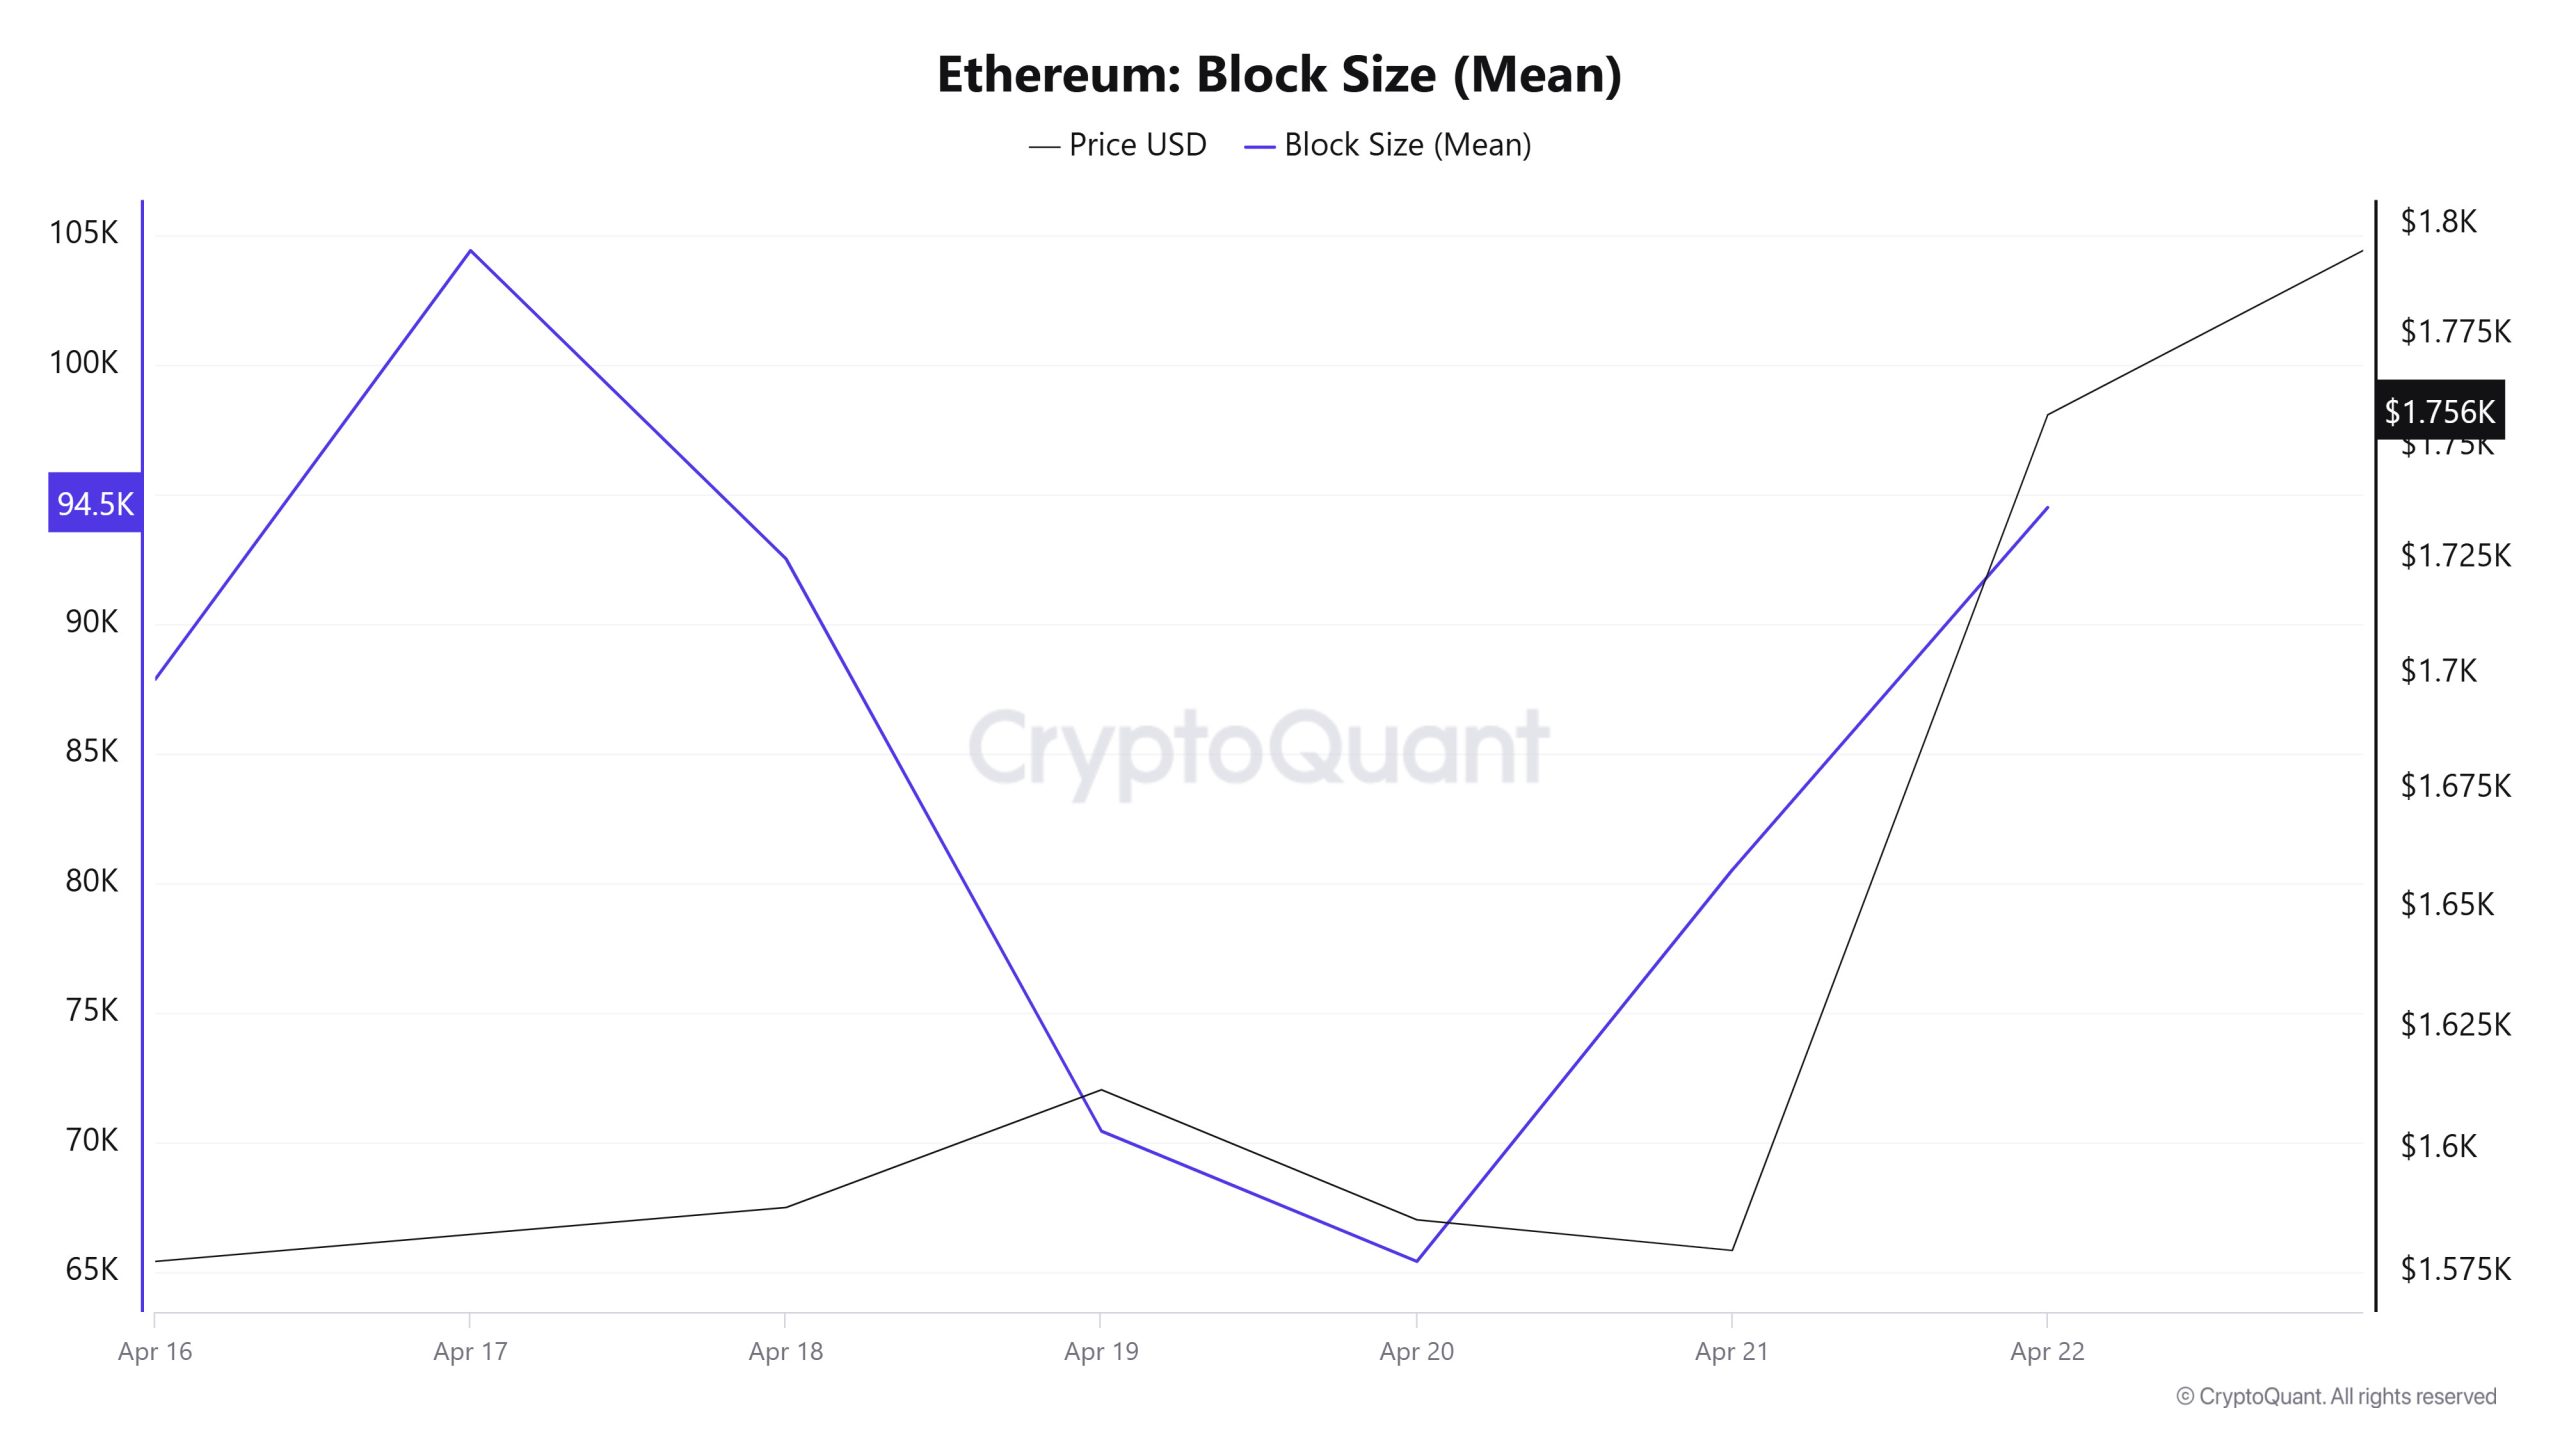
Between April 16 and April 22, when we examine the Ethereum Block Size table, there was a slight decrease in the middle of the week, but then it increased towards the end of the week. The block size, which was 87,881 bytes on April 16, reached 94,509 bytes on April 22. There was a positive correlation between Block Size and Ethereum price throughout the week.
Block Interval
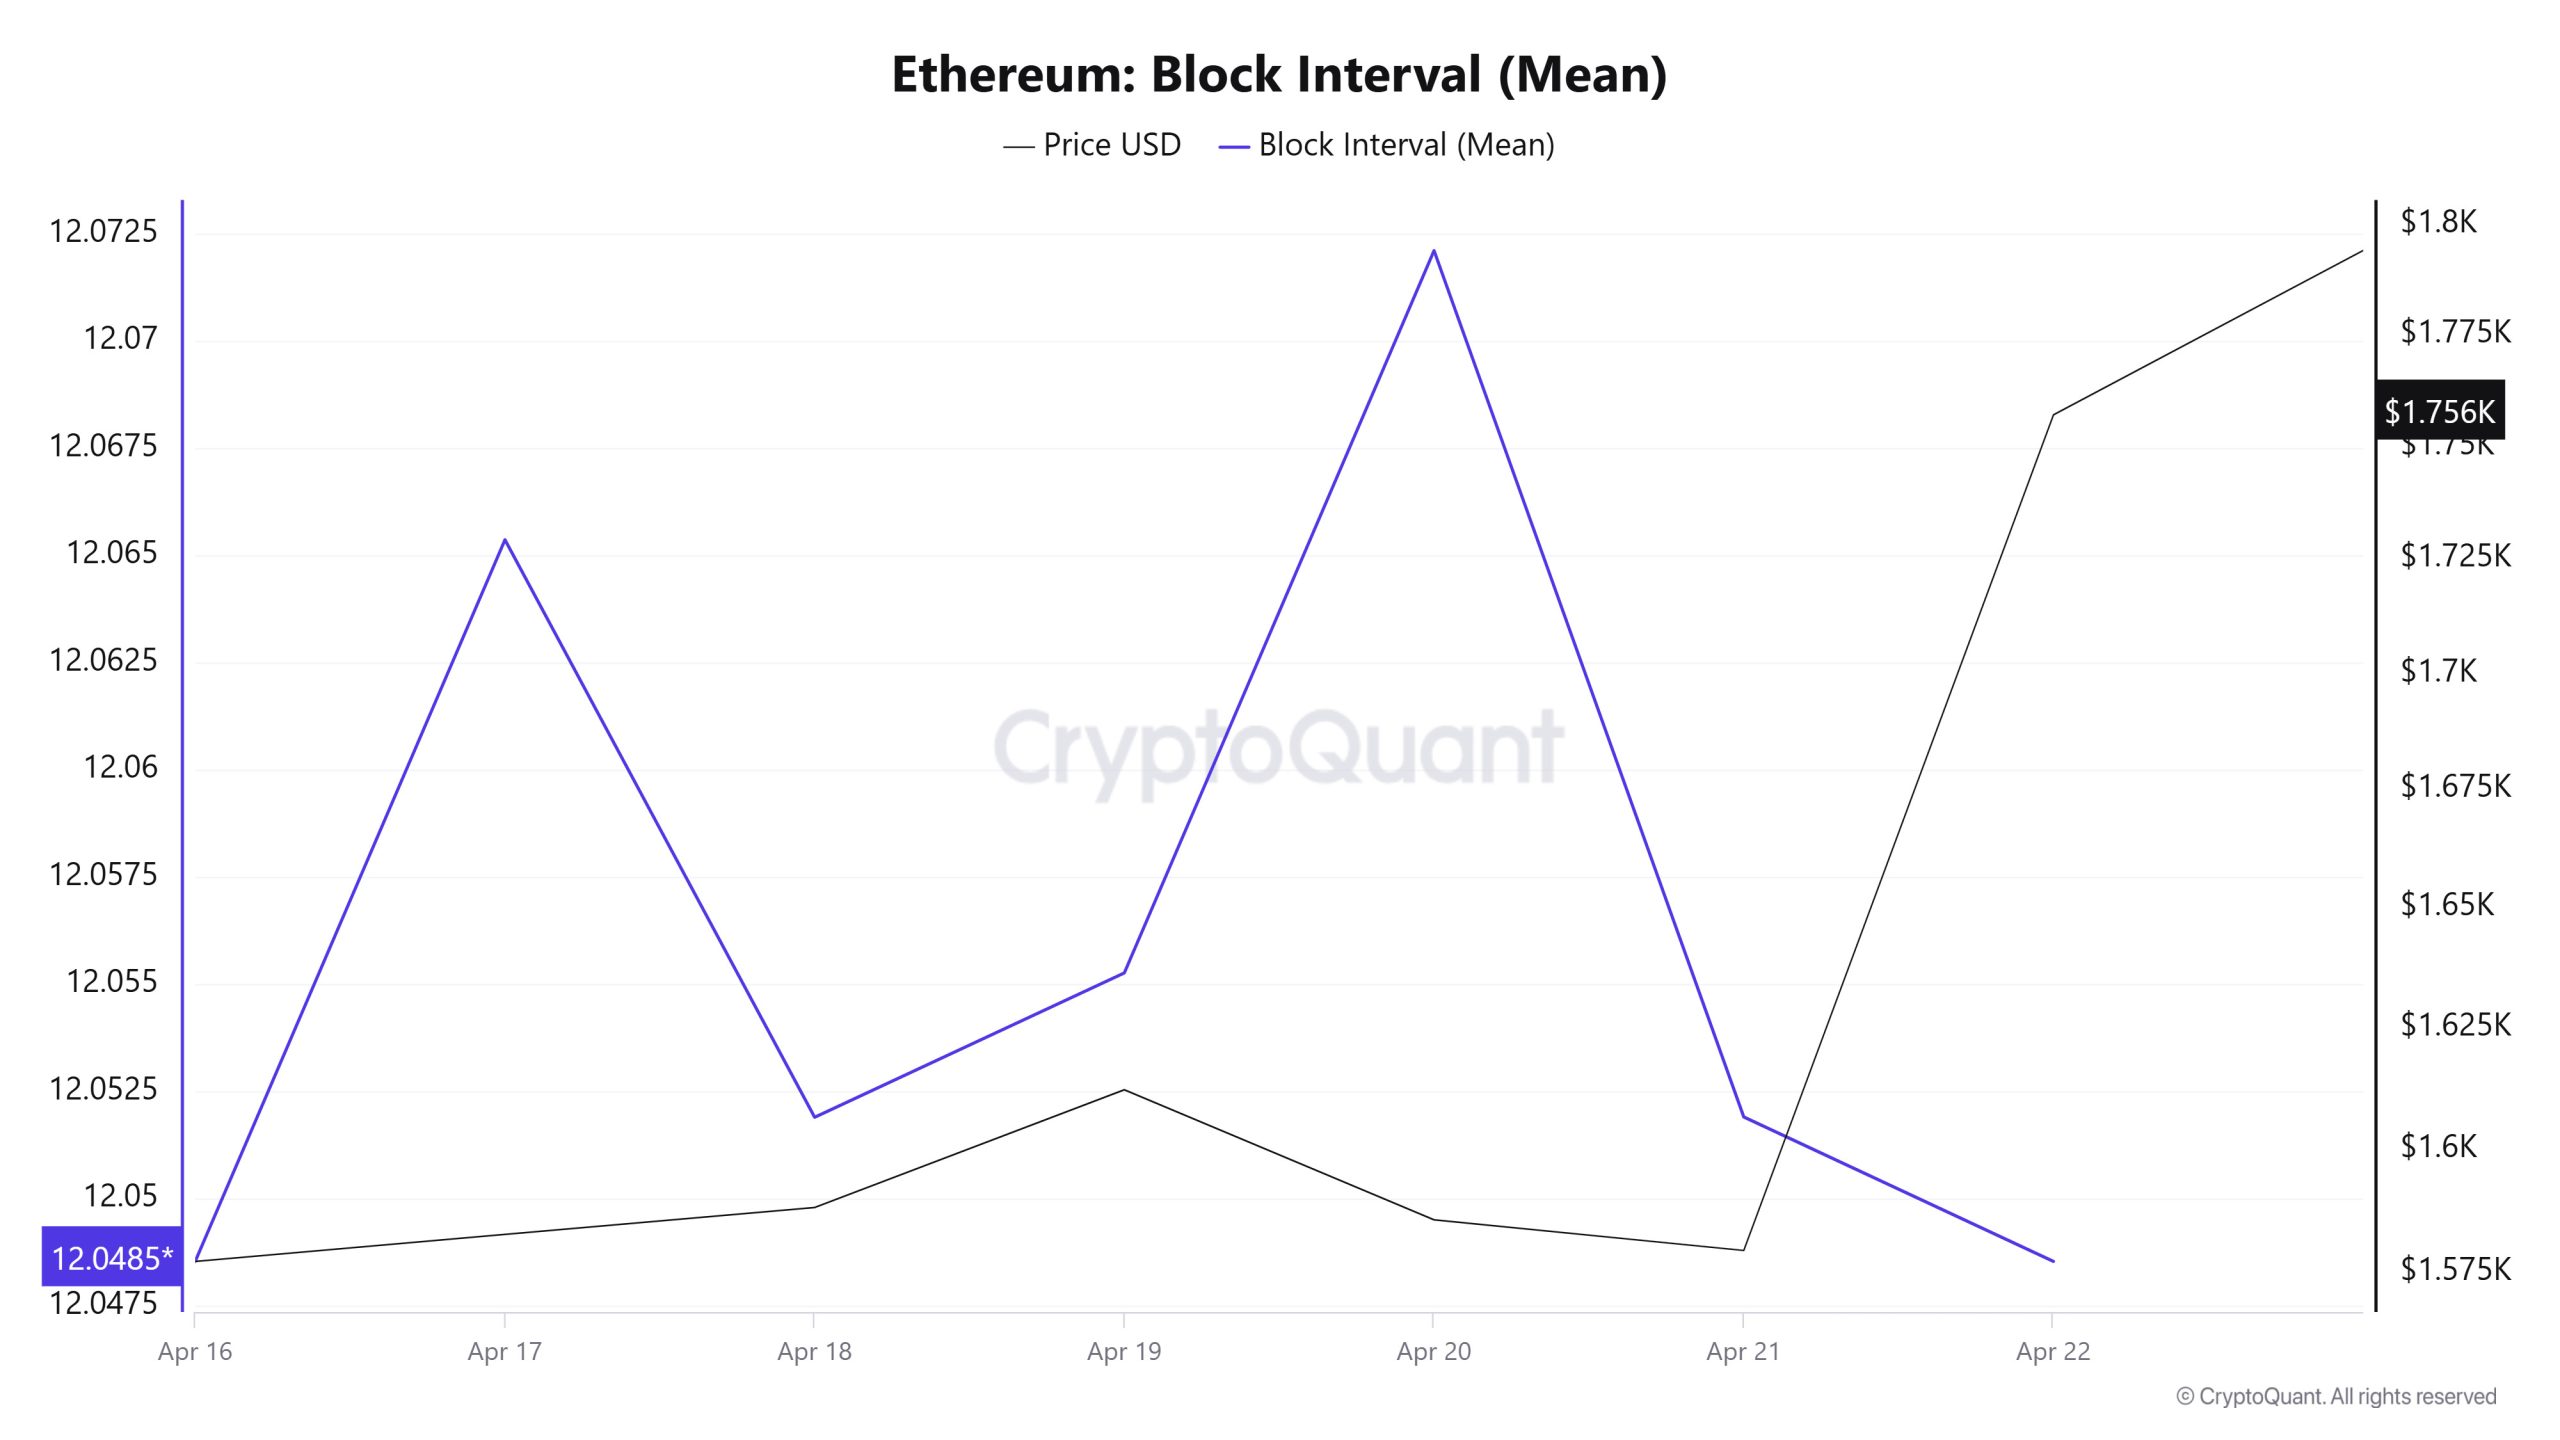
Between April 16 and April 22, when we examine the Ethereum Block Interval table, although there was an increase towards the middle of the week, there was a decrease in the time between blocks at the end of the week. The time between blocks, which was 12.04 seconds on April 16, was 12.04 seconds on April 22, with the same duration. Although there was a positive correlation between Block Interval and Ethereum price at the beginning of the week, the correlation turned negative towards the end of the week.
Transaction
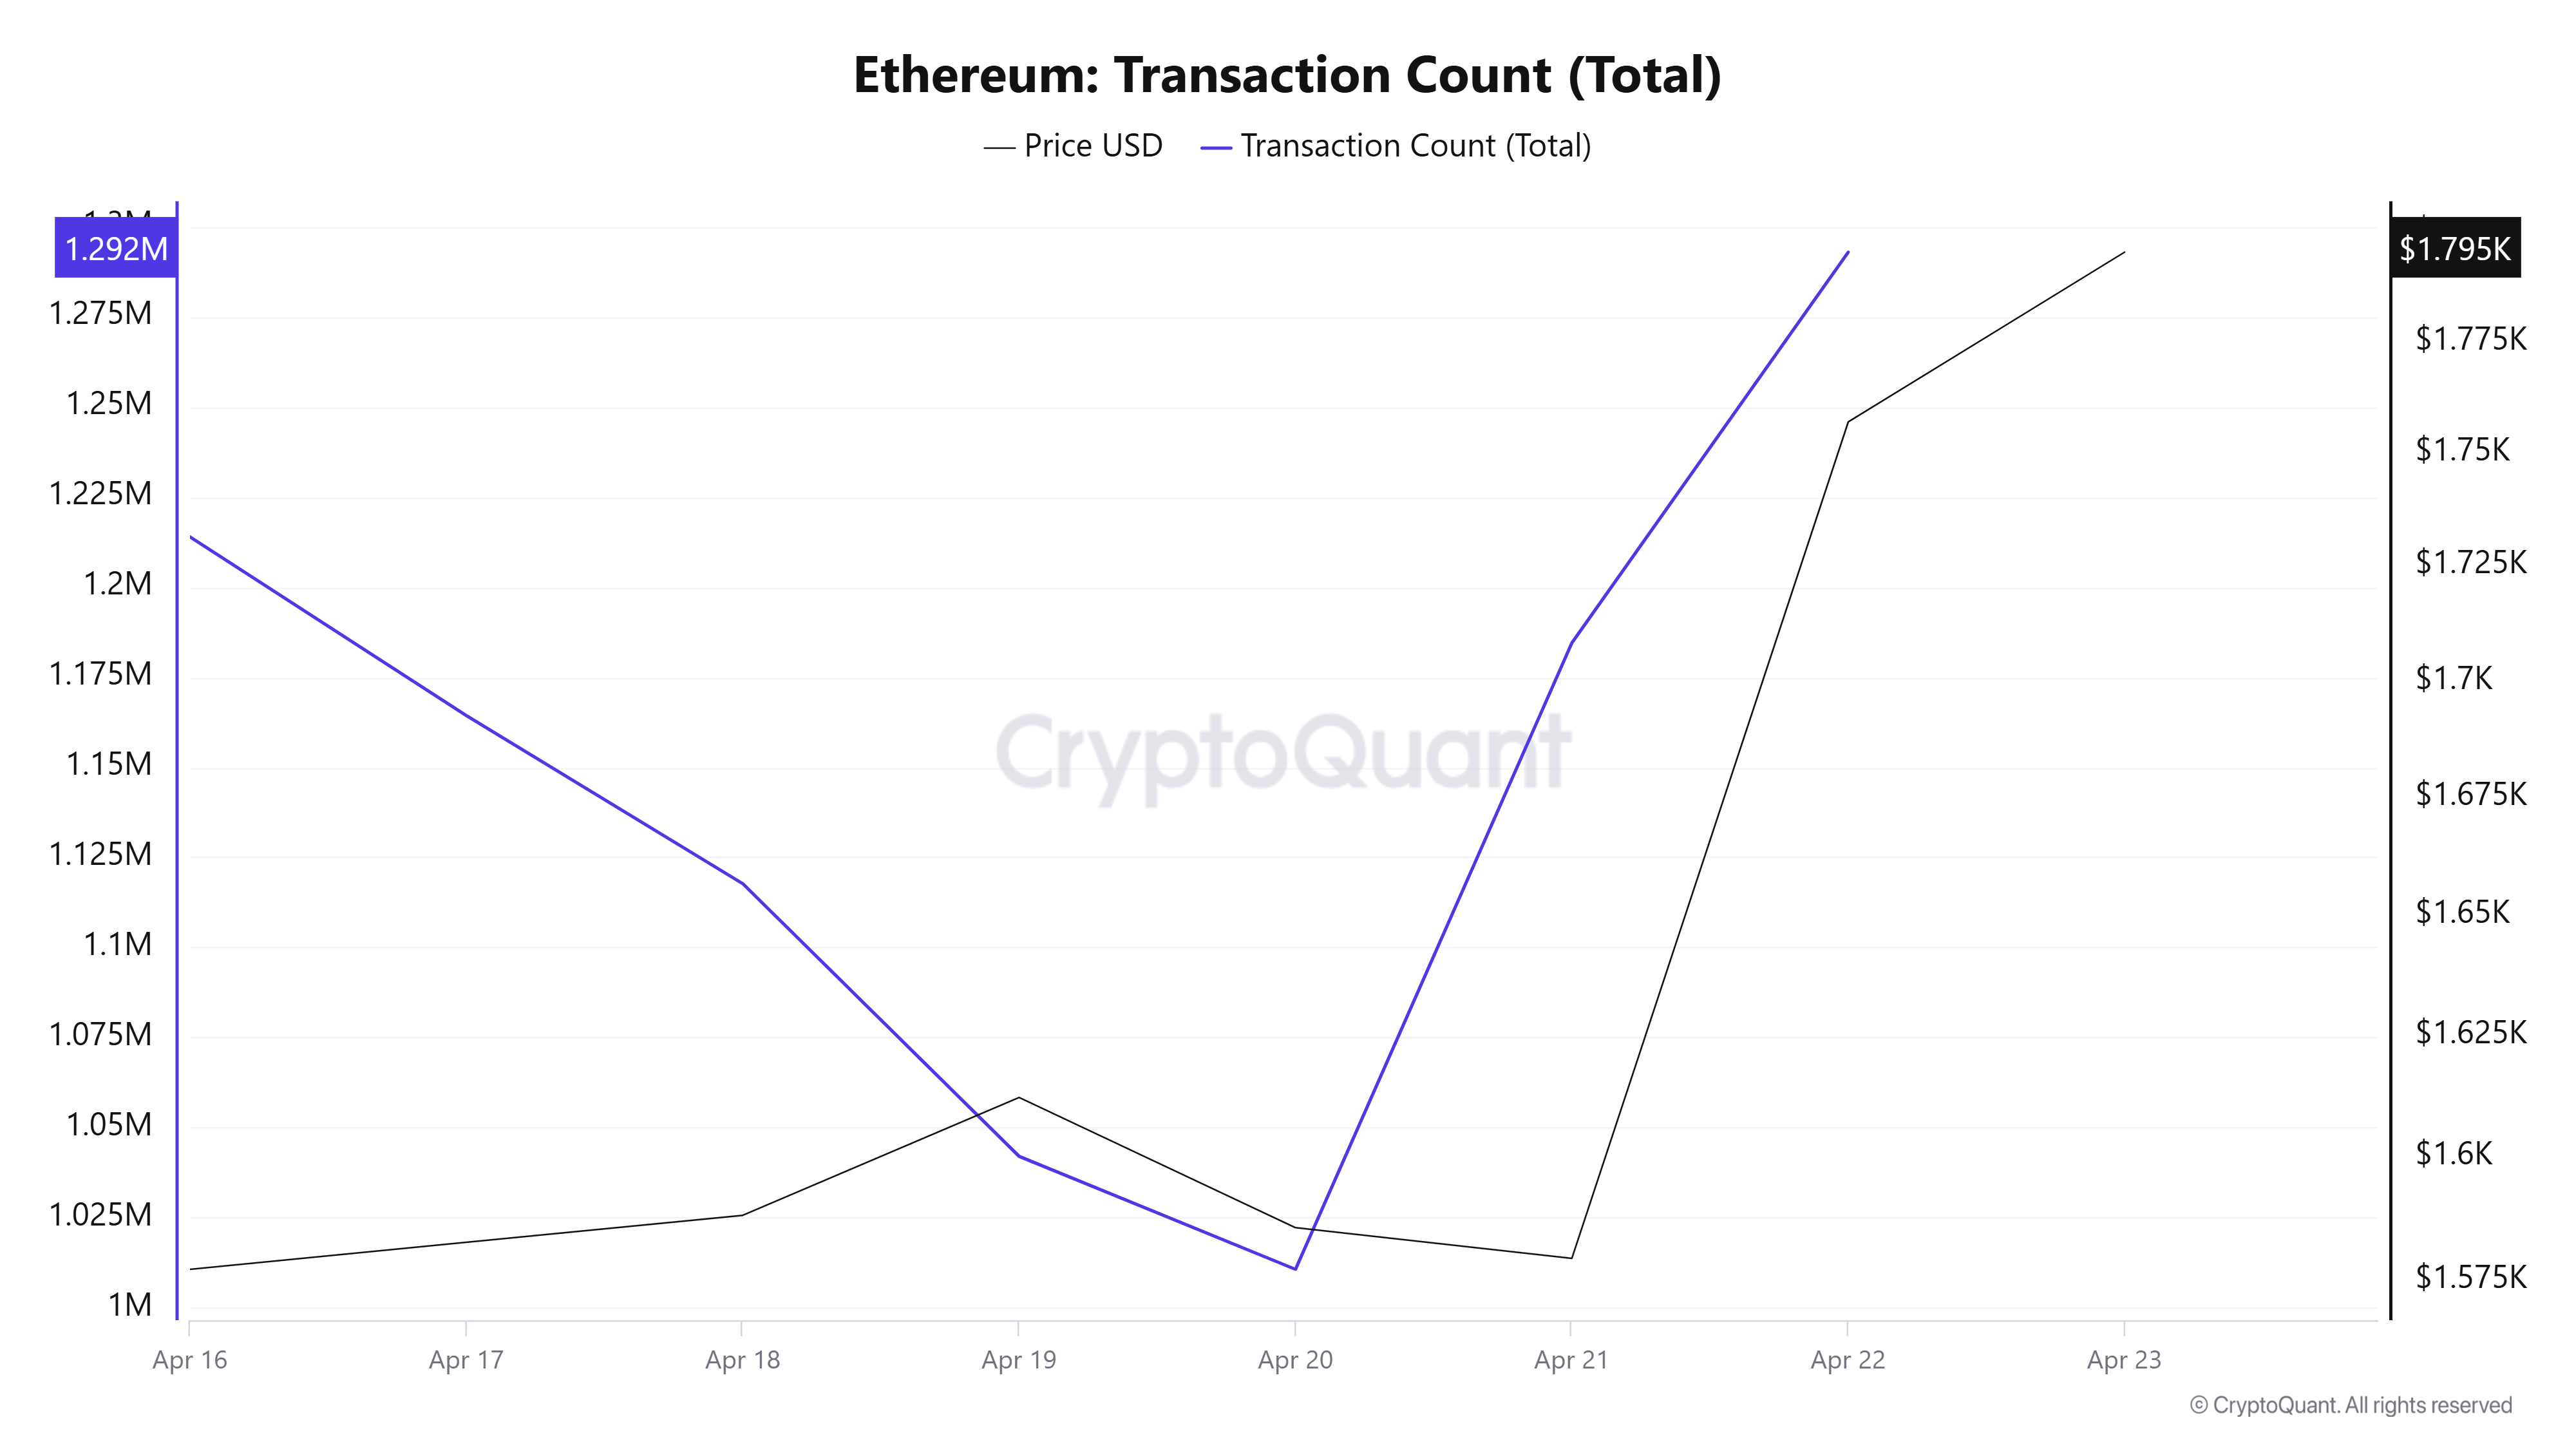
Last week, a total of 6,333,877 transactions were made on the Ethereum network, while this week it increased by about 26.7% to 8,026,018. The highest number of transactions on a weekly basis was 1,292,920 on April 22, while the lowest number of transactions was 1,010,667 on April 20.
This increase in the number of transactions indicates that usage on the network is slowly starting to rise and Ethereum burns are accelerating.
Tokens Transferred
While the total amount of ETH transferred on the Ethereum network last week was recorded as 12,338,310, it decreased by 7.92% to 11,361,535 this week. The 3,061,900 ETH transfer on April 22 was the highest daily transfer amount of the week, while the lowest value of the week was recorded on April 19 with only 1,034873 ETH transferred.
The increase in the number of transactions, coupled with a decrease in the amount of ETH transferred, suggests that activity on the network is increasing with natural user transactions. This situation on the network suggests that the downward pressure on the market is decreasing.
Estimated Leverage Ratio
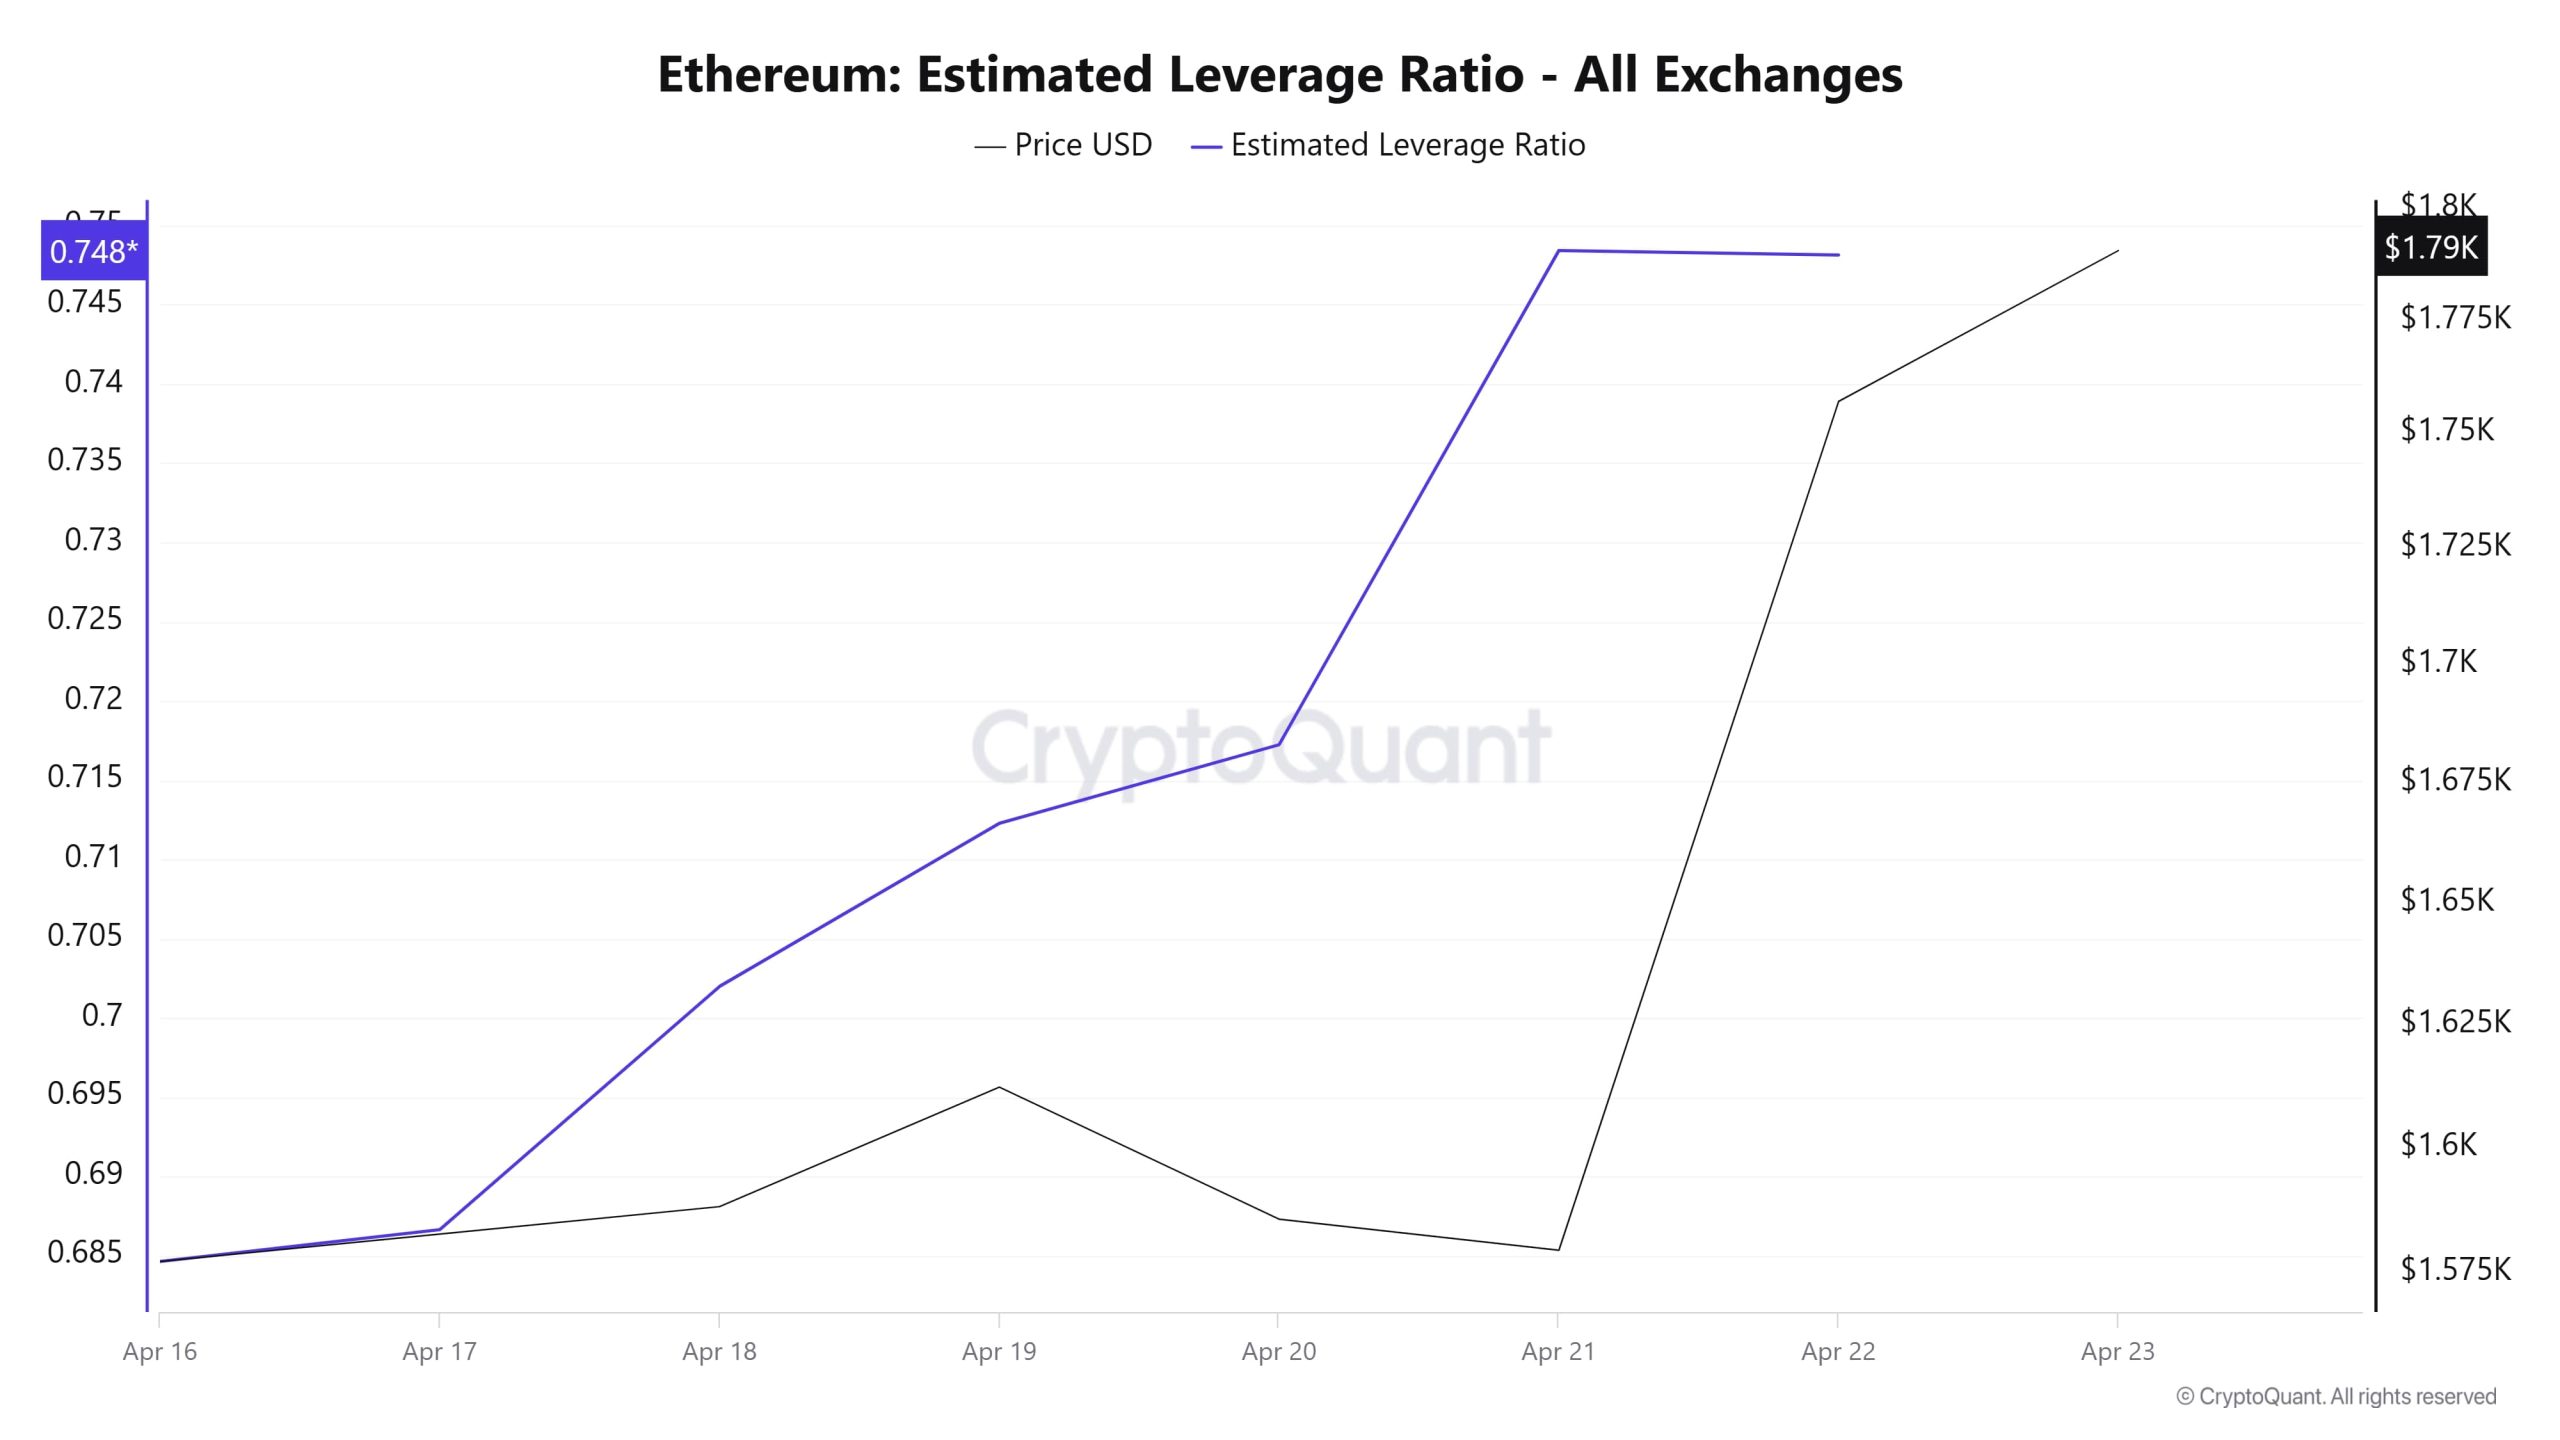
During the entire 7-day period, the metric generally continued to rise. ELR (Estimated Leverage Ratio), which had a value of 0.684 at the beginning of the process, increased towards the middle of the process and reached its peak value of 0.748 on April 21. In the last period of the process, it managed to stay at the peak and maintained the same value. A higher ELR means that participants are willing to assume more risk and generally indicates bullish conditions or expectations. It should be noted that these rallies can also be caused by a decrease in reserves. When we look at Ethereum reserves, while there were 19.56 million reserves at the beginning of the process, this figure moved horizontally towards the end of the process and is currently seen as 19.51 million. At the same time, Ethereum’s Open Interest is seen as 17.74 billion dollars at the beginning of the process. As of now, it is seen as 21.96 billion dollars, rising in the process. With all this data, the ELR metric moved higher. The price of the asset moved in parallel with the open interest and rose from $1,580 to $1,800. The flat course of reserves and the increase in the open interest rate explain the rise in the ELR rate. As a result, the fact that reserves hovered within a certain band and the open interest rate increased shows us that purchases have started in the market. Considering the excess of volume-based transactions and the fact that the accumulation remains constant, the dynamics show us that the rise may continue.
Legal Notice
The investment information, comments and recommendations contained in this document do not constitute investment advisory services. Investment advisory services are provided by authorized institutions on a personal basis, taking into account the risk and return preferences of individuals. The comments and recommendations contained in this document are of a general type. These recommendations may not be suitable for your financial situation and risk and return preferences. Therefore, making an investment decision based solely on the information contained in this document may not result in results that are in line with your expectations.
NOTE: All data used in Bitcoin onchain analysis is based on Cryptoqaunt.
