
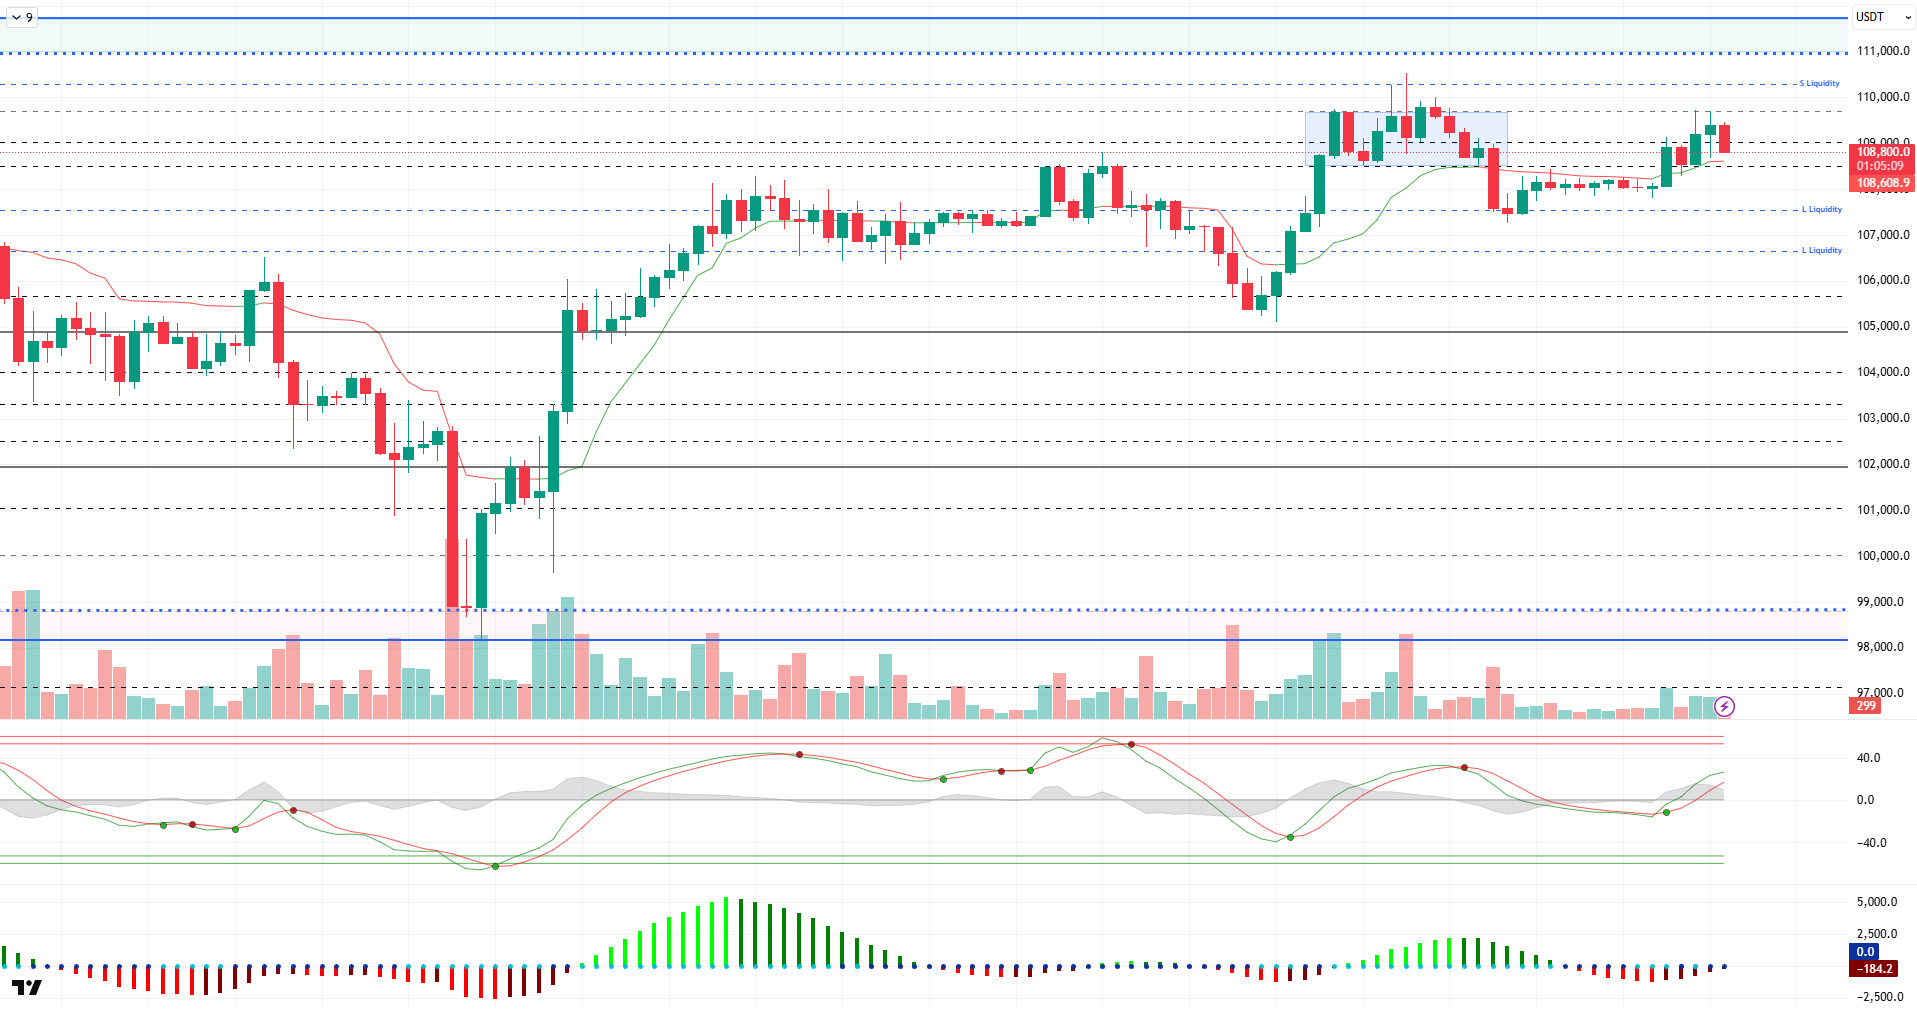
BTC/USDT
As the US enters a new era in its foreign trade policy, President Trump’s moves on tariffs are drawing attention. While the Secretary of Commerce stated that the details of the new tariffs that will take effect on August 1 are taking shape, Trump announced an additional 10% tariff plan targeting anti-BRICS countries. Elon Musk confirmed the pro-Bitcoin stance of his planned “American Party”, while institutional BTC purchases accelerated. Companies such as Metaplanet, Smarter Web Company and The Blockchain Group significantly increased their Bitcoin reserves, signaling confidence in the crypto market. Today, eyes will be on Strategy’s BTC purchases.
When we look at the technical outlook, BTC continues to maintain its strong stance, while the horizontal band range it formed near the ATH level attracts attention. BTC, which exhibited low volatile movements over the weekend, fell to the 107,300 support level. Then, the price rebounded and is once again trying to settle above the 109,000 level.
Technical indicators are moving back to the overbought zone after signs of Wave Trend (WT) weakening, with a trend reversal from the channel mid-band. The histogram of the Squeeze Momentum (SM) indicator is showing a mismatch with the trend in the negative zone. The Kaufman moving average is just below the price at 108,600.
Analyzing the liquidity data, BTC, which is heading towards the liquidity area with the recent rise, may target the accumulated sell positions at 110,000. This time, the buying level is concentrated between the 106,000 and 107,000 band.
As a result, while fundamental developments continue to be a catalyst for pricing, a new catalyst may be needed for the uptrend to gain momentum after this stage. While the technicals are moving in an attempt to move up again, liquidity data may support this scenario. In this context, we will follow the closes above the 110,000 resistance band for now. In case the rise regains momentum, the price exceeding the 110,000 level will be a reference for us on behalf of the new ATH, while 108,500 can be monitored as an intermediate support level in a possible selling pressure.
Supports 109,000 – 108,500 – 107,500
Resistances 110,000 – 111,000 – 111,970
ETH/USDT
ETH broke the $2,533 support downwards as of last Friday and faced a sharp selling pressure in the short term and retreated to the $2,475 level. At this point, the price, which spent the weekend in a relatively horizontal band with the reaction purchases coming at this point, managed to find strength again as of Sunday and managed to rise to the level of $2,600. This recovery, especially with some improvements in the technical structure, caused positive signals to come to the fore again in the short-term outlook.
When the Ichimoku indicator is analyzed, the price breaking above both tenkan and kijun levels presents a positive picture in terms of short-term direction. In particular, the upward expansion trend of the kumo cloud points not only to the current uptrend, but also to a medium-term strength gain in case the price persists in this region.
An analysis of Cumulative Volume Delta (CVD) data reveals that the recent rally was driven by simultaneous demand from both spot and futures markets. This suggests that the uptrend is not artificial or manipulative, but rather supported by a common demand trend across the market. Complementing this picture is the increase in open interest. Increasing open positions indicate that long expectations are gaining strength in the market. This makes the technical basis for the continuation of the uptrend more solid.
Although the Chaikin Money Flow (CMF) indicator moved into negative territory with Friday’s decline, the rapid recovery in the following days reveals that liquidity has started to enter the market again. However, the fact that the indicator is still in negative territory reminds us that the short-term risks that may put pressure on the price have not completely disappeared. For this reason, CMF’s transition to the positive zone should be followed as an important confirmation signal for the continuation of the upward movement.
On the momentum side, the indicator continues to trend upwards along with the price. This suggests that the uptrend may not only be a temporary reaction, but also a structurally strengthening movement. The absence of any negative divergence between price and momentum is another important factor that supports this.
As a result, in the short-term outlook for ETH, persistence above the $2,550 level is critical for the upward movement to continue. This level is also a strong technical reference point as it coincides with the kijun line on the ichimoku. If this support is maintained, the possibility of the price settling back above $2,600 will increase. However, if the $2,550 and especially the $2,533 main support level is broken downwards, a new wave of decline may begin in the short term and the price may retreat back towards the $2,475 band.
Top of Form
Below the Form
Supports 2,533 – 2,329 – 2,130
Resistances 2,735 – 2,857 – 3,062

XRP/USDT
XRP fell as low as $2.21 on Friday amid increased selling pressure in the crypto market. This level was not only a horizontal support point but also a strong technical support area as it coincided with the upper band of the kumo cloud on the ichimoku indicator. The fact that the price managed to hold at this point paved the way for buyers to re-engage. Especially with the effect of the voluminous purchases on Sunday, XRP gave short-term recovery signals by rising to the level of $ 2.29.
Technical indicators suggest that the overall trend remains positive. The Chaikin Money Flow (CMF) indicator has risen from negative territory to the zero line, indicating that the amount of liquidity entering the market has increased. While such a move reveals the capital support behind the bullish run, it is likely to generate an important signal that the buying momentum could strengthen further if CMF crosses above zero. At the same time, the momentum indicator is also gaining upward momentum in parallel with the price, supporting that this rise is not just a short-term reaction, but may indicate a structural strengthening.
In terms of the Ichimoku indicator, the price hovering above both the tenkan and kijun levels suggests that the short-term technical structure is positive. This suggests that the price has managed to stay above its short-term averages and market participants are maintaining their upside expectations . Moreover, the fact that the price is still above the kumo cloud can be considered as an indicator that confirms the continuation of the positive structure not only in terms of the short-term outlook but also in terms of the overall trend.
In the light of all this technical data, if XRP maintains the $2.21 level, it is highly likely that bullish movements will continue. This level stands out as an important support point both structurally and psychologically. However, if this support is broken downwards, the deterioration in the technical structure may deepen, which may pave the way for more drastic downward movements in the XRP price. Therefore, the $2.21 level stands out as a critical threshold to be closely monitored in intraday trading.
Supports 2.2111 – 2.0841 – 1.9115
Resistances 2.3376 – 2.5900 – 2.8347

SOL/USDT
Minna Bank, one of Japan’s leading banks in digital transformation, launched a joint research with Solana to examine how stablecoin technology can revolutionize consumer finance.
SOL price was bullish. The asset broke the 50 EMA (Blue Line) and 200 EMA (Black Line) moving averages to the upside, accelerating from the base level of the descending triangle pattern, which is a strong support. It is currently testing the ceiling level of the descending triangle pattern as resistance. On candle closes above this level, the $ 163.80 level should be followed.
On the 4-hour chart, the 50 EMA (Blue Line) continued to be below the 200 EMA (Black Line). This suggests that the bearish trend may continue in the medium term. At the same time, the fact that the price is above both moving averages suggests that the market is currently bullish in the short term. Chaikin Money Flow (CMF-20) remains in neutral territory, and an increase in inflows could push it into positive territory. Relative Strength Index (RSI-14) rose to positive territory. In addition, it has broken the downtrend that started on June 30th to the upside. This may bring bullishness. The $163.80 level stands out as a strong resistance point in the event of a rise due to macroeconomic data or positive news on the Solana ecosystem. If this level is broken upwards, the rise can be expected to continue. If there are pullbacks due to contrary developments or profit realizations, the $ 144.35 level can be tested. In case of a decline to these support levels, the increase in buying momentum may offer a potential bullish opportunity.
Supports 150.67 – 144.35 – 138.73
Resistances 163.80 – 171.82 – 181.75

DOGE/USDT
DOGE price turned bullish. Staying above the 50 EMA (Blue Line) moving average, the asset broke the 200 EMA (Black Line) moving average upwards and priced at the upper levels of the falling pennant pattern. The price, which continues to stay inside the pattern, is currently testing the 200 EMA as support. If it manages to stay above the 200 EMA moving average, the ceiling level of the falling pennant pattern should be followed.
On the 4-hour chart, the 50 EMA (Blue Line) continues to be below the 200 EMA (Black Line). This suggests that the asset is bearish in the medium term. The fact that the price is above both moving averages suggests that the asset is bullish in the short term. Chaikin Money Flow (CMF-20) continues to be in negative territory. In addition, positive inflows may move CMF into positive territory. Relative Strength Index (RSI-14) rose to the overbought level. This may bring profit sales. The $0.17766 level stands out as a strong resistance zone in case of a rally in line with political developments, macroeconomic data or positive news flow in the DOGE ecosystem. In the opposite case or possible negative news flow, the $0.16686 level may be triggered. In case of a decline to these levels, the momentum may increase and a new bullish wave may start.
Supports 0.16686 – 0.15680 – 0.14952
Resistances 0.17766 – 0.18566 – 0.19909

Legal Notice
The investment information, comments and recommendations contained herein do not constitute investment advice. Investment advisory services are provided individually by authorized institutions taking into account the risk and return preferences of individuals. The comments and recommendations contained herein are of a general nature. These recommendations may not be suitable for your financial situation and risk and return preferences. Therefore, making an investment decision based solely on the information contained herein may not produce results in line with your expectations.