BTC/USDT
The House of Representatives has moved the crypto laws to the final voting stage after a long voting traffic. GENIUS and CLARITY bills are expected to be voted in the House this week. The addition of the provision that would prohibit the FED from issuing digital currency to the defense budget law increased the support of Republicans, while Trump was reportedly directly involved in the process. On the other hand, while the China Property Fund launched the first yuan-denominated tokenized fund; US giant banks such as Bank of America, JPMorgan and Citigroup are accelerating their stablecoin work.
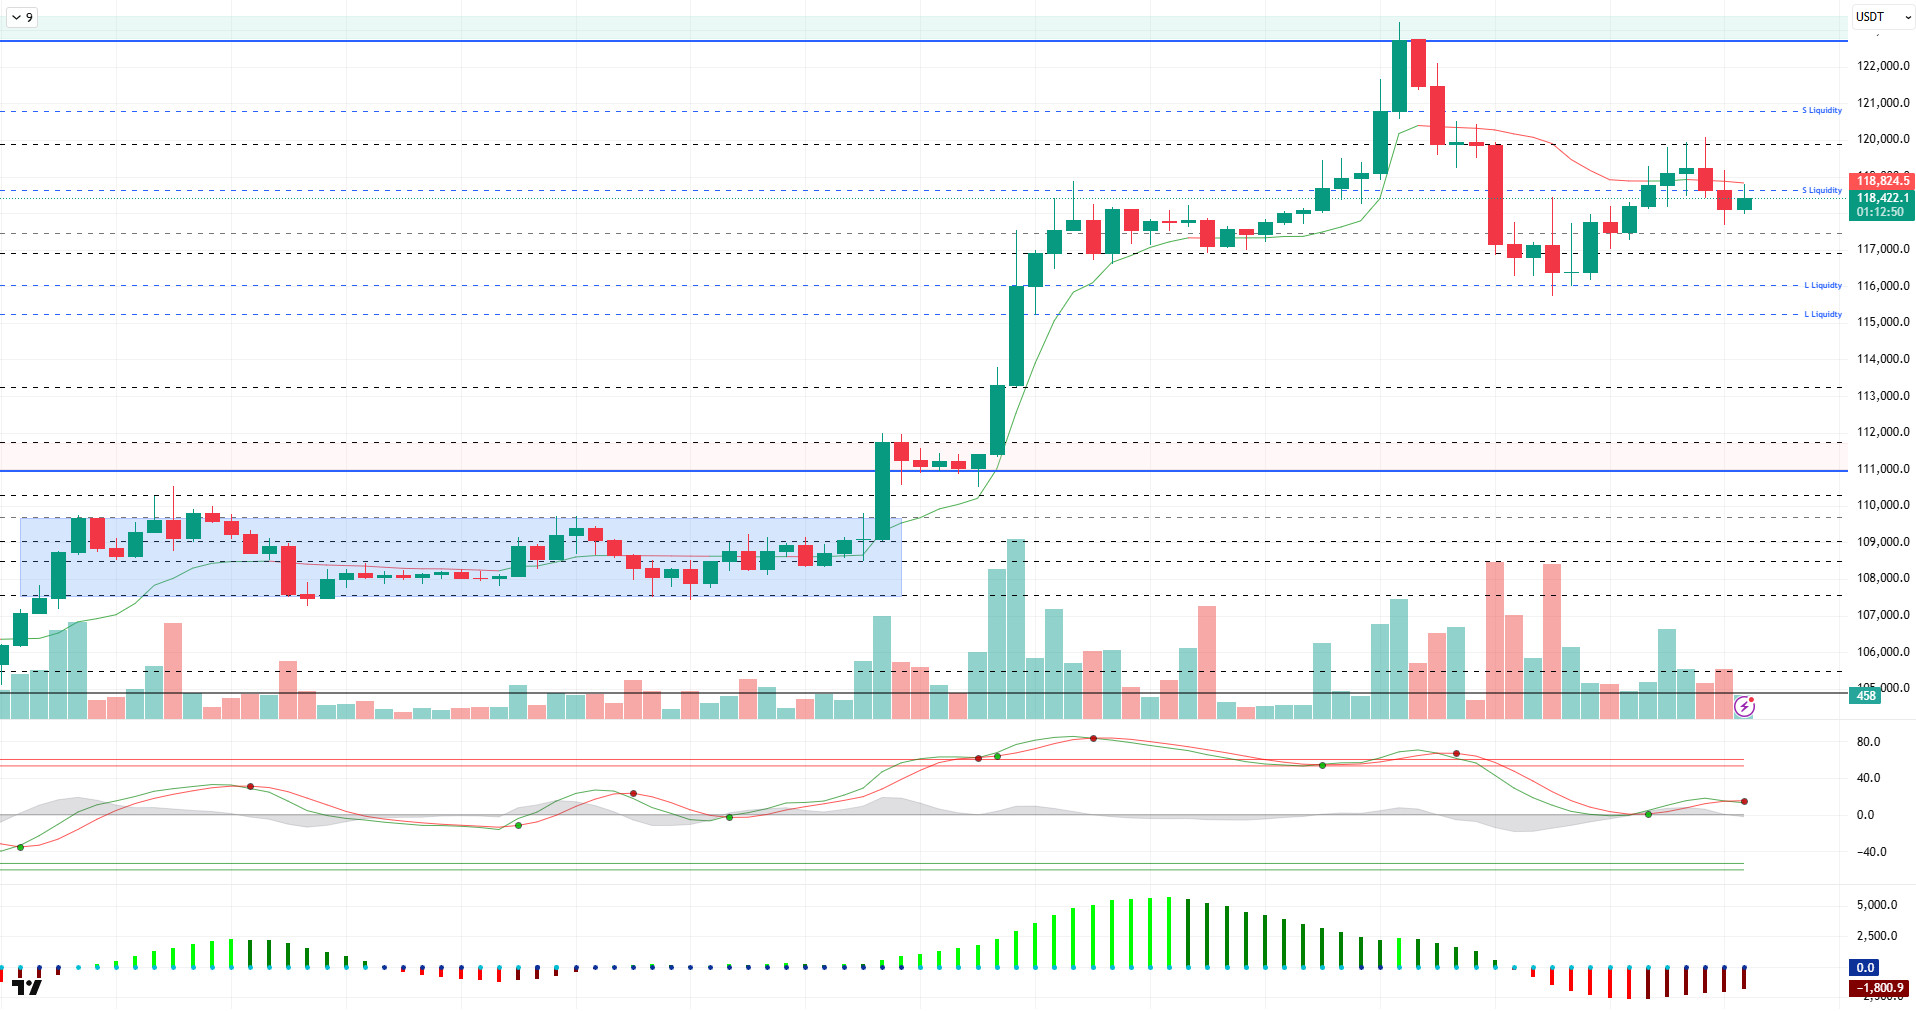
When we look at the technical outlook, after the ATH level in BTC price reached 123,200, it realized the correction of the rise and fell to 115,800. Recovering again, it tested the 120,000 level once again. At the time of writing, it continues to trade at 118,500.
Looking at the technical indicators, the Wave Trend (WT) oscillator is preparing for a trend reversal with the recent decline to the channel mid-band. The histogram on the Squeeze momentum (SM) indicator is trying to regain strength. The Kaufman moving average is just above the price at 118,800.
Analysing the liquidity data, with the recent rise, buy trades at 118,500 and 120,000 levels were liquidated respectively. The most concentrated liquidity zone was around the 115,000 level, while selling positions were re-accumulated above the 120,000 level.
In sum, the price reached the new ATH level as fundamental developments continued to contribute positively to pricing. While the technical outlook continues to move in line with the trend reversal in the middle band of the channel in the short term, liquidity data reflects that buying positions are dominant. In the continuation of the rise, 120,000 is followed as a minor resistance point, while in a possible selling pressure, we will follow the 117,500 support level.
Supports 117,500 – 116,800 – 116,000
Resistances 118,600 – 120,000 – 121,000
ETH/USDT
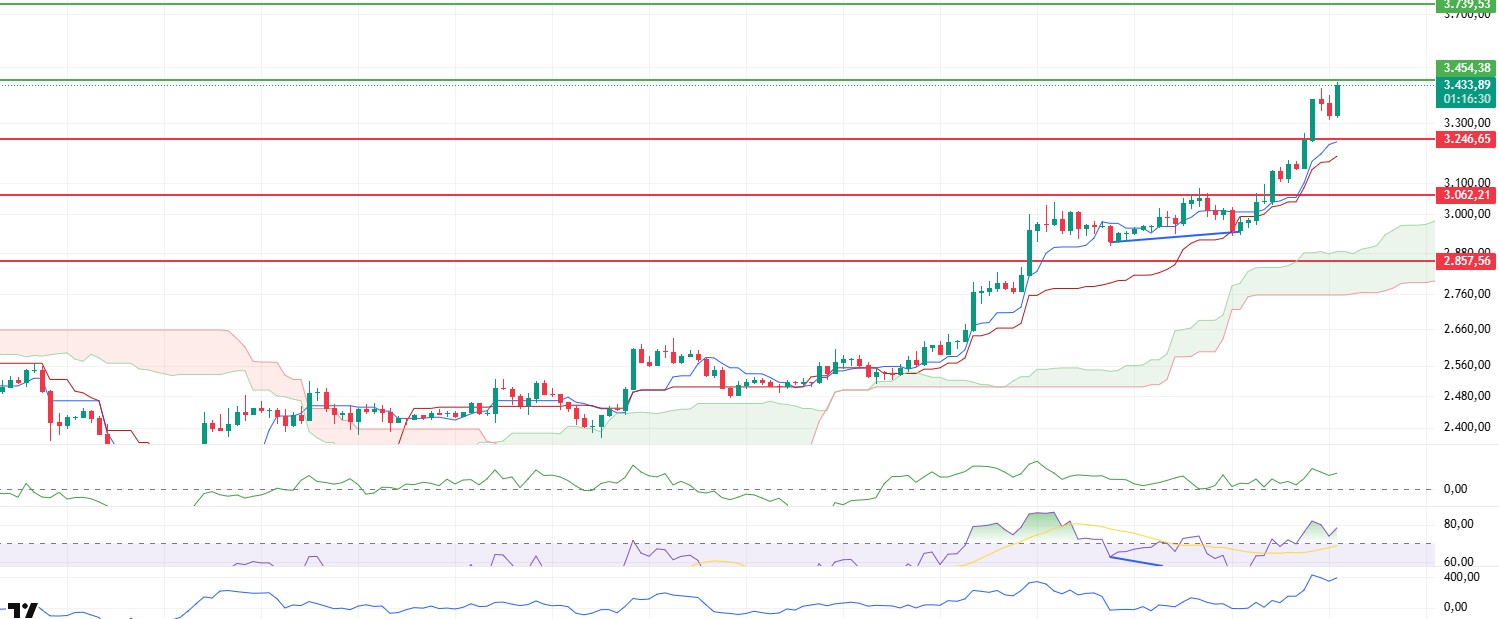
Yesterday, U.S. Ethereum ETFs saw a total inflow of $727 million, the highest daily inflow ever recorded. While this record inflow shows that investor interest has turned particularly serious towards spot Ethereum products, BlackRock’s ETF has managed to take the largest share with a total investment of $499 million since launch. Following these developments, the Ethereum price accelerated its upward movement by overcoming the important technical resistance at $3,246 and gained a strong momentum by rising above the $3,400 level.
When technical indicators and on-chain data are analyzed together, it is seen that there was some retracement in open positions in futures trading during the overnight hours. However, this weakness was not permanent. In the morning hours, a strong upward rebound in Cumulative Volume Delta (CVD) spot and especially futures data was noteworthy. This shows that buy orders have become dominant again in the futures markets and buyer interest continues. The synchronized rise in the spot market also suggests that the price increase is based on healthy market dynamics.
Although the Relative Strength Index (RSI) has reached overbought territory, it remains structurally positive. This indicates that the current uptrend is not just a short-term speculative move, but that the appetite for buying continues. Likewise, the momentum indicator is also strengthening. The fact that the price has a momentum that technically supports its upward movement strengthens the possibility that short-term pullbacks will remain limited.
Chaikin Money Flow (CMF) data also showed an upward trend in the positive area. This suggests that net capital inflows to the market are continuing and that not only futures but also spot-based real demand is behind the uptrend.
Finally, if the price breaks the $3,454 level on the upside, it could trigger a new bullish wave. In this scenario, the $3,739 and then $4,084 levels can be monitored as the main resistances. However, the first critical support point in possible downward corrections is the $3,246 level. Closes below this zone could cause the current bullish momentum to weaken and move the price to a deeper correction.
Top of Form
Below the Form
Supports 3,246 – 3,062 – 2,857
Resistances 3,455 – 3,739 – 4,084
XRP/USDT
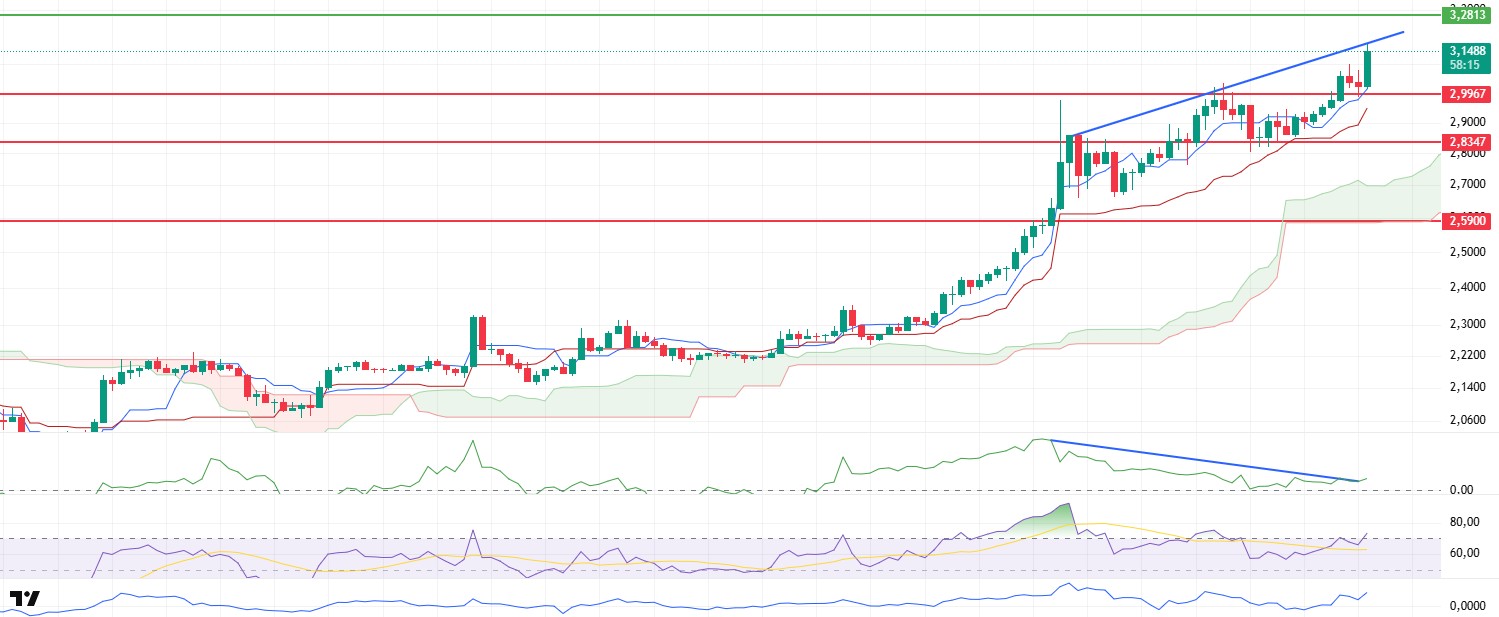
XRP surpassed the critical resistance at $2.99 in the evening hours yesterday, rising as high as $3.16 on a strong wave of buying. While this movement is supported by both technical and volumetric indicators, it signals that the upward trend may continue in the short term.
Especially when the Ichimoku Cloud is analyzed, it stands out as an important technical signal that the price continues its upward movement with the support from the Tenkan line. The fact that the Tenkan level remains above the Kijun line and the cloud structure continues to expand upwards indicates that not only the short-term but also the medium-term trend continues in a positive direction. The price hovering above the cloud confirms that the market is generally bullish.
The Chaikin Money Flow (CMF) indicator also remained in positive territory, indicating that net capital flows into the market continued. While the upward momentum in CMF confirms that buyer interest is strengthening, the negative divergence that has started to form on the indicator should be considered as a warning that should be carefully monitored. Such a structure may signal that intermediate corrections may be seen within the uptrend.
The Relative Strength Index (RSI) has re-entered the overbought zone. Although this suggests that the price is facing high buying pressure in the short term, the fact that the RSI is still structurally positive suggests that the trend has not weakened yet. The fact that the momentum indicator is also gaining upward momentum in tandem with this picture indicates that the price action in XRP is on a technically sound footing.
When all this technical structure is considered together, it seems quite likely that XRP will make a move towards the $3.28 level during the day. If this level is exceeded, it may be possible for the price to expand towards the next resistance zones. However, in possible downside scenarios, the $2.99 level has now become a strong support. A downside break of this level could signal a weakening on the buying side and cause the price to head towards lower support areas.
Supports 2.9967 – 2.8347 – 2.5900
Resistances 3.2813 – 3.4014 – 3.8615
SOL/USDT
Liquid Collective offered Solana liquid staking token LsSOL to institutions in anticipation of spot SOL ETF approvals.
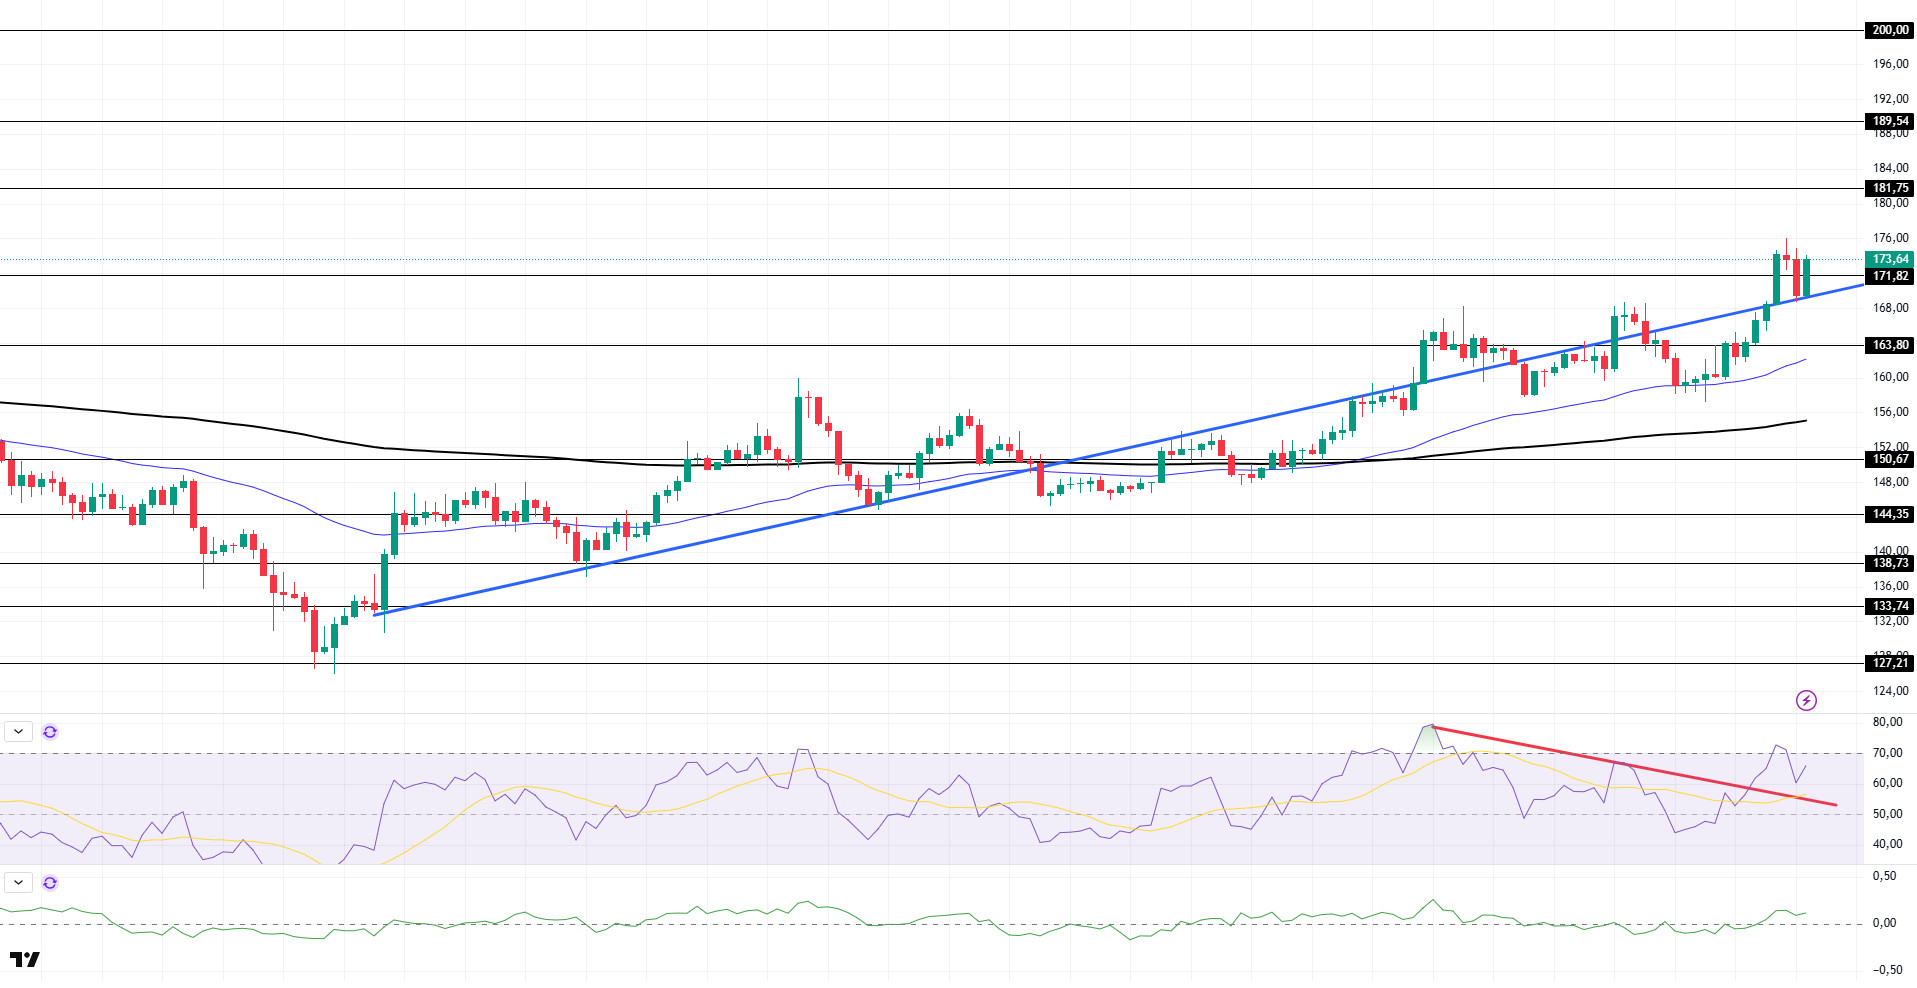
SOL price continued its uptrend. The asset is now above the uptrend that started on June 23rd. The price broke the uptrend that started on June 23rd upwards, which is a strong resistance point, and managed to stay above it. It is currently testing this trend as support. If the rises continue, the $181.75 level can be followed. On pullbacks, it can work with support from the 50 EMA (Blue Line) moving average on candle closures below the rising trend.
On the 4-hour chart, the 50 EMA (Blue Line) continues to be above the 200 EMA (Black Line). This suggests that the uptrend may continue in the medium term. At the same time, the fact that the price is above both moving averages suggests that the market is currently in a bullish trend in the short term. Chaikin Money Flow (CMF-20) crossed into positive territory; however, an increase in money inflows may move CMF into positive territory. Relative Strength Index (RSI-14) broke the selling pressure by moving into positive territory. In addition, it continued to hold above the downtrend that started on July 11. In case of an uptrend on the back of macroeconomic data or positive news on the Solana ecosystem, the $181.75 level stands out as a strong resistance point. If this level is broken upwards, the rise can be expected to continue. If there are pullbacks due to contrary developments or profit realizations, the $163.80 level can be tested. In case of a decline to these support levels, the increase in buying momentum may offer a potential bullish opportunity.
Supports 163.80 – 150.67 – 144.35
Resistances 171.82 – 181.75 – 189.54
DOGE/USDT
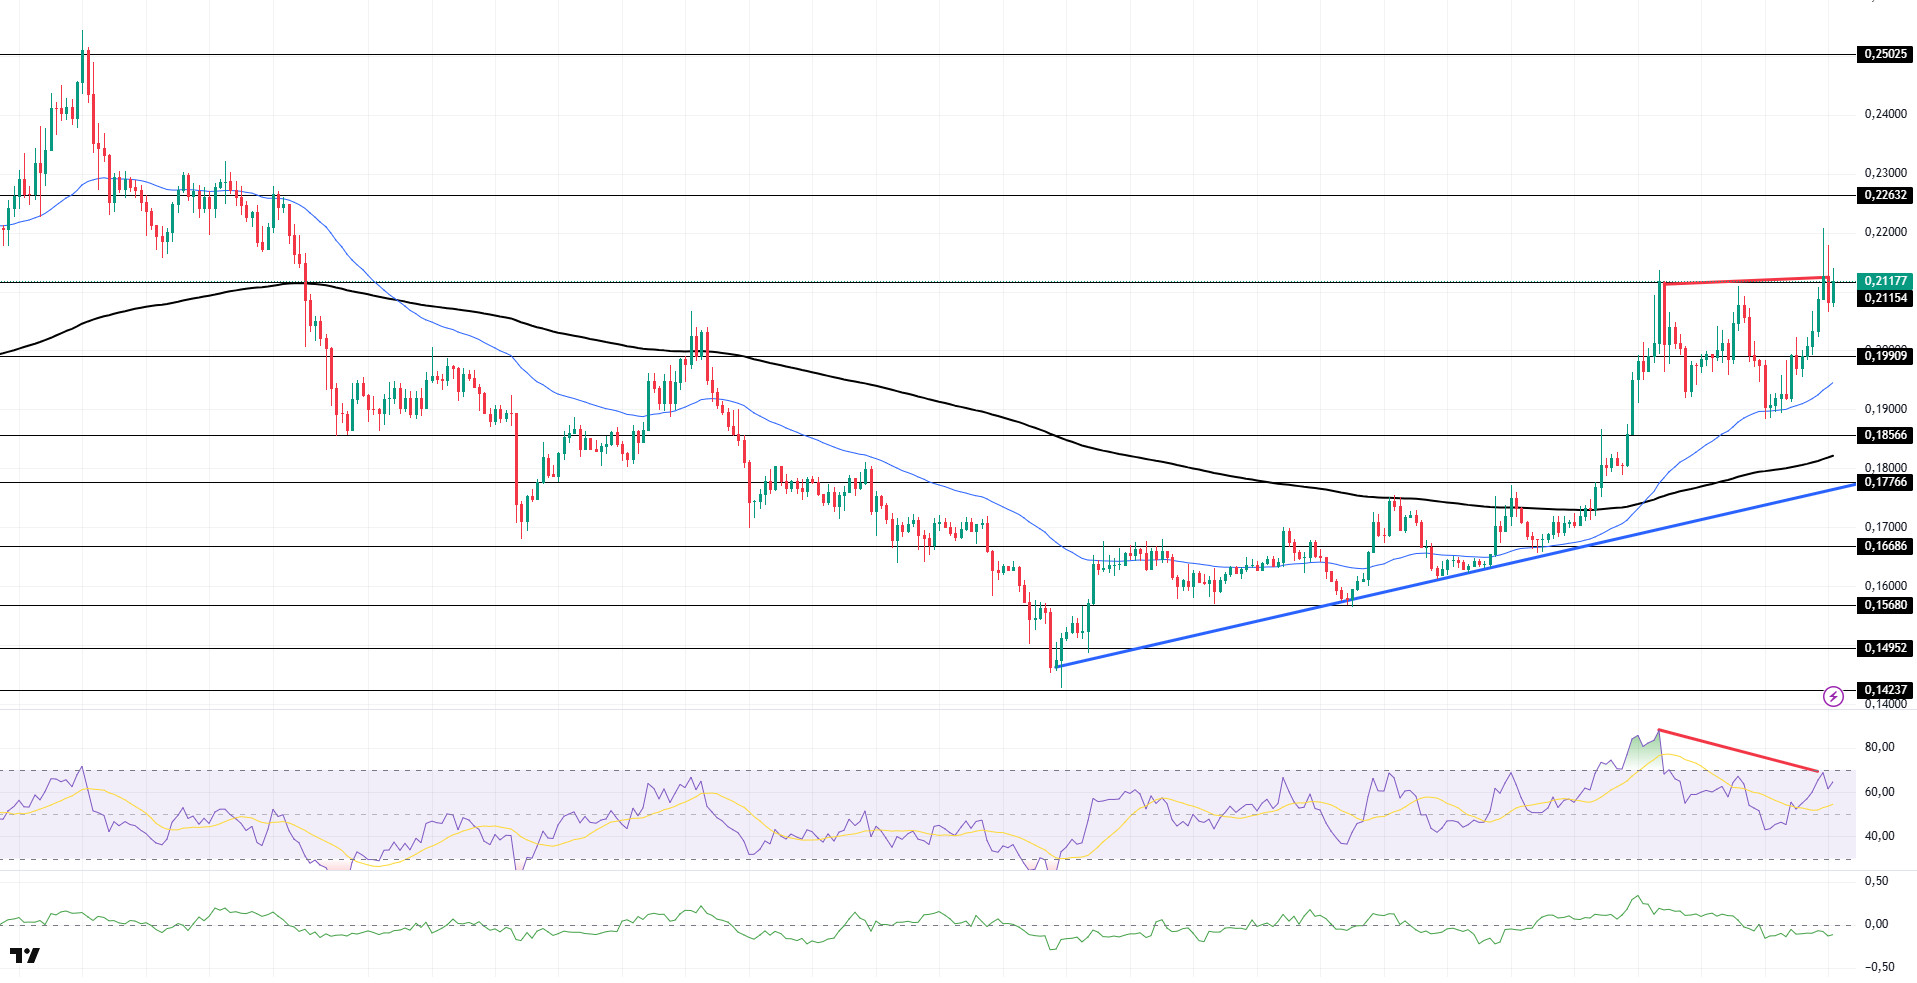
DOGE price continued its uptrend. With the uptrend that started on June 22, it continued to stay above the 200 EMA (Black Line) and 50 EMA moving averages. Breaking the strong resistance level of $ 0.19909, the asset continues its acceleration and tests the strong resistance level of $0.21154 as resistance. If it breaks this upwards, the level of 0.22632 dollars can be followed. In case of a retracement, the level of 0.19909 dollars should be followed.
On the 4-hour chart, the 50 EMA (Blue Line) continues to be above the 200 EMA (Black Line). This suggests that the asset is bullish in the medium term. The fact that the price is above both moving averages suggests that the asset is bullish in the short term. Chaikin Money Flow (CMF-20) continues to be in negative territory. In addition, positive inflows may move CMF into positive territory. Relative Strength Index (RSI-14) remained in positive territory. In addition, there is a regular divergence pattern. This may push the price lower. The $0.21154 level stands out as a strong resistance zone in the case of possible rises in line with political developments, macroeconomic data or positive news flow in the DOGE ecosystem. In the opposite case or possible negative news flow, the $0.19909 level may be triggered. In case of a decline to these levels, the momentum may increase and a new bullish wave may start.
Supports 0.19909 – 0.18566 – 0.17766
Resistances 0.21154 – 0.22632 – 0.25025
Legal Notice
The investment information, comments and recommendations contained herein do not constitute investment advice. Investment advisory services are provided individually by authorized institutions taking into account the risk and return preferences of individuals. The comments and recommendations contained herein are of a general nature. These recommendations may not be suitable for your financial situation and risk and return preferences. Therefore, making an investment decision based solely on the information contained herein may not produce results in line with your expectations.