MARKET SUMMARY
Latest Situation in Crypto Assets
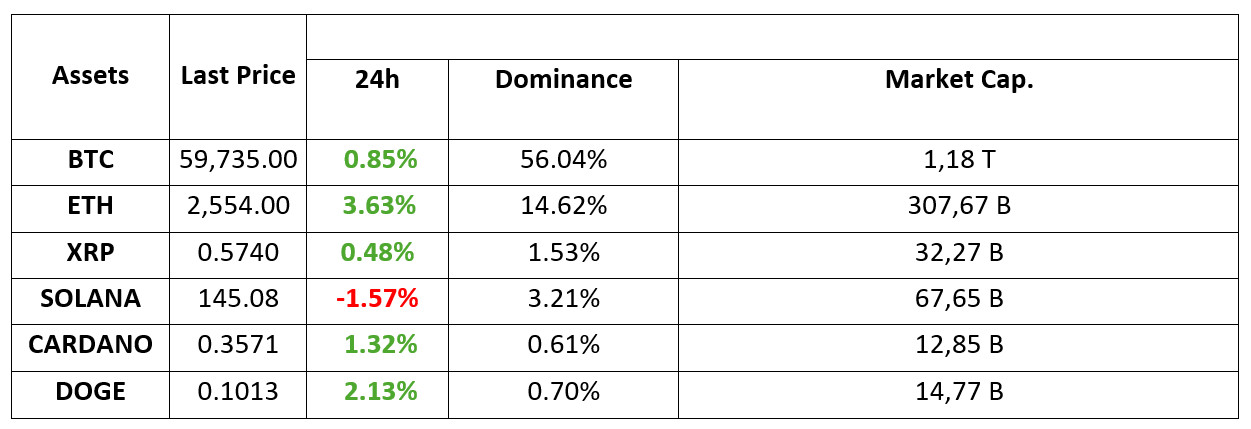
*Prepared on 29.08.2024 at 07:00 (UTC)
WHAT’S LEFT BEHIND
Nvidia balance sheet announced: Numbers exceed expectations
US-based chip giant Nvidia’s highly anticipated second quarter balance sheet figures were announced. The company’s revenues were 30 billion dollars against expectations of 28.7 billion dollars. Net income was 16.6 billion dollars. The company’s data center revenues were announced as $ 26.3 billion against an estimate of $ 25.08 billion. Thus, the company experienced a 122 percent revenue increase due to the increasing demand for data center chips. Nvidia shares fell after the results were announced. In post-session transactions, the decline reached up to 7.5 percent.
Why Nvidia shares fell despite better-than-expected revenue
Nvidia shares fell after the results were announced. The decline reached up to 7.5 percent in post-session trading. The decline in shares was due to Nvidia’s lower-than-expected revenue forecast for the third quarter and learning that there was a disruption in the production of Blackwell chips. The company reported third quarter revenues of approximately $32.5 billion. This fell short of many estimates for third-quarter revenues, raising concerns that the company’s explosive growth is slowing. Optimistic estimates were as high as $38 billion.
The latest company targeted by the SEC is NFT marketplace OpenSea
The latest step of the SEC, which has targeted companies operating in the last 2 years with a focus on cryptocurrency, was against OpenSea. The institution sent a Well notification to the NFT marketplace.
Telegram CEO Pavel Durov appeared in court and was released
Telegram CEO Pavel Durov, who was detained by French police in Paris on Saturday, appeared before a judge today. Durov was questioned to decide whether to file an indictment and was later released.
HIGHLIGHTS OF THE DAY
INFORMATION
*The calendar is based on UTC (Coordinated Universal Time) time zone. The economic calendar content on the relevant page is obtained from reliable news and data providers. The news in the economic calendar content, the date and time of the announcement of the news, possible changes in the previous, expectations and announced figures are made by the data provider institutions. Darkex cannot be held responsible for possible changes that may arise from similar situations.
MARKET COMPASS
After the US stock markets closed, Nvidia announced its second quarter balance sheet for the fiscal year and its results dominated the markets. Although the company posted higher-than-expected revenues, the company’s forward-looking expectations did not satisfy market participants. The company’s stock fell 6.9% in after-hours trading, sending the Nasdaq index and this morning’s Asian bourses lower.
Markets seem to turn their attention to macro dynamics again after developments such as the release of Telegram founder Durov, albeit with conditions such as leaving the Nvidia balance sheet behind, paying bail and not leaving France. We can see that the impact of the news coming from Nvidia started to decrease during the day.
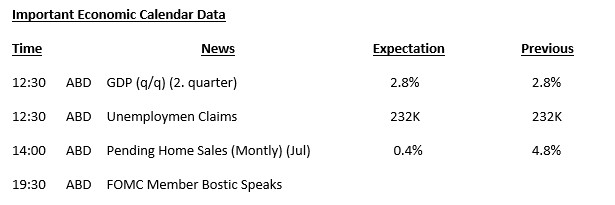
The overall risk appetite (negative impact of Nvidia) is likely to cause European stock markets to start the day on the negative side. However, whether this mood will continue or not may be reshaped by the data to be released for the US economy during the day. Today we will see how much the world’s largest economy grew in the second quarter, weekly unemployment claims and the change in pending home sales in July. Also, Federal Open Market Committee (FOMC) member Bostic is expected to deliver a speech.
We can say that Unemployment Claims are the most prominent in this bundle of news we mentioned above. GDP (which will show Economic Growth) will be the second reporting for the same quarter, and we know that the impact on the markets is limited, even if it comes in different from expectations, as the first one pointed to 2.8% growth. Bostic, on the other hand, in his recent speeches, has stated that he thinks that the time has come to cut interest rates, but he has made his stance clear by saying that he would like to see more employment and inflation data. Therefore, we see the Unemployment Claims data more likely to guide the changes in the monetary policy of the US Federal Reserve (FED).
For this data, if we see an application above the expectation, it may support the rises in crypto assets, while if we see that the applications remain below the forecasts, we may see a retreat in digital currencies.
TECHNICAL ANALYSIS
BTC/USDT
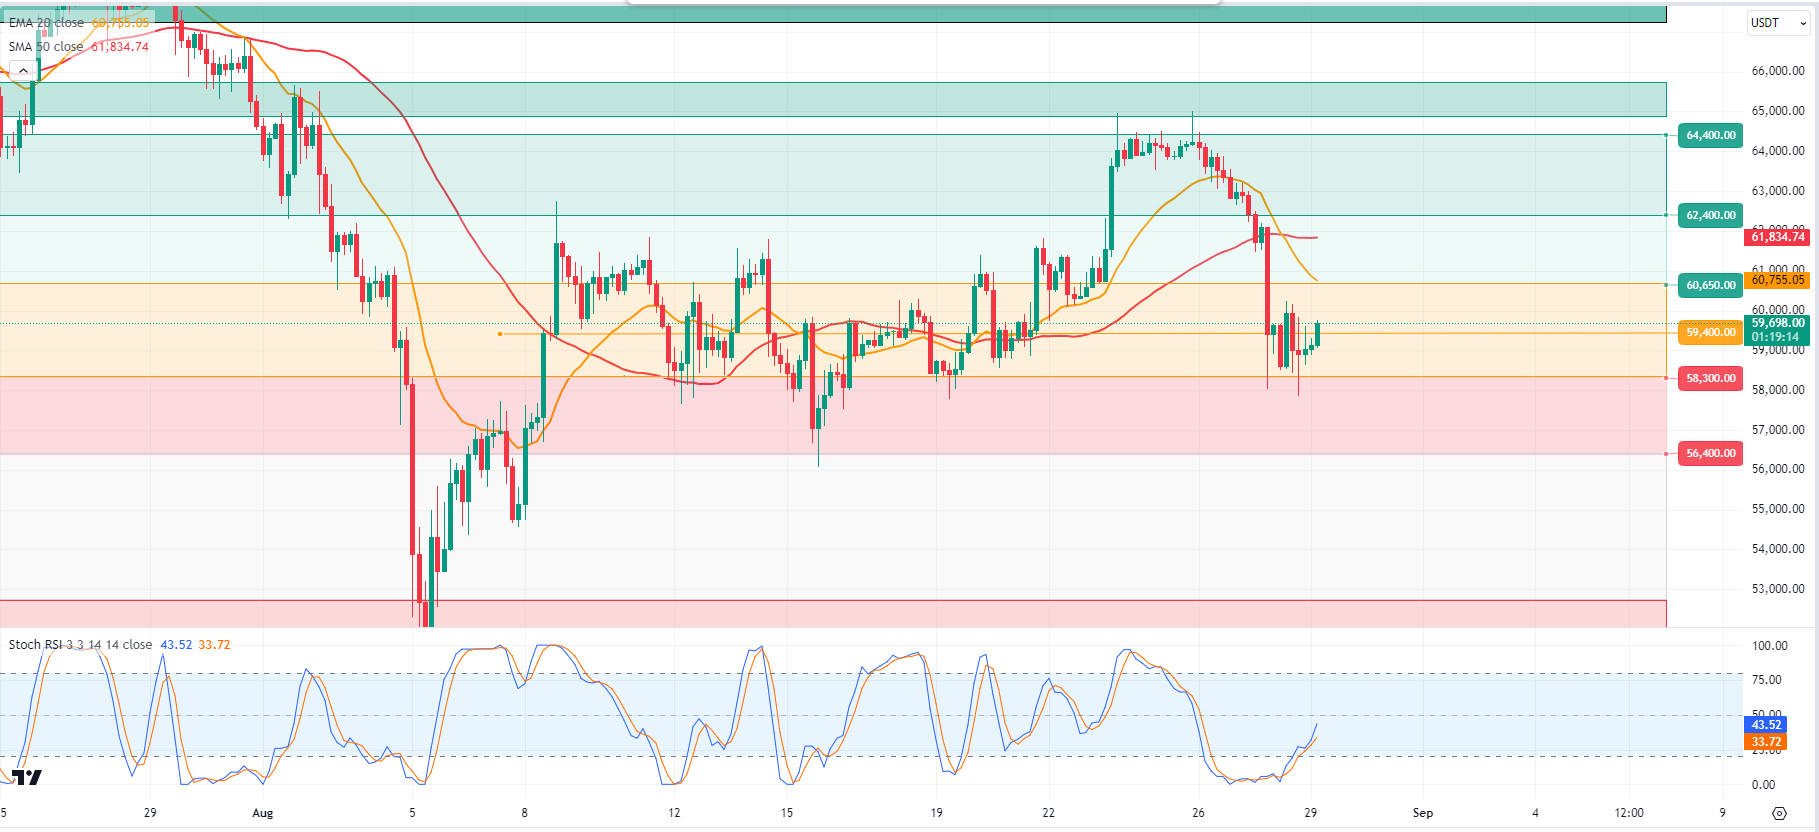
Bitcoin is in a Fragile Cycle! Amid market volatility, Bitcoin continues to hold at a critical level. Institutional investors’ actions are keeping the market fragile ahead of the upcoming macroeconomic data. The outflow of 105.19 million dollars from Bitcoin spot ETFs, which have recently witnessed positive inflows, may have caused some concern in the market. In addition, Nvidia’s earnings reports announced yesterday are among the factors that increase volatility in the market. If we look at the BTC 4-hour technical analysis, with the break of the 59,400 point, which is the resistance level, it managed to recover again after testing the 58,000 level and came back above the 59,400 level. With the US Gross Domestic Product data to be announced today, volatility may increase again in the market. In this direction, the Bitcoin price holding above the resistance level can be perceived positively and the persistence above the 59,400 level can move the price back to the 60,650 and 60,850 resistance range. In case of a pullback, a downward break of the 59,400 level may create a new selling pressure and the price may test the 58,000 level again. In addition, the fact that the 20-day moving average in Bitcoin remains below the 50-day moving average may be among the situations that increase bearish dominance in the market.
Supports 59,400 – 58,300 – 56,400
Resistances 60,650 – 61,700 – 62,400
ETH/USDT
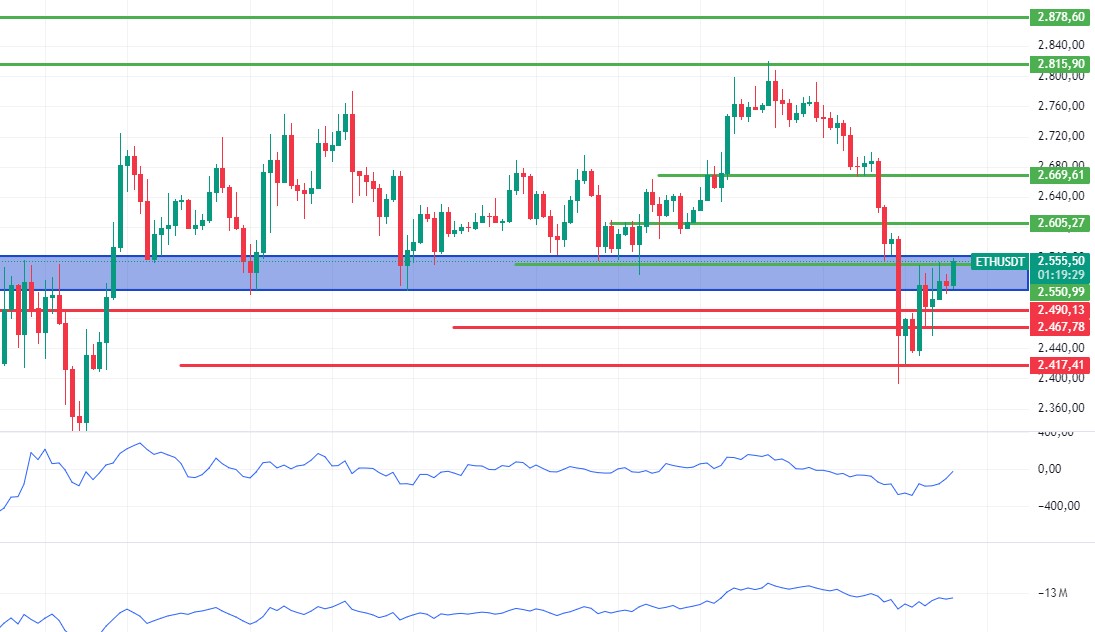
In the crypto market, which had a volatile night with the announcement of NVIDIA Q2 revenue, Ethereum managed to stay at the 2,490 level, but could not pass the main resistance level of 2,550 that we identified yesterday. With the positive outlook in OBV and CCI, coupled with the acceleration in momentum, a rise up to 2,605 can be expected by breaking this resistance level during the day. 2,490 support is likely to hold strong, but a break there could pull the price back to 2,467. ETH ETFs also saw a net inflow of +5.9 million dollars, ending the recent series of outflows. Grayscale’s selling pressure seems to have eased. This is another reason to support the positive outlook.
Supports 2,490 – 2,467 – 2,417
Resistances 2,550 – 2,605 – 2,669
LINK/USDT
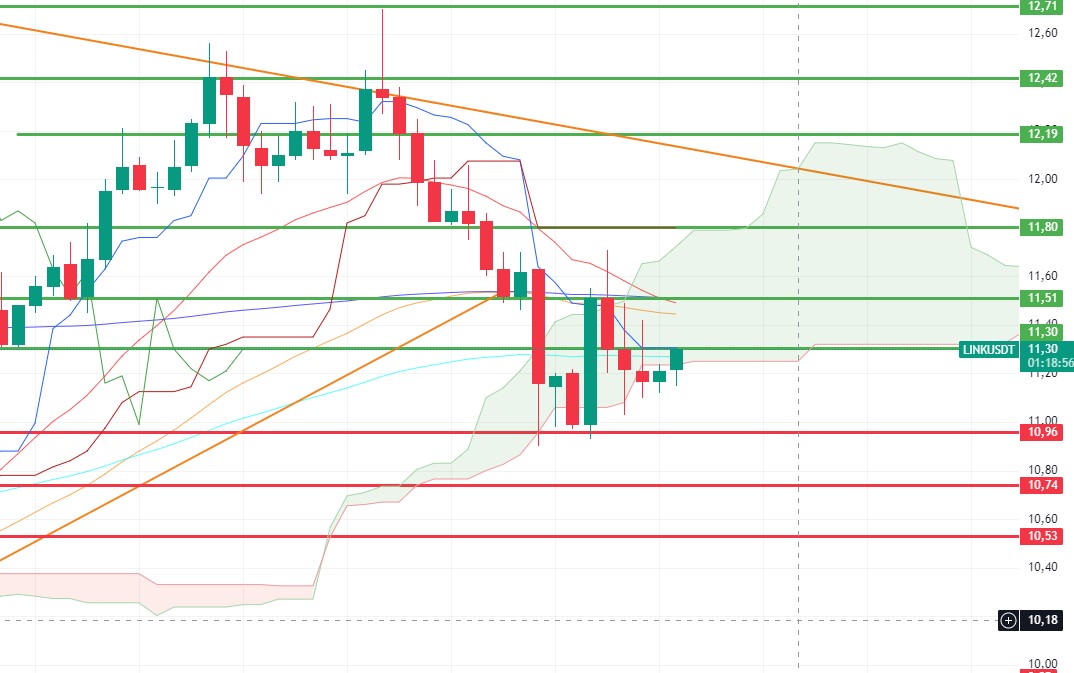
Although LINK had a positive outlook for yesterday, it declined as it lost the 11.49 level. It reacted at 11.03 and is stuck between EMA 50 and the kumo cloud. Considering the activity in the markets, it seems likely that it will continue to rise by breaking through the cloud resistance again. In particular, the gain of 11.30 may bring 11.51 and 11.80 levels respectively. The 10.96 level maintains a strong main support position. Closures below this level may trigger the price to enter the bearish channel.
Supports 10.96- 10.74 – 10.53
Resistances 11.30 – 11,51 – 11.80
SOL/USDT
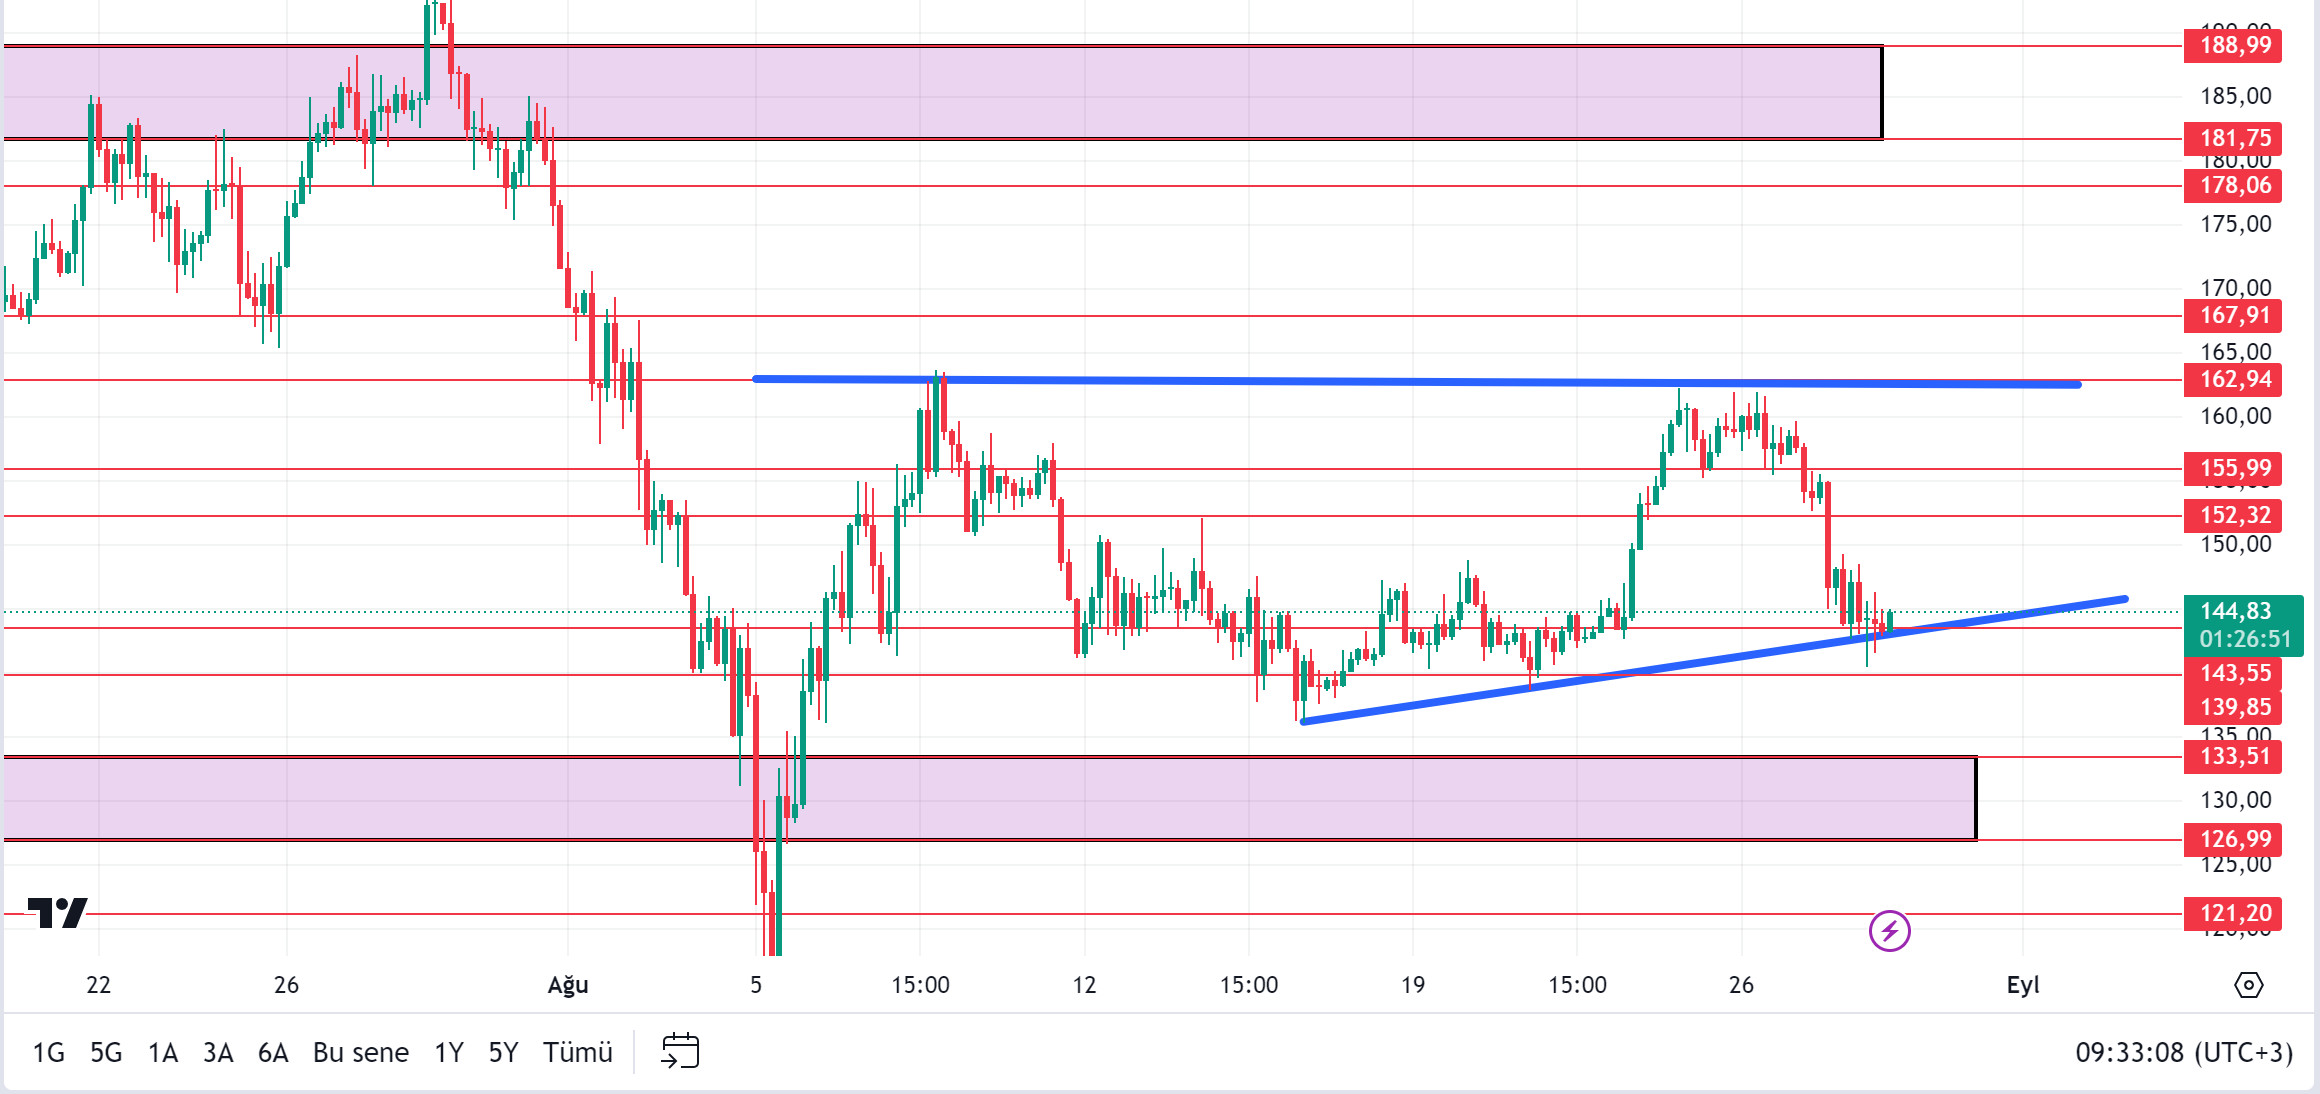
Today’s GDP data from the US seems to be among the important data. In yesterday’s pullbacks, the fear and greed index in the market fell to 30 points. The reason for this was the news that Telegram CEO was released. Later, when this news was denied, panic and fluctuations occurred in the market. With the market recovering slightly, this score has risen to 46. This may mean a recovery signal today. When we look at the chart, SOL is at the bottom of the ascending triangle formation. If it continues to hold from here, the rise may continue and test the resistance levels of 152.32 – 155.99. If the fear in the market continues, the support of the ascending triangle pattern may break and cause an increase in selling pressure. In this scenario, 143.55 – 139.85 supports should be followed.
Supports 143.55 – 139.85 – 133.51
Resistances 152.32 – 155.99 – 162.94
ADA/USDT
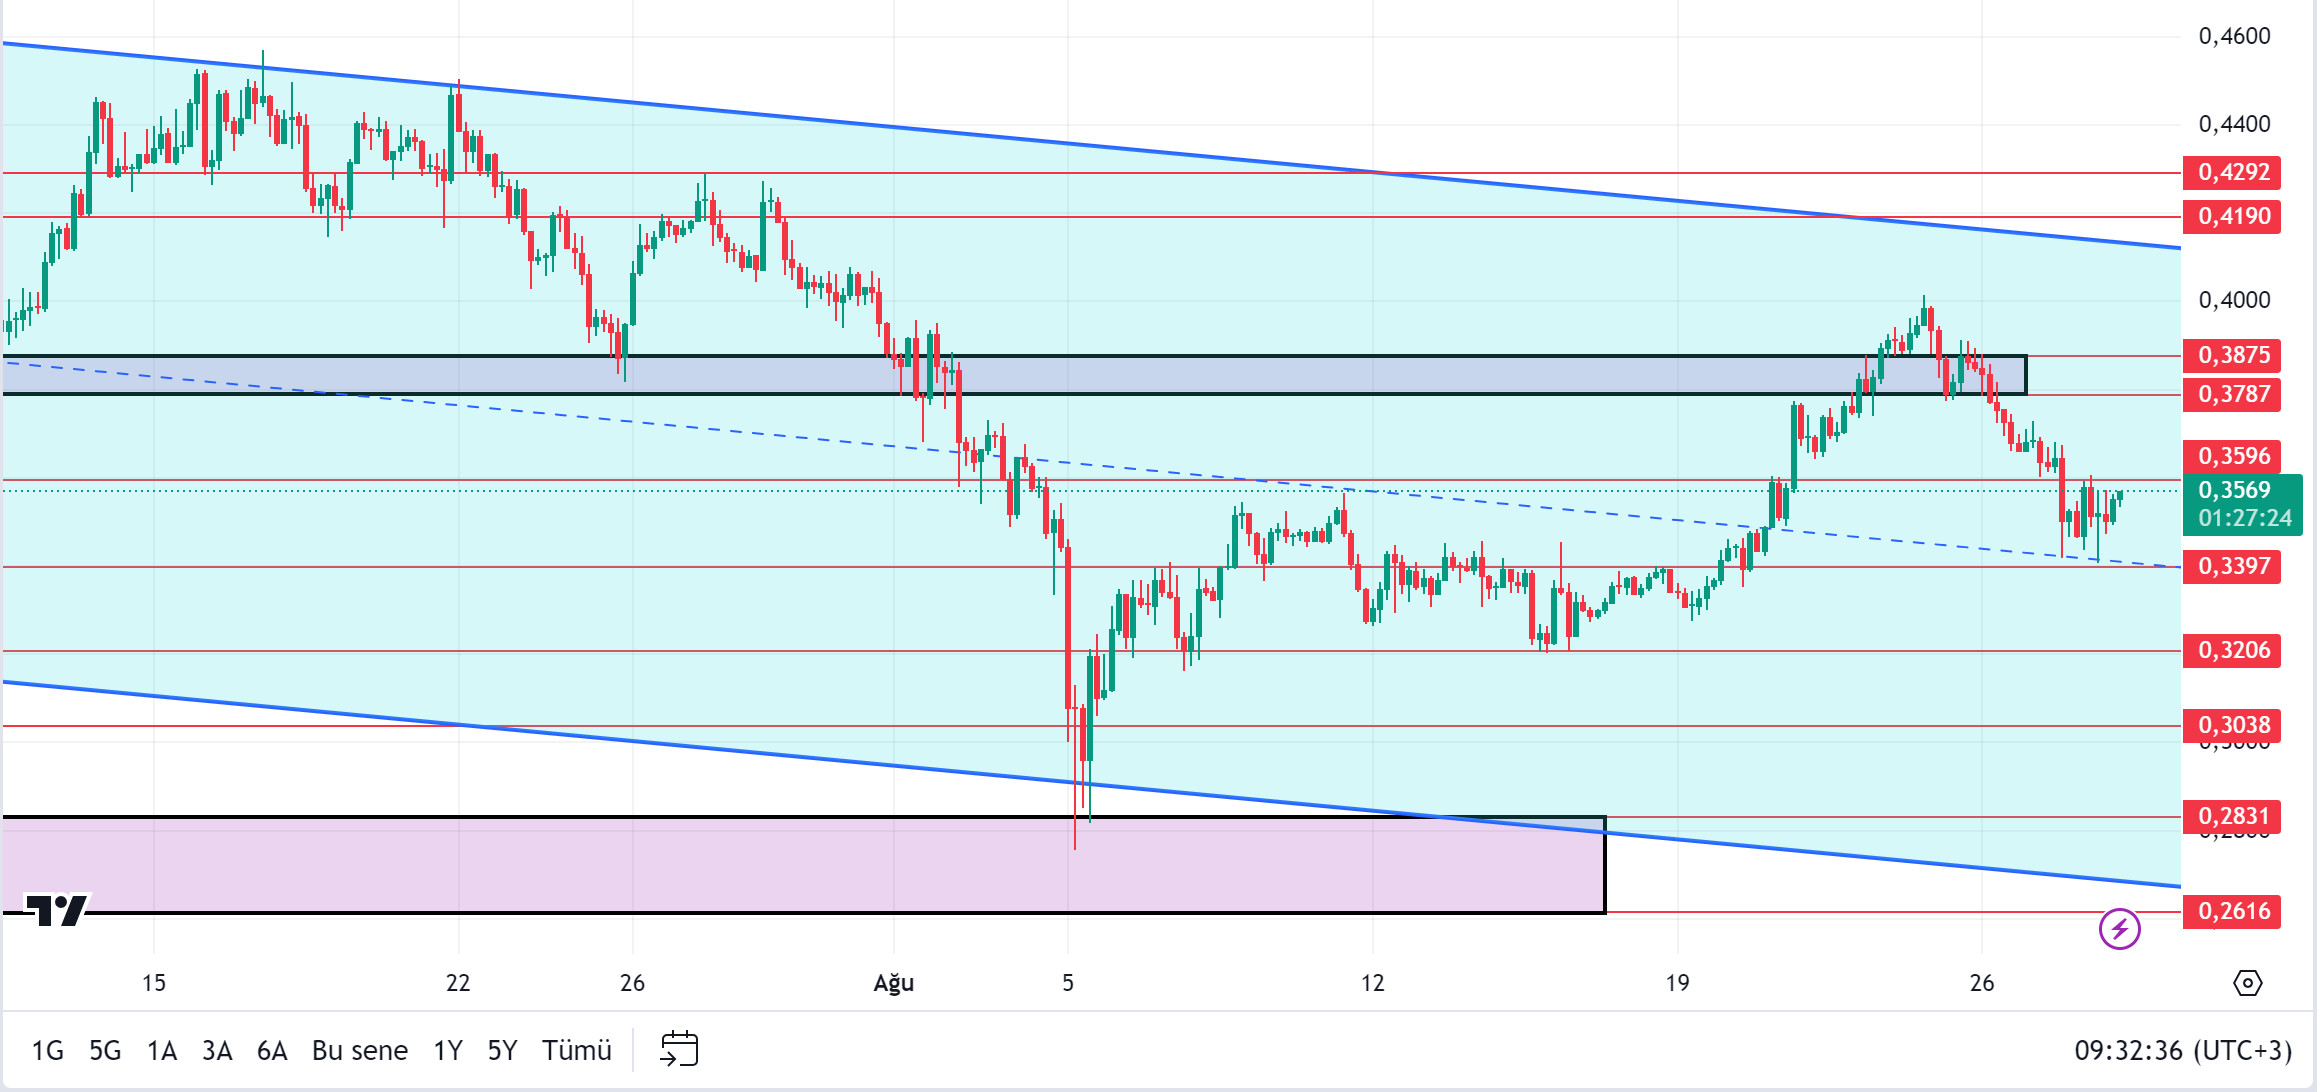
Investor confidence in Cardano has also been shaken by the alleged disappearance of founder Charles Hoskinson, who has been absent from the public and social media since August 24. The founder, who usually makes his statements on the X platform, had not posted for 4 days. This morning he broke his silence and started sharing. In the Cardano ecosystem, active addresses continue to increase. This may be a harbinger of a rise. Increased network activity shows that the Cardano protocol is far from dead. The 30-day MVRV ratio has dropped to -0.274, indicating that it is a logical time to invest in ADA. In simpler terms, investors are unlikely to sell ADA, preferring to add to their existing holdings. ADA is priced at 0.3569, supported by the mid-level of the descending channel. As the uptrend continues, 0.3787 – 0.3875 levels can be followed as resistance levels. In the scenario where investors foresee BTC’s selling pressure to continue, albeit short-term, 0.3397 – 0.3206 levels can be followed as support if it continues to be priced in the descending channel.
Supports 0.3397 – 0.3206 – 0.3038
Resistances 0.3787 – 0.3875 – 0.4190
AVAX/USDT
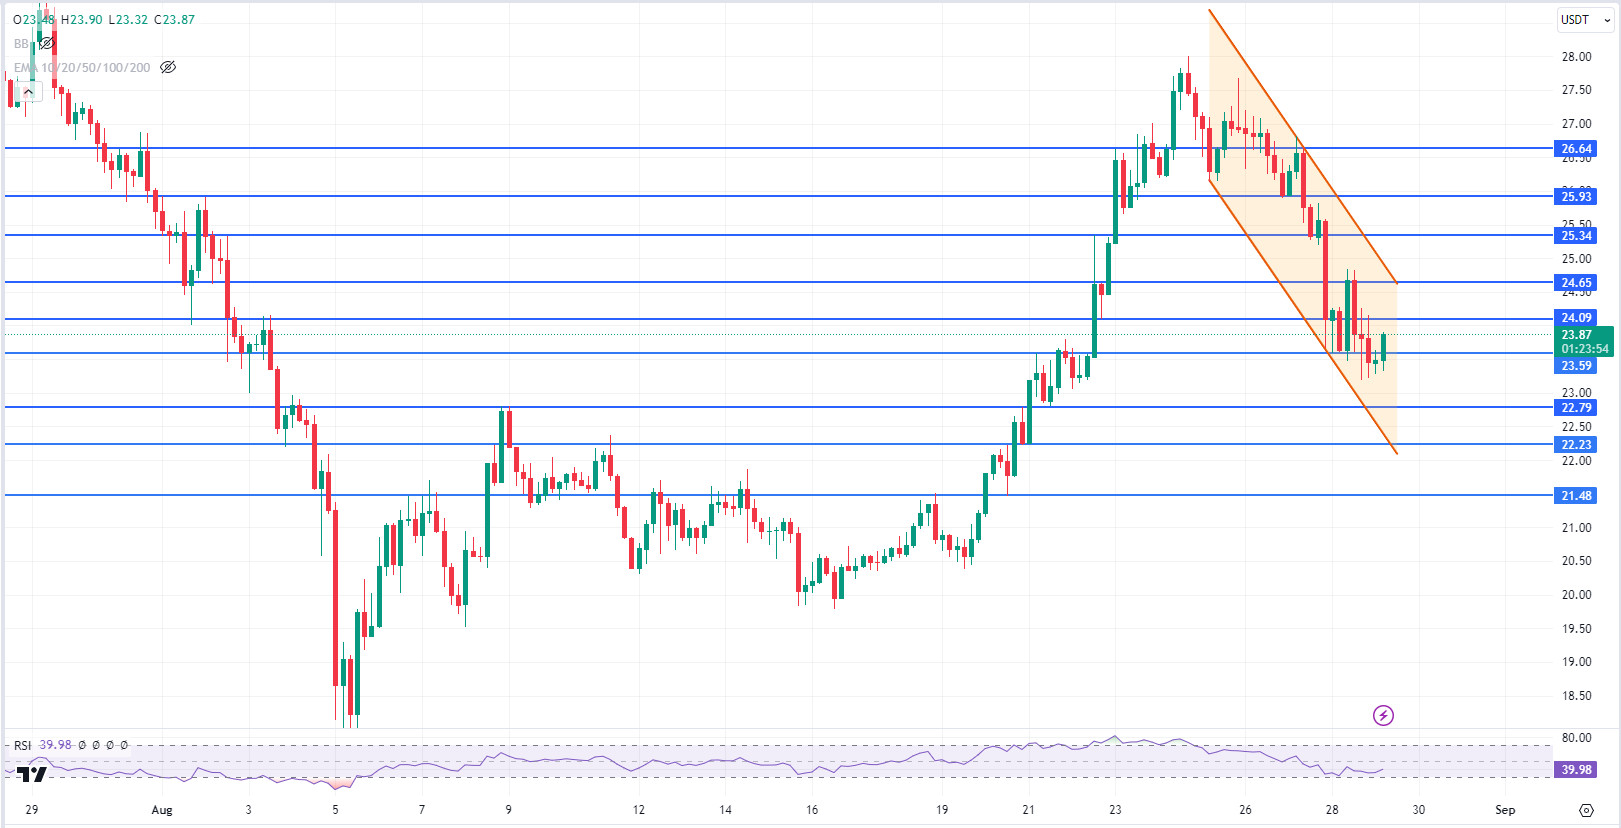
AVAX, which opened yesterday at 24.08, lost about 2.5% and closed the day at 23.45. It is currently trading at 23.87.
Today, US Gross Domestic Product and unemployment claims data will be released. Since these data are closely followed by the market, they may have an impact on price movements. Therefore, high volatility may occur at the time of data release. AVAX, which moves in a falling channel, is trying to exit from the lower band of the channel to the upper band on the 4-hour chart. It is currently trying to break the 23.60 resistance and may want to move towards the upper band of the channel if it closes the 4-hour candle above this resistance. Thus, it may test the 24.09 and 24.65 resistances. If it fails to break 23.60 resistance and faces selling pressure here, it may test 22.79 and 22.23 supports. As long as it stays above 21.48 support during the day, it may want to rise. With the break of 21.48 support, sales may deepen.
Supports 22.79 – 23.23 – 21.48
Resistances 23.59 – 24.09 – 24.65
TRX/USDT
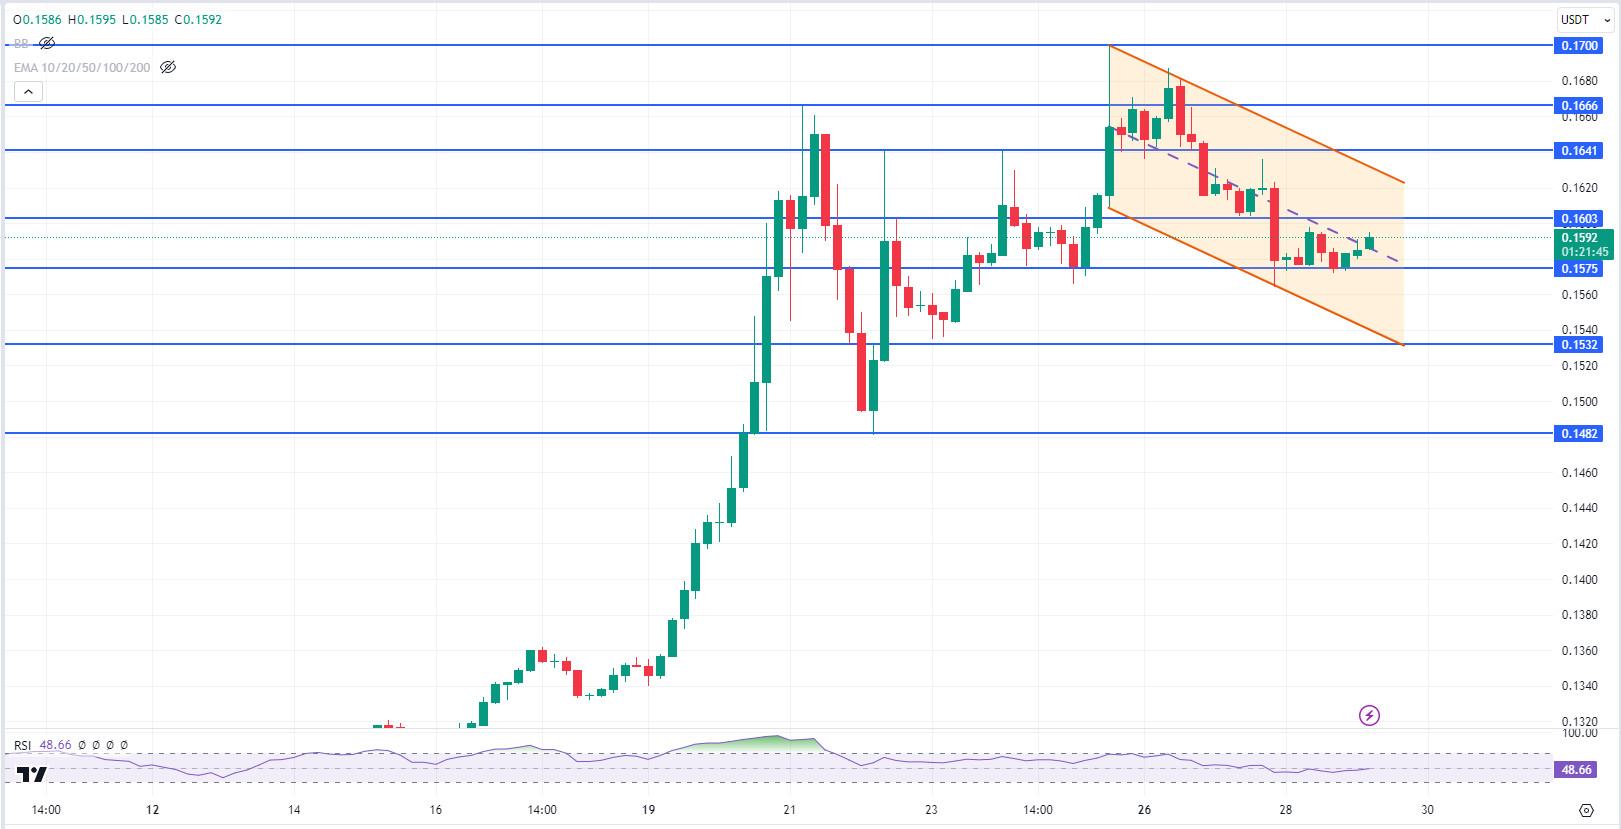
TRX, which started yesterday at 0.1580, closed the day at 0.1583. It is currently trading at 0.1592. TRX, which moves in a falling channel on a day when important US data (gross domestic product and unemployment claims) will be released, is in the middle band of the channel on the 4-hour chart. It is trying to rise from the middle band to the upper band and may continue its rise if it breaks the 0.1603 resistance. In such a case, it may test 0.1641 and 0.1666 resistances. If it fails to break the middle band and retreats, a reaction from the lower band can be expected. If there is no buying reaction from the lower band, it may test the 0.1575 and 0.1532 supports. As long as TRX stays above 0.1482 support, the upward appetite will continue. If it breaks this support downwards, selling pressure may increase.
Supports 0.1575 – 0.1532 – 0.1482
Resistances 0.1603 – 0.1641 – 0.1666
XRP/USDT
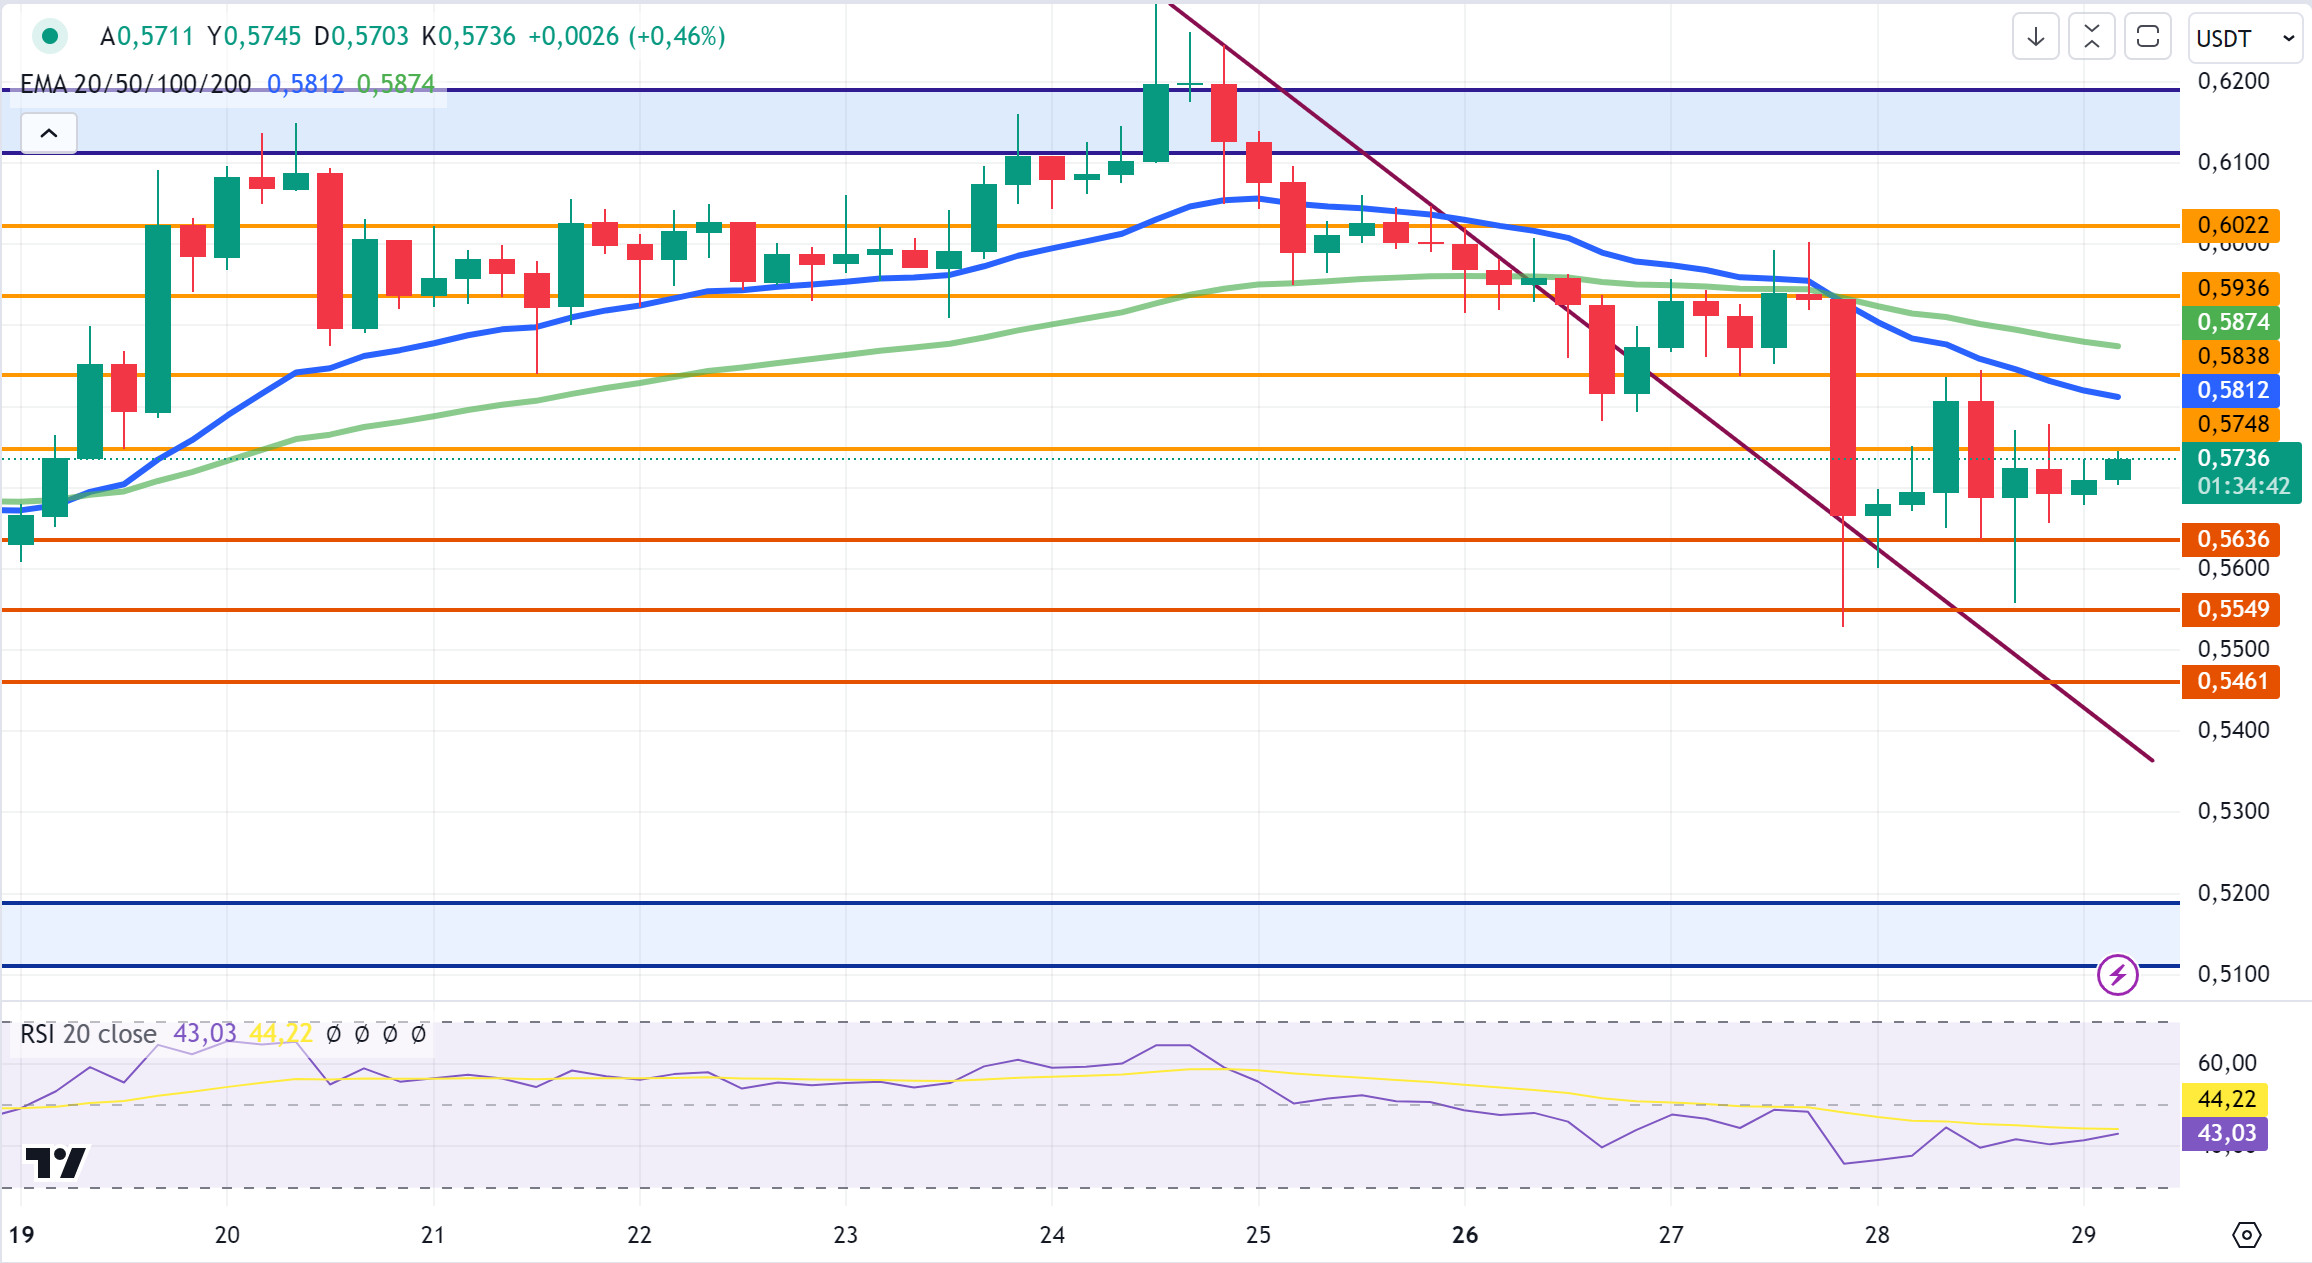
XRP closed yesterday at 0.5690, up 0.5% on a daily basis. In the 4-hour analysis, XRP, which started the new day with a rise, is currently trading at 0.5736.
In the crypto market this week, XRP is trading within the 0.55-0.58 horizontal band, with the decline in the crypto market, especially BTC and ETH, with the selling pressure that occurred after the large volume sales that occurred. This horizontal band can offer opportunities in short-term trading with upward and downward movements in the 4-hour analysis.
As XRP continues its movement within the horizontal band, it may test the resistance levels of 0.5748 – 0.5838 – 0.5936 in the gradual rise it may experience for a return to the 0.58-0.61 horizontal band in the expectation of upward movement. In the bearish scenario, it may test the support levels of 0.5636 – 0.5549 – 0.5461 in the decline towards the 0.52-0.55 horizontal band.
Supports 0.5636 – 0.5549 – 0.5461
Resistances 0.5748 – 0.5838 – 0.5936
DOGE/USDT
In the 4-hour analysis, DOGE, which continued to rise on yesterday’s closing candle and today’s opening candle, continues to trade at 0.1011 with a 1.5% increase today.
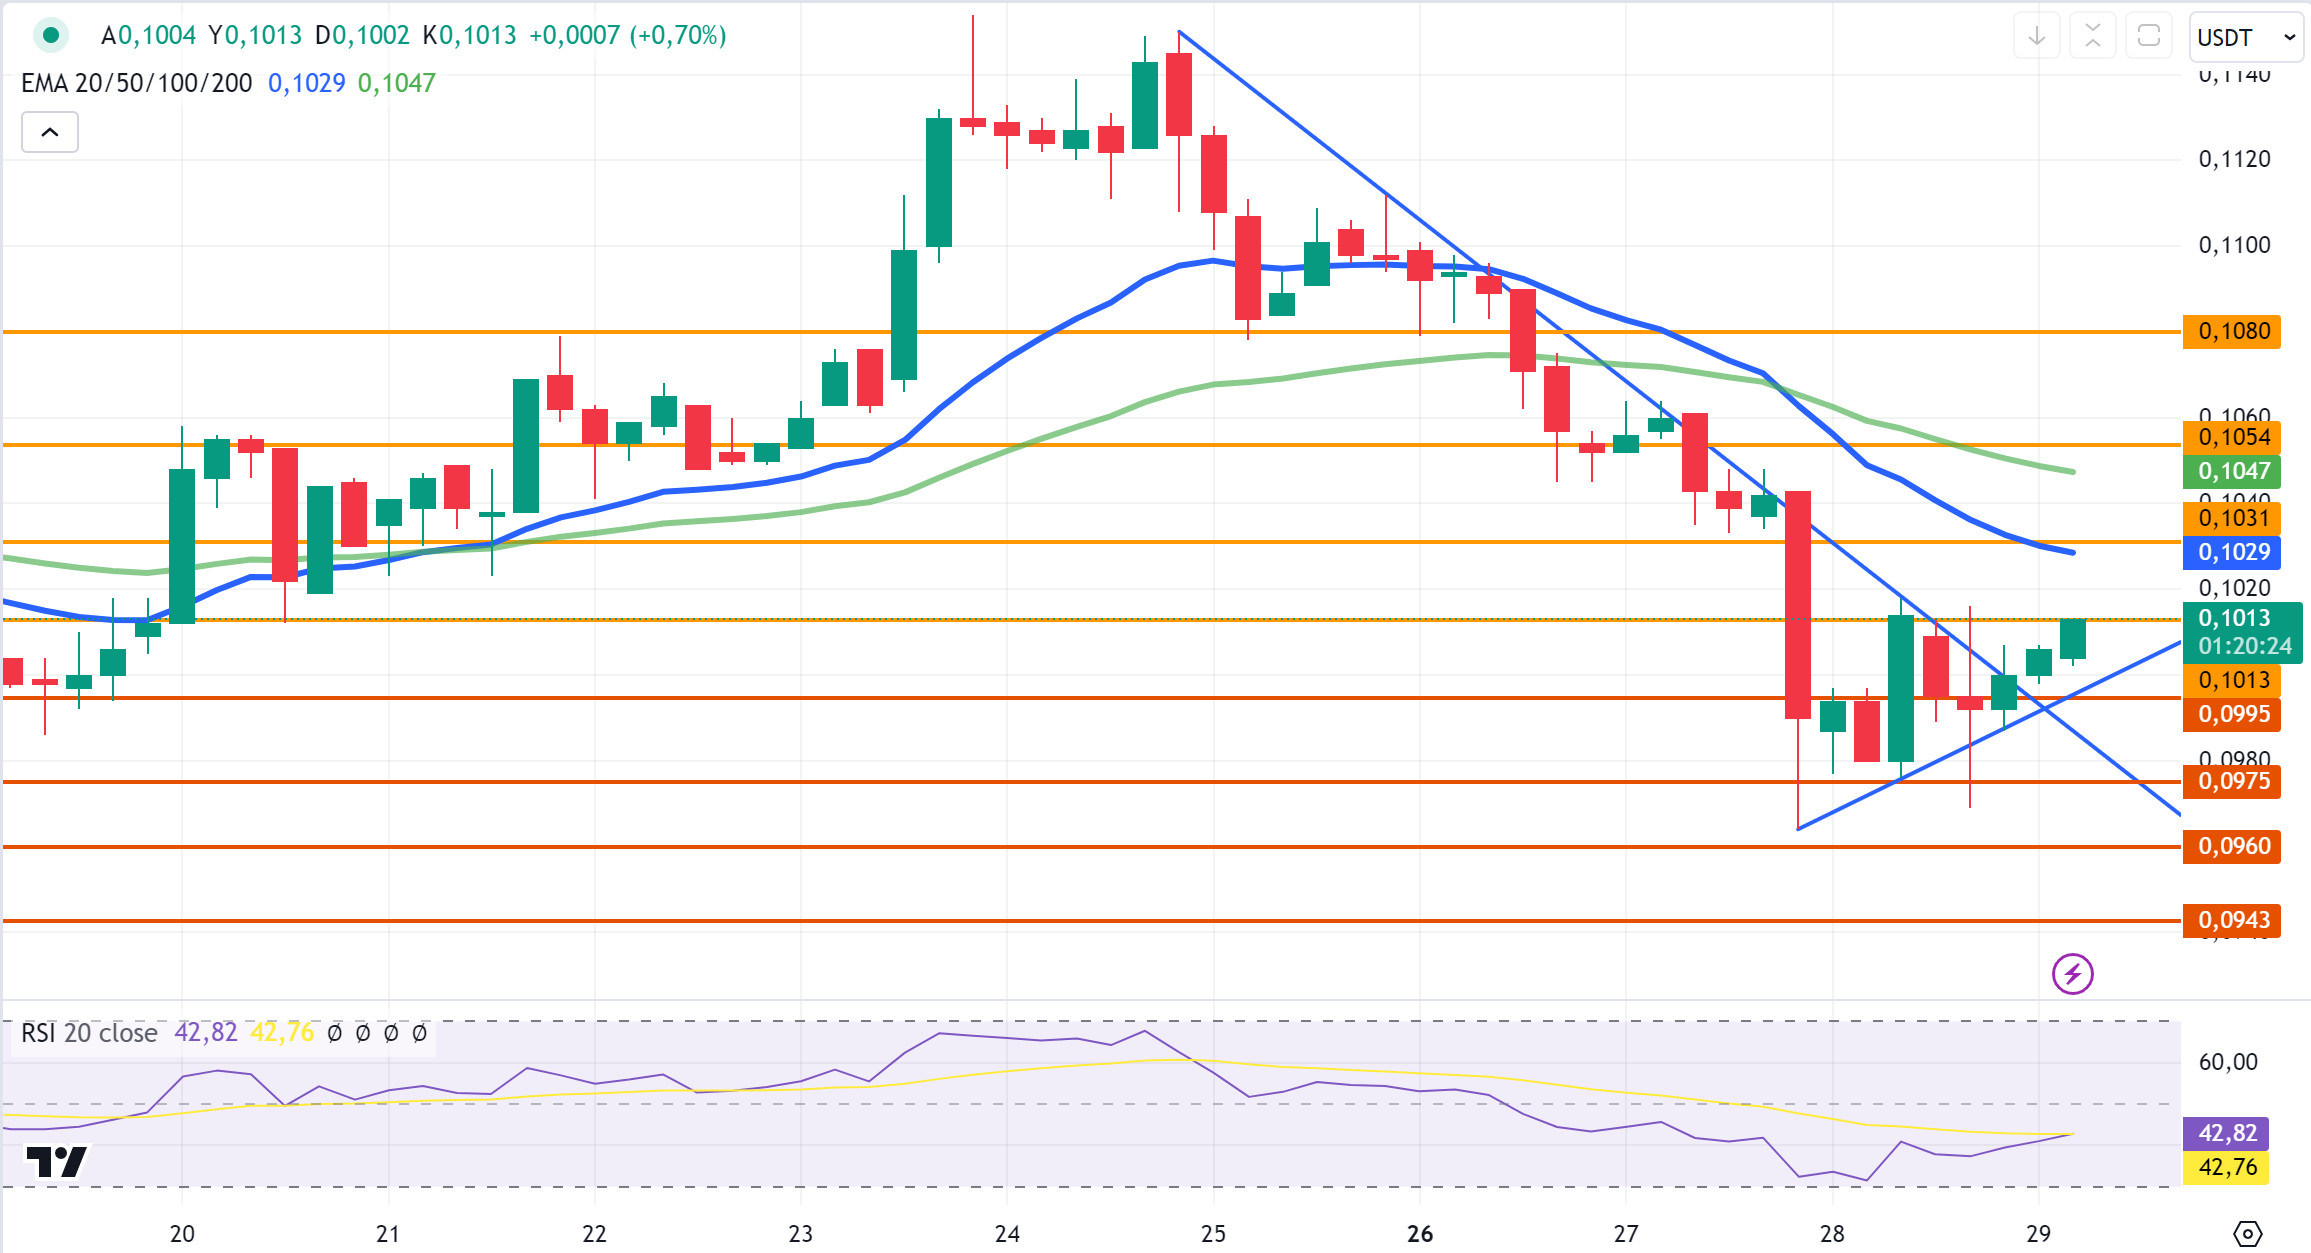
DOGE rose to 0.10 with a recovery after a sharp decline and is trading between the 0.0995 support level and the 0.1013 resistance level today. In the crypto market, where recovery is observed after a sharp decline, there is an upward expectation in DOGE, and if the expectations are positive, DOGE may test the resistance levels of 0.1031 – 0.1054 with the continuation of the upward movement if the resistance level of 0.1013, which it tested in the last candle in the 4-hour analysis today, is broken. On the contrary, if it declines, it may test the support levels of 0.0995 – 0.0975 – 0.0960.
Supports 0.0995 – 0.0975 – 0.0960
Resistances 0.1013 – 0.1031 – 0.1054
DOT/USDT
“In a recent interview with Bullish CEO Tom Farley, Polkadot creator Gavin Wood stated that his current focus is primarily on JAM Chain. This upgrade could increase Polkadot’s competitiveness by offering new use cases and economic incentives for DOT. Development of JAM is ongoing and is scheduled to be completed by next summer.
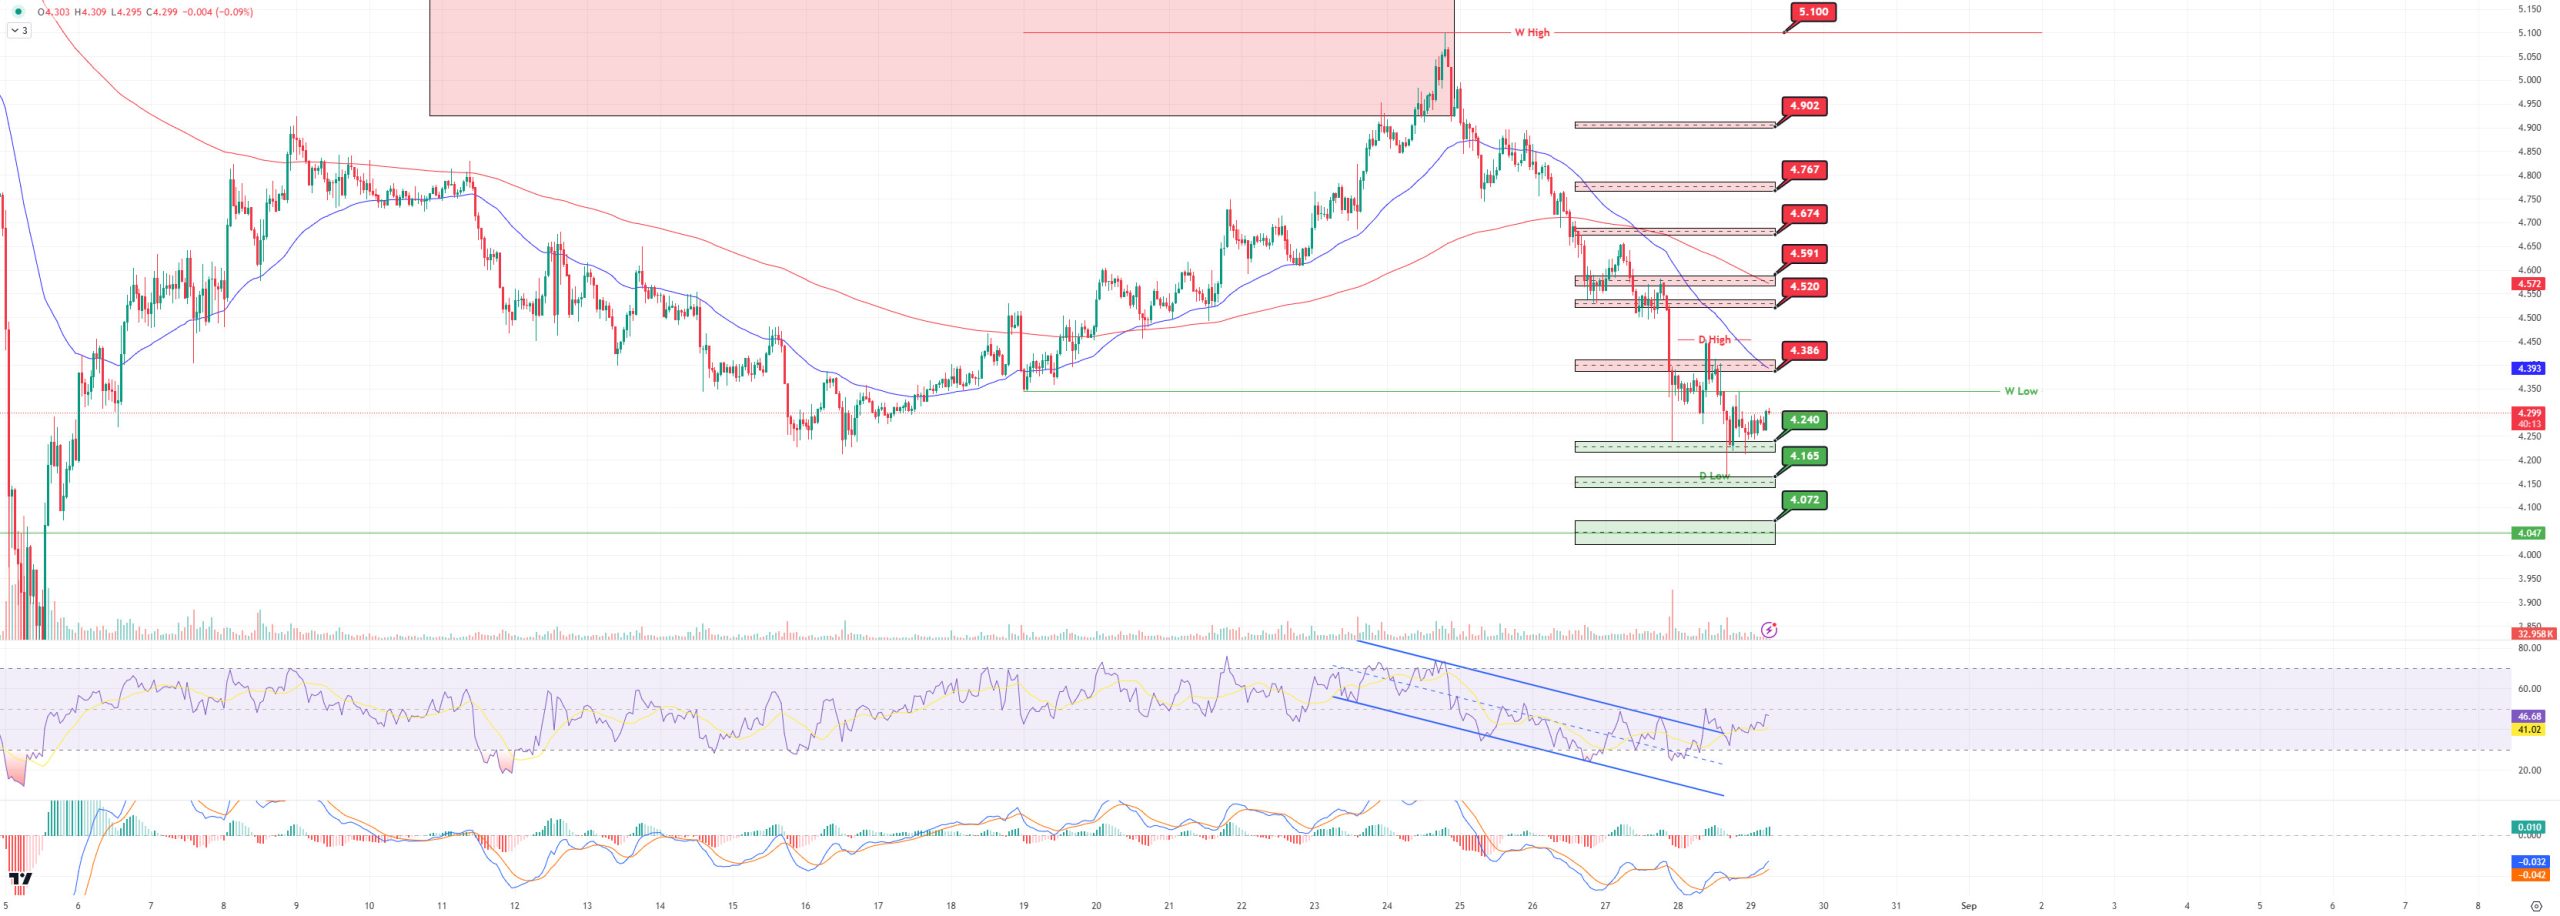
As for the Polkadot chart, DOT, which fell below the previous week’s low, seems to have broken down the 4.343 and 4.292 levels and found support at 4.240. When we analyze the MACD, we can say that the buyer pressure increased compared to the previous hour. RSI, which broke the upper band of the falling channel, continues its upward movement. If the price stays above the 4.240 level, it may rise to its next resistance of 4.386. If the price falls below the 4,240 level with increasing selling pressure, it may retreat towards 4,165 and 4,072 levels respectively.
(Blue line: EMA50, Red line: EMA200)
Supports 4.240 – 4.165 – 4.072
Resistances 4.386 – 4.520 – 4.386 – 4.591 – 4.674 – 4.767 – 4.902 – 5.100
 SHIB/USDT
“The Shiba Inu (SHIB) ecosystem is notable for burning initiatives such as ShibTorch, which aims to stabilize the price by reducing the supply of SHIB. The development team is focused on preserving SHIB’s value and supporting its long-term growth through deflation mechanisms and new strategies. Shytoshi Kusama also told the community that the focus is on solving the challenges and that patience is required for growth.
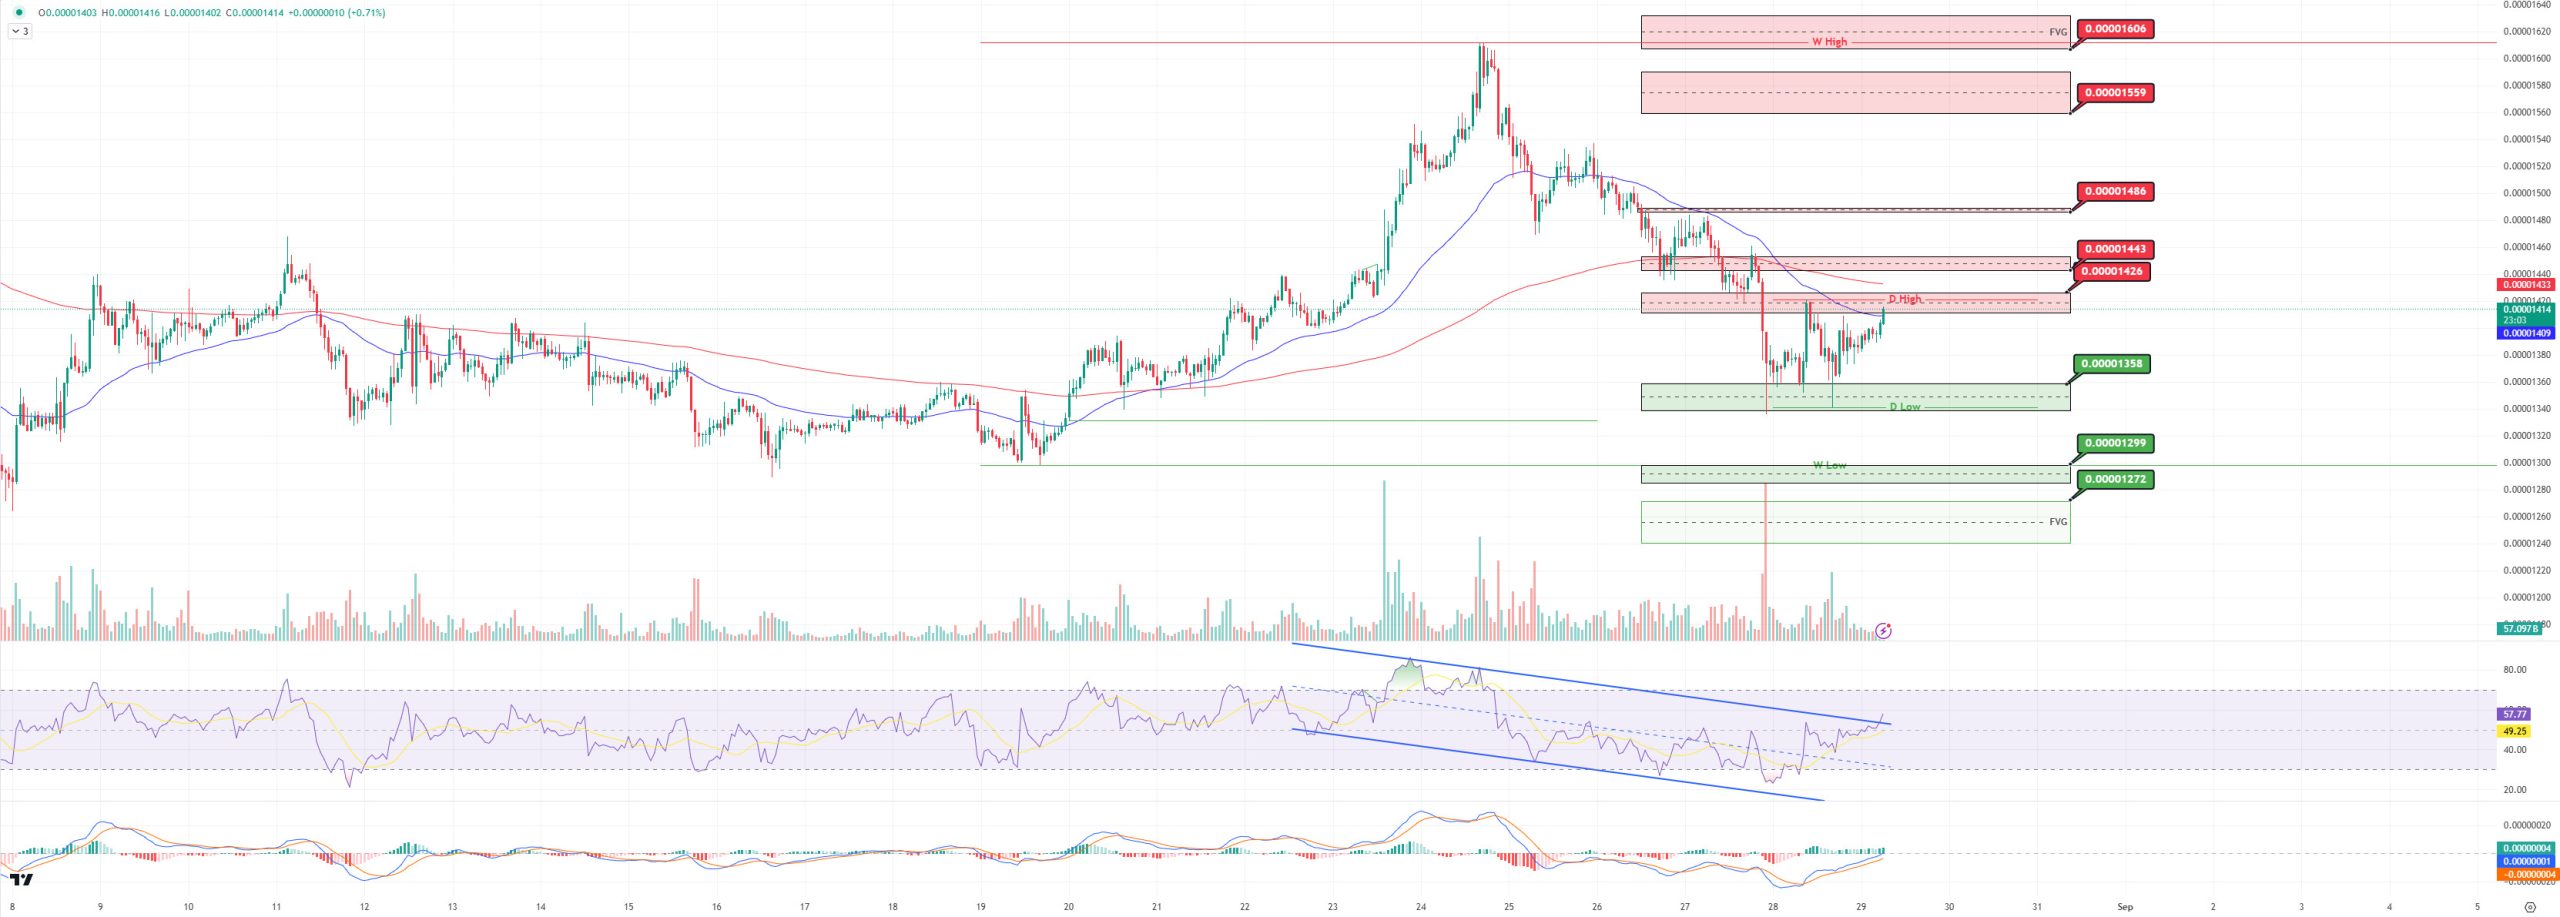
On the SHIB chart, we can say that it stands stronger despite the pullbacks in the cryptocurrency market. When we analyze the MACD, we can say that the buyer pressure increased compared to the previous hour, while the RSI broke the upper band of the falling channel upwards. In the positive scenario, if the price breaks the selling pressure at 0.00001426, it may rise towards 0.00001443 and 0.00001486 levels respectively. In the negative scenario, if the price retreats before breaking the 0.00001426 level, it may want to test the first support level of 0.00001358 if the selling pressure increases.
(Blue line: EMA50, Red line: EMA200)
Supports 0.00001358 – 0.00001299 – 0.00001272
Resistances 0.00001426 – 0.00001443 – 0.00001486 – 0.00001559 – 0.00001606 – 0.001678
LEGAL NOTICE
The investment information, comments and recommendations contained herein do not constitute investment advice. Investment advisory services are provided by authorized institutions on a personalized basis, taking into account the risk and return preferences of individuals. The comments and recommendations contained herein are of a general nature. These recommendations may not be suitable for your financial situation and risk and return preferences. Therefore, making an investment decision based solely on the information contained herein may not produce results in line with your expectations.


