MARKET SUMMARY
Latest Situation in Crypto Assets

*Table prepared on 28.08.2024 at 14:00 (UTC)
WHAT’S LEFT BEHIND
“What you need to know before Nvidia earnings report”
Nvidia’s second quarter earnings report for 2024, whose share value has been steadily increasing since artificial intelligence started to be talked about a lot around the world, will be announced this evening. The Nvidia earnings report is also of great importance for the recently falling technology stocks. Nvidia, whose share value has increased by 157% since the beginning of the year, is expected to increase its total revenues by 112% in this quarter, even preventing the decline in the markets with its earnings reports in the past quarters.
“Binance CEO Teng responds to allegations about Palestinian users”
Yesterday, Ray Youssef, former CEO of Paxful, claimed that “Binance has confiscated the assets of all Palestinian users”, which was responded by Richard Teng, CEO of the exchange, and Yi He, one of the founders. The two executives stated that the seizure and asset freeze applies to a limited number of users.
“Toncoin Outpaces Bitcoin and Ether by Cutting Losses”
Toncoin (TON) pared its losses as the blockchain restarted after a nearly five-hour outage. The outage is said to be related to a higher-than-expected demand for an airdrop organized by the Ton Foundation to draw attention to the wrongful arrest of Pavel Durov.
HIGHLIGHTS OF THE DAY

INFORMATION:
*The calendar is based on UTC (Coordinated Universal Time) time zone. The economic calendar content on the relevant page is obtained from reliable news and data providers. The news in the economic calendar content, the date and time of the announcement of the news, possible changes in the previous, expectations and announced figures are made by the data provider institutions. Darkex cannot be held responsible for possible changes that may arise from similar situations.
MARKET COMPASS
Losses in digital assets during the Asian session gave way to some recovery during European trading. Among the major cryptocurrencies, BTC rose close to 4% from its low during the US session, while ETH gained over 6%. Among the few headlines dominating prices, attention today turned to Nvidia’s highly anticipated balance sheet and the company’s expectations.
After a period of increased risk appetite with Powell’s recent statements, losses in digital assets gained weight. After a period in which expectations for global monetary policy changes guided prices, eyes turned to Nvidia today. The company is expected to announce its quarterly financial results after the US session closes. According to the Bloomberg survey, Nvidia, whose sales level is especially curious about artificial intelligence technology, is expected to record a revenue growth of more than 70%. It is estimated that we will see sales revenue realized at 31.85 billion dollars. We can say that volatility will increase in the market as soon as the balance sheet is announced. Afterwards, the company’s future expectations and forecasts will be in focus.
TECHNICAL ANALYSIS
“BTC/USDT”
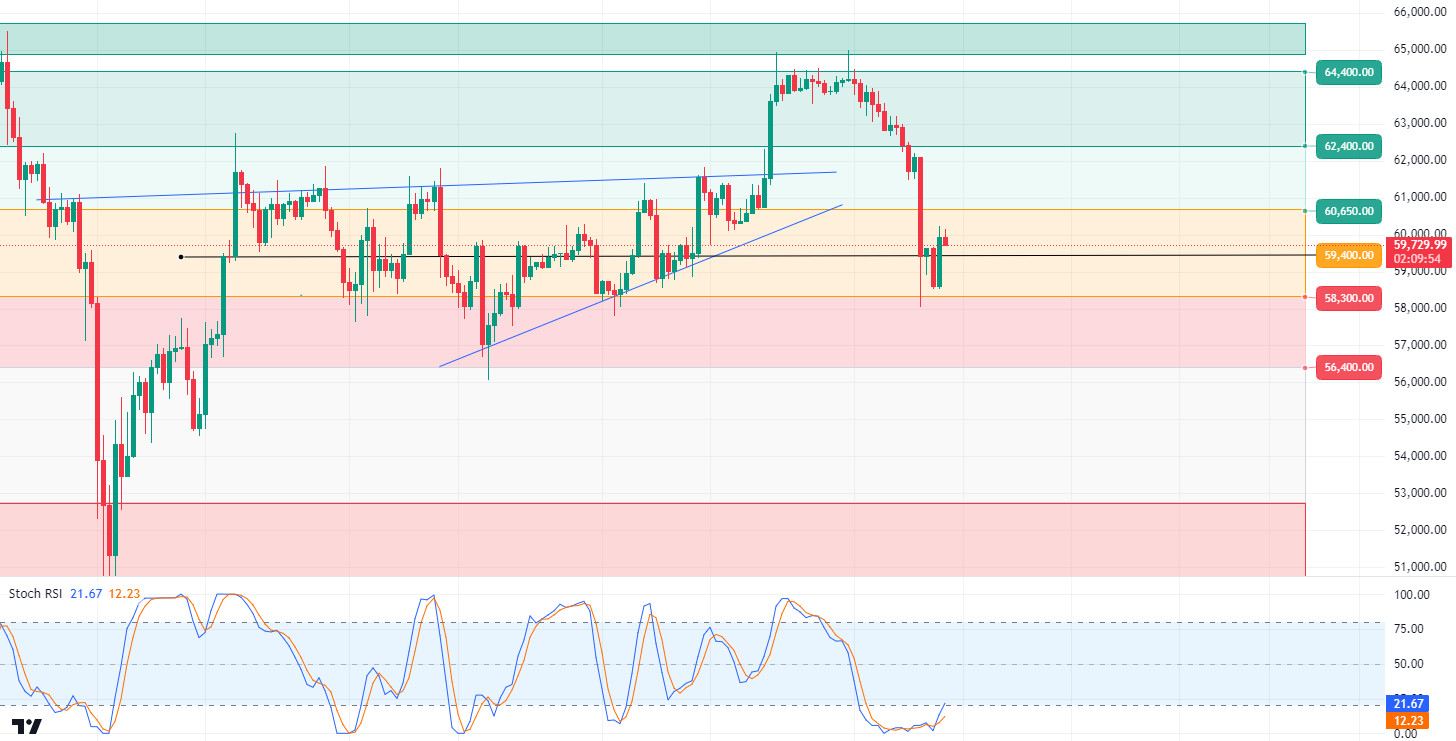
Is Bitcoin recovering? Bitcoin, which saw below 58,000 with the wave of sales last night, is trying to recover losses today. Bitcoin, which retreated in market dynamics outside the usual news flow, caused quite high liquidations. The declines in Bitcoin, which had previously risen with Powell’s dovish messages, are expected to be shorter-lived compared to previous declines. Ultimately, the increase in liquidity with interest rate cuts may lead to an increase in risky assets and drive prices upwards. The balance sheet figures of the US technology company Nvidia, which will be announced today, may have a positive impact on the market as in the past, especially crypto assets and major cryptocurrencies that serve in the field of artificial intelligence. In the BTC 4-hour technical analysis, we see that the price is trying to consolidate just above 59,400. Closes above this level could take the price back to the psychological resistance zone of 60,650 and 60,800. As a matter of fact, our technical indicator RSI has turned its direction upwards in support of this. The level we should pay attention to against a possible new wave of sales may be the closures below 59,400.
Supports 59,400 – 58,300 – 56,400
Resistances 60,650 – 61,700 – 62,400
ETH/USDT
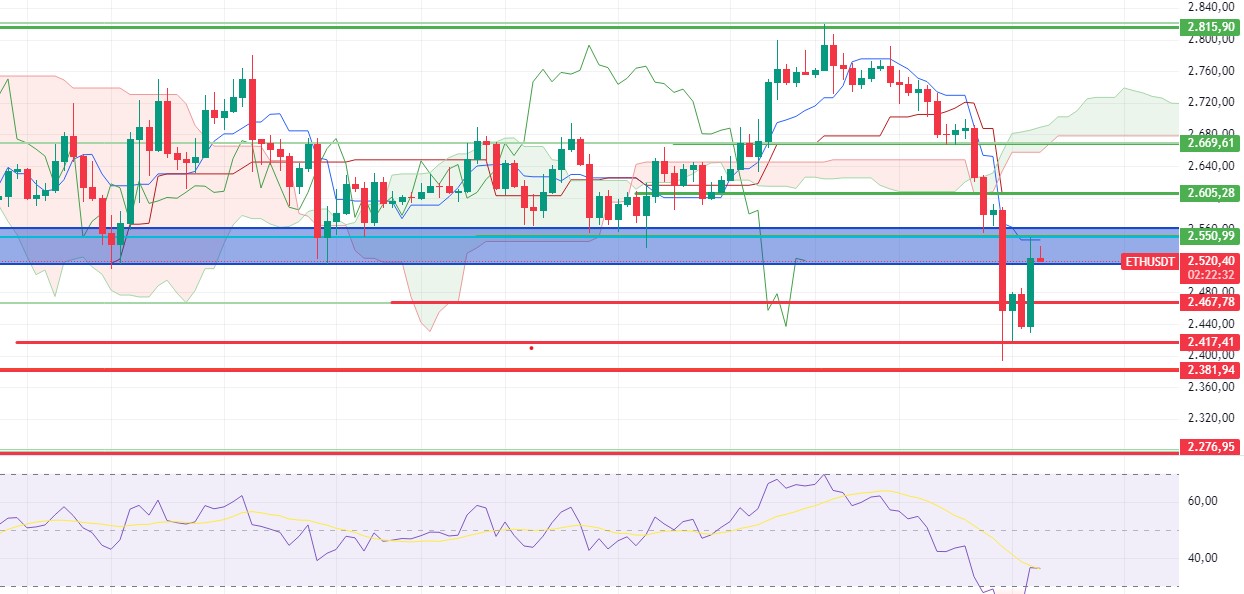
Although Ethereum rose slightly with the reaction it received from the 2,417 level, it was rejected from the 0.618 fib level and the 2,550 level, which is also the kijun resistance level. Looking at the CVD margin data, there is a very high rate of short transactions. Liquidation blocks in the 2,613 – 2,626 areas have accumulated. In the light of this data, with the gain of the 2,550 level, an uptrend to 2,605 and then 2,669 levels may begin. However, in the case of closures below 2,467, the decline may continue and pullbacks may occur up to 2,381.
Supports 2,467 – 2,417 – 2,381
Resistances 2,550 – 2,605 – 2,669
LINK/USDT
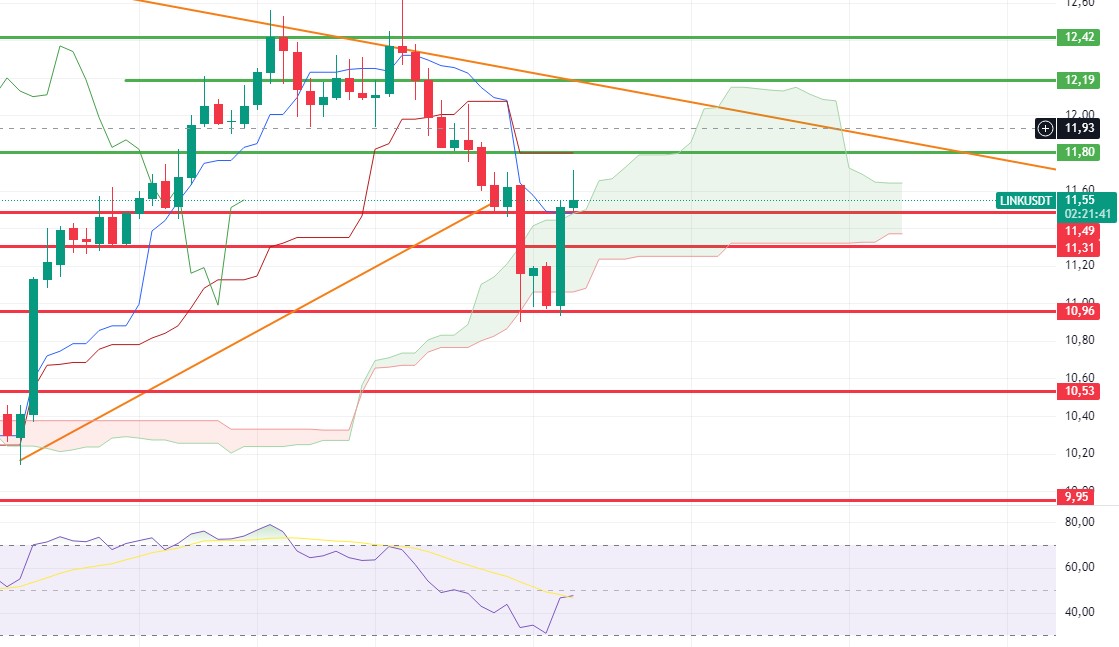
Reacting at 10.96, LINK looks quite bullish, especially as it surpassed 11.49 kijun and cloud resistance. As long as there are no closures below this level, an increase up to 11.80 Tenkan resistance can be expected. If it exceeds it, 12.19 trend resistance stands out as the main resistance level. A break of the 11.49 level with a possible decline in Bitcoin could pull the price back to 10.96 support.
Supports 11.49 – 11.31 – 10.96
Resistances 11.80 – 12.19 – 12.42
SOL/USDT
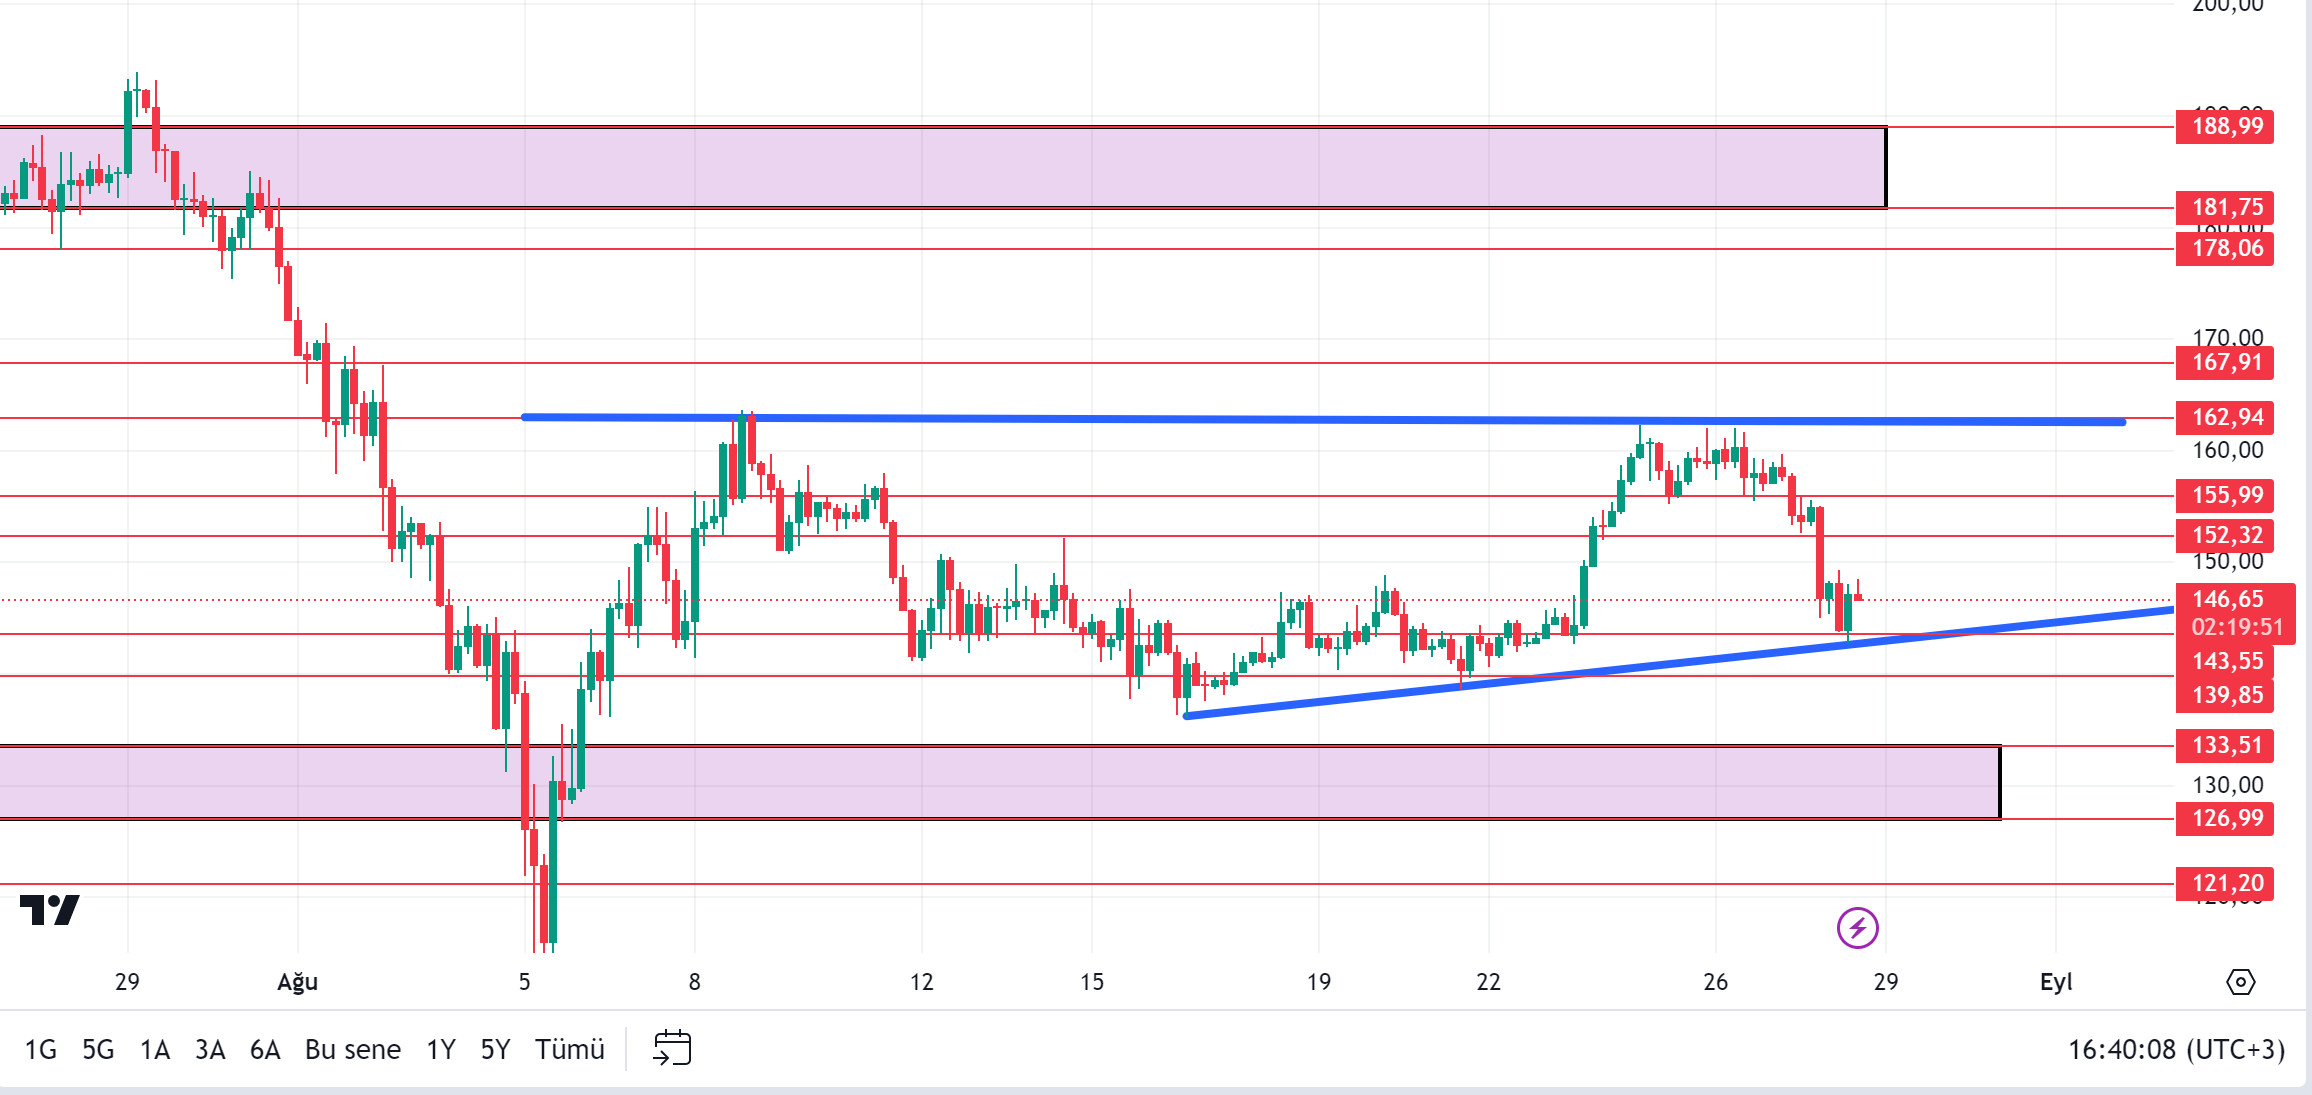
Since our analysis in the morning, news has spread that a major centralized exchange has closed the accounts of users in Palestine. This news caused a drop in cryptocurrencies. Later, an official from the central exchange announced that this was a fabrication. After this statement, the market recovered slightly. When we look at the chart, it received support at the bottom of the rising triangle formation. If it continues to hold from here, the rise may continue and test the resistance levels of 152.32 – 155.99. If the BTC-induced decline continues, the rising triangle pattern may break support and sales pressure may increase. In this scenario, 143.55 – 139.85 supports should be followed. If the market moves in the opposite direction
Supports: 143.55 – 139.85 – 133.51
Resistances 152.32 – 155.99 – 162.94
ADA/USDT
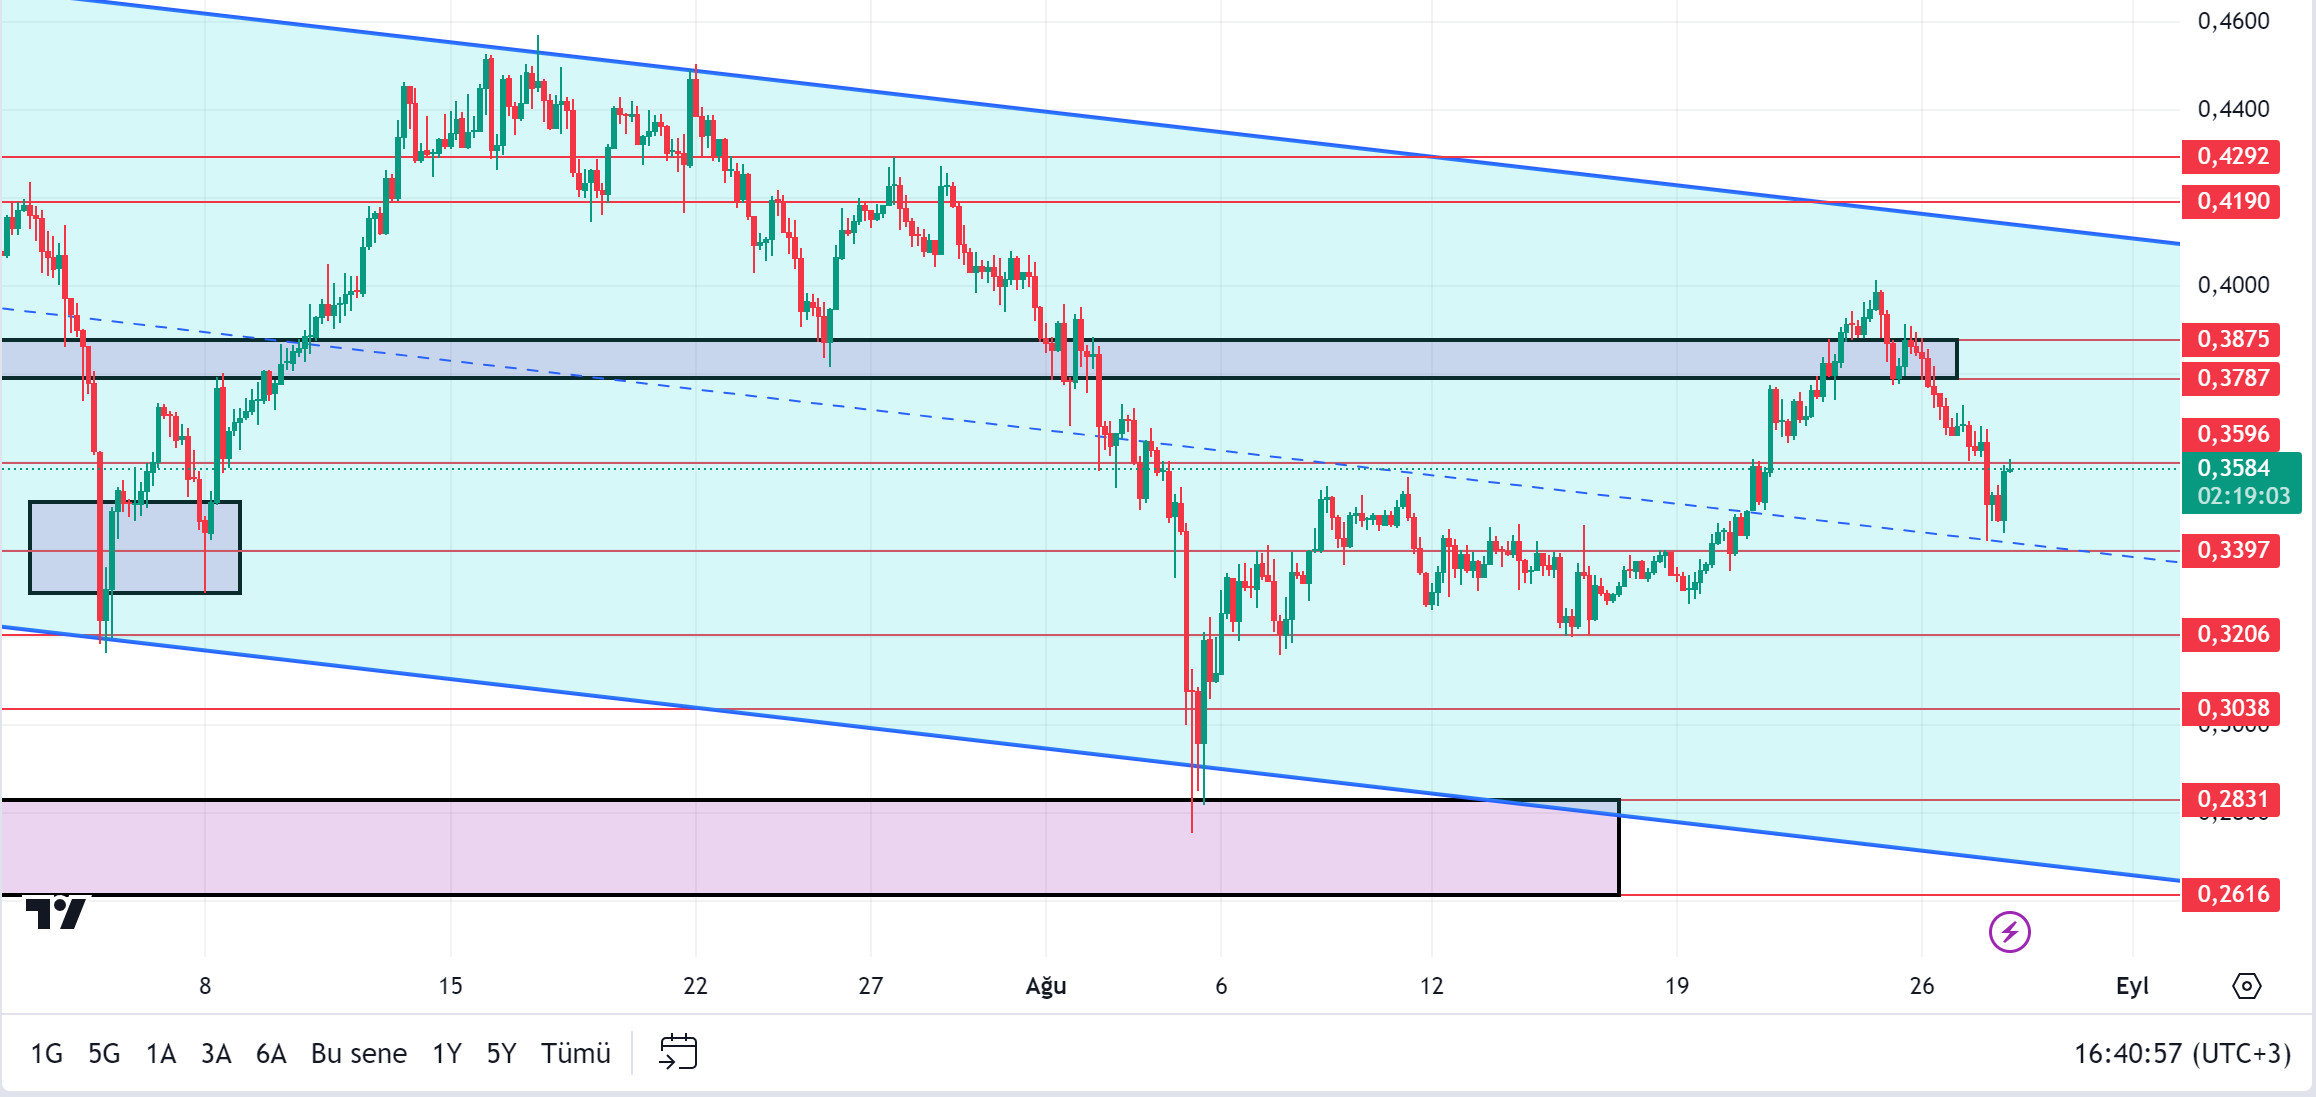
Cardano price is at an important resistance level. It found support in the middle of the falling channel. This can be attributed to whale activity and the continued increase in daily active addresses. Cardano saw an increase in the number of whale transactions on August 27. Assuming that the Chand Hard Fork is now very close, it is very likely that there will be a corresponding rise. ADA is priced at 0.3584, supported by the middle level of the descending channel. In general, it would not be wrong to say that the rise will be strong based on the fact that the market is at the recovery level. As the rise continues, 0.3787 – 0.3875 levels can be followed as resistance levels. In the scenario where investors anticipate BTC’s selling pressure to continue, albeit short-term, if it continues to be priced in the descending channel, 0.3596 – 0.3397 levels can be followed as support.
Supports 0.3397 – 0.3206 – 0.3038
Resistances 0.3787 – 0.3875 – 0.4190
AVAX/USDT
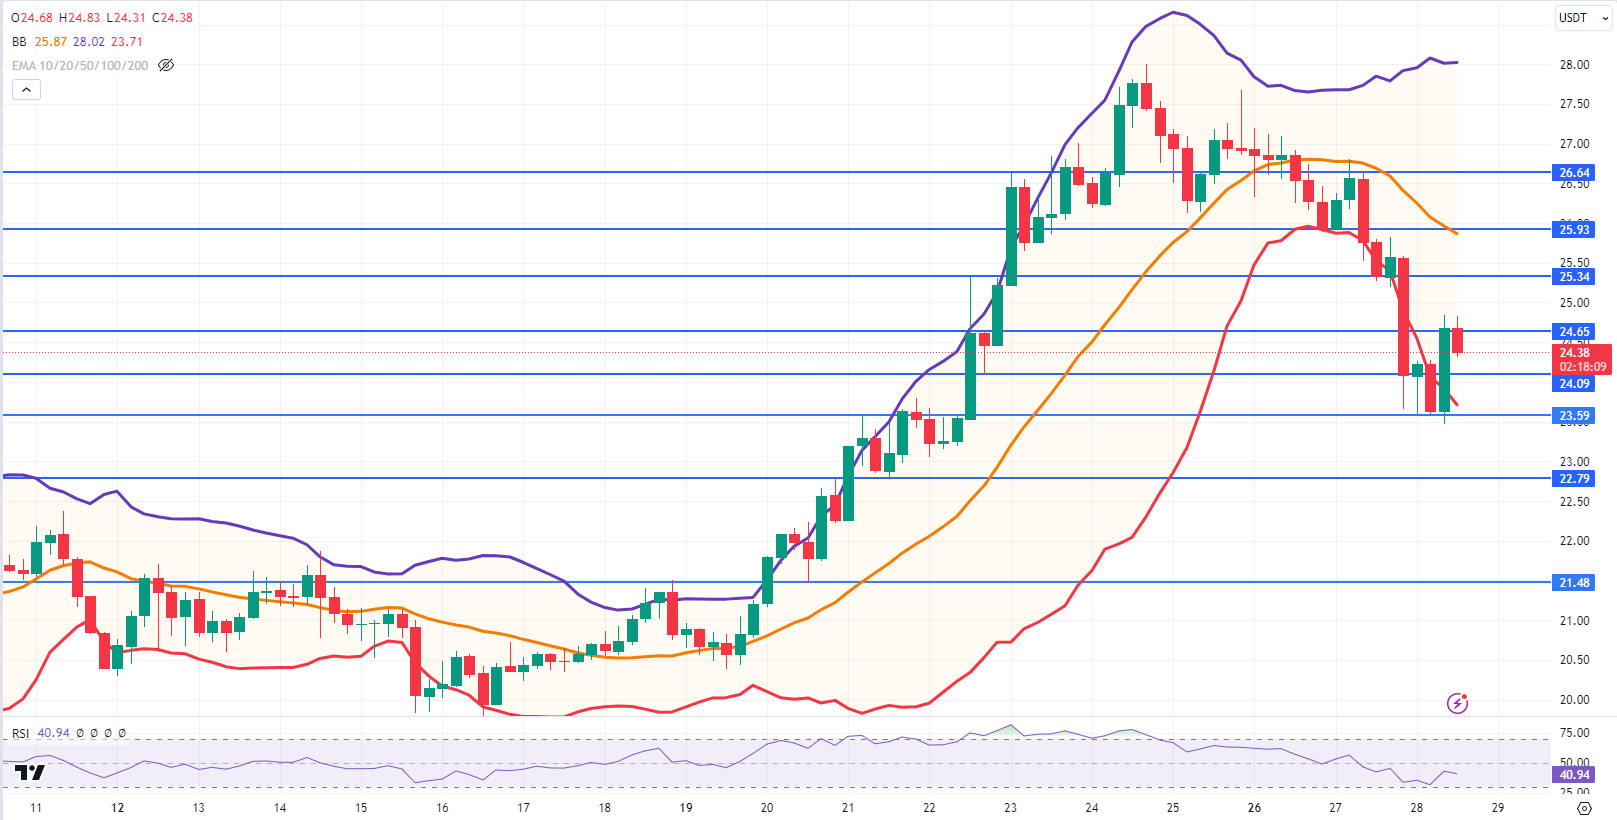
It started the day at 24.08 and rose to 24.84 on the news that Hong Kong approved AVAX after Bitcoin and Ethereum for retail investors to trade. It is currently trading at 24.38. With the reaction from the Bollinger lower band, it moves towards the middle band and tries to break the 24.65 resistance on the 4-hour chart. It may want to break this resistance and try to continue its movement towards the middle and upper band. In such a case, it may test the 25.34 and 25.93 resistances. In this process, if it cannot break the 24.65 resistance and sales pressure comes, it may retreat to 23.59 support.
Supports 24.09 – 23.59 – 22.79
Resistances 24.65 – 25.34 – 25.93
TRX/USDT
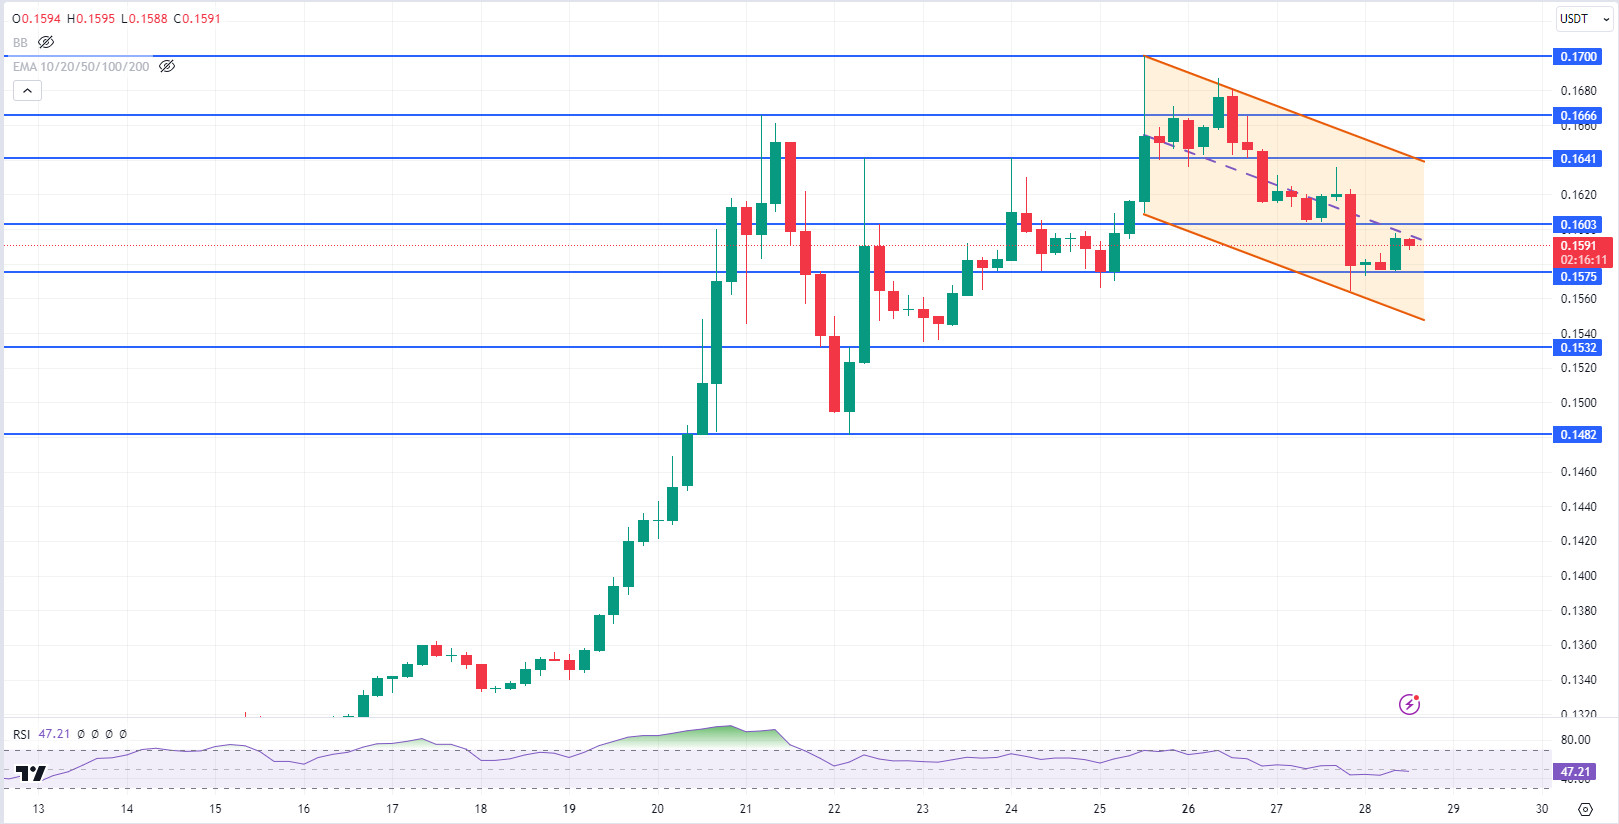
TRX, which opened the day at 0.1580, rose about 1% during the day and is currently trading at 0.1591. TRX, which moves in a minor falling channel, is in the middle band of the channel. If it breaks the middle band upwards, it may rise to the upper band. In such a case, it may test the 0.1603 and 0.1641 resistances. If it fails to break the middle band and experiences a pullback, a reaction from the lower band can be expected. In such a pullback, it may test the supports of 0.1575 and 0.1532.
Supports: 0.1575 – 0.1532 – 0.1482
Resistances 0.1603 – 0.1641 – 0.1666
XRP/USDT
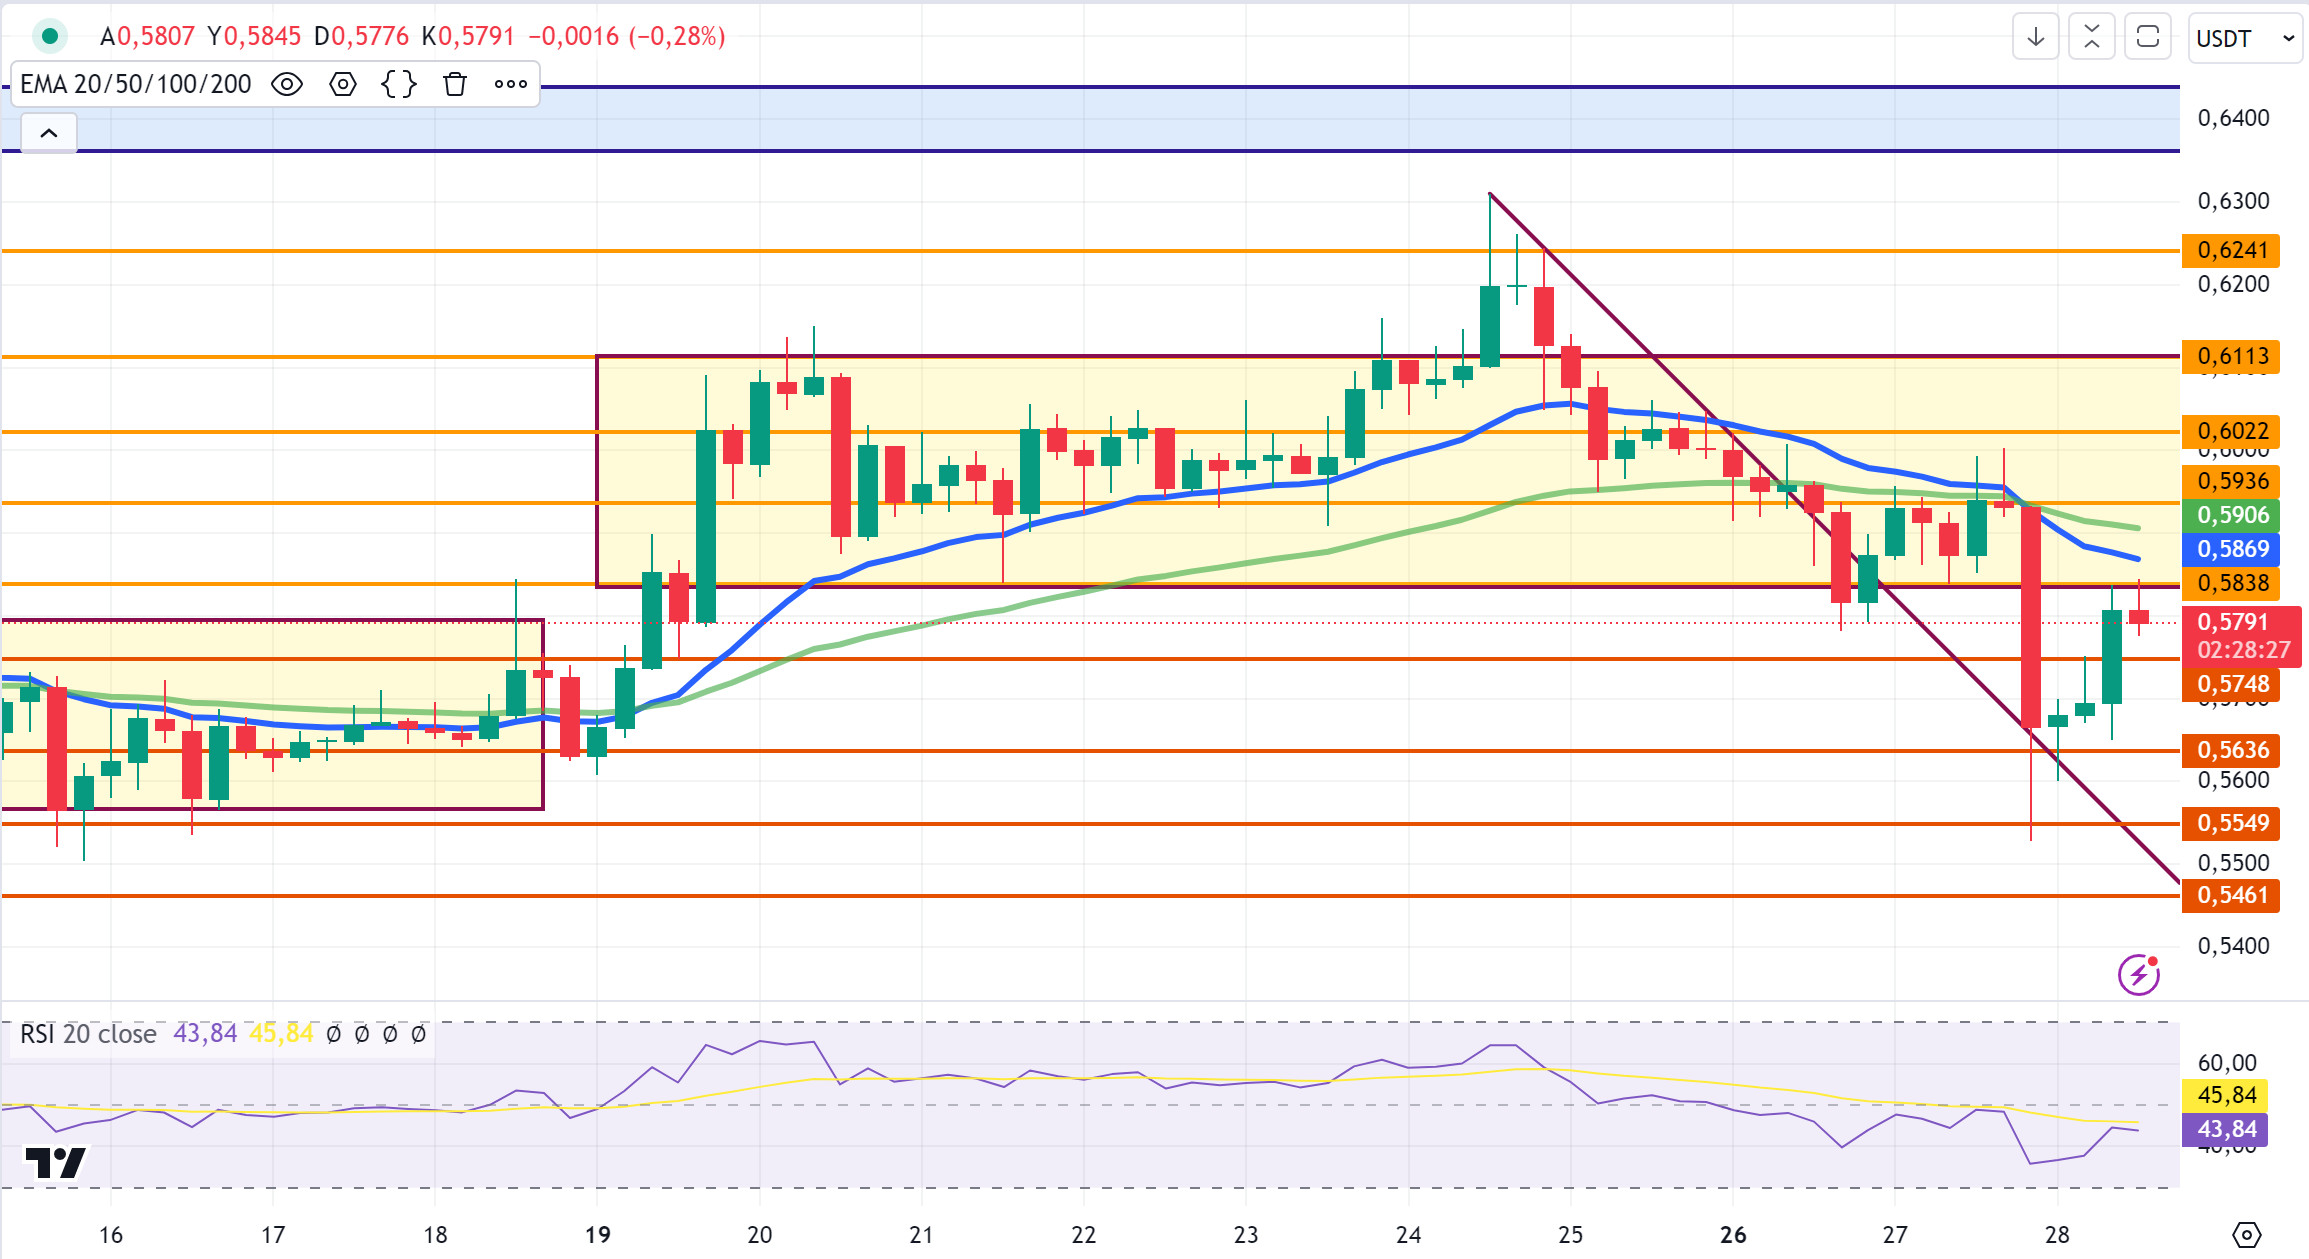
XRP, which started today with a rise after yesterday’s sharp decline, rose to 0.5840 with a 3.2% increase in value and tested the 0.5838 resistance level. Unable to break the resistance level in question, XRP continues to trade at 0.5791 with the decline it experienced in the last candle in the 4-hour analysis.
In today’s analysis, XRP, which is in an uptrend, may test the resistance level of 0.5936 – 0.6022 resistance levels with a rise if it recovers after the decline in the last candle and retests the resistance level of 0.5838 and then breaks the resistance level in question. Otherwise, if the decline deepens, it may test the support levels of 0.5748 – 0.5636 – 0.5549.
Supports 0.5748 – 0.5636 – 0.5549
Resistances 0.5838 – 0.5936 – 0.6022
DOGE/USDT
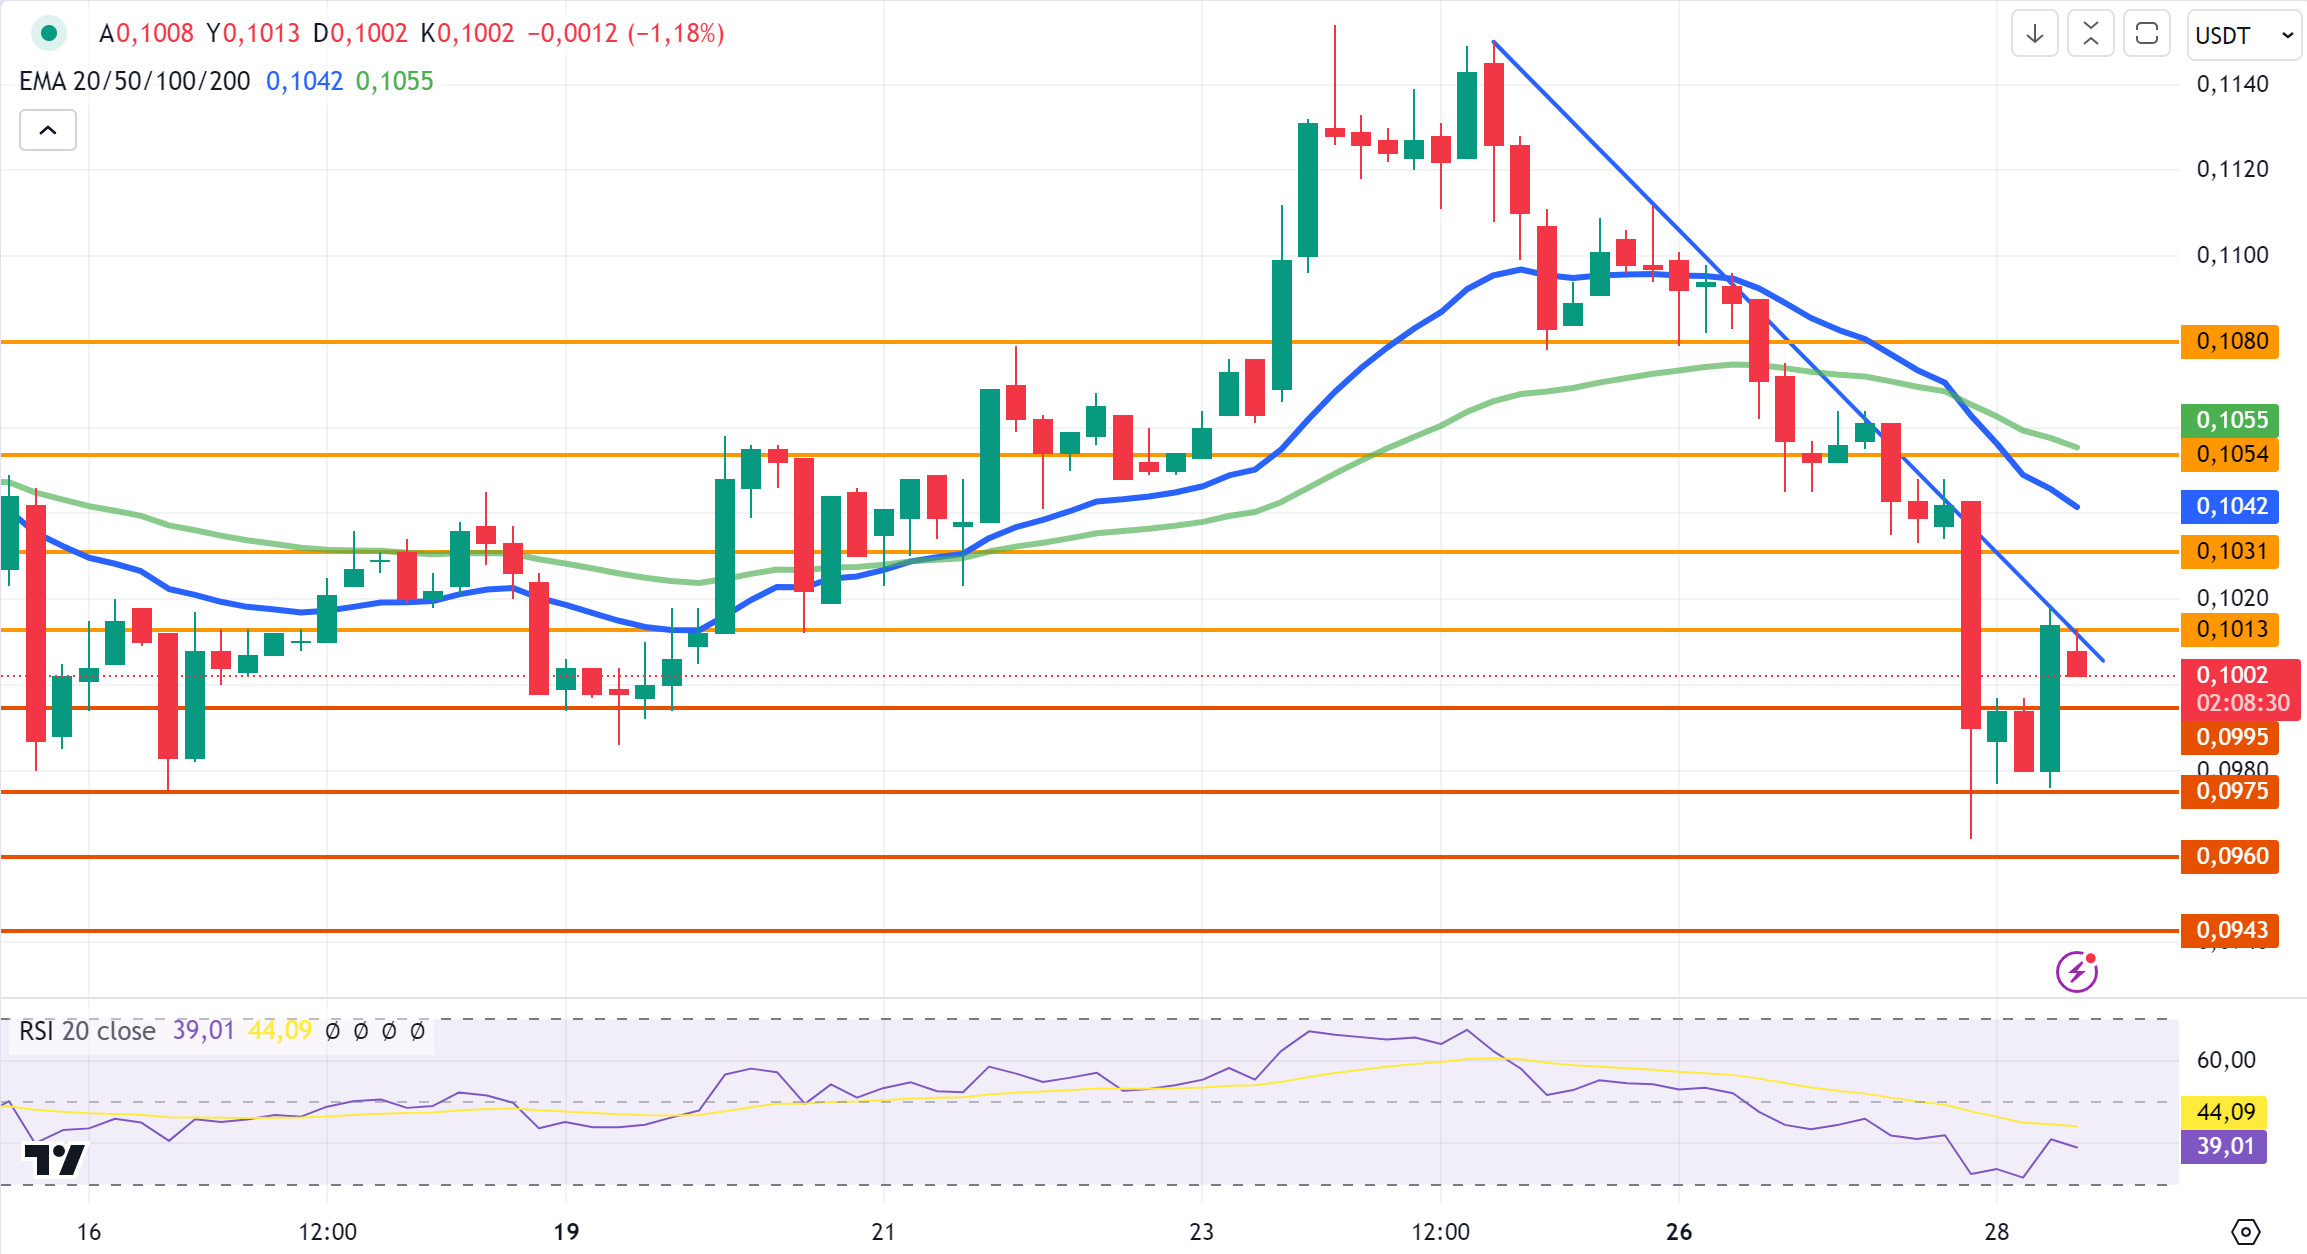
DOGE, which was affected by the sharp decline in the crypto market yesterday, started today at 0.0988, then started to rise and continues to trade at 0.1002 with a value increase of 1.25%.
In the 4-hour analysis, DOGE, which tested the resistance level of 0.1013, declined in the last candle after the reaction here. If the decline continues, DOGE may test the support levels of 0.0995-0.0975-0.0960. If the recovery after the decline in the last candle and the rise on a daily basis continues, it may test the resistance levels of 0.1013-0.1031-0.1054.
Supports 0.0995 – 0.0975 – 0.0960
Resistances 0.1013 – 0.1031 – 0.1054
DOT/USDT
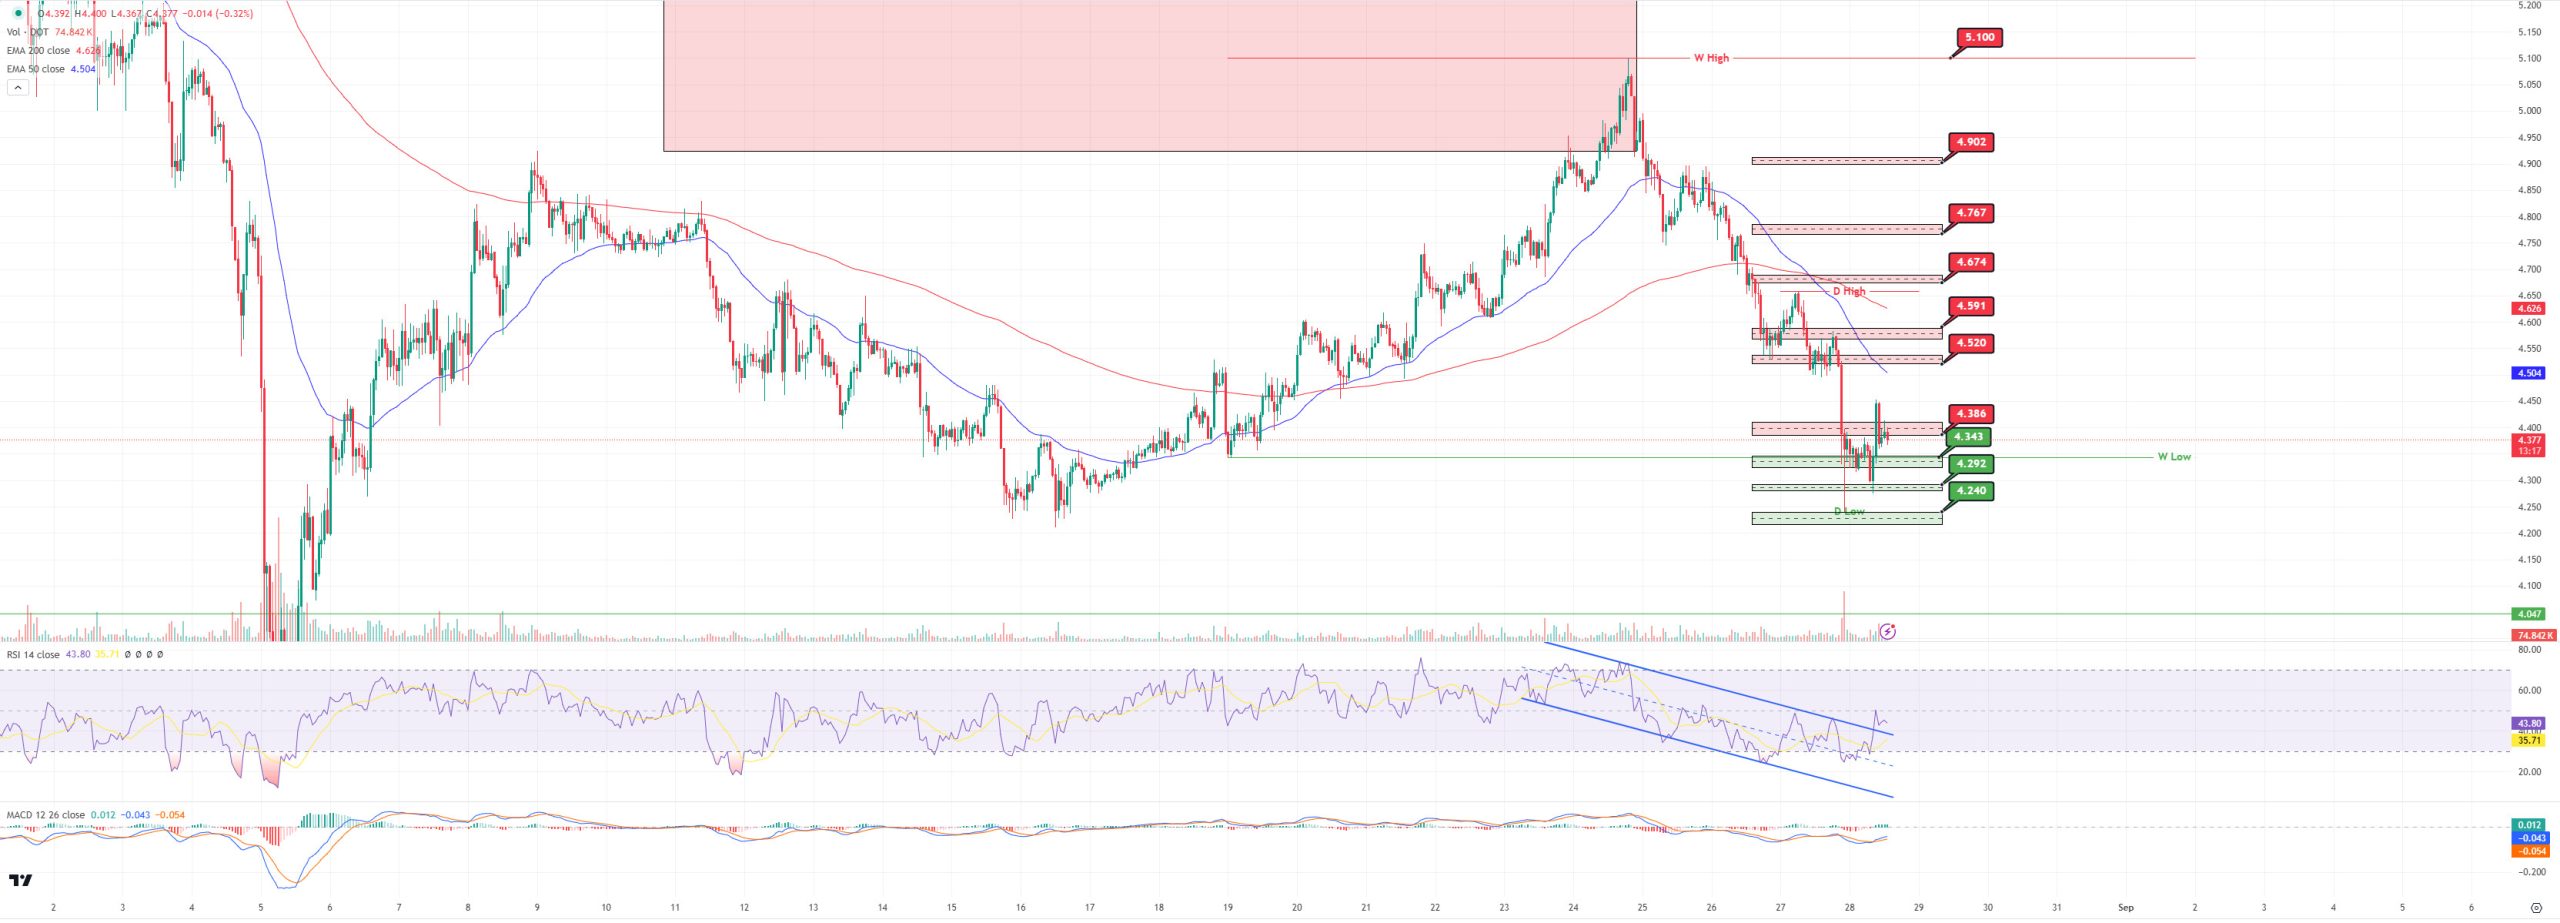
“Polkadot (DOT) retreated to 4,292 with increased selling pressure and broke the 4,386 level with a momentary rise. DOT, which retreated afterwards, is currently at 4.386 resistance. After the RSI breaks the upper band in the falling channel, the price may rise towards the next resistance level of 4,520. Unless the price is permanent above 4,386, it may retreat towards 4,343 and 4,292 levels respectively.
(Blue line: EMA50, Red line: EMA200)
Supports 4.343 – 4.292 – 4.240
Resistances 4.520 – 4.386 – 4.591 – 4.674 – 4.767 – 4.902 – 5.100
SHIB/USDT
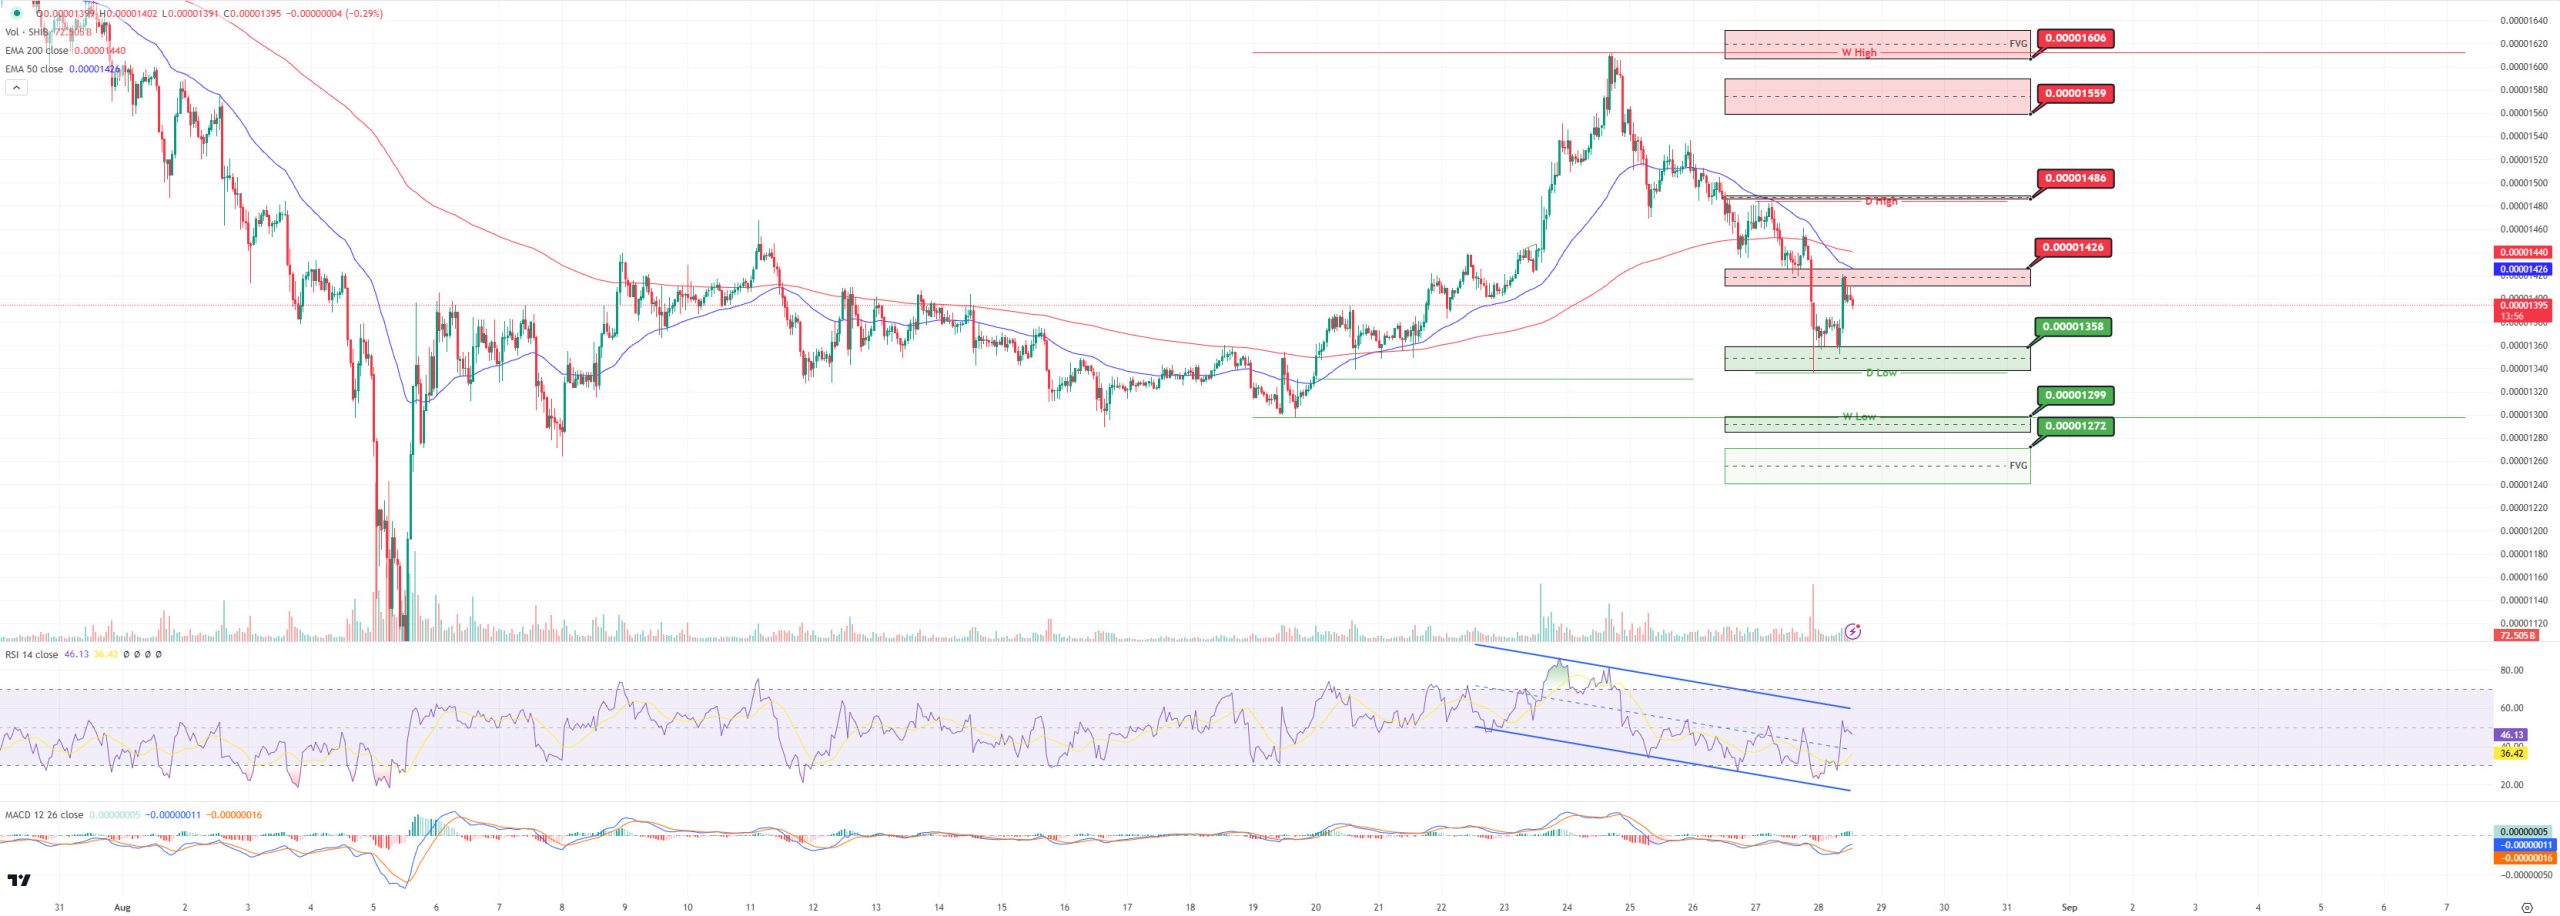
“We see that Shiba Inu (SHIB) has been rejected from 0.00001426 levels, our first resistance level, as the selling pressure on MACD decreased. When we examine the MACD currently, we can say that the buying pressure is decreasing. In the scenario where the buyer pressure decreases, the price may retreat to the first support level of 0.00001358. If the price does not get the expected reaction from the 0.00001358 level, it may retreat towards the next support level of 0.00001299. In a positive scenario, if the price stays above 0.00001426, it may move towards the next resistance level of 0.00001486.
(Blue line: EMA50, Red line: EMA200)
Supports 0.00001358 – 0.00001299 – 0.00001272
Resistances 0.00001486 – 0.00001559 – 0.00001606 – 0.001678
LEGAL NOTICE
The investment information, comments and recommendations contained herein do not constitute investment advice. Investment advisory services are provided individually by authorized institutions taking into account the risk and return preferences of individuals. The comments and recommendations contained herein are of a general nature. These recommendations may not be suitable for your financial situation and risk and return preferences. Therefore, making an investment decision based solely on the information contained herein may not produce results in line with your expectations.

