
Technical Analysis
BTC/USDT
In the US, August CPI and core CPI were realized as 2.9% and 3.1%, respectively; monthly increases were 0.4% and 0.3%, respectively. Whale Alert reported that two long dormant Bitcoin wallets were reactivated; a total of 744 BTC was moved in the wallets. Japanese fashion brand ANAP received 29.58 BTC, bringing its reserve to 1,047.56 BTC. Glassnode data revealed that mid-sized wallets holding 100-1000 BTC accumulated 65,000 BTC in the last week, reaching a record high of 3,650,000 BTC.
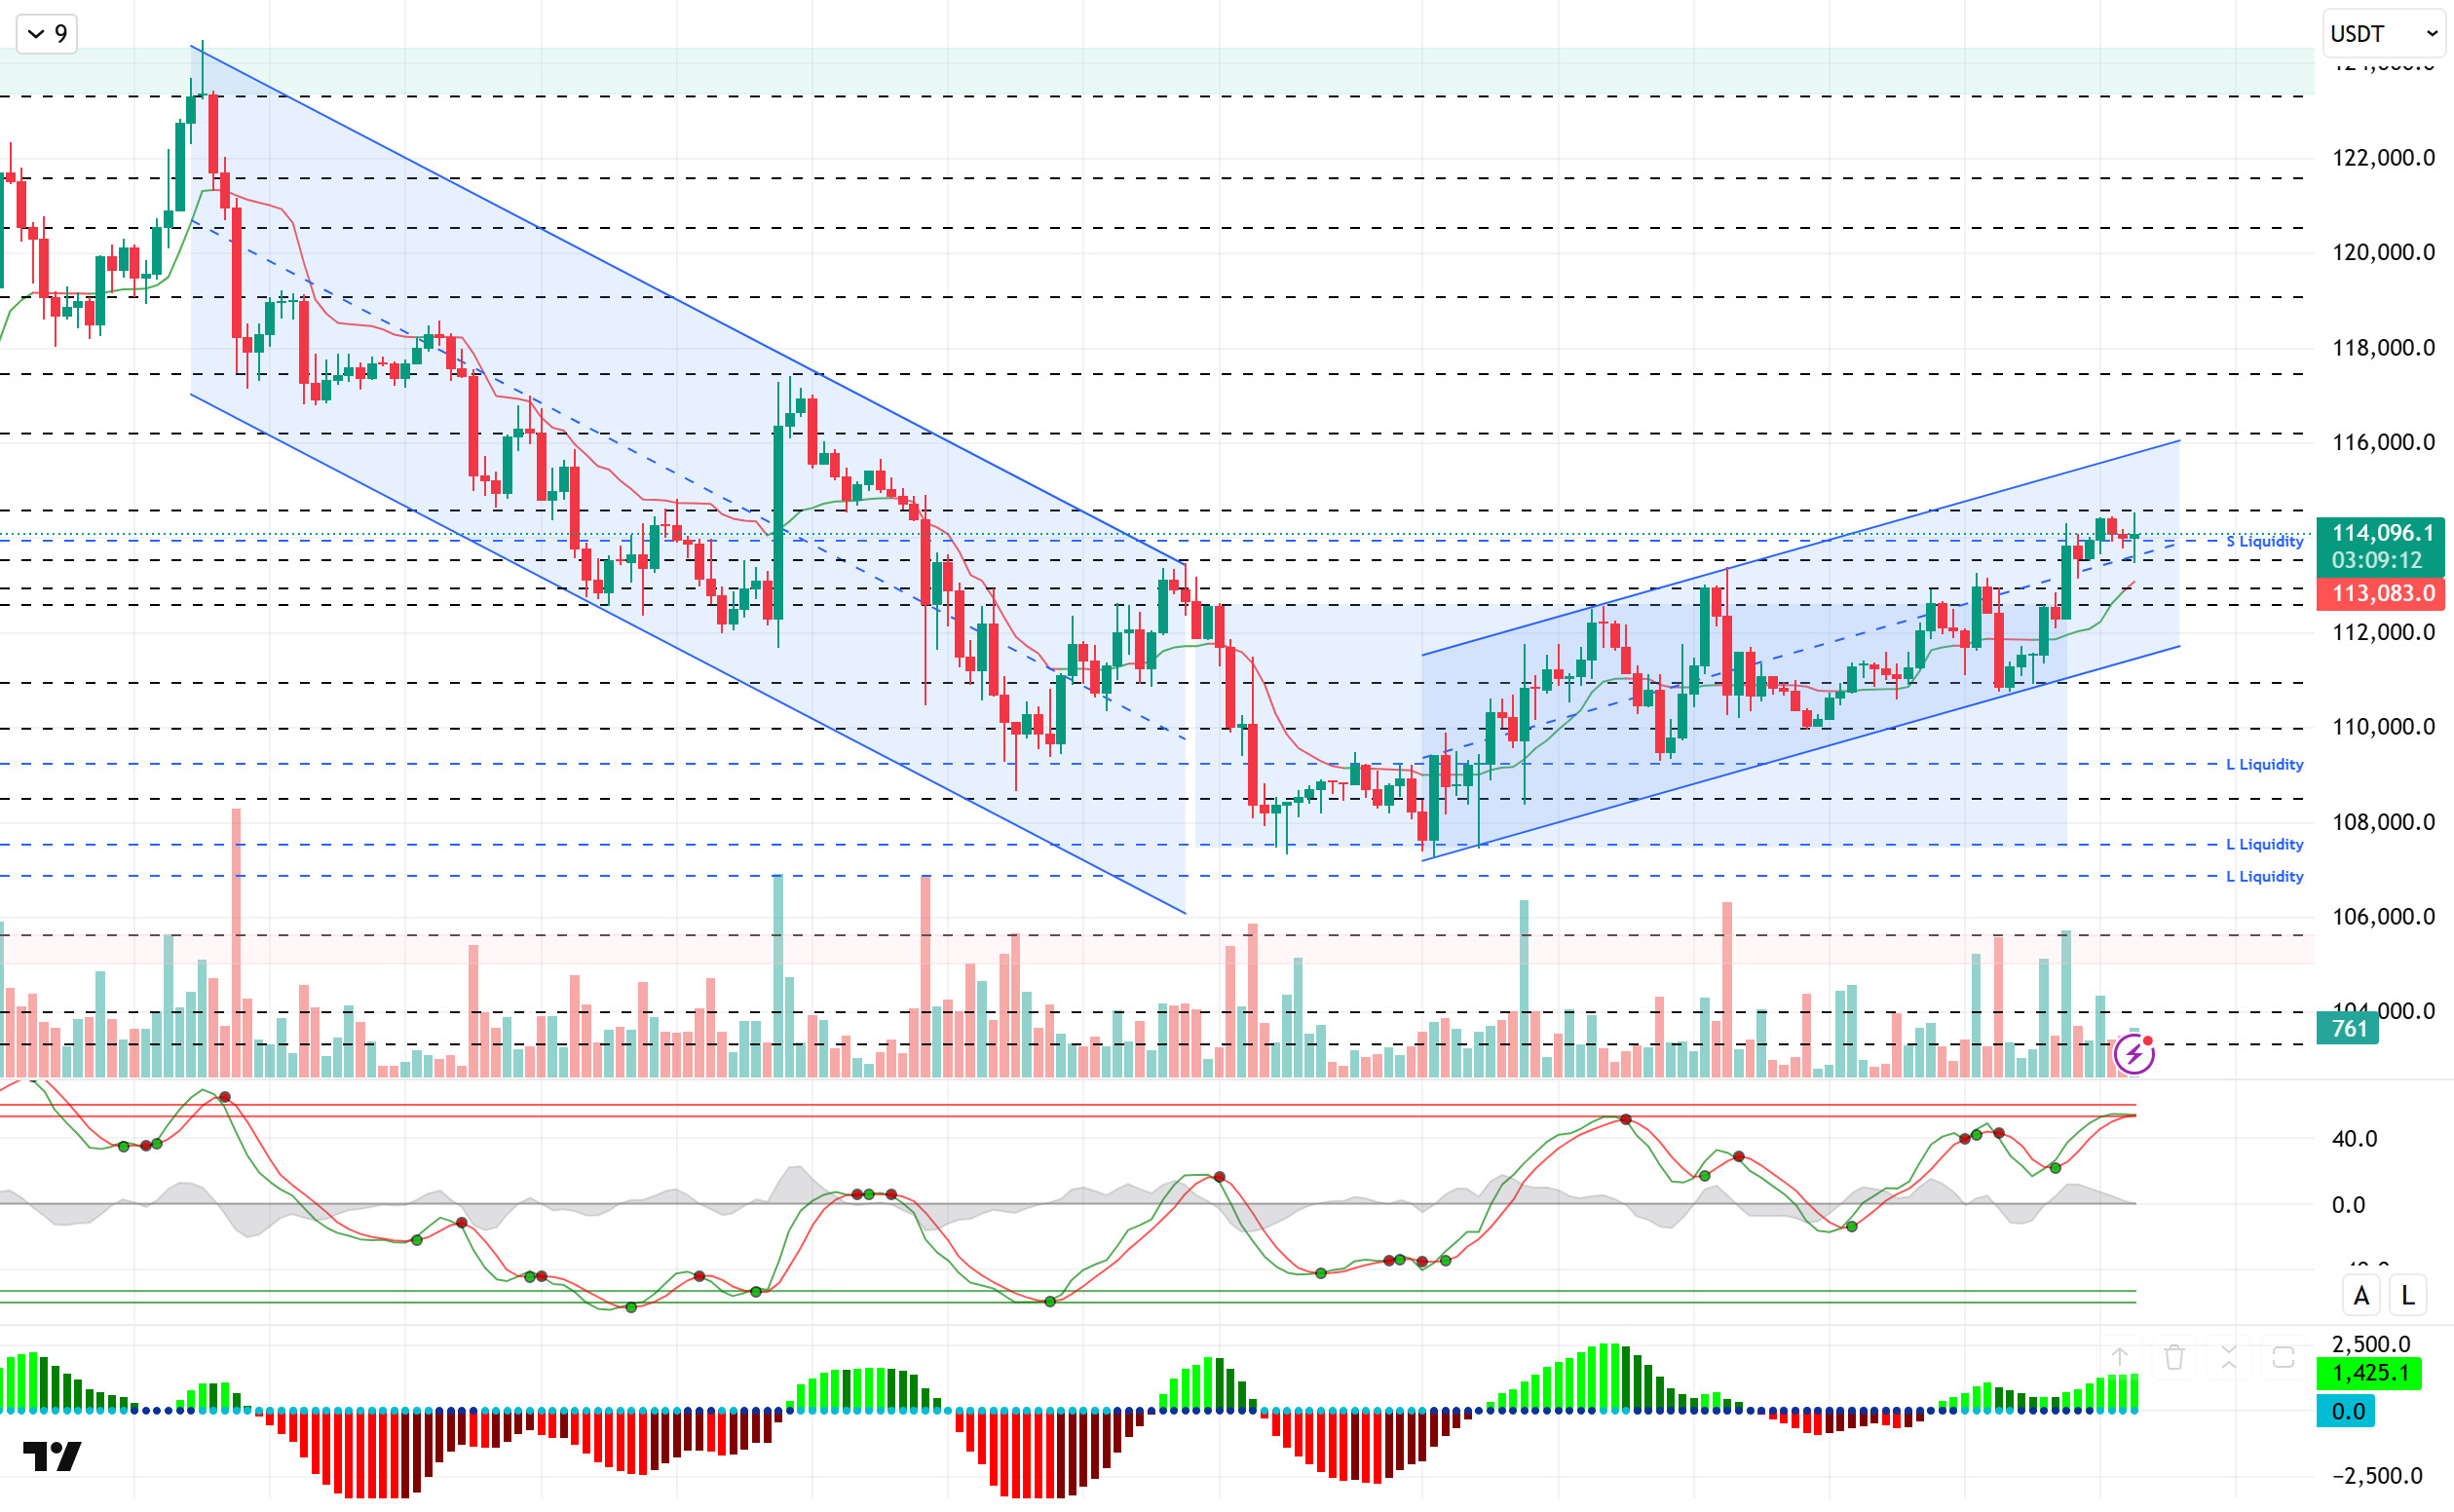
When we look at the technical outlook, BTC, which has been moving within the horizontal band range for a long time, has reached 114,300 levels by creating a minor bullish channel. With the increased volatility after the data, the price shot to 114,500. BTC, which then moved downwards, fell to 113,500 levels. At the time of writing, it continues to trade at 113,800.
Technical indicators came to the overbought zone once again, with the Wave Trend oscillator (WT) giving a buy signal, pointing to a trend reversal near the channel mid-band. The oscillator generating a sell signal in this region may signal a trend reversal. In the Squeeze Momentum (SM) indicator, while the histogram supports the rise by regaining momentum in the positive area, it is seen that the rising momentum is weakening. The Kaufman moving average is currently moving below the price at 113,000.
Looking at the liquidity data, short-term accumulating sell trades were liquidated at 113,200, while wider timeframe sell accumulation was liquidated above 114,000. With the recent rise, sell trades re-accumulated around 115,000. The buying tier, on the other hand, provides an intense accumulation at the 113,000 level in the short term, while the 108,000 – 109,000 band continues to be the accumulation zone in the long term.
In summary, although the loss of the optimistic mood in recent days with fundamental developments, the rate cut discussions among Fed members, the tariffs remaining on the agenda with the new distribution of duties and political tensions stand out as factors that put pressure on the price, US PPI data causes an increase in risk appetite, while the TFP data supports the Fed’s moderate approach. Following the favorable ground created by the technical structure, the price completed the consolidation within the horizontal band range for a long time and came to the 114,000 target zone with the minor bullish channel. When we look at the liquidity data, while selling transactions were liquidated, buying transactions gained weight and confirmed the rise. In order for the rise to be sustainable in the next period, we will follow the price to maintain the bullish channel it has formed. Closures above 112,600, which we follow as a reference area, are seen as critical for the continuation of the rise, while the minor support band 113,500 – 113,000 will be followed in a possible selling pressure.
Supports 114,000 – 113,500 – 112,600
Resistances 115,000 – 116,100 – 117,400
ETH/USDT
According to on-chain data, Virtuals Protocol exchanged 2,880 ETH for 110.16 cbBTC, bringing its quarterly returns to 58.3%. Lookonchain reported that a newly created wallet received 18,514 ETH on FalconX.
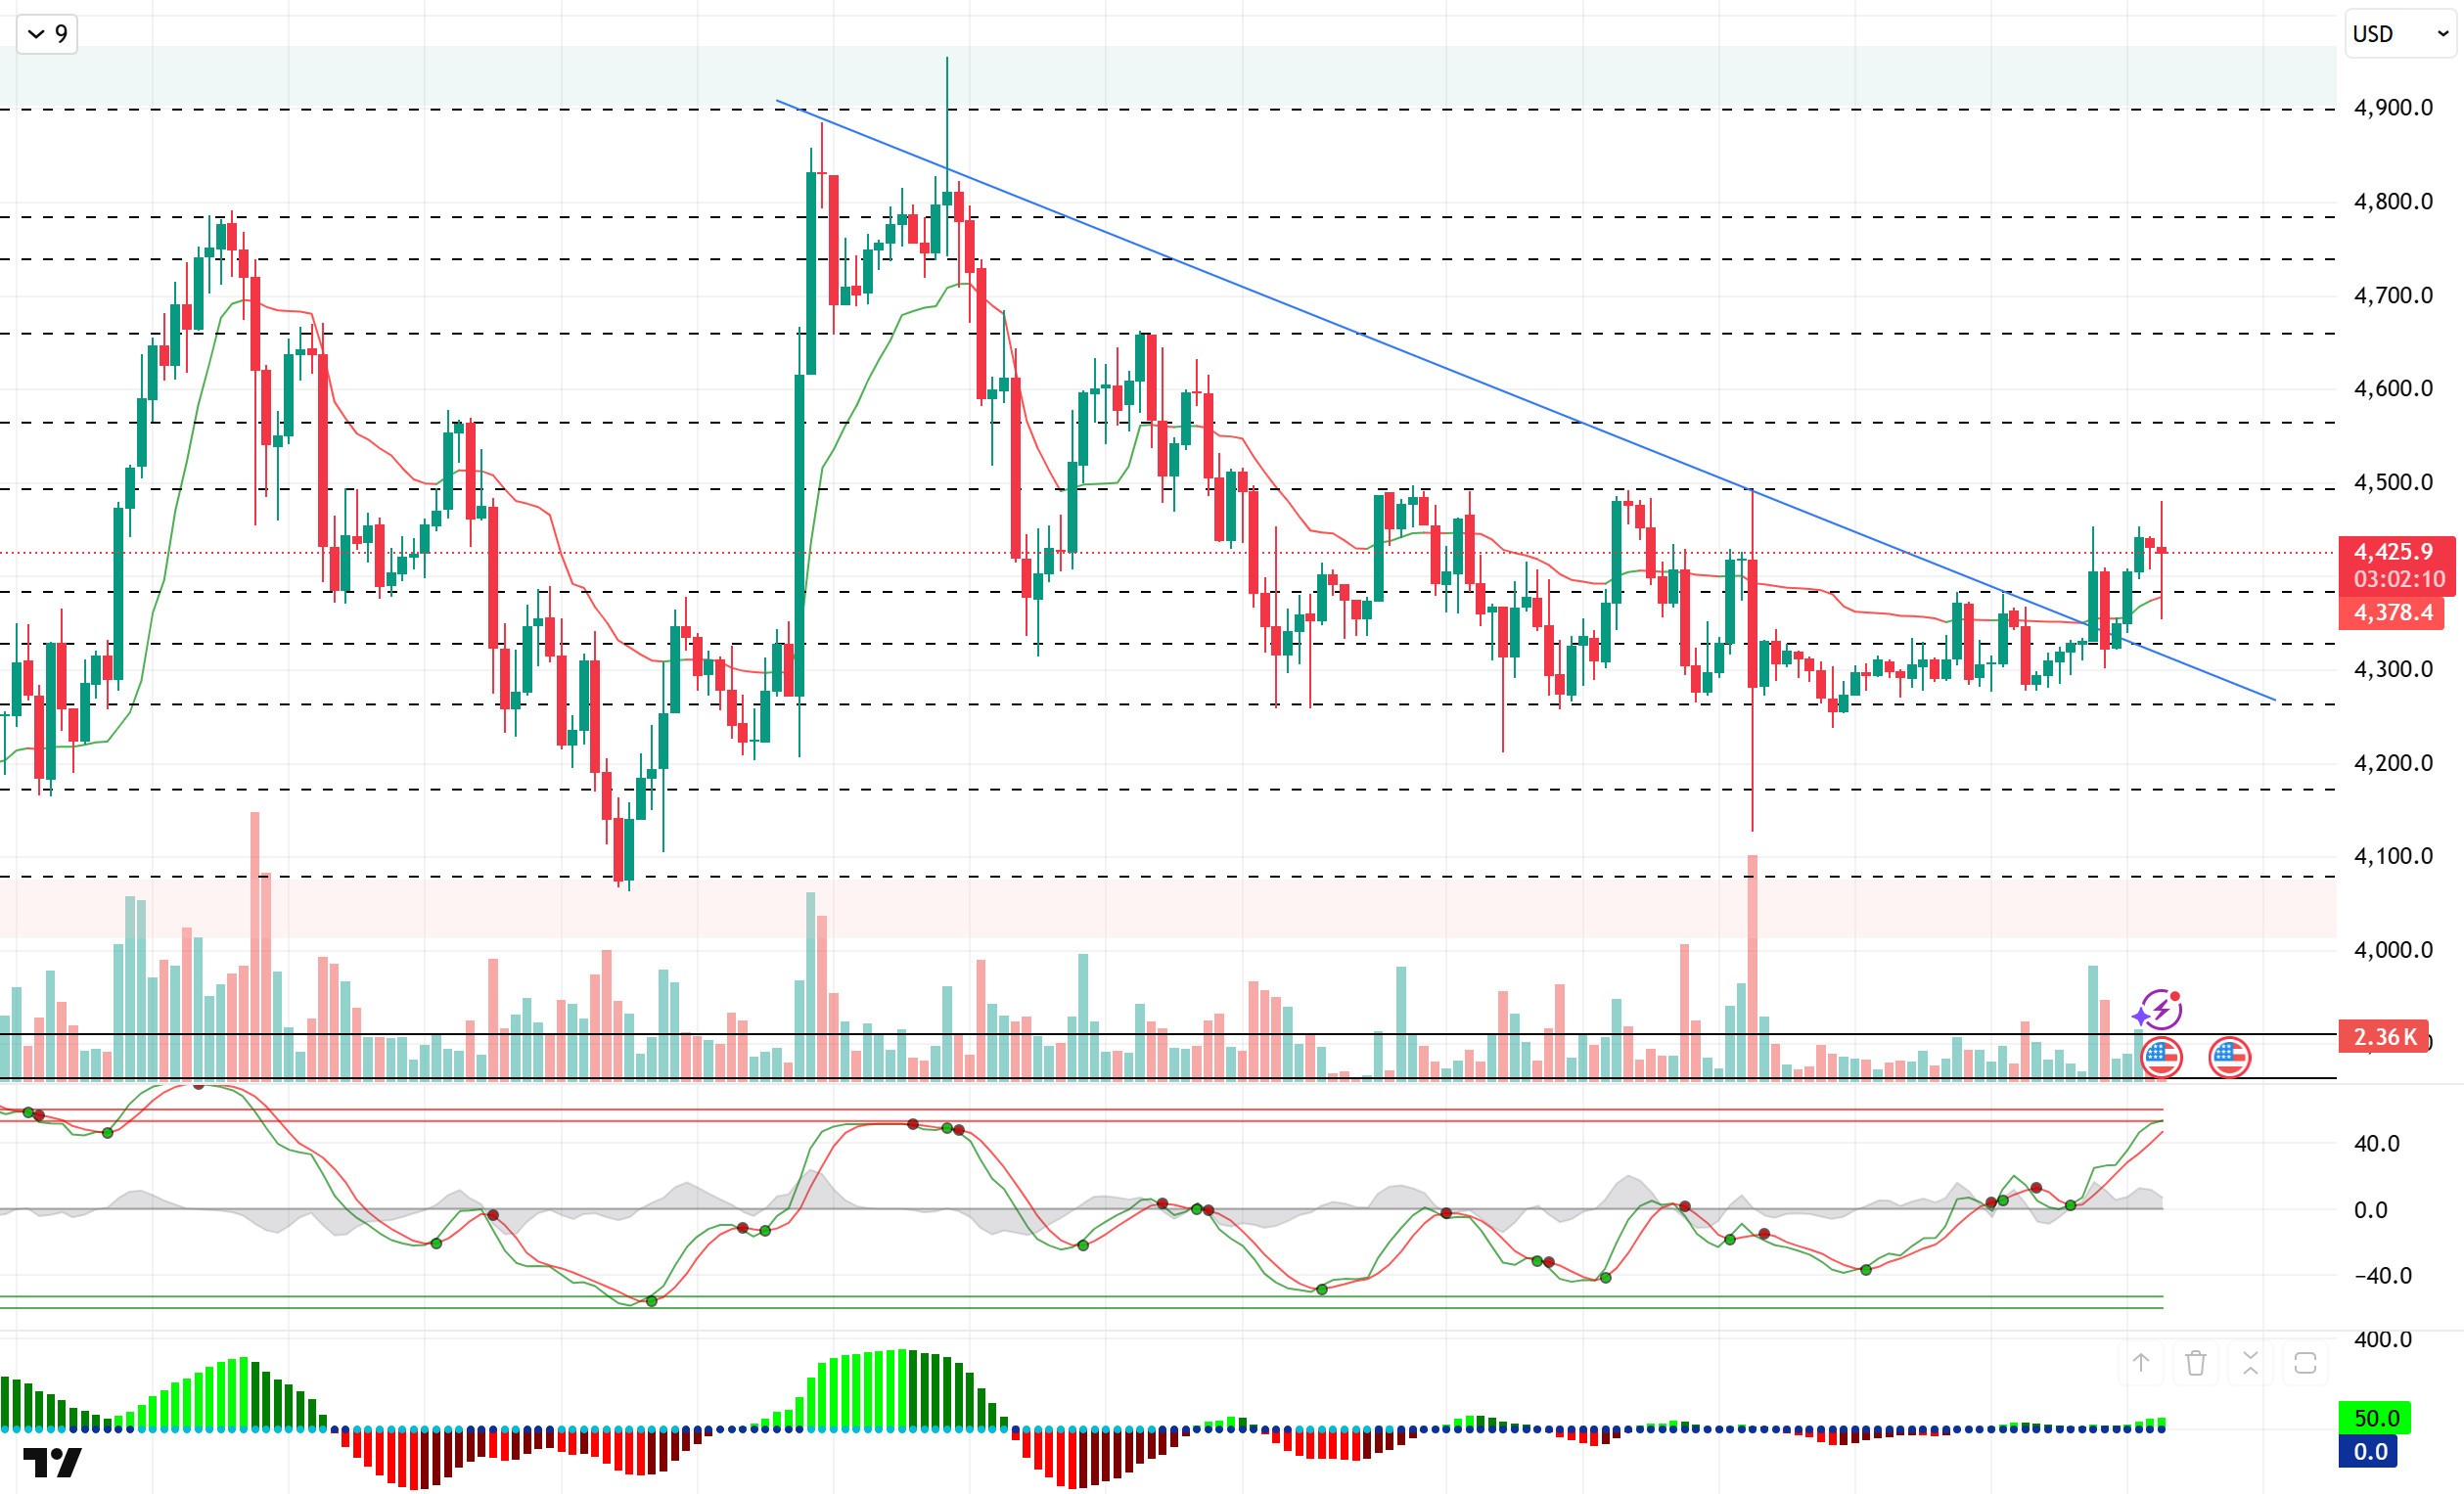
Looking at the technical outlook, ETH exceeded the falling trend structure in the previous analysis and settled above the 4,400 level. ETH, which experienced a sharp retreat after the macro data released, fell to 4,350 levels. The price, which then recovered again, continues to be traded at 4,430 at the time of writing the analysis.
Technical indicators, the Wave Trend oscillator (WT) has turned back to the overbought zone, leaving a buy signal after the weakening sell signal in the channel mid-band.In the Squeeze Momentum (SM) indicator, the histogram is trying to regain momentum in the positive area. The Kaufman moving average is currently moving below the price at 4.367.
Looking at the liquidity data, short and long term sell trades continue to be sparse, while buy trades have accumulated heavily at the 4,260 level with the recent rise.
In summary, ETH continues to move in parallel with the general developments in the market. When we look at the fundamental dynamics specific to ETH, it is seen that institutional interest continues as ETF inflows turn positive again. On the technical side, while the price’s recovery effort continues, the sparseness of selling transactions in Liquidity data draws attention, while the intensity of buying transactions is increasing. In this context, the effort to hold in this region will be followed in ETH, which came above the 4,400 level with the break of the falling trend structure. The momentum that may occur above this level may move the price to 4,490 and then to the 4,570 resistance zone. On the other hand, in case of a break of 4,385 in possible pullbacks, 4,330 will be followed as a support area. If this support is broken, the falling trend structure may deepen further, causing the price to fall to the liquidity area of 4,260.
Supports 4,385 – 4,330 – 4,260
Resistances 4,490 – 4,570 – 4,650
XRP/USDT
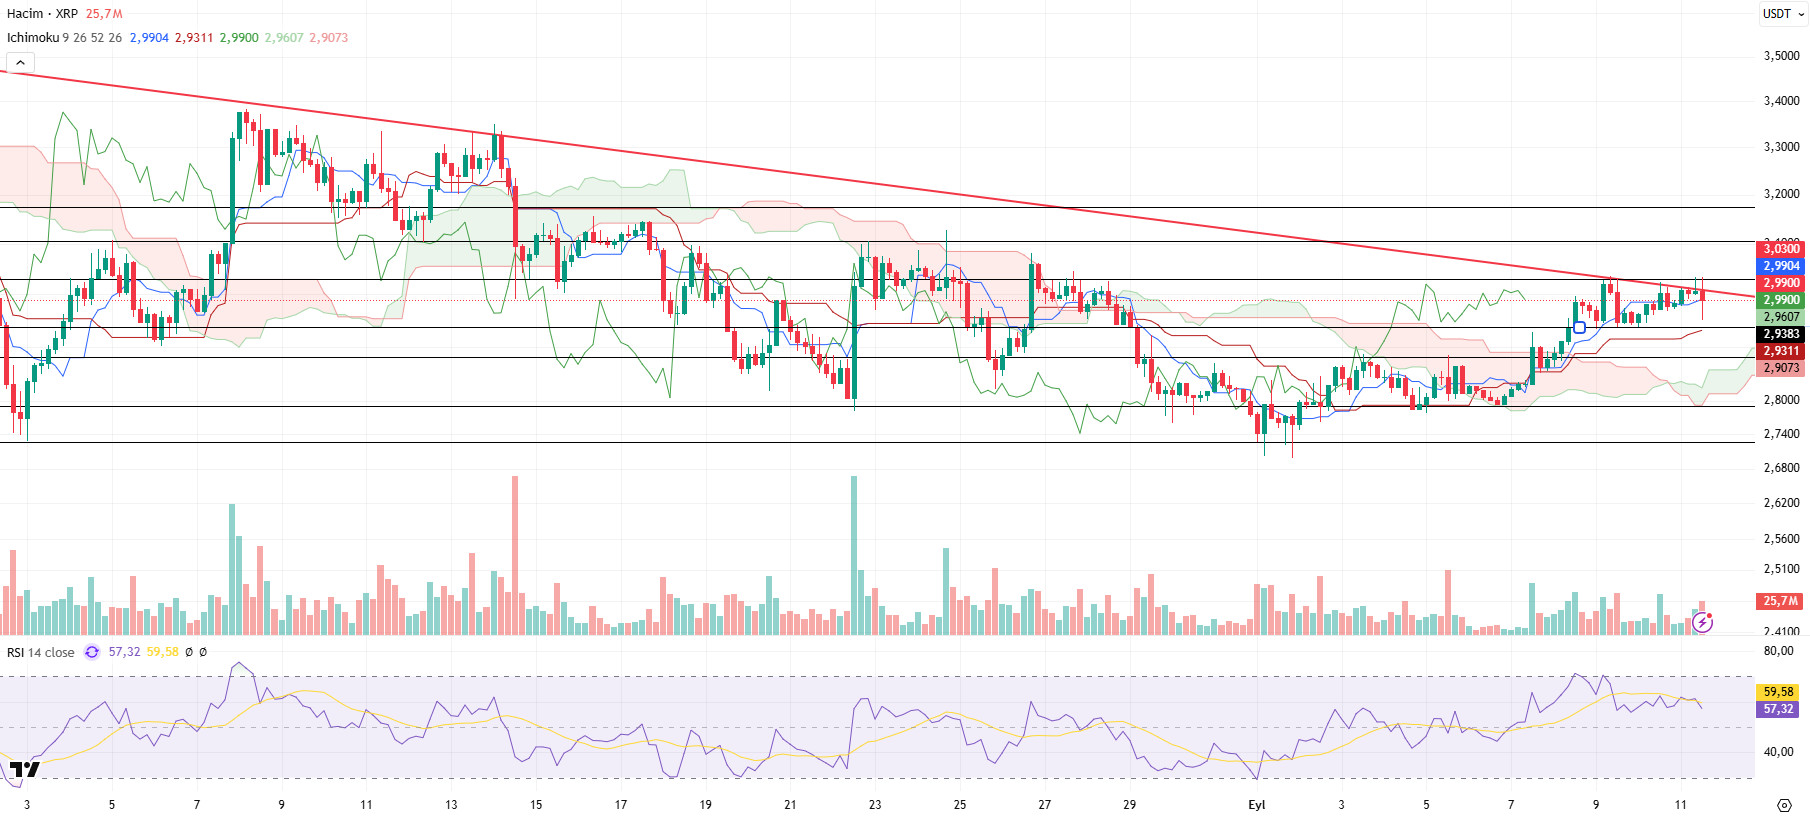
From a technical point of view, XRP fell to the level of $ 2.7270 with the recent pullbacks and regained bullish momentum with the support it received from this level. With this move, XRP recovered to the downtrend zone.
Yesterday, while the markets recorded a positive momentum with the effect of the news flows on the fundamental side, XRP/USDT strengthened its uptrend, which is currently above the Ichimoku indicators, with the support it received from the $ 2.9383 level and managed to rise to the downtrend. The fact that XRP maintains this momentum and persists above the downtrend indicates that the price may accelerate and continue its upward trend.
Today, in line with our expectations, the positive accelerations in the XRP price continued and our first target level of $3.0300 was realized. In addition, the annual inflation data released from the US came in line with expectations, creating some selling pressure in the markets. As a result of this selling wave, XRP fell to the middle band of the rising channel, but recovered from this level.
When technical indicators are analyzed for XRP, which is currently trading at $ 2.9900, the Relative Strength Index (RSI) has fallen below the average with the recent pullbacks, falling to 55 and turning its direction down.
Within the framework of the current outlook, if the selling pressure continues, it is expected to test the support level of $ 2.9383 in the first place. If this level is broken, the price is likely to head towards $2.8800 and $2.7900, respectively. On the other hand, if the buying appetite strengthens, the price is likely to rise to the $3.0300 resistance level again. If this level is broken upwards, the $3.1050 and $3.1750 levels stand out as critical follow-up zones.
Supports: 2,9383 – 2,8800 – 2,7900
Resistances 3,0300 – 3,1050 – 3,1750
SOL/USDT
Forward Industries completed a $1.65B fundraising to purchase Solana tokens.
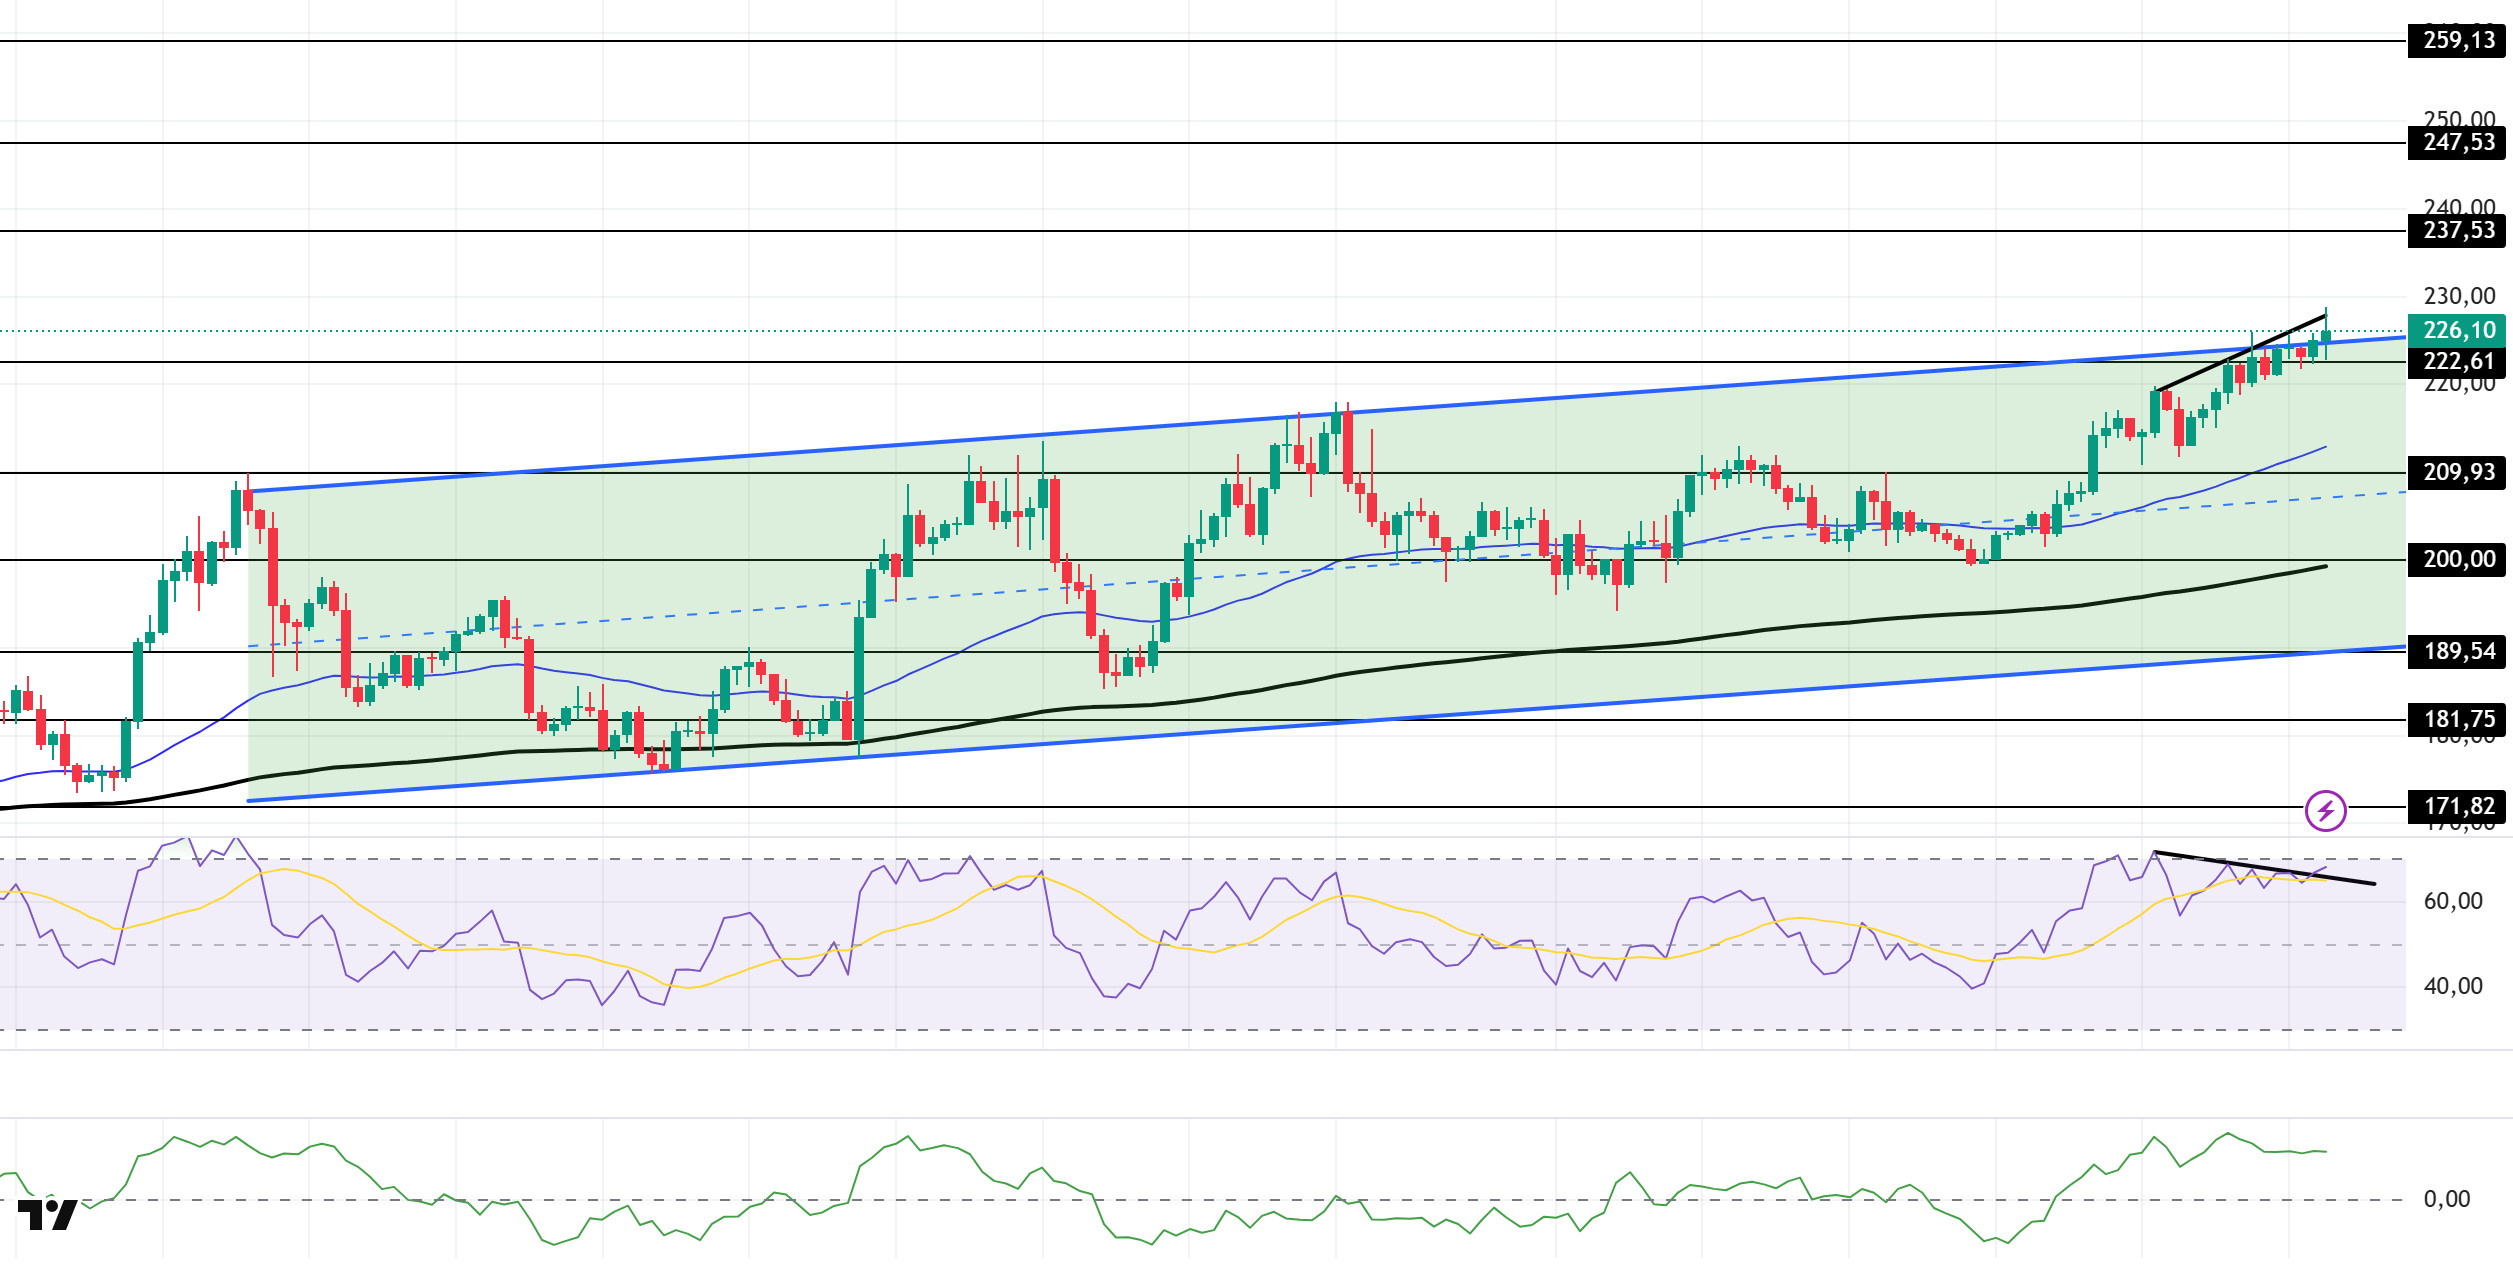
SOL price was slightly higher during the day. The asset broke the uptrend that started on August 14th to the upside. The $237.53 level may be triggered when the price, which tested the ceiling level of the uptrend pattern, breaks this level. In retracements, the 50 EMA (Exponential Moving Average – Blue Line) moving average can be followed.
On the 4-hour chart, it continued to be above the 50 EMA (Exponential Moving Average – Blue Line) and the 200 EMA (Black Line). This suggests that the uptrend may continue in the medium term. At the same time, the fact that the price is above both moving averages suggests that the market is bullish in the short term. Chaikin Money Flow (CMF-20) continued to be in positive territory. However, an increase in inflows may keep CMF above the positive zone. Relative Strength Index (RSI-14) continued to be in positive territory. However, there is a negative divergence. This could trigger profit selling and a pullback. The $237.53 level stands out as a strong resistance point in case of an uptrend on the back of macroeconomic data or positive news on the Solana ecosystem. If this level is broken upwards, the rise can be expected to continue. If there are pullbacks due to contrary developments or profit realizations, the $ 209.93 level can be tested. In case of a decline to these support levels, the increase in buying momentum may offer a potential bullish opportunity.
Supports 222.61 – 209.93 – 200.00
Resistances 237.53 – 247.53 – 259.13
DOGE/USDT
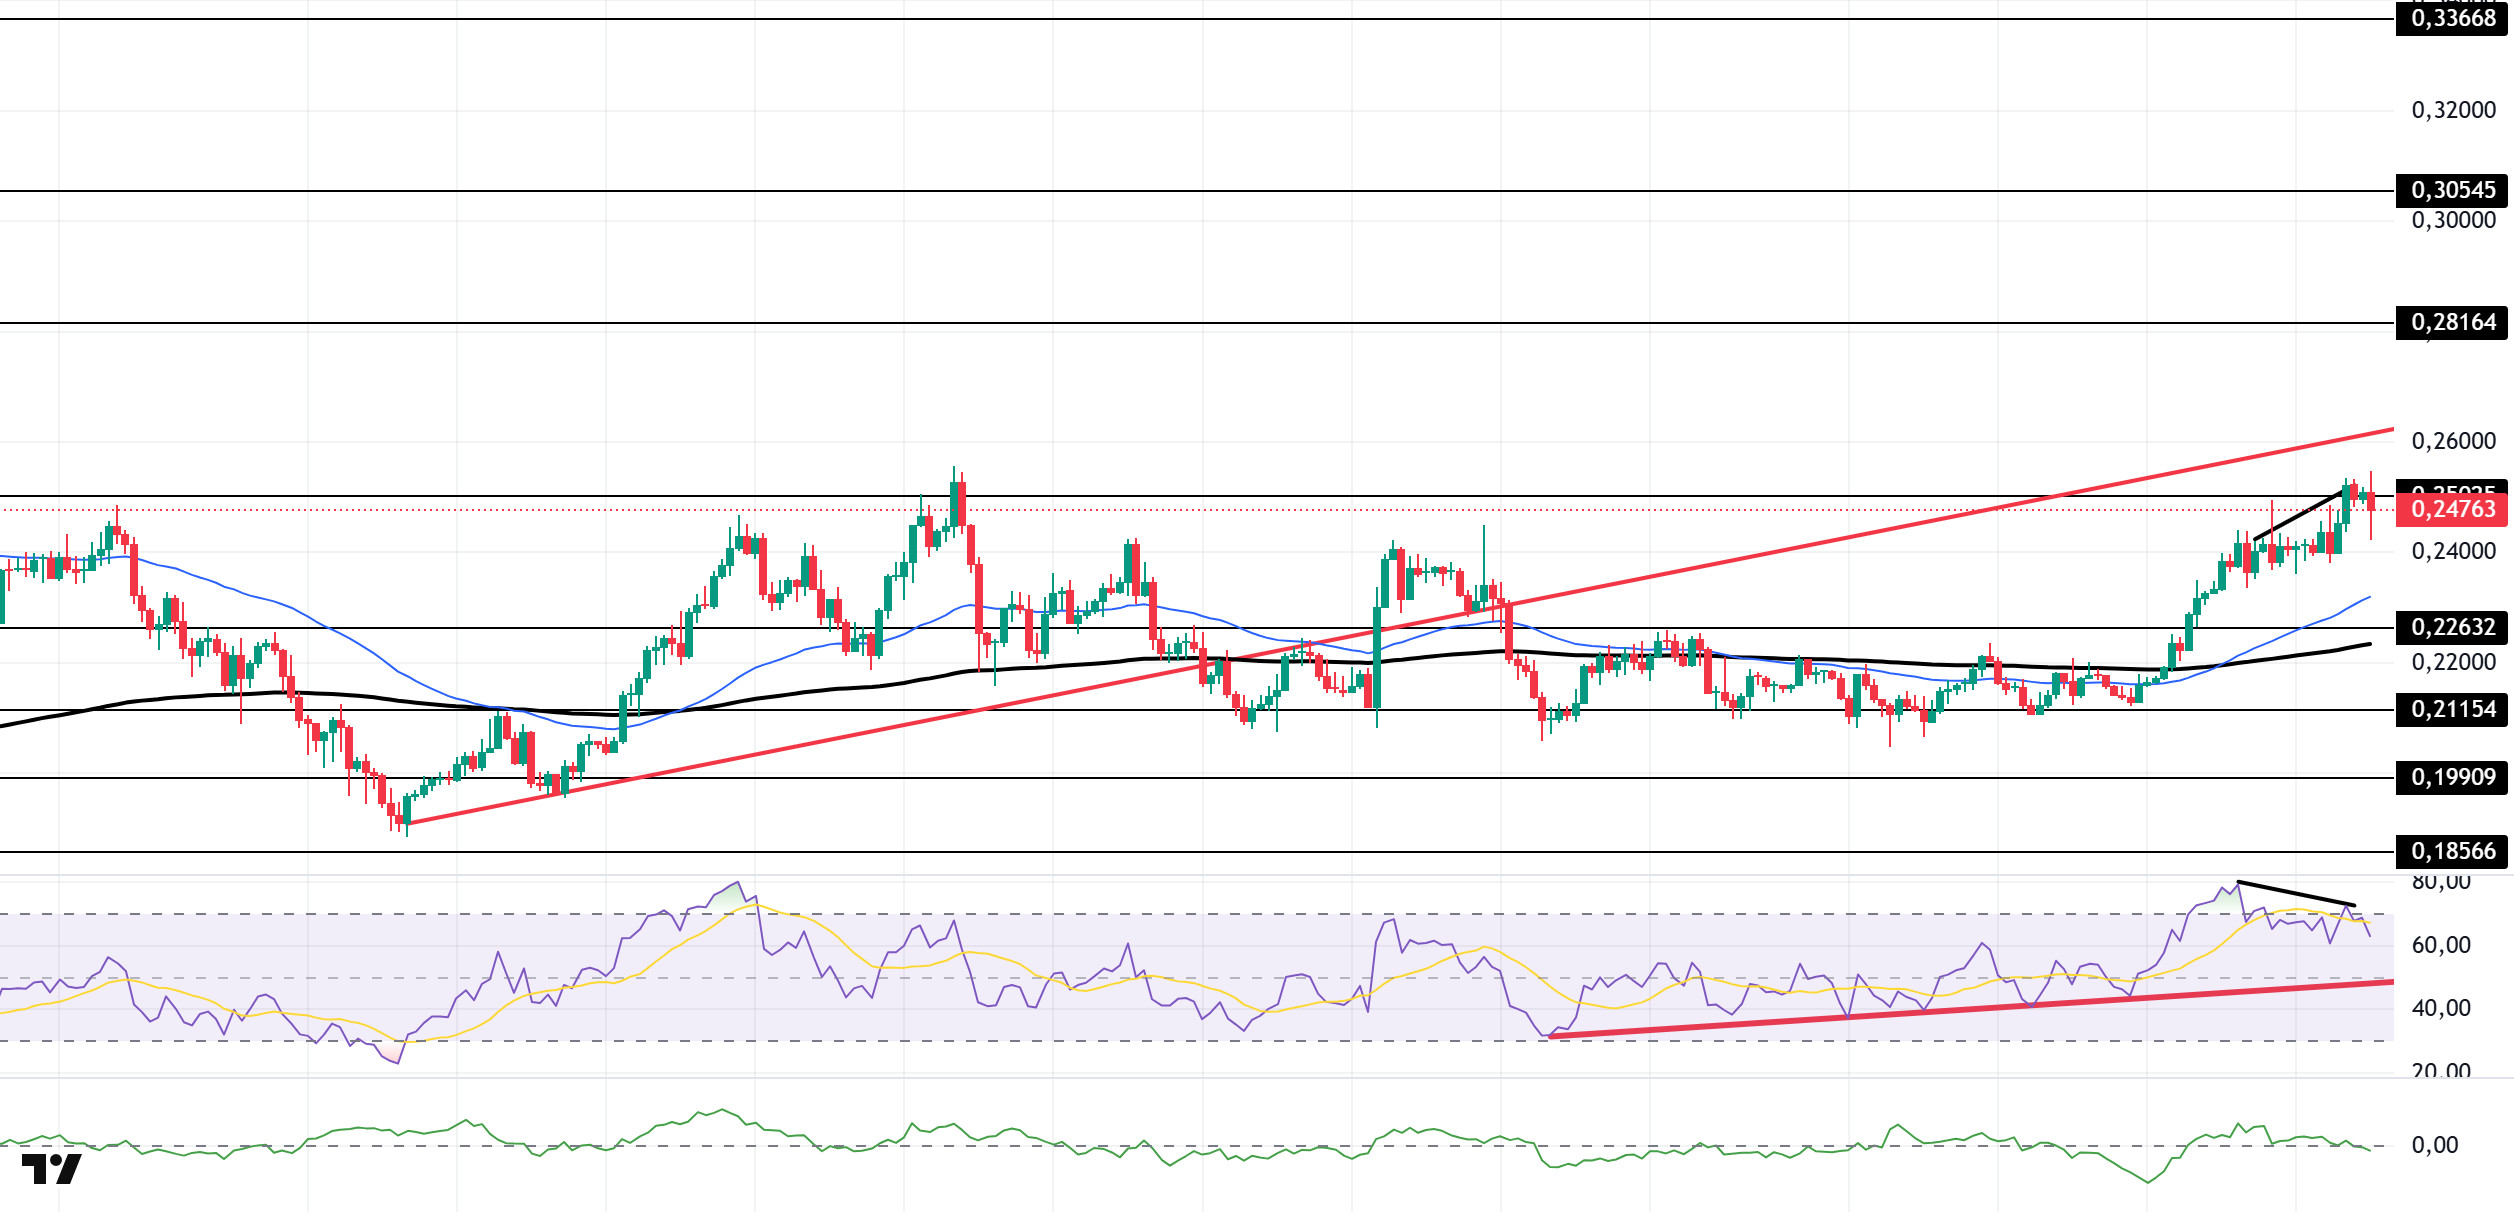
The DOGE price was flat during the day. The asset continued to be in the lower zone of the ascending line that started on August 3. Above the 50 EMA (Exponential Moving Average – Blue Line) and 200 EMA (Black Line) moving averages, the price maintained its momentum and continues to appreciate above the moving averages. The price, which is currently testing the $0.25025 level as support, may test the rising line as resistance if it sees support from here. In case of a possible pullback, the $0.22632 level may be triggered.
On the 4-hour chart, the 50 EMA (Blue Line) remained above the 200 EMA (Black Line). This indicates a continuation of the upward trend in the medium term. The fact that the price is above both moving averages suggests that the uptrend is strong in the short term. Chaikin Money Flow (CMF-20) declined to neutral. In addition, a decrease in inflows may move CMF into negative territory. Relative Strength Index (RSI-14) retreated slightly from the overbought zone. At the same time, it remains in the upper zone of the uptrend that started on August 26. This signaled that momentum may continue. However, negative divergence may cause pullbacks. The $0.28164 level stands out as a strong resistance zone in the uptrend in line with political developments, macroeconomic data or positive news flow in the DOGE ecosystem. In the opposite case or possible negative news flow, the $0.22632 level may be triggered. In case of a decline to these levels, the momentum may increase and a new bullish wave may start.
Supports 0.25025 – 0.22632 – 0.21154
Resistances 0.28164 – 0.30545 – 0.33668
BNB/USDT
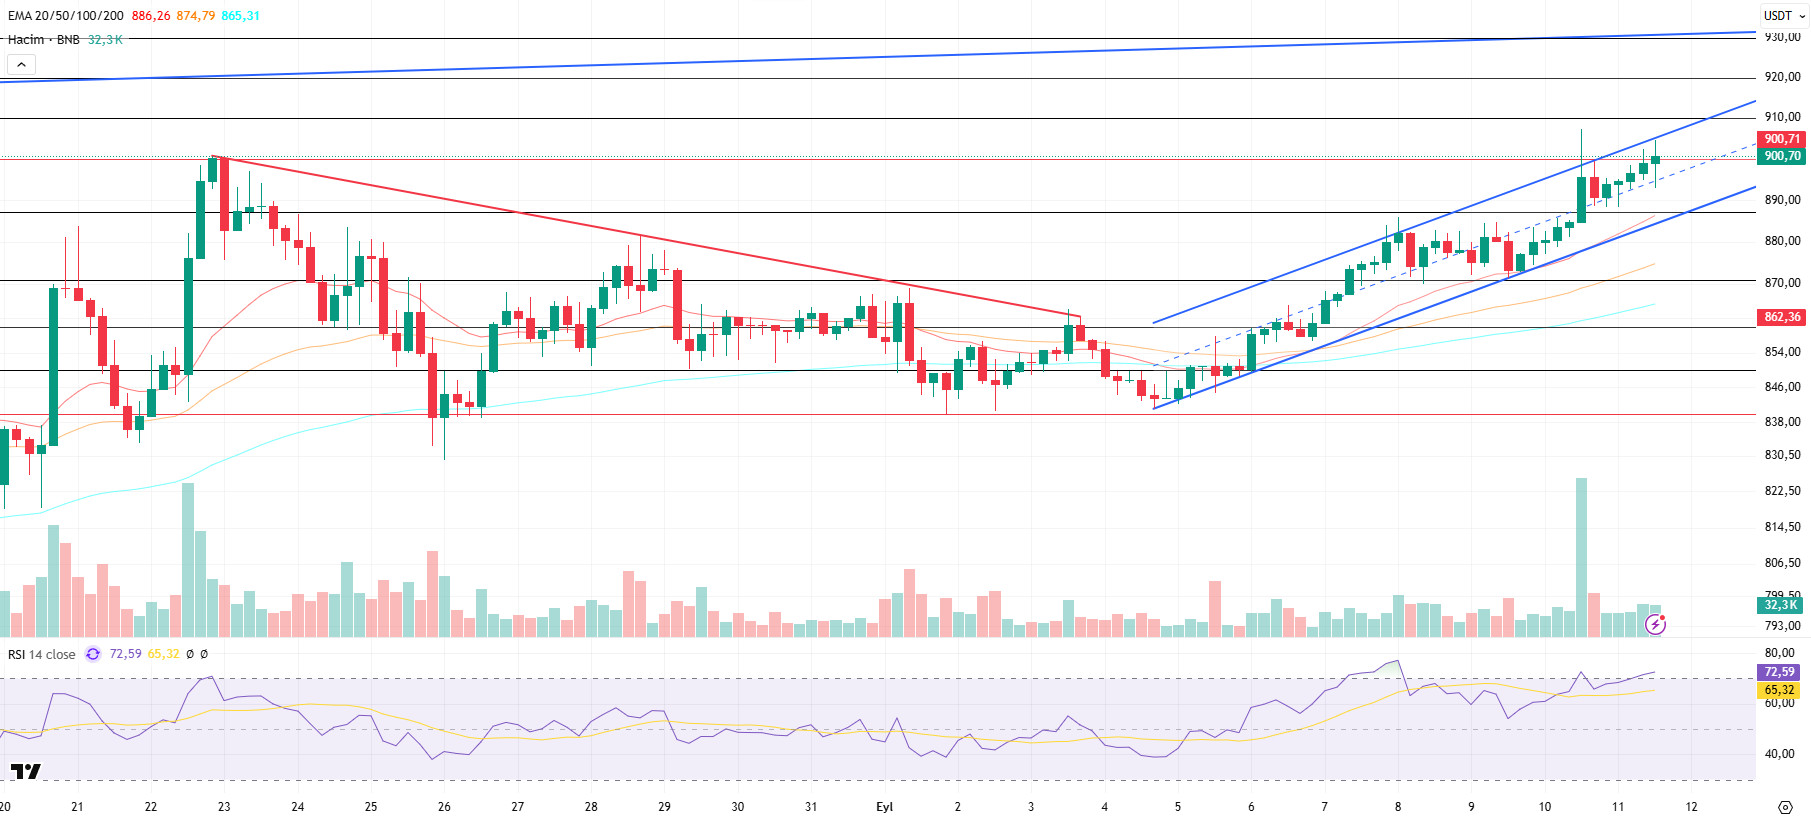
From a technical point of view, BNB/USDT fell as low as $840 on the four-hour chart with the recent pullbacks and regained bullish momentum with the support it received from this level. Yesterday, it was seen that BNB managed to rise above the $885 level with the effect of the general positive course of the markets. Afterwards, the asset rose above the historical peak level of $900 with the momentum it gained; however, it fell slightly below this level again due to profit realizations.
Today, some selling pressure emerged in the markets as the annual inflation data released from the US came in line with expectations. With this selling wave, BNB fell to the middle band of the rising channel, but recovered from this level.
Technical indicators for BNB/USDT, which is currently trading in the $900-910 range, reveal that the recent increase in trading volume has strengthened the buying appetite. This picture shows that the positive outlook stands out in the market.
In addition, the Relative Strength Index (RSI) has risen above the 70 level with the recent rises, and although short-term correction movements are observed, it is still holding at these levels. This technical structure indicates that the positive momentum in BNB is strengthening.
Within the framework of the current outlook, if the buying appetite is maintained, BNB is expected to test the $ 910 resistance level in the first place. If this level is exceeded, the price is likely to head towards $ 920 and $ 930 levels, respectively. On the other hand, if selling pressure increases, the price is likely to retreat back to $ 885 support. If this level is broken downwards, the $ 870 and $ 860 levels stand out as critical follow-up zones.
Supports 900 – 885 – 870
Resistances 910 – 920 – 930
ADA/USDT
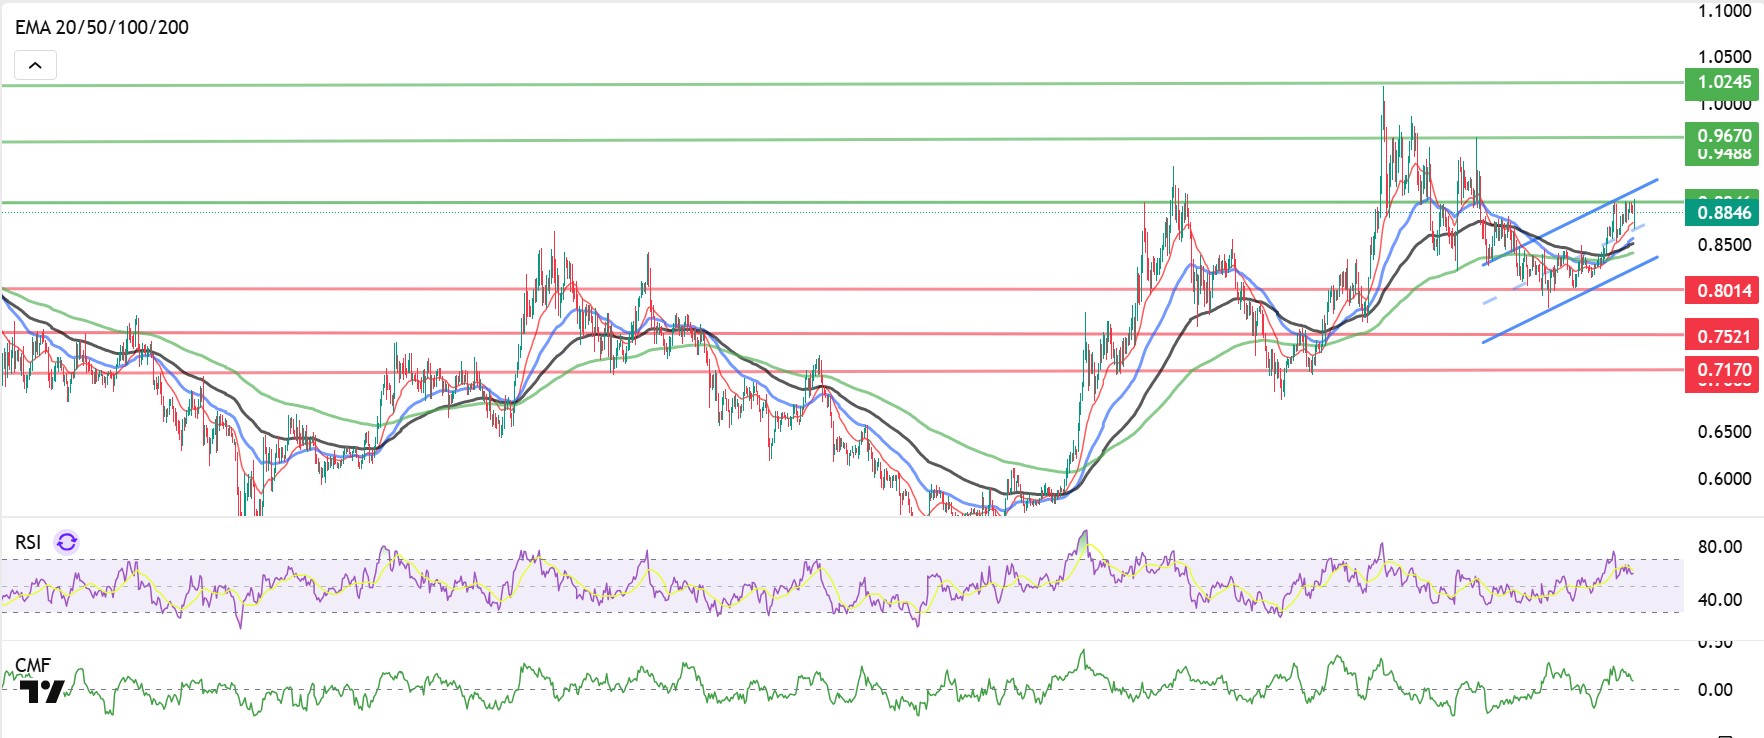
Cardano (ADA) made a reaction purchase at the level of $ 0.8945, with cryptocurrencies on the rise after the European Central Bank interest rate announced today. US CPI met expectations by recording an annual increase of 2.9%. US Applications for Unemployment Benefits were announced as 263K. After the data above expectations, the market started to decline, ADA fell to 0.8739 levels.
From a technical point of view, ADA price is still moving within the ascending channel band. In this context, it is expected to liquidate leveraged long leveraged positions of about 758 thousand dollars at the level of 0.9019 dollars. This move may cause the price to head towards the first resistance level tested yesterday at $0.9058 with reaction purchases during the day. If this level is surpassed, it is likely to reach $0.9280, the peak of the ascending channel within the major trend. The fact that the price is already above all moving averages indicates that the uptrend is strengthening. In particular, staying above the 20-day exponential moving average (EMA-20, Red Line) and 50-day exponential moving average (EMA-50, Blue Line) levels is critical for the sustainability of the uptrend. Momentum indicators also generate positive signals. Relative Strength Index (RSI) rose to 56, approaching the overbought zone. On the other hand, Chaikin Money Flow (CMF-20) indicator rose to 0.12, indicating that the buying potential in the market remains strong. The increase in money inflows supports the CMF to remain in positive territory and forms a bullish correlation with the RSI. This alignment increases the likelihood of a sustained buying bias.
In terms of fundamental factors, possible statements by US President Donald Trump or institutional/strategic purchases that may take place in the Cardano ecosystem are among the factors that may support the price to head towards the strong resistance point at $ 0.9280 . However, in case of a possible selling pressure in the markets, the 0.7851 dollar level should be followed as a critical support point.
Supports 0.7851 – 0.7566 – 0.7170
Resistances 0.9982 – 0.9636 – 0.9280
Legal Notice
The investment information, comments, and recommendations contained herein do not constitute investment advice. Investment advisory services are provided individually by authorized institutions taking into account the risk and return preferences of individuals. The comments and recommendations contained herein are of a general nature. These recommendations may not be suitable for your financial situation and risk and return preferences. Therefore, making an investment decision based solely on the information contained herein may not produce results in line with your expectations.


