
Fear & Greed Index
Source: Alternative
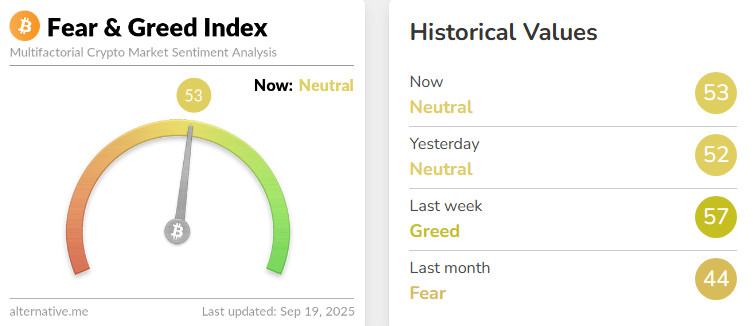
Change in Fear and Greed Value: -4
Last Week’s Level: 57
This Week’s Level: 53
The week started cautiously with regulatory uncertainty originating from Europe, France’s market supervisor Autorité des Marchés Financiers (AMF) weakened risk appetite on the crypto side by considering an approach that could limit the entry of some crypto companies that carry licenses through passporting, while Wall Street’s cautious pricing before the Federal Reserve (Fed) decision in the US supported this pressure. Then, the risk perception recovered with the Fed’s 25 basis point cut and the signal of additional easing going forward. On the same day, the U.S. Securities and Exchange Commission (SEC) approved general listing standards for spot crypto funds and this step strengthened crypto expectations by paving the way for new Exchange-Traded Fund (ETF) applications. In the second half of the week, with a more positive reading of unemployment claims and the optimism brought by the news of Nvidia’s investment in Intel, record closes were seen in US indices, strengthening the risk-taking tendency on the stock side, while on the institutional front, Singapore-based DBS Bank Ltd (DBS) and Franklin Templeton and Ripple’s announcement of cooperation to facilitate tokenized money market fund transactions made a positive contribution to crypto sentiment. However, the impact of regulatory risk and pre-decision caution at the beginning of the week outweighed the overall effect, with the index falling from 57 to 53, and news flow between crypto and US markets remaining strong but balanced.
Fund Flows
Source: CoinShares
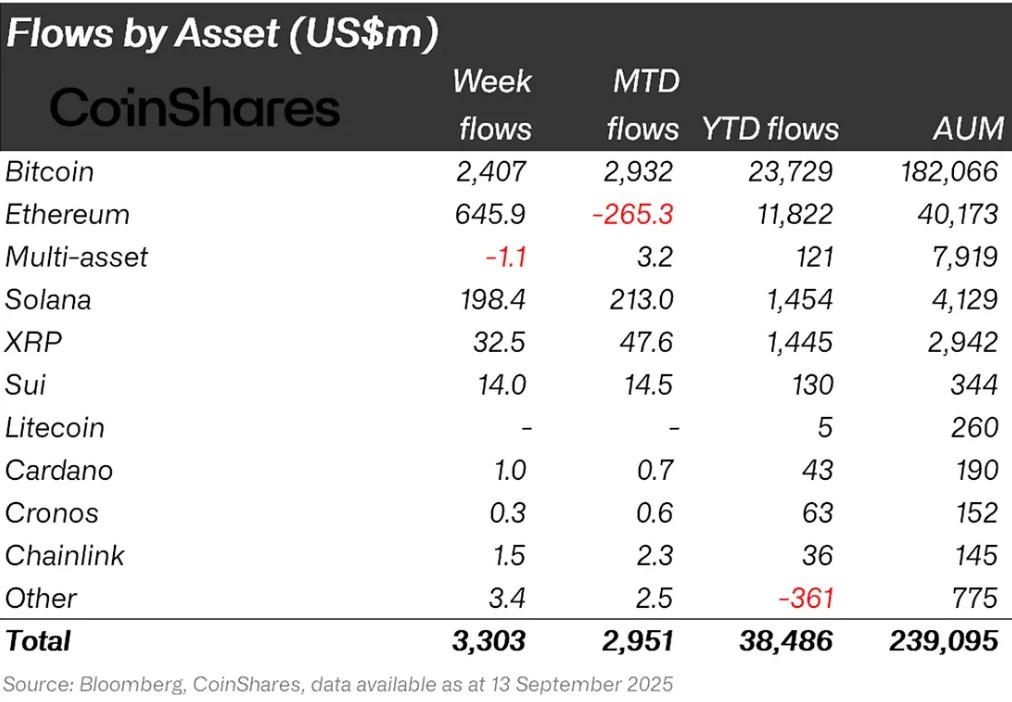
Overview Cryptocurrency markets entered a comfortable week after the US Federal Reserve (FED) announced a 25 basis point interest rate cut. In particular, US President Donald Trump’s positive statements about the stock markets strengthened the confidence in the markets. With the impact of these developments, Bitcoin gained about 5% during the week.
Bitcoin (BTC): Bitcoin continues to garner investor confidence this week. The interest rate cut in global markets had a positive impact on crypto markets and had a positive impact on Bitcoin. Especially the optimistic attitude of institutional investors attracts attention. In this week alone, Bitcoin-focused funds have seen inflows of $2.407 billion. This development reveals that the market is showing signs of recovery and long-term confidence in Bitcoin continues.
Ethereum (ETH): Ethereum saw inflows of $645.9 million this week, as spot ETH surged.
Ripple (XRP): Xrp saw fund inflows of $32.5 million this week.
SUI: The general appreciation in the market and corporate banks’ deals with Sui had a positive impact. Approximately $14.0 million inflows were realized from Sui this week.
Solana (SOL): SOL hit 8-month highs and started trading above $250. Solana saw inflows of $ 198.4 million.
Cardano (ADA): Cardano saw inflows of $1.0 million this week
Chainlink (LINK): Chainlink continues to strengthen its potential to provide trusted data to the Tokenization and DeFi space. Link saw $1.5 million in inflows this week.
Other: Sectoral and project-based rallies in altcoins led to $3.4 million in inflows in fund flow data in the general market impression.
Fund Outflows:
Multi-asset: Outflows were observed in the multi-asset group.
Total MarketCap
Source : Tradingview
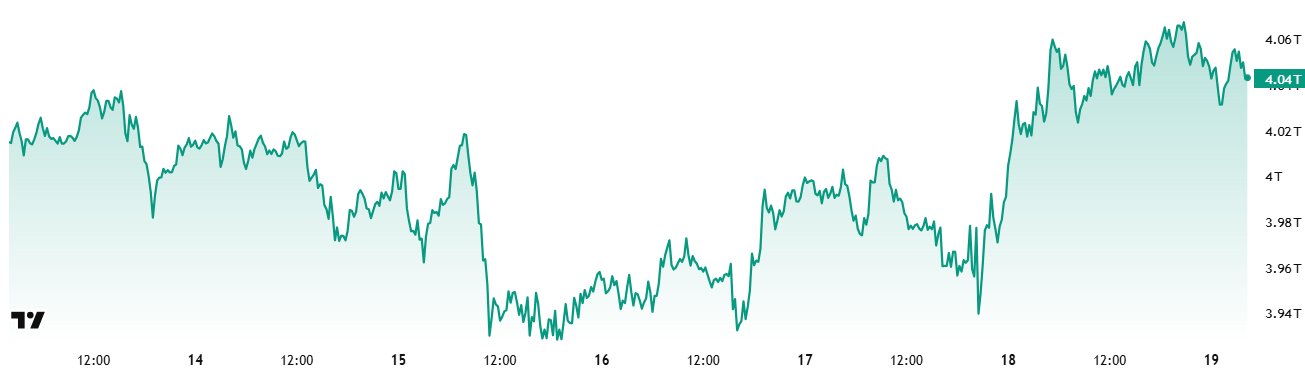
- Last Week Market Capitalization: 98Trillion Dollars
- Market Capitalization This Week: 04 Trillion Dollars
The cryptocurrency market increased by 1.67% in total market capitalization to $4.04 trillion this week, with growth of nearly $66 billion. During the week, the market capitalization peaked at $ 4.08 trillion, while the lowest point was recorded as $ 3.91 trillion. Thus, it was seen that the market moved within a band of approximately 170 billion dollars. This outlook suggests that volatility is less than last week but still persists, suggesting that the market remains on an upward trajectory and investors continue to be cautiously positioned to buy.
Total 2
The Total 2 index, which started the week with a market capitalization of $ 1.68 trillion, increased by 1.82% during the week, reaching $ 1.71 trillion with an increase of approximately $ 30 billion . The index, which rose up to $1.73 trillion during the week, reached its lowest level at $1.63 trillion and changed in a band of approximately $100 billion. This shows that volatility is less compared to last week, but the rise continues. Although it came very close to last week’s all-time high of $1.74 trillion, it could not create a new peak this week. However, from current levels, there is still the possibility of regaining momentum to form new highs in the coming week with the potential for a value increase of about 2%.
Total 3
While the Total 3 index started the week with a market capitalization of $1.12 trillion, it gained approximately $31 billion during the week, rising by 2.78% and reaching $1.15 trillion. The index, which had a gap of 7.35% between the lowest and highest values during the week, was again the most volatile index of the week.
While a positive picture was observed throughout the market, it was noteworthy that the strongest performance was seen in the Total 3 index last week and this week. This suggests that the altcoin market has regained prominence and started to accompany the fundamental segments of the market. Looking at comparative performances, Ethereum’s total market share continued to decline this week. Unlike the altcoin market, there was no major change in the market share of bitcoin.
Altcoin Season Index
” Altcoin Season Index” Image with Name to be Added”
Source: Coinmarketcap
- Last Week Index Value: 66/100
- Index Value This Week: 73/100
Between September 12 and September 19, 2025, the correlation between the market capitalization of altcoins (Altcoin Market Cap) and the Altcoin Season Index has been on the rise. The chart shows that this week, the index peaked at 73 on September 18 , with the Altcoin Market Cap reaching 1.76T. This signals a rise in the market dominance of altcoins. The top 5 coins that led the index higher this week were MYX, M, Aster, Pengu, IP. Between September 12 and 19, the index rose from 66 to 73, indicating that the altcoin season has the potential for a short-lived revival and that the total market capitalization of altcoins is experiencing relative progress compared to Bitcoin.
Bitcoin Dominance
Bitcoin Dominance
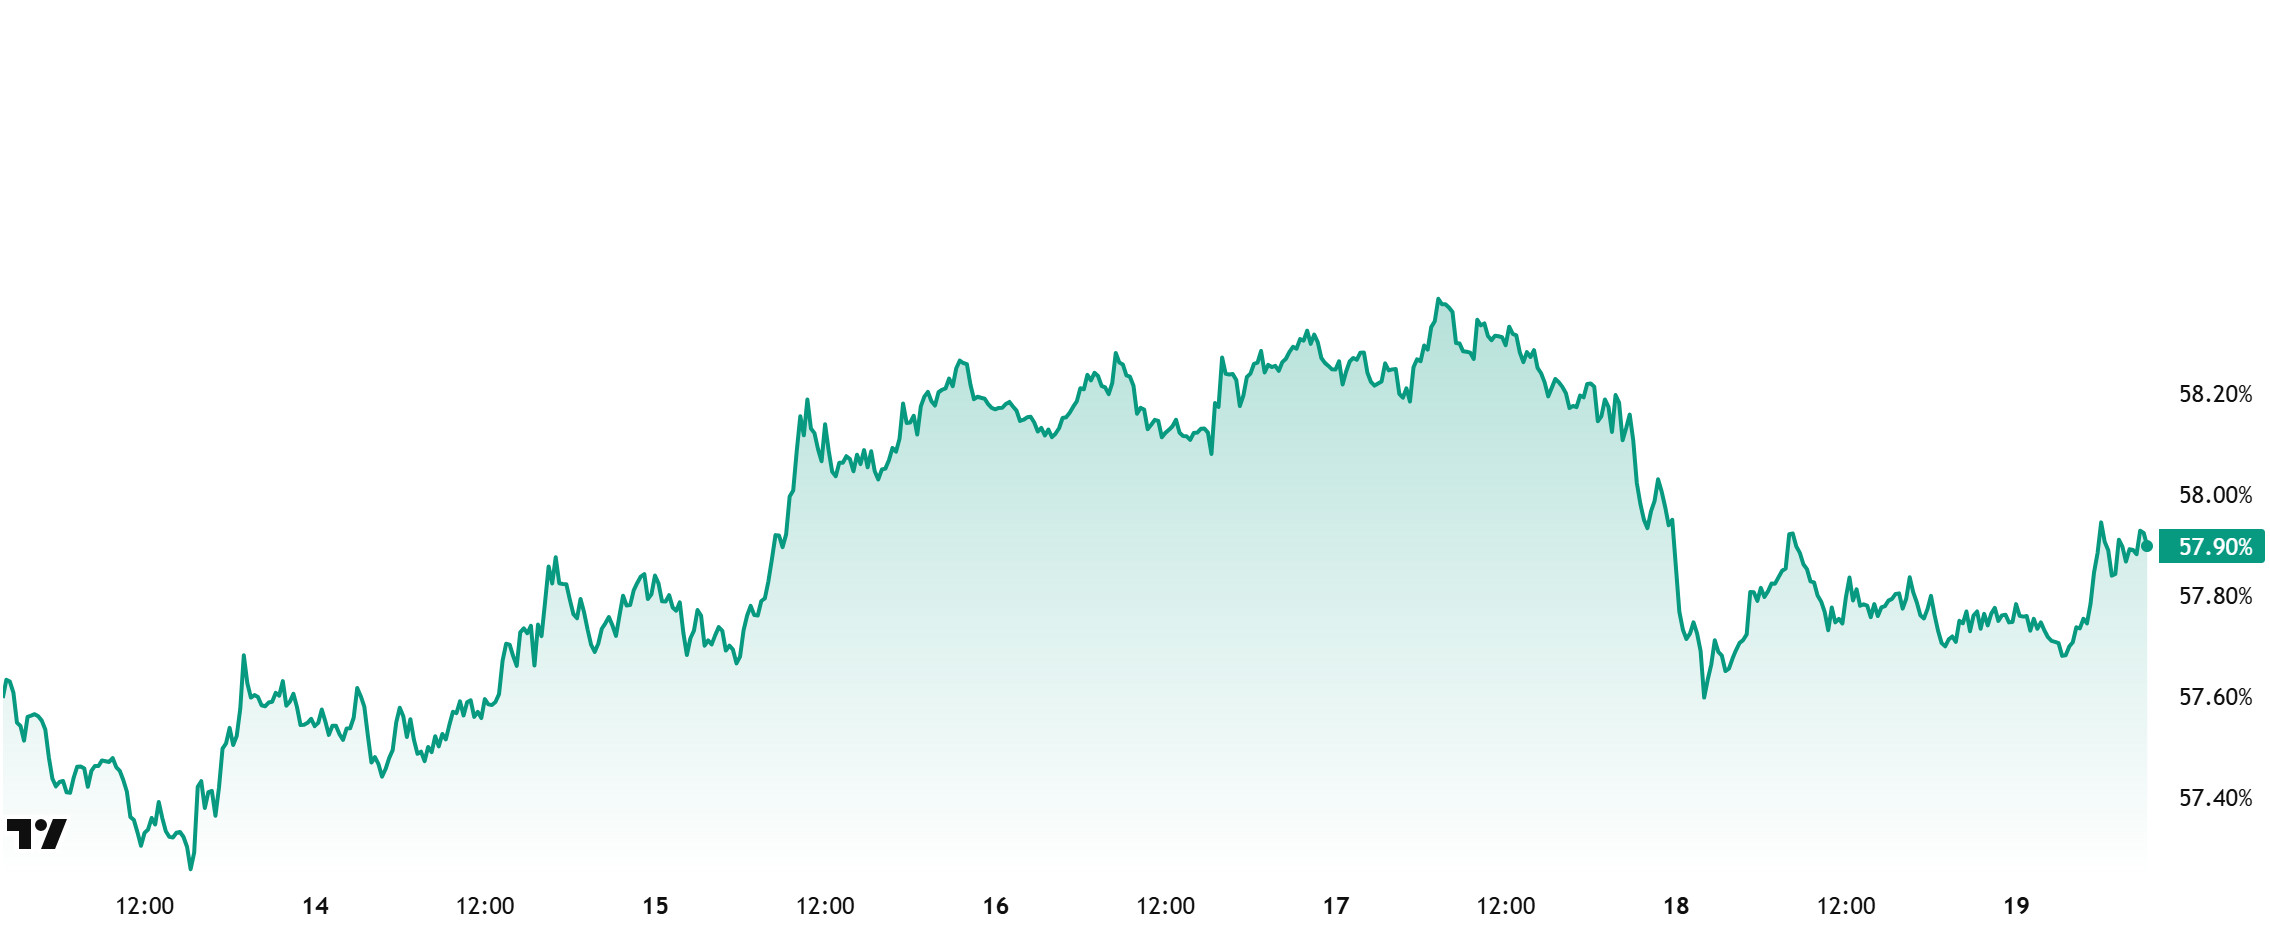
Bitcoin dominance, which started the week at 57.78%, increased to 58.37% during the week, but then retreated slightly and is currently at 57.90%.
This week, Strategy bought 525 Bitcoin, Capital B bought 48 Bitcoin and H100 Group bought 21 Bitcoin.
Data on Bitcoin spot ETFs shows a total net inflow of $664 million to date.
The FED cut interest rates by 25 basis points in September, as expected, and announced the probable rate cut for this year as 50 basis points. Markets are pricing this positively. Following the developments originating from the US, purchases in spot ETFs increased as retail investors’ risk appetite increased, and it is noteworthy that inflows continued on the institutional investor front.
With the impact of positive developments, capital inflows to Bitcoin have accelerated. In this process, Bitcoin outperformed Ethereum and other altcoins in terms of performance. If institutional investor purchases and fund flows to ETFs continue, Bitcoin dominance is likely to remain strong. On the other hand, if Ethereum and altcoins decouple on price basis, the dominance may decline. Accordingly, Bitcoin dominance is expected to move between 57% – 60% in the coming week.
Ethereum Dominance
Source: Tradingview
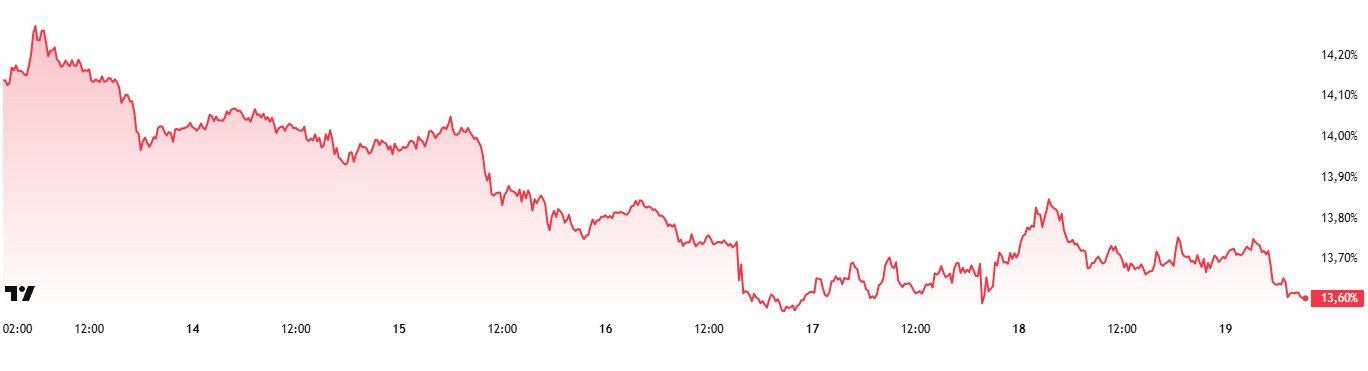
Weekly Change
- Last Week’s Level: 13.98%
- This Week’s Level: 13.60%
Ethereum dominance, which rose to 15% in mid-August, lost momentum in the following period and entered a downward trend and retreated to 13.50%. This negative outlook continued its effect in the current week.
Accordingly, Ethereum dominance completed last week at 13.98%, while it is trading at around 13.60% as of current data. In the same period, Bitcoin dominance, unlike Ethereum, followed a positive trend and exhibited an upward trend.
Analyzing the fundamental developments affecting Ethereum dominance, the activity on the institutional buying side stands out. In this context, it is seen that SharpLink holds 838,152 ETH and the market value of these assets is approximately 3.86 billion dollars. In addition, the company earned 3,240 ETH rewards through staking and increased its asset concentration by 99%.
Whale interest also continues. According to Odaily Planet Daily, four different whales have accumulated a total of $234 million worth of ETH today. According to CryptoQuant, the unrealized profits of whales holding 10,000-100,000 ETH have reached their peak levels in November 2021. This suggests that whales are holding significant “paper profits”. Historical data suggests that selling pressure usually increases at these levels.
On the other hand, Ethereum treasurer ETHZilla announced that it holds 102,240 ETH. Of this, $100 million is being utilized in ether.fi re-staking, and $80 million is earmarked for share buybacks. In total, the company has the right to repurchase up to 250 million dollars. Vitalik Buterin stated at a conference in Japan that Ethereum’s short-term goal is to increase the L1 gas limit. In the medium term, interoperability between L2s will be prioritized, and in the long term, the vision of a quantum-resistant, simple and formally verified Ethereum will be prioritized . Finally, Ethereum treasury The Ether Machine has filed an S-4 registration with the SEC to advance the IPO process. This process will be carried out through a merger with Nasdaq-listed Dynamix Corporation and is expected to be completed in the last quarter of the year.
Bitcoin Spot ETF
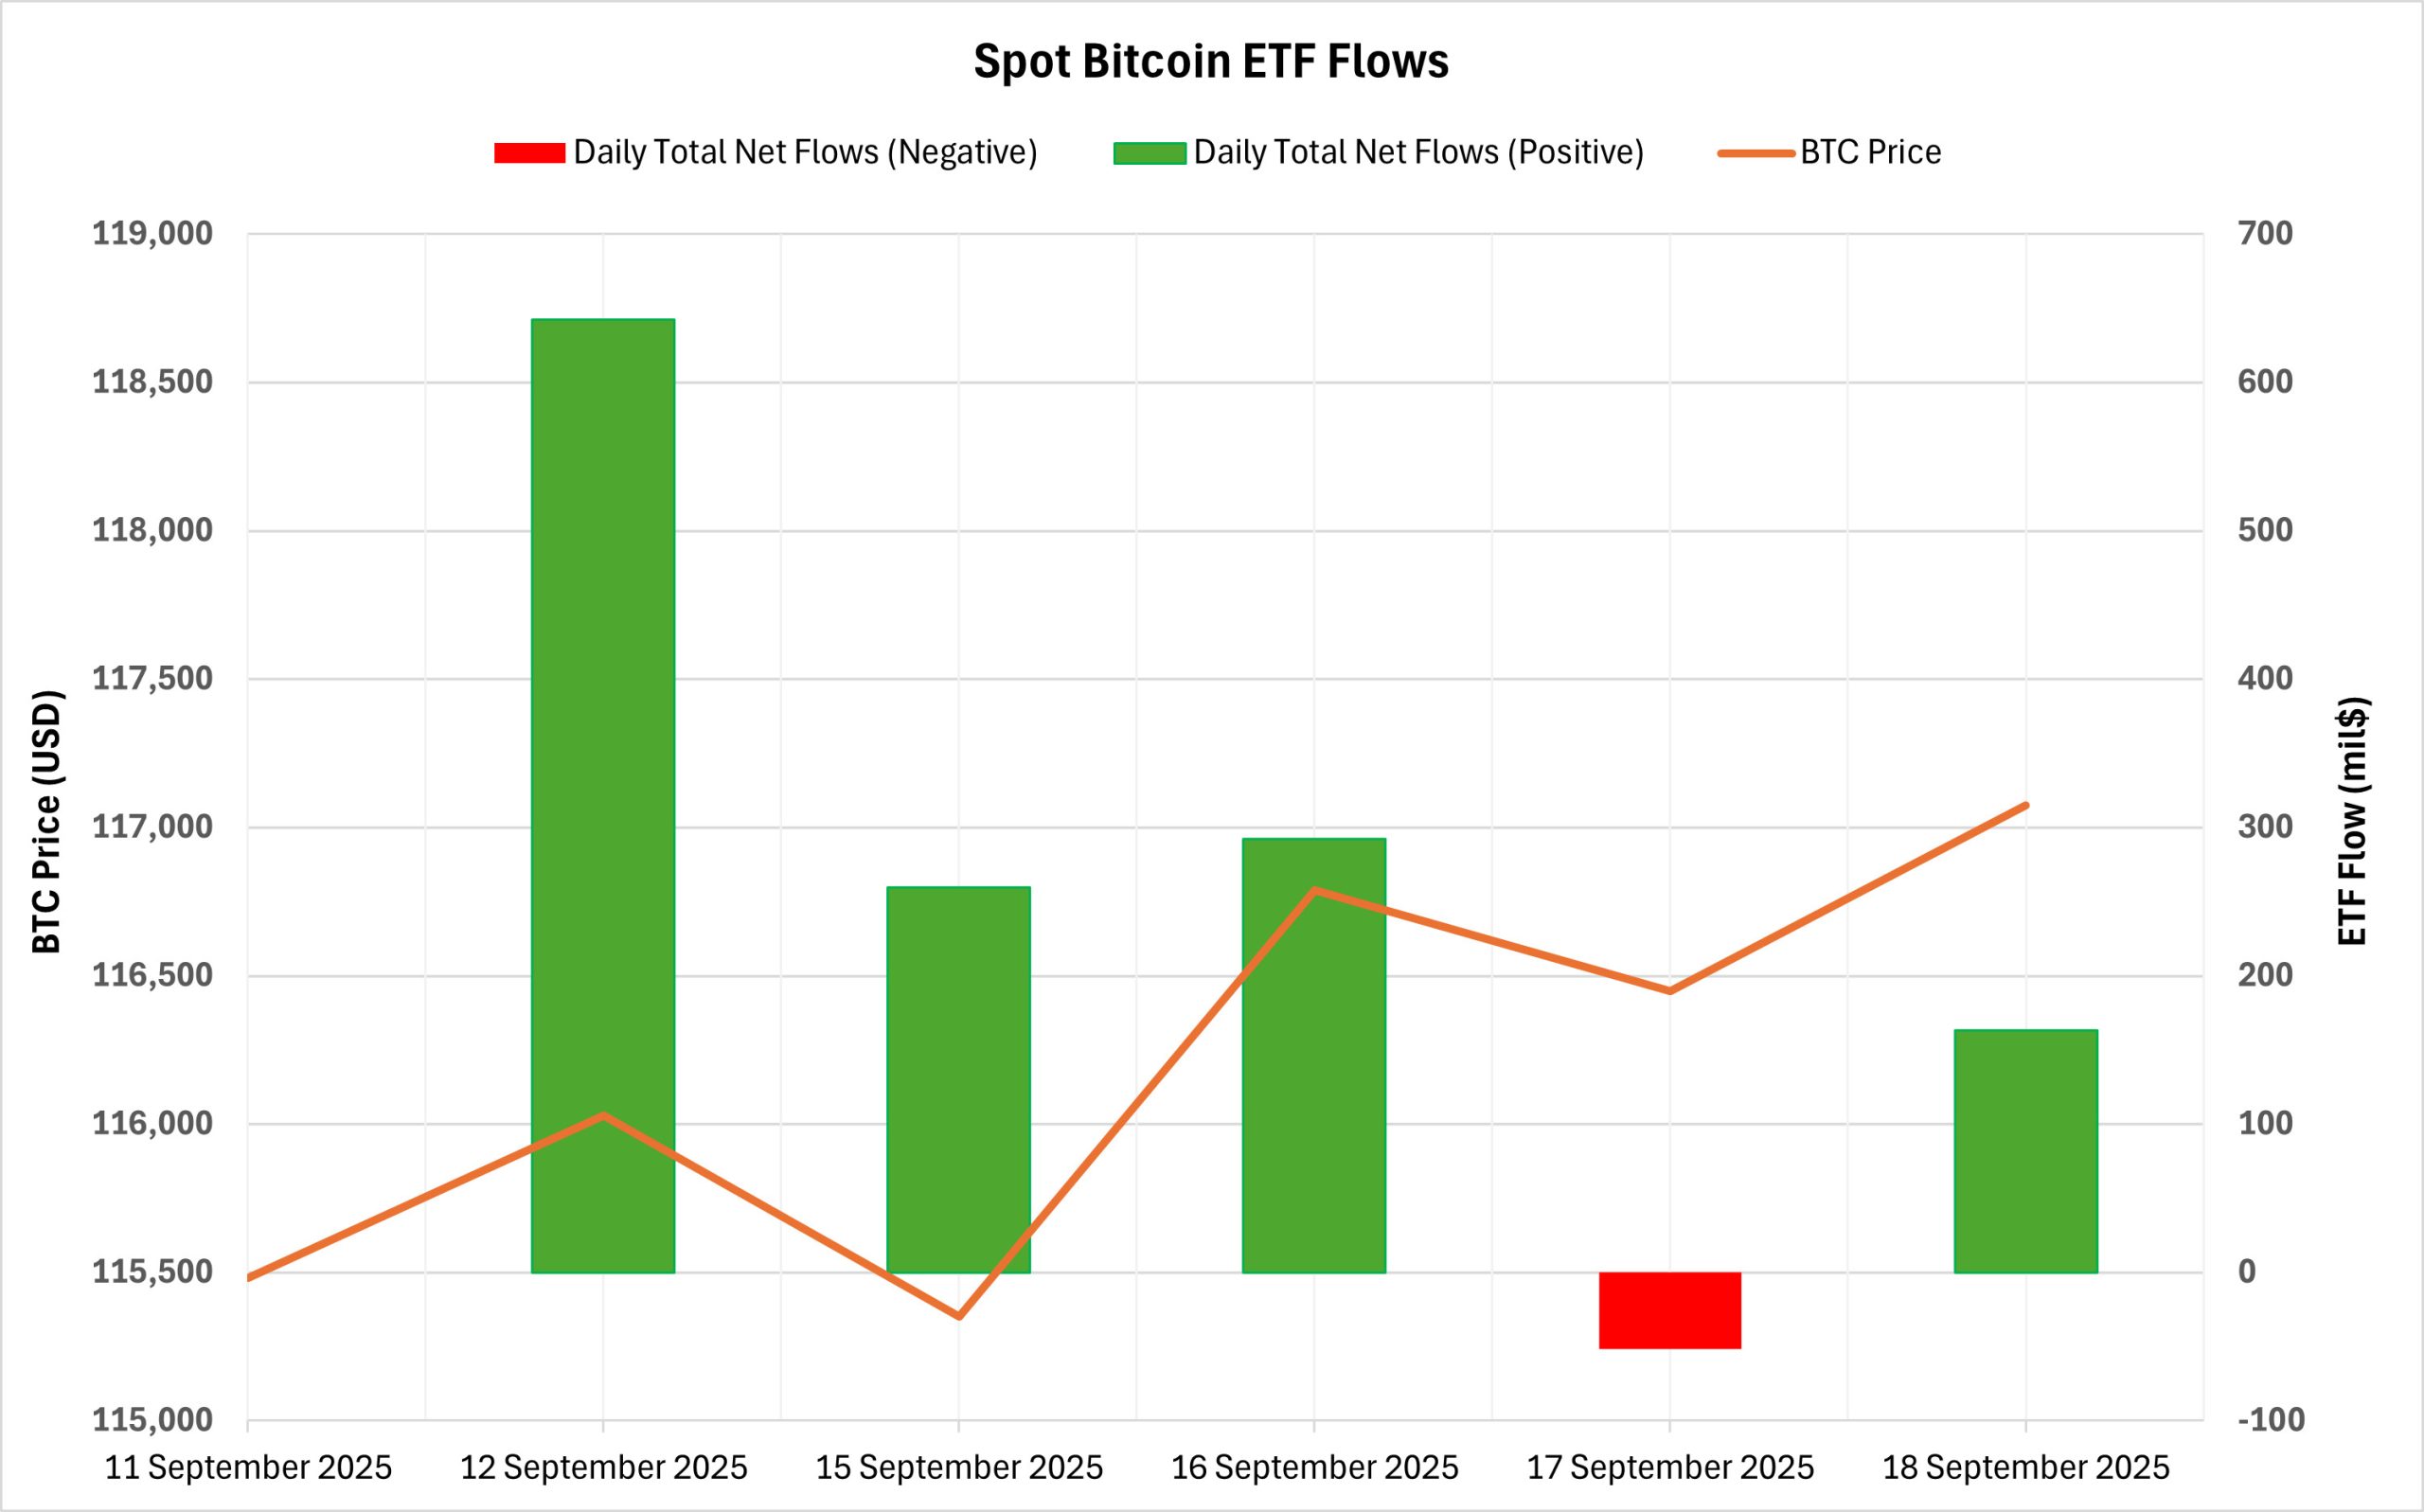
Netflow Status: Between September 12-18, 2025, Spot Bitcoin ETFs saw a total net inflow of $1.306 billion. The strongest daily inflow was recorded on September 12 with $642.4 million. On a fund basis, BlackRock IBIT and Fidelity FBTC stood out with net inflows of $885.4 million and $349.9 million, respectively. In this process, the 7-day positive streak ended on September 17 with a net outflow of $ 51.3 million.
Bitcoin Price: Bitcoin, which opened at $ 115,483 on September 12, closed at $ 117,074 on September 18. In this process, the Bitcoin price rose 1.38%. Consecutive positive days during this period, along with strong ETF inflows, supported the price.
Cumulative Net Inflows: Spot Bitcoin ETFs’ cumulative net inflows rose to $57.45 billion as of the 423rd trading day.
| Date | Coin | Open Price | Close Price | Change % | ETF Flow (mil $) |
|---|---|---|---|---|---|
| 12-Sep-25 | BTC | 115,483 | 116,029 | +0.47% | 642.4 |
| 15-Sep-25 | BTC | 115,268 | 115,350 | +0.07% | 259.9 |
| 16-Sep-25 | BTC | 115,350 | 116,789 | +1.25% | 292.3 |
| 17-Sep-25 | BTC | 116,789 | 116,448 | -0.29% | -51.3 |
| 18-Sep-25 | BTC | 116,448 | 117,074 | +0.54% | 163 |
| Total (12-18 Sep 25) | +1.38% | 1306.3 | |||
Strong inflows to spot Bitcoin ETFs showed that institutional investor interest remains buoyant. The high demand, especially on the IBIT and FBTC side, indicates that optimism in medium-long term expectations is maintained. The fact that the price closed slightly higher and flows ended the week net positive strengthens the likelihood of a medium-term upside support on BTC price as institutional demand continues in the coming period.
Ethereum spot ETF
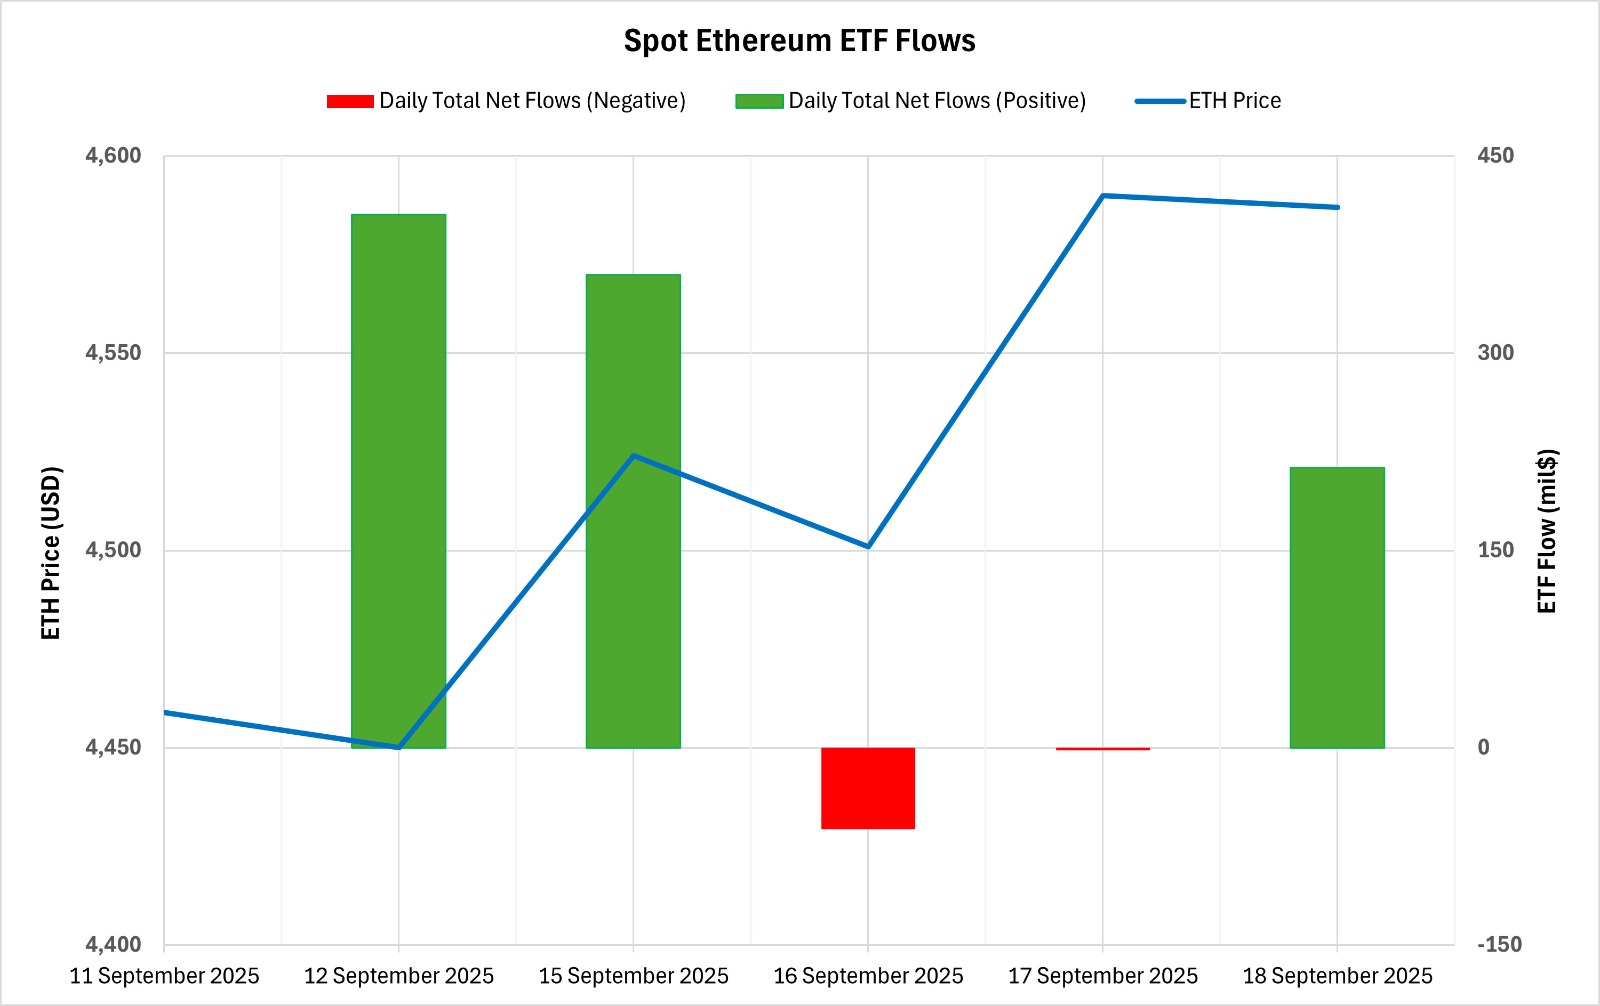
Between September 12-18, 2025, Spot Ethereum ETFs saw a total net inflow of $914.7 million. The strongest inflow on a daily basis was $ 405.5 million on September 12. On a fund basis, BlackRock ETHA attracted attention in this process with a net inflow of 534.4 million dollars. The 5-day positive streak ended on September 16 with an outflow of $61.7 million. Weak outflows were seen on September 16-17, but flows turned positive again on September 18. Spot Ethereum ETFs’ cumulative net inflows rose to $13.89 billion as of the 291st trading day.
| Date | Coin | Open Price | Close Price | Change % | ETF Flow (mil $) |
|---|---|---|---|---|---|
| 12-Sep-25 | ETH | 4,459 | 4,450 | -0.20% | 405.5 |
| 15-Sep-25 | ETH | 4,604 | 4,524 | -1.74% | 359.7 |
| 16-Sep-25 | ETH | 4,524 | 4,501 | -0.51% | -61.7 |
| 17-Sep-25 | ETH | 4,501 | 4,590 | +1.98% | -1.9 |
| 18-Sep-25 | ETH | 4,590 | 4,587 | -0.07% | 213.1 |
| Total (12-18 Sep 25) | +2.87% | 914.7 | |||
Ethereum price started at $4,459 on September 12 and closed at $4,587 on September 18, up 2.87% in the process. Despite the decline in the Ethereum price before the FED interest rate decision and Powell’s speech, the 1.98% recovery on September 17 stood out. The fact that the flow and price are moving in the same direction again indicates that institutional demand continues. If this trend continues, additional inflows from the ETF front may continue to support the ETH price in the medium term.
Bitcoin Options Distribution
Source: Laevitas
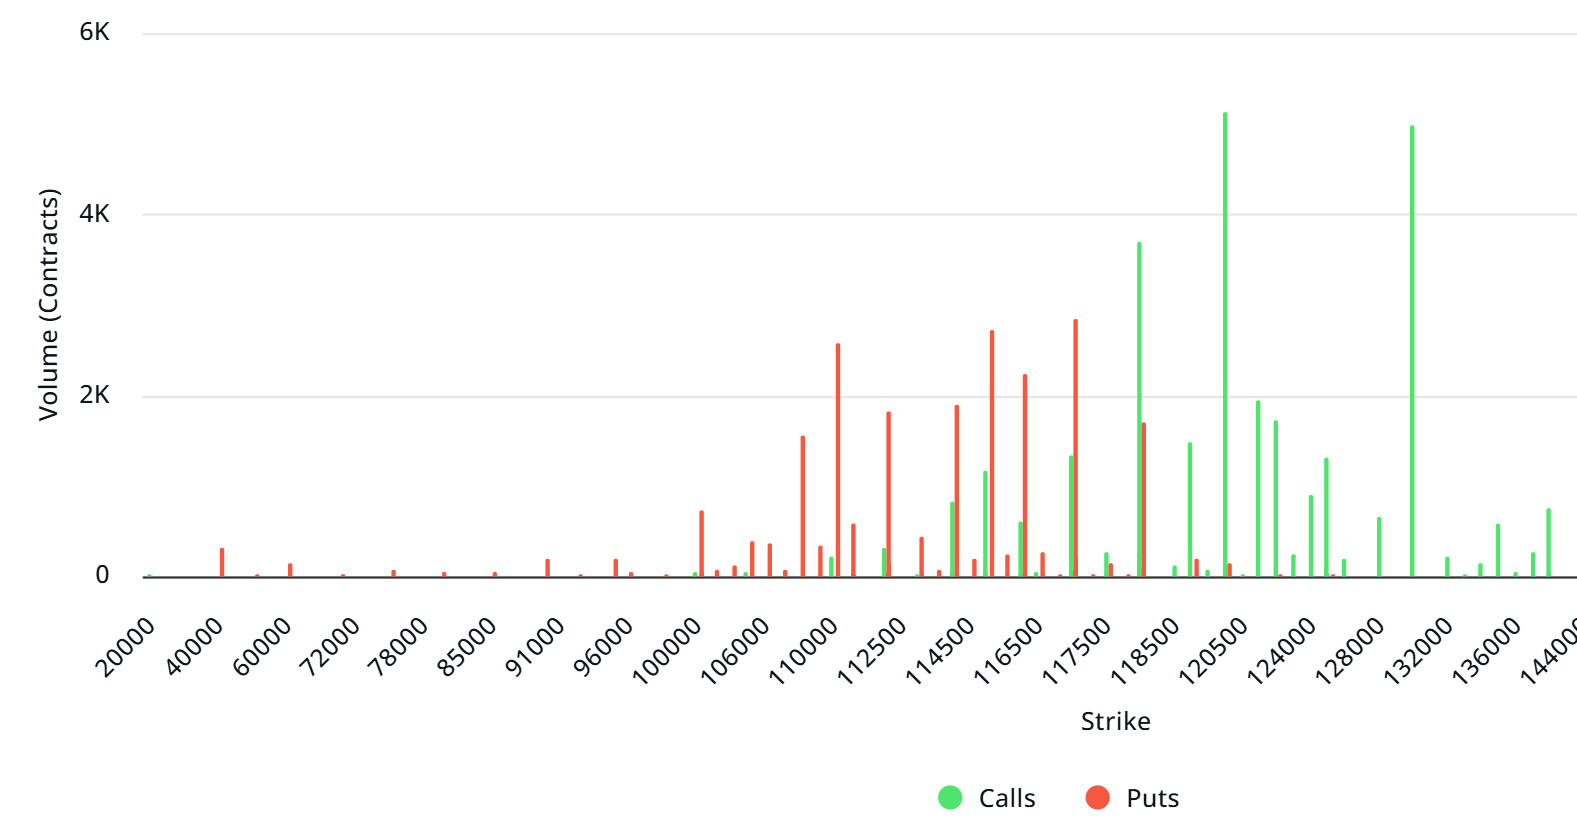
BTC: Notional: $3.53B | Put/Call: 0.74 | Max Pain: $114K
Deribit Data: Deribit data shows that BTC options contracts with a notional value of approximately $3.53 billion expired today. At the same time, according to the data in the last 24 hours, if we look at the risk conversion in the next 1 week, put options are the dominant side in hedging more than call options. When we examine the expected volatility (IV), it is above the realized volatility (RV). On the other hand, the positive course of the spread metric indicates that the market has an appetite. Skew values are bearish today and next week.
Laevitas Data: When we analyze the chart, it is seen that put options are concentrated in a wide band between 110,000 – 118,000 dollars. Call options are concentrated between $ 118,000 and $ 130,000 and the concentration decreases towards the upper levels. At the same time, the $ 115,000 level is seen as support and the $ 118,000 level as resistance. On the other hand, there are 2.84K put options at the $ 117,000 level, where there is a peak and there is a decrease in put volume after this level. However, it is seen that 5.13K call option contracts peaked at the $120,000 level. When we look at the options market, we see that call contracts are dominant on a daily and weekly basis.
Option Maturity:
Put/Call Ratio and Maximum Pain Point: In the last 7 days of data from Laevitas, the number of call options increased by about 18% compared to last week to 109.92K. In contrast, the number of put options was 89.37K, up 6% from last week. The put/call ratio for options was set at 0.74. This indicates that call options are much more in demand among traders than put options. Bitcoin’s maximum pain point is seen at $114,000. It can be predicted that BTC is currently priced at $116,700 and if it does not break the $114,000 level downwards, which is the pain point, it can be predicted that the rises will continue.
Ethereum Options Distribution
Source: Laevitas
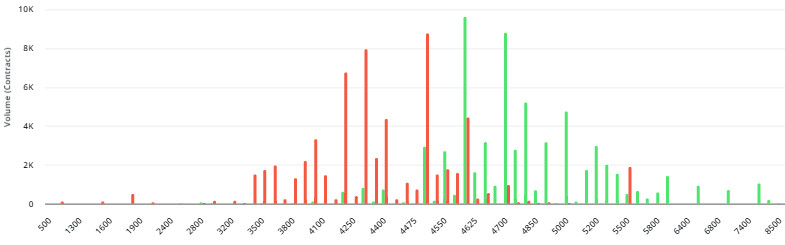
ETH: $807.2 M notional | Put/Call: 1.00 | Max Pain: $4,500
Laevitas Data: Looking at the data in the chart, we see that put options are particularly concentrated at the price levels between $4,200 and $4,500. The highest put volume is at $4,500 with around 10K contracts and this level can be considered as a possible support zone. On the other hand, call options are concentrated between $4,600 and $5,000. Especially the $4,600 level stands out with a high call volume of about 11K contracts. This level can be considered as an important resistance zone in the market.
Deribit Data: ATM volatility is 50.96% and down 4.33% in the last 24 hours. 25 risk reversal of +2.26 indicates that there is a stronger demand for call options than puts. 25 butterfly is at 1.23 and slightly up by +0.47 points during the day. On the daily volume side, the total 24s options volume is $35.94M, with call at $18.06M and put at $17.88M. We see that the rise in the price, together with the positive basis and positive RR, increases the upside risk appetite in the short term. On the other hand, the decline in ATM vol and the sharp decline in total volume suggest that momentum is weakening. In short, we can conclude that the picture offers a neutral to slightly bullish outlook. However, unless volumes recover, it may be healthier to remain cautious about the sustainability of the rise.
Option Expiry:
Ethereum options with a notional value of $807.2 million expired on September 19. The Max Pain level is calculated at $4,500, while the put/call ratio is at 1.00.
Legal Notice
The investment information, comments and recommendations contained in this document do not constitute investment advisory services. Investment advisory services are provided by authorized institutions on a personal basis, taking into account the risk and return preferences of individuals. The comments and recommendations contained in this document are of a general type. These recommendations may not be suitable for your financial situation and risk and return preferences. Therefore, making an investment decision based solely on the information contained in this document may not result in results that are in line with your expectations.
