Weekly Fundamental Analysis Report – October 03
Fear & Greed Index
Source: Alternative.me
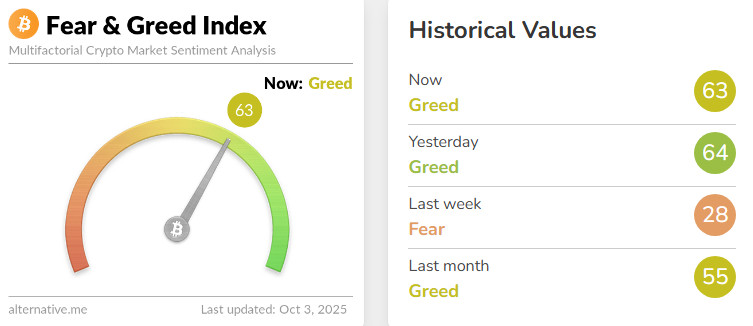
Change in Fear and Greed Value: +35
Last Week’s Level: 28
This Week’s Level: 63
This week presented a mixed picture, with institutional buying and policy headlines lifting risk sentiment. The theme of institutional adoption was reinforced by Tether’s Q3 2025 purchase of 8,888 BTC for $1 billion and Metaplanet adding 5,268 BTC for $615 million, bringing its total holdings to 30,823 BTC, while Strategy reported buying 196 Bitcoin at an average of $113,048. On the market infrastructure side, Chainlink and UBS’s announcement of a partnership to advance tokenization of the $100 trillion fund industry via Swift Workflow supported expectations of institutional integration.
On the regulatory front, the SEC’s evaluation of a model that could allow stocks to be traded in a manner similar to crypto assets and the US Treasury Department’s exemption of Bitcoin and other crypto assets from the 15% rate under the corporate alternative minimum tax were read as signals that reduced some of the uncertainty and strengthened risk appetite. On the macro side, the below-expected private sector employment report in the US increased the pricing for the possibility of two 25 basis point cuts this year, and although the official government shutdown with the economic impact warning from the White House if the shutdown is prolonged and the Treasury’s negative impact on GDP created a cautious background, institutional purchases, tokenization agenda and policy signals dominated the overall picture. As a result, the Fear&Greed index has risen significantly from last week’s level of 28 to 63, indicating that sentiment has shifted from fear to cautious optimism.
Fund Flows
Source: Coin Shares
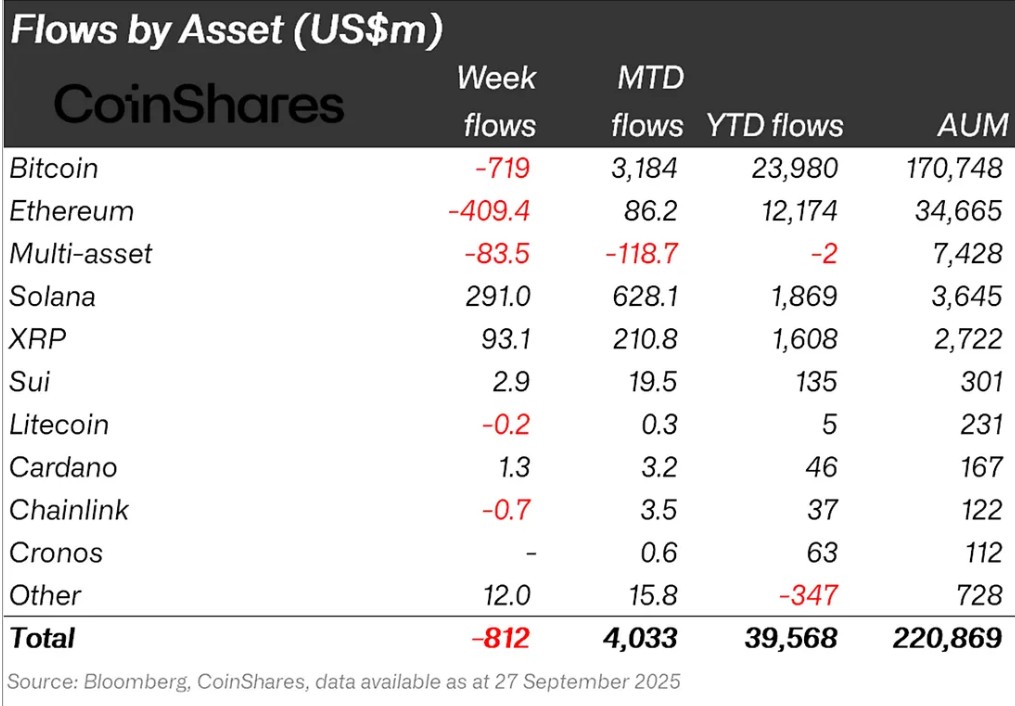
Overview Cryptocurrency markets entered a bullish week after the US House of Representatives adjourned. In particular, US President Donald Trump’s positive statements towards the markets strengthened the bullish environment in the markets. With the impact of these developments, Bitcoin gained about 5% during the week.
Ripple (XRP): Fund inflows in Xrp this week totaled $93.1 million.
SUI: 21Shares applied for a spot SUI ETF in the US after its success in Europe. There were inflows of about $2.9 million from Sui this week.
Solana (SOL): Morgan Stanley announced that it will allow Solana transactions in the first half of 2026 thanks to its partnership with Zerohash. Solana saw inflows of $127.3 million.
Cardano (ADA): Cardano saw inflows of $1.13million this week.
Chainlink (LINK): Chainlink continues to strengthen its potential by providing reliable data and updates to the Tokenization and DeFi space. Link saw inflows of $1.9 million this week.
Other: Sectoral and project-based rallies in altcoins led to $12.0 million in inflows in fund flow data in the general market impression.
Fund Outflows:
Bitcoin (BTC): Bitcoin continues to gain this week despite the outflows observed at the investor point. Although the interest rate cut in global markets and the closure of parliament reflected positively on crypto markets, outflows were observed. In this week alone, Bitcoin-focused funds saw outflows of $719 million.
Ethereum (ETH): This week, Ethereum saw outflows of $409.4 million as spot ETH declined.
Multi-asset: Outflows were observed in the multi-asset group.
Chainlink (LINK): Chainlink Steadefi joined the Chainlink BUILD program, which will allow it to leverage infrastructure such as data feeds and automation services.Link saw outflows of $0.7 million this week.
Litecoin (LTC): LTC coin saw $0.2 million outflows.
Total MarketCap
Source: Tradingview
- Market Capitalization Last Week: 82 Trillion Dollars
- Market Capitalization This Week: 07 Trillion Dollars
This week, the cryptocurrency market grew by about $254 billion, gaining 6.65% and the total market capitalization reached $4.07 trillion. The weekly peak was recorded as 4.12 trillion dollars and the lowest level was recorded as 3.78 trillion dollars. Thus, the market moved within a band of about 330 billion dollars. This chart shows that market volatility remained largely stable compared to last week. The market needs to appreciate just 2.35% from its current position to reach an all-time high of $4.17 trillion.
Total 2
Total 2 started the week with a market capitalization of $1.58 trillion and rose by 6.17% during the week to $1.68 trillion, up by about $97 billion. The high for the week was $1.7 trillion and the low was $1.55 trillion. The index moved within a wide volatility band totaling $150 billion. This situation reveals that Total 2 has started to follow a more volatile course in recent weeks. With the recent rally, the index is now above its 2024 peak and on track for a previous high of $1.74 trillion.
Total 3
Total 3 started the week with a market capitalization of $1.08 trillion and rose by 5% during the week, gaining about $55 billion in value. It closed the week at $1.14 trillion. There was a 9.37% difference between the highs and lows for the week. With this ratio, the Total 3 index regained the title of “most volatile index” this week, which it lost last week.
While the market was generally positive, it was noteworthy that the Total Market index had the strongest performance. This shows that Bitcoin has regained its market leadership and maintained its fundamental weight in the crypto ecosystem. On the other hand, when comparative performances are analyzed, it is seen that the decline in Ethereum’s market share in recent weeks has reversed this week. It seems that Ethereum has started to increase its market dominance again.
Altcoin Season Index
Source: Coinmarketcap
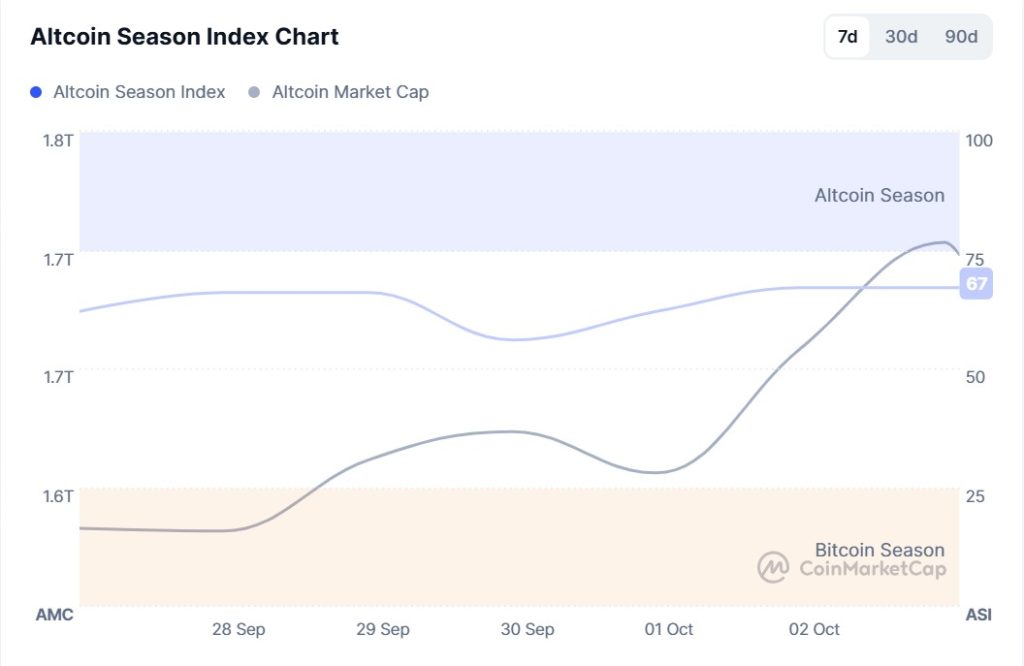
- Last Week Index Value: 72/100
- Index Value This Week: 67/100
Between September 26 and October 3, 2025, the correlation between the market capitalization of altcoins (Altcoin Market Cap) and the Altcoin Season Index has been on the rise. The chart shows that this week, the Altcoin Market Cap reached 1.74T, with a high of 67 on October 2. This signals a rise in the market dominance of altcoins. The top 5 coins that led the index higher this week were MYX, M, Aster, XPL, OKB. Between September 26 and October 3, the index fell from 72 to 63, indicating the potential for a short-lived bearish altcoin season and a relative decline in the total market capitalization of altcoins compared to Bitcoin.
Bitcoin Dominance
Bitcoin Dominance
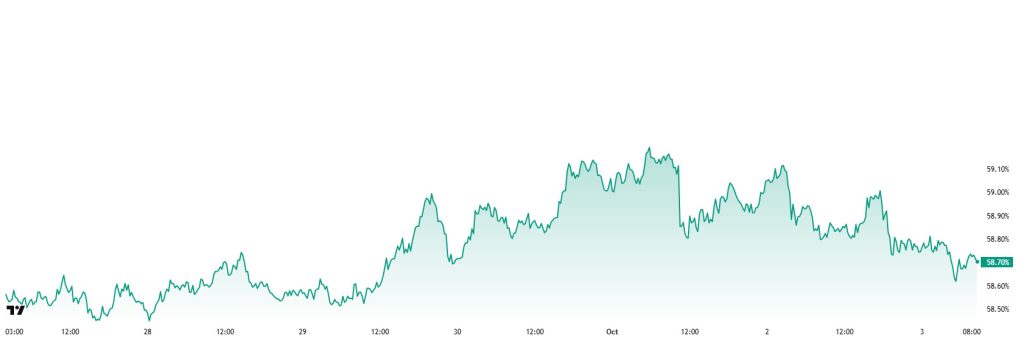
Bitcoin dominance, which started the week at 58.54%, increased to 59.19% during the week, but then retreated slightly and is currently at 58.70%.
This week, Strategy bought 196 Bitcoin, Metaplanet bought 5,268 Bitcoin and Capital B bought 12 Bitcoin. Data on Bitcoin spot ETFs shows a total net inflow of $2.25 billion to date.
Markets are positively pricing the FED’s interest rate cut of 50 basis points this year and 75 basis points in 2026. While this development on the US side increased the risk appetite of retail investors and paved the way for net inflows in spot ETFs, positive flows are also observed on the institutional investor side.
Bitcoin-focused capital inflows have been increasing as a result of the recent positive developments in the market. Moreover, Bitcoin has been outperforming Ethereum and other altcoins in this process. BTC dominance is expected to remain strong if institutional investors continue their purchases and ETF inflows continue to increase, but a decline in dominance may occur if Ethereum and other altcoins decouple on a price basis. This creates an expectation of a decline in Bitcoin’s market dominance, with Bitcoin dominance expected to hover in the 57% – 60% range next week.
Ethereum Dominance
Source: Tradingview
Weekly Change
- Last Week’s Level: 13.10%
- This Week’s Level: 13.25%
Ethereum dominance, which rose to 15% in mid-August, lost its momentum in the following period and entered a downward trend and retreated to 12.50%. This negative outlook has partially lost its effect as of the current week and has been replaced by a positive momentum.
Accordingly, Ethereum dominance ended last week at 13.10% and is trading at around 13.25% in the light of current data. Similar to Ethereum, Bitcoin dominance also followed a positive course and exhibited an upward trend during the same period.
When the main developments affecting Ethereum dominance are analyzed, the prominent headlines are as follows:
SEC decision: The US Securities and Exchange Commission (SEC) allowed investment advisors to store crypto assets in state-approved trust companies. This decision provides long-awaited regulatory clarity on the custody of digital assets and allows assets such as Bitcoin and Ethereum to be held securely within a legal framework. There is no risk of sanctions as long as compliance conditions are met.
Ethereum Applications Alliance (EAG): Ethereum founder Vitalik Buterin announced the creation of the Ethereum Applications Alliance, which aims to move the ecosystem from an infrastructure-driven phase to an application-driven phase. This initiative aims to bring together developers, researchers and institutions to create a sustainable and transparent collaboration mechanism on Ethereum.
VanEck application: VanEck has filed for a Lido Staked Ethereum ETF in Delaware. The formal filing with the SEC is expected to take place in the near future. This initiative demonstrates the growing interest and popularity of staking products among institutional investors.
Bitcoin Spot ETF
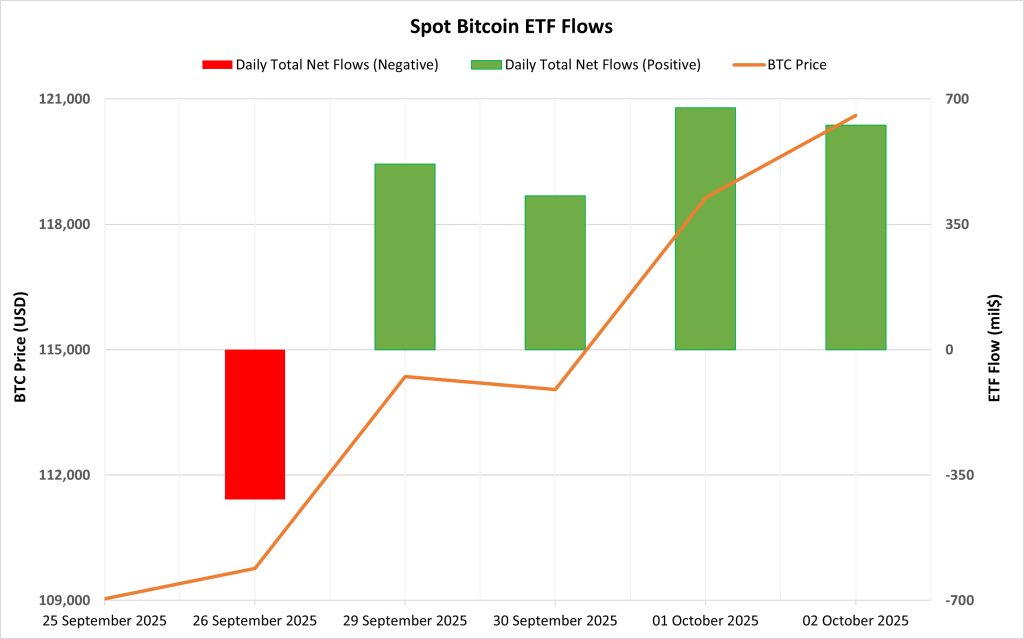
NetFlow Status: Between September 26 and October 02, Spot Bitcoin ETFs saw a total net inflow of $1.83 billion. While there was an outflow of 418.3 million dollars on September 26, positive net flows were seen in the next four trading days in a row. On a fund basis, BlackRock IBIT stood out with a net inflow of $ 987.5 million.
Bitcoin Price: Bitcoin, which opened at $109,040 on September 26, closed at $120,606 on October 2. In this process, the Bitcoin price rose by 10.61%. Strong fund inflows, especially on October 1 and October 2, supported the price upwards.
Cumulative Net Inflows: By the end of the 433rd trading day, cumulative total net inflows into Spot Bitcoin ETFs rose to $59.03 billion.
| Date | Coin | Open | Close | Change % | ETF Flow (mil $) |
|---|---|---|---|---|---|
| 26-Sep-2025 | BTC | 109,040 | 109,766 | 0.67% | -418.3 |
| 29-Sep-2025 | BTC | 112,348 | 114,356 | 1.79% | 518 |
| 30-Sep-2025 | BTC | 114,356 | 114,051 | -0.27% | 429.9 |
| 01-Oct-2025 | BTC | 114,051 | 118,640 | 4.02% | 675.8 |
| 02-Oct-2025 | BTC | 118,640 | 120,606 | 1.66% | 627.2 |
| Total for 26 Sep – 02 Oct 2025 | 10.61% | 1832.6 | |||
Between September 26 and October 2, despite the outflow on the first trading day, the direction turned positive again with strong inflows on the last two trading days of September and the first two trading days of October. Net inflows totaling around $1.83 billion were particularly concentrated around IBIT, FBTC and ARKB. This picture indicates that institutional demand remains buoyant. The continuation of positive flows in the coming period may continue to create an upward support on the BTC price. On the contrary, if the outflows become evident again, bullish attempts may be limited and pressure on the price may increase.
Ethereum spot ETF
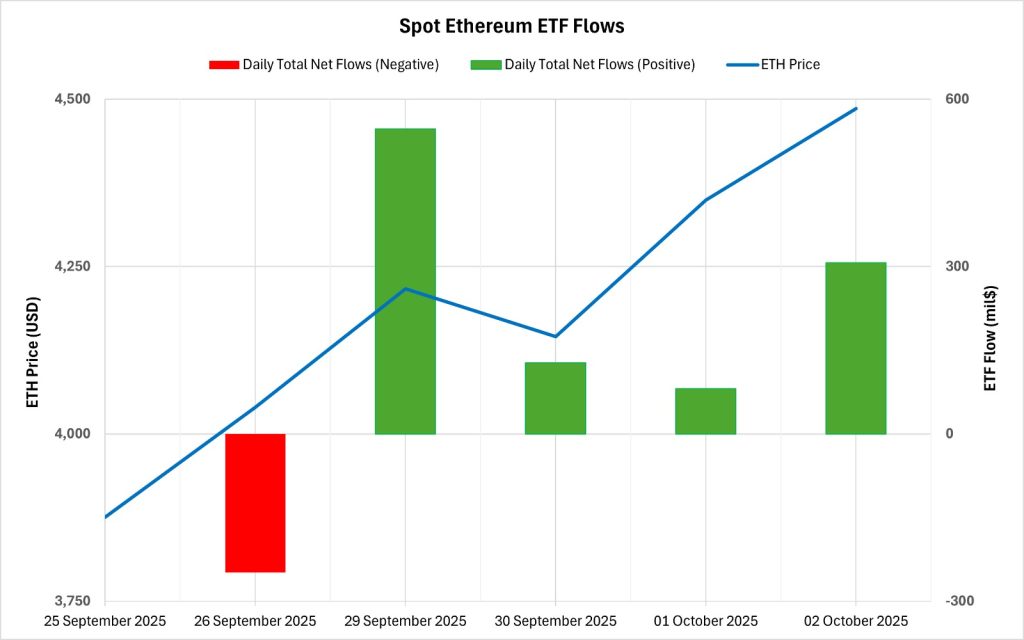
Between September 26 and October 02, 2025, Spot Ethereum ETFs saw a total net inflow of $814 million. The strongest inflow on a daily basis was $546.9 million on September 29. On a fund basis, BlackRock ETHA stood out with net inflows of $285.1 million and Fidelity FETH $225.3 million. Spot Ethereum ETFs saw cumulative net inflows rise to $14.20 billion at the end of the 301st trading day, with positive flows in the last four trading days in a row.
| Date | Coin | Open | Close | Change % | ETF Flow (mil $) |
|---|---|---|---|---|---|
| 26-Sep-2025 | ETH | 3,875 | 4,040 | 4.24% | -248.4 |
| 29-Sep-2025 | ETH | 4,150 | 4,217 | 1.61% | 546.9 |
| 30-Sep-2025 | ETH | 4,217 | 4,145 | -1.69% | 127.5 |
| 01-Oct-2025 | ETH | 4,145 | 4,350 | 4.93% | 80.9 |
| 02-Oct-2025 | ETH | 4,350 | 4,486 | 3.14% | 307.1 |
| Total for 26 Sep – 02 Oct 2025 | 15.76% | 814.0 | |||
Ethereum price started at $3,875 on September 26 and closed at $4,486 on October 2, rising 15.76% in this period. Fund inflows, especially in the last four trading days, have been one of the main factors supporting the upward momentum of the price. The end of the negative flow series and the resumption of a synchronized rise between price and flows showed that institutional investor interest remains strong. Continued positive inflows in the coming period may support Ethereum’s positive market trend. However, if flows turn negative again, the supportive effect of ETFs on the price may weaken.
Bitcoin Options Distribution
Source: Laevitas
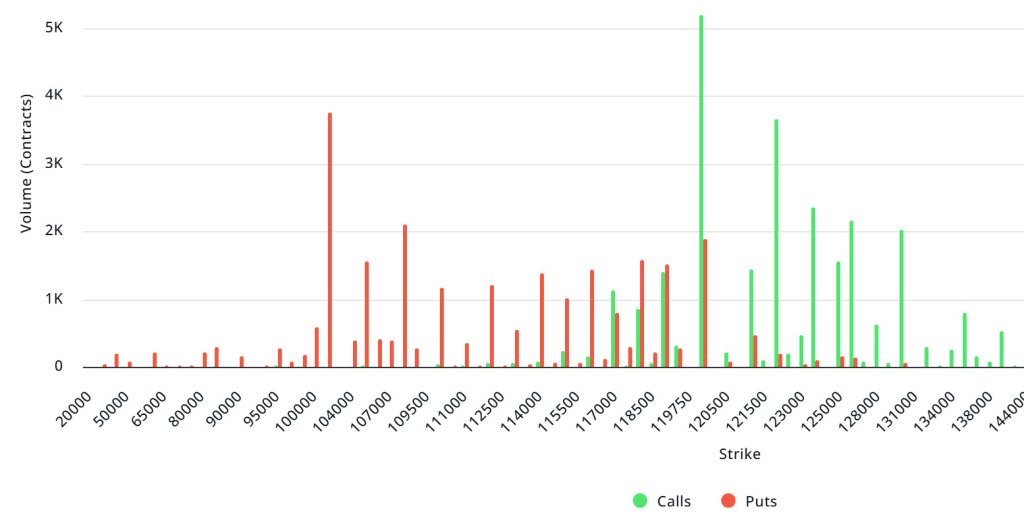
BTC: Notional: $3.37B | Put/Call: 0.91 | Max Pain: $115K
Deribit Data: Deribit data shows that BTC options contracts with a notional value of approximately $3.37 billion expired today. At the same time, according to the data in the last 24 hours, if we look at the risk conversion in the next 1 week, call options are the dominant side in hedging more than put options. When we examine the expected volatility (IV), it is above the realized volatility (RV). On the other hand, the positive spread metric indicates that the market has an appetite. Skew values are bullish today but slightly bearish next week.
Laevitas Data: When we examine the chart, it is seen that put options are concentrated in a wide band between 103,000 – 120,000 dollars. Call options are concentrated between $ 119,000 and $ 130,000 and the concentration decreases towards the upper levels. At the same time, the level of approximately 108,000 dollars is seen as support and 120,000 dollars as resistance. On the other hand, there are 3.74K put options at the $103,000 level, where there is a peak and there is a decrease in put volume after this level. However, it is seen that 5.19K call option contracts peaked at the $120,000 level. When we look at the options market, we see that call contracts are dominant on a daily and weekly basis.
Option Maturity:
Put/Call Ratio and Maximum Pain Point: If we look at the options in the last 7 days data from Laevitas, the number of call options decreased by about 25% compared to last week and amounted to 110.96K. In contrast, the number of put options decreased by 27% compared to last week to 89.79K. The put/call ratio for options was set at 0.91. This indicates that call options are much more in demand among traders than put options. Bitcoin’s maximum pain point is seen at $115,000. It can be predicted that BTC is currently priced at $119,500 as of and if it does not break the $115,000 level downwards, which is the pain point, the rises will continue.
Ethereum Options Distribution
Source: Laevitas
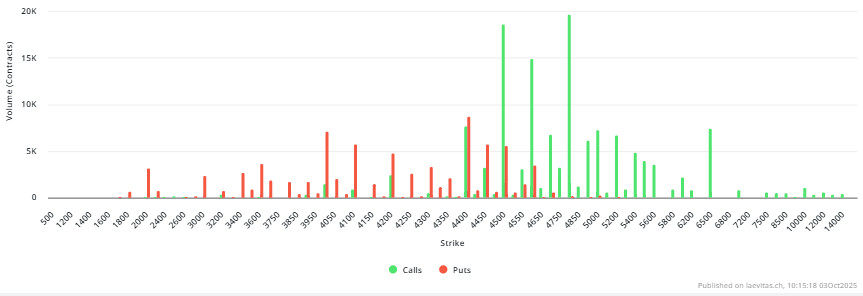
ETH: $0.98 B notional | Put/Call: 0.49 | Max Pain: $4,200
Laevitas Data: Looking at the data in the chart, we see that put options are particularly concentrated at the price levels between $4,400 and $4,600. The highest put volume is at $4,400 with around 9K contracts and this level can be considered as a possible support zone. On the other hand, there is a remarkable concentration in call options between $4,500 and $4,800. Especially the $4,800 level stands out with a high call volume of about 20K contracts. This level can be considered as an important resistance zone in the market.
Deribit Data: ATM volatility is at 48.45%, down 7.09% in the last 24 hours. This tells us that the market’s short-term risk appetite is decreasing while creating pressure on option premiums. The 25 delta risk reversal (RR) is in positive territory at 2.43, up 2.43% on a daily basis, suggesting that demand for call options is stronger than for puts. However, 25 delta butterfly (BF) fell 0.91% to 0.91, indicating symmetry pressure on the volatility curve.
On the volume side, calls amounted to $50.79M and puts to $45.41M. When we look at the daily change rates, there is a 463% increase in call volume and a 45% increase in put volume. The total 24-hour options volume reached $96.2M, an increase of 495%. Open interest (OI) stood at $119.13M, up 262% on a daily basis, reflecting strong new position inflows into the market. Overall, the market is neutral to slightly bullish. Positive RR and strong increase in call volume support the upside risk appetite, while the decline in ATM vol suggests that there is no panic mood in the market and pricing is more balanced.
Option Expiry:
Ethereum options with a notional value of $0.98 billion expired on October 3. The Max Pain level is calculated at $4,200, while the put/call ratio stands at 0.49.
Legal Notice
The investment information, comments and recommendations contained in this document do not constitute investment advisory services. Investment advisory services are provided by authorized institutions on a personal basis, taking into account the risk and return preferences of individuals. The comments and recommendations contained in this document are of a general type. These recommendations may not be suitable for your financial situation and risk and return preferences. Therefore, making an investment decision based solely on the information contained in this document may not result in results that are in line with your expectations.


