Weekly Bitcoin Onchain Report
Active Addresses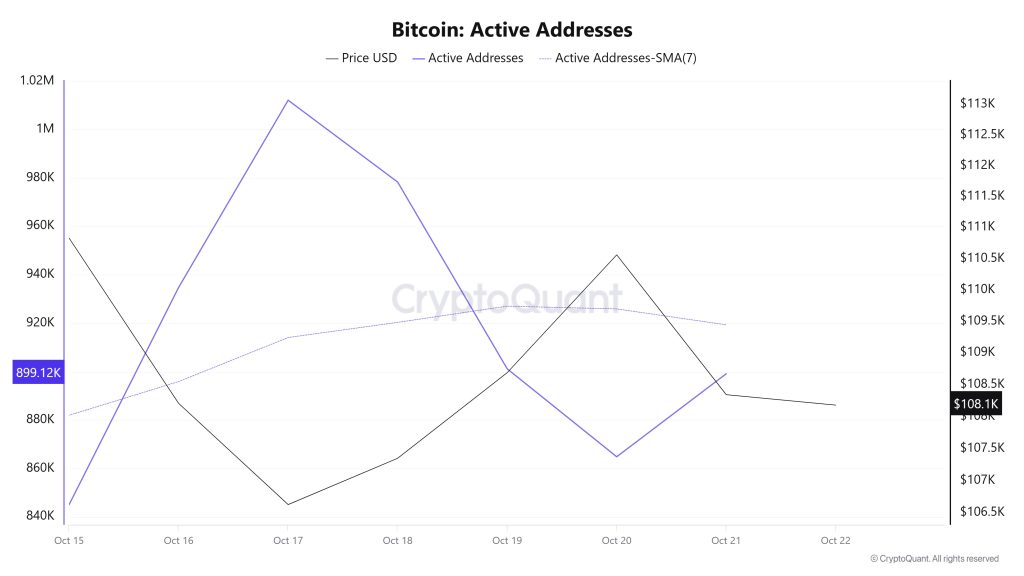
Between October 15 and October 22, 1,012,135 active addresses were added to the Bitcoin network ( ). During this period, the Bitcoin price rose to $110,000. While the number of active addresses increased on October 15-16, the Bitcoin price fell to $106,000. From a technical perspective, the downward movement of the 7-day simple moving average (SMA) is noteworthy. This technical signal indicates that there is selling pressure on the market.
Active Sending Addresses
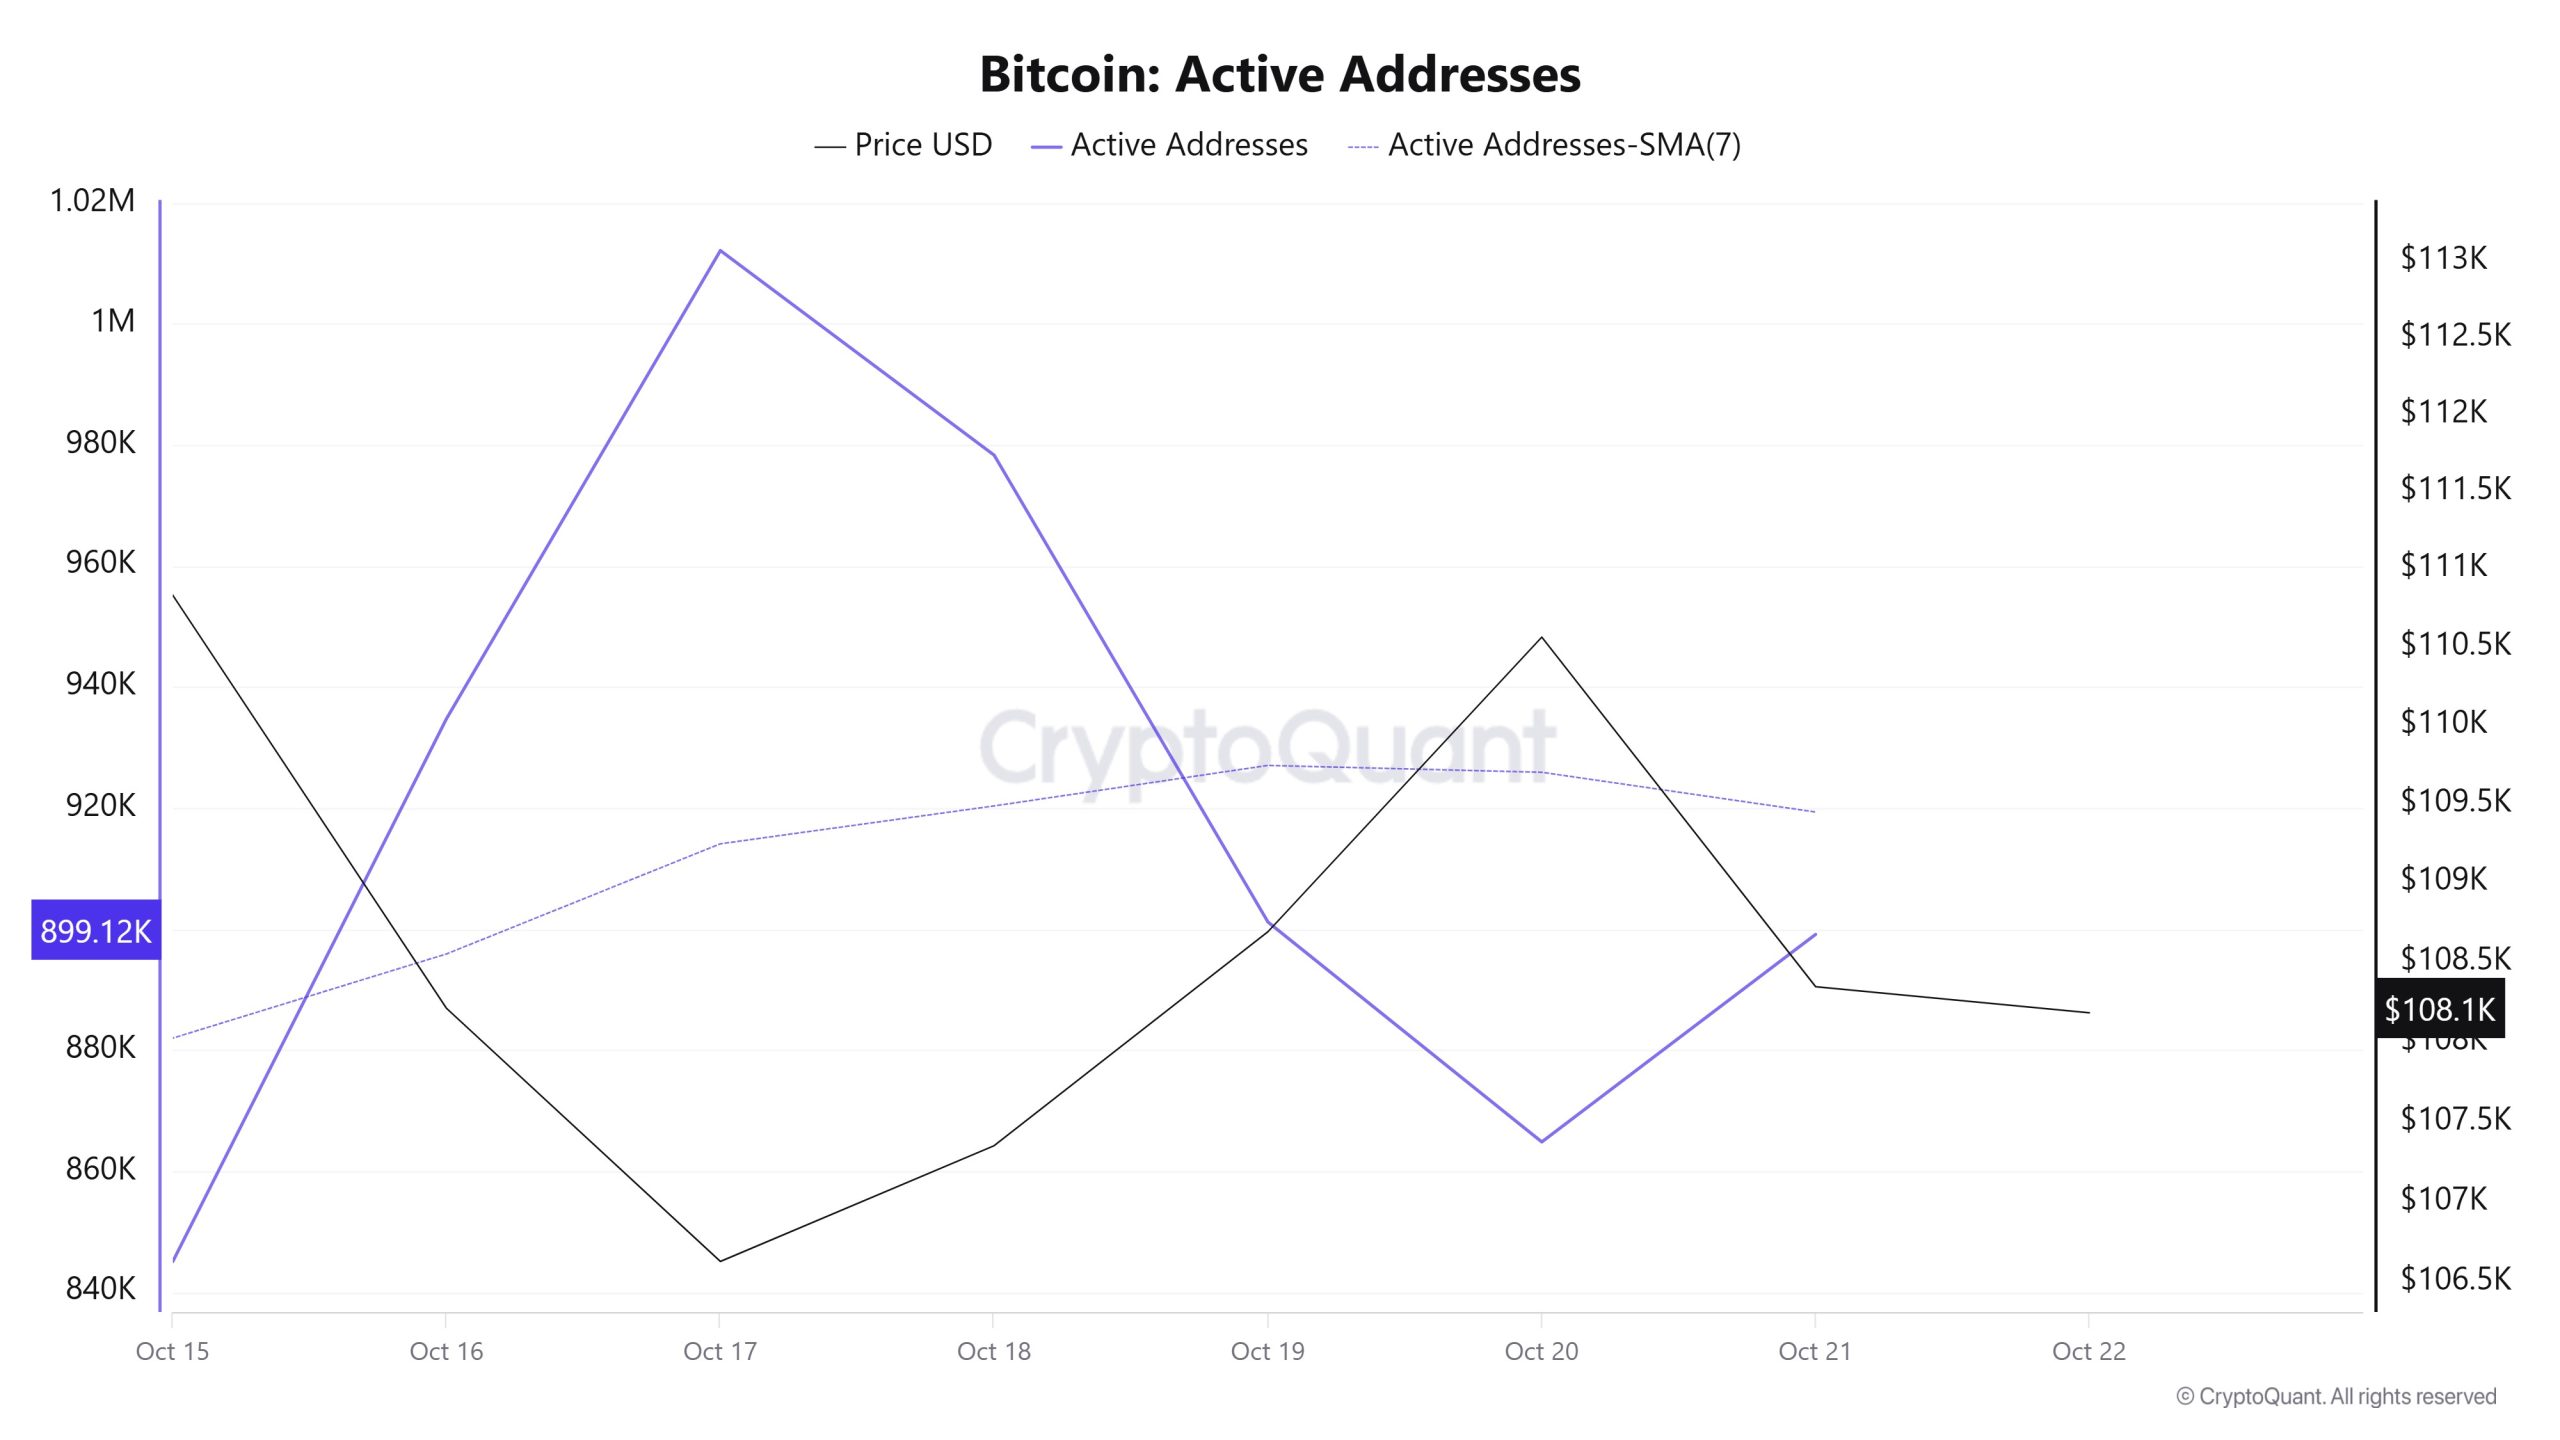
Between October 15 and October 22, an upward trend was observed in the “active sending addresses” metric. On the day the price reached its highest level, this metric stood at 666,389, indicating that user activity on the Bitcoin network was moving in parallel with the price. This data indicates that the $110,000 level is supported not only by price but also by on-chain address activity, as shown at . Overall, the Active Sending Addresses metric followed a high trajectory during this period.
Active Receiving Addresses
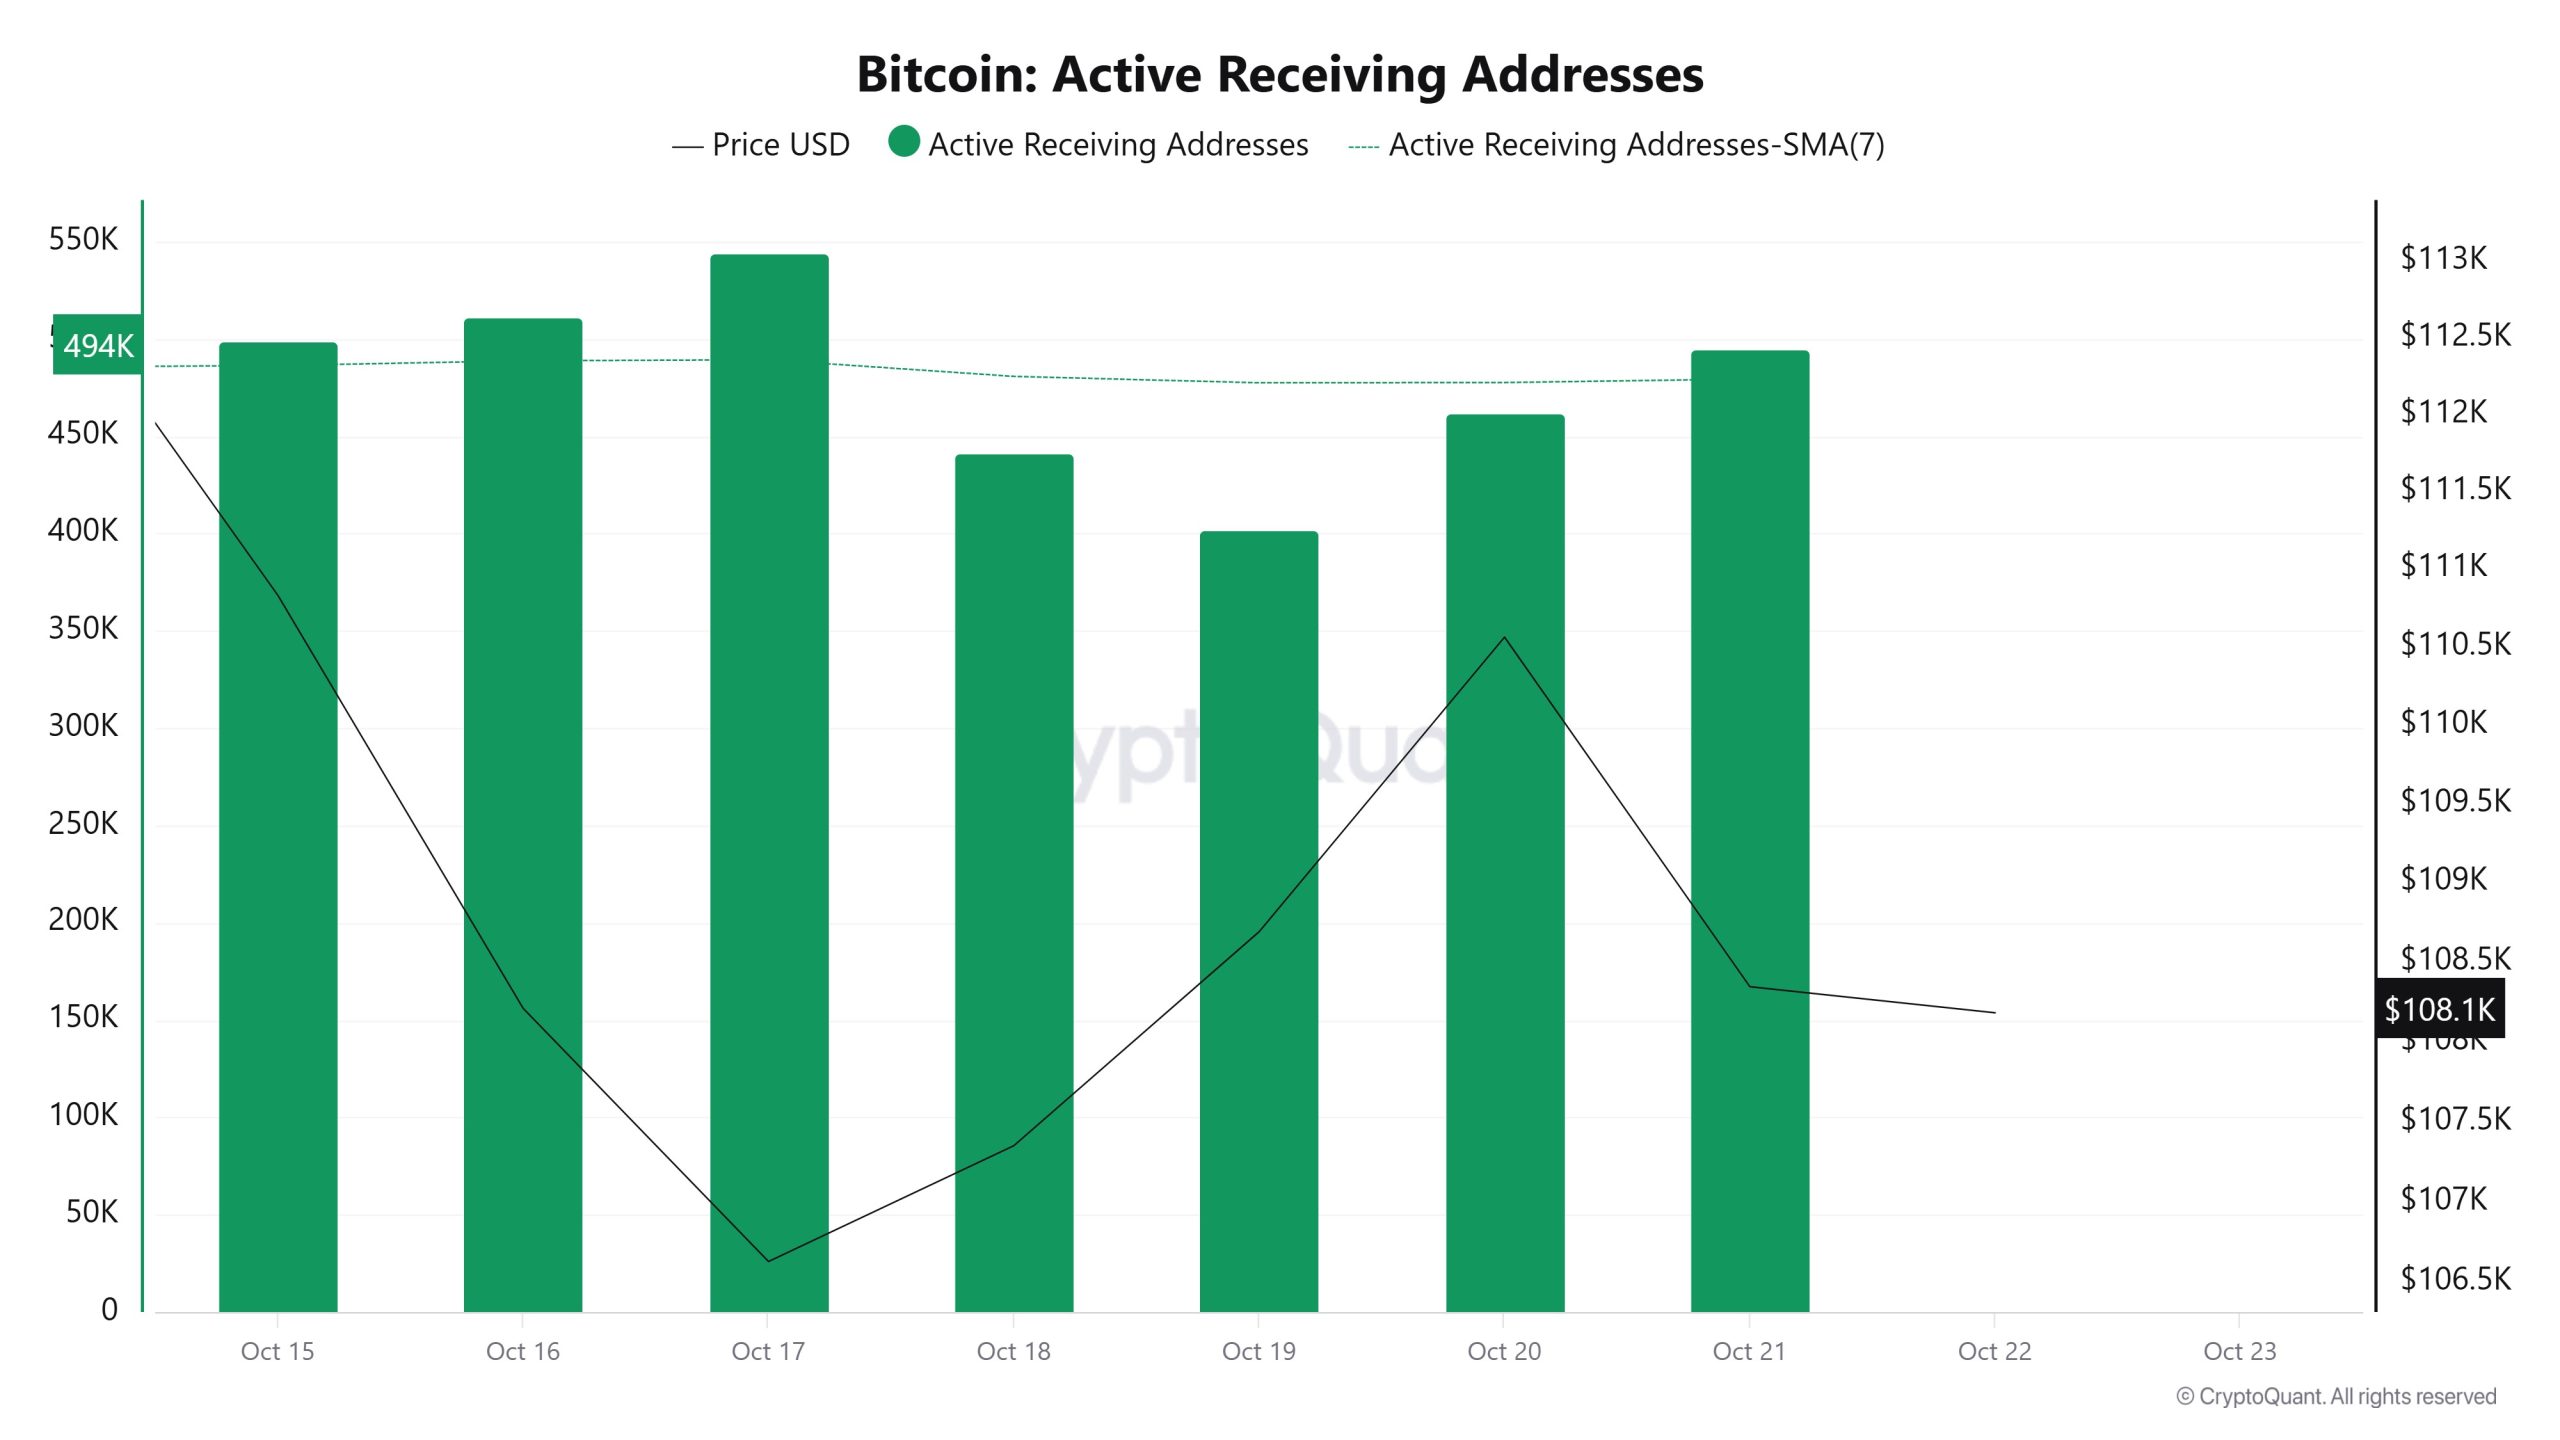
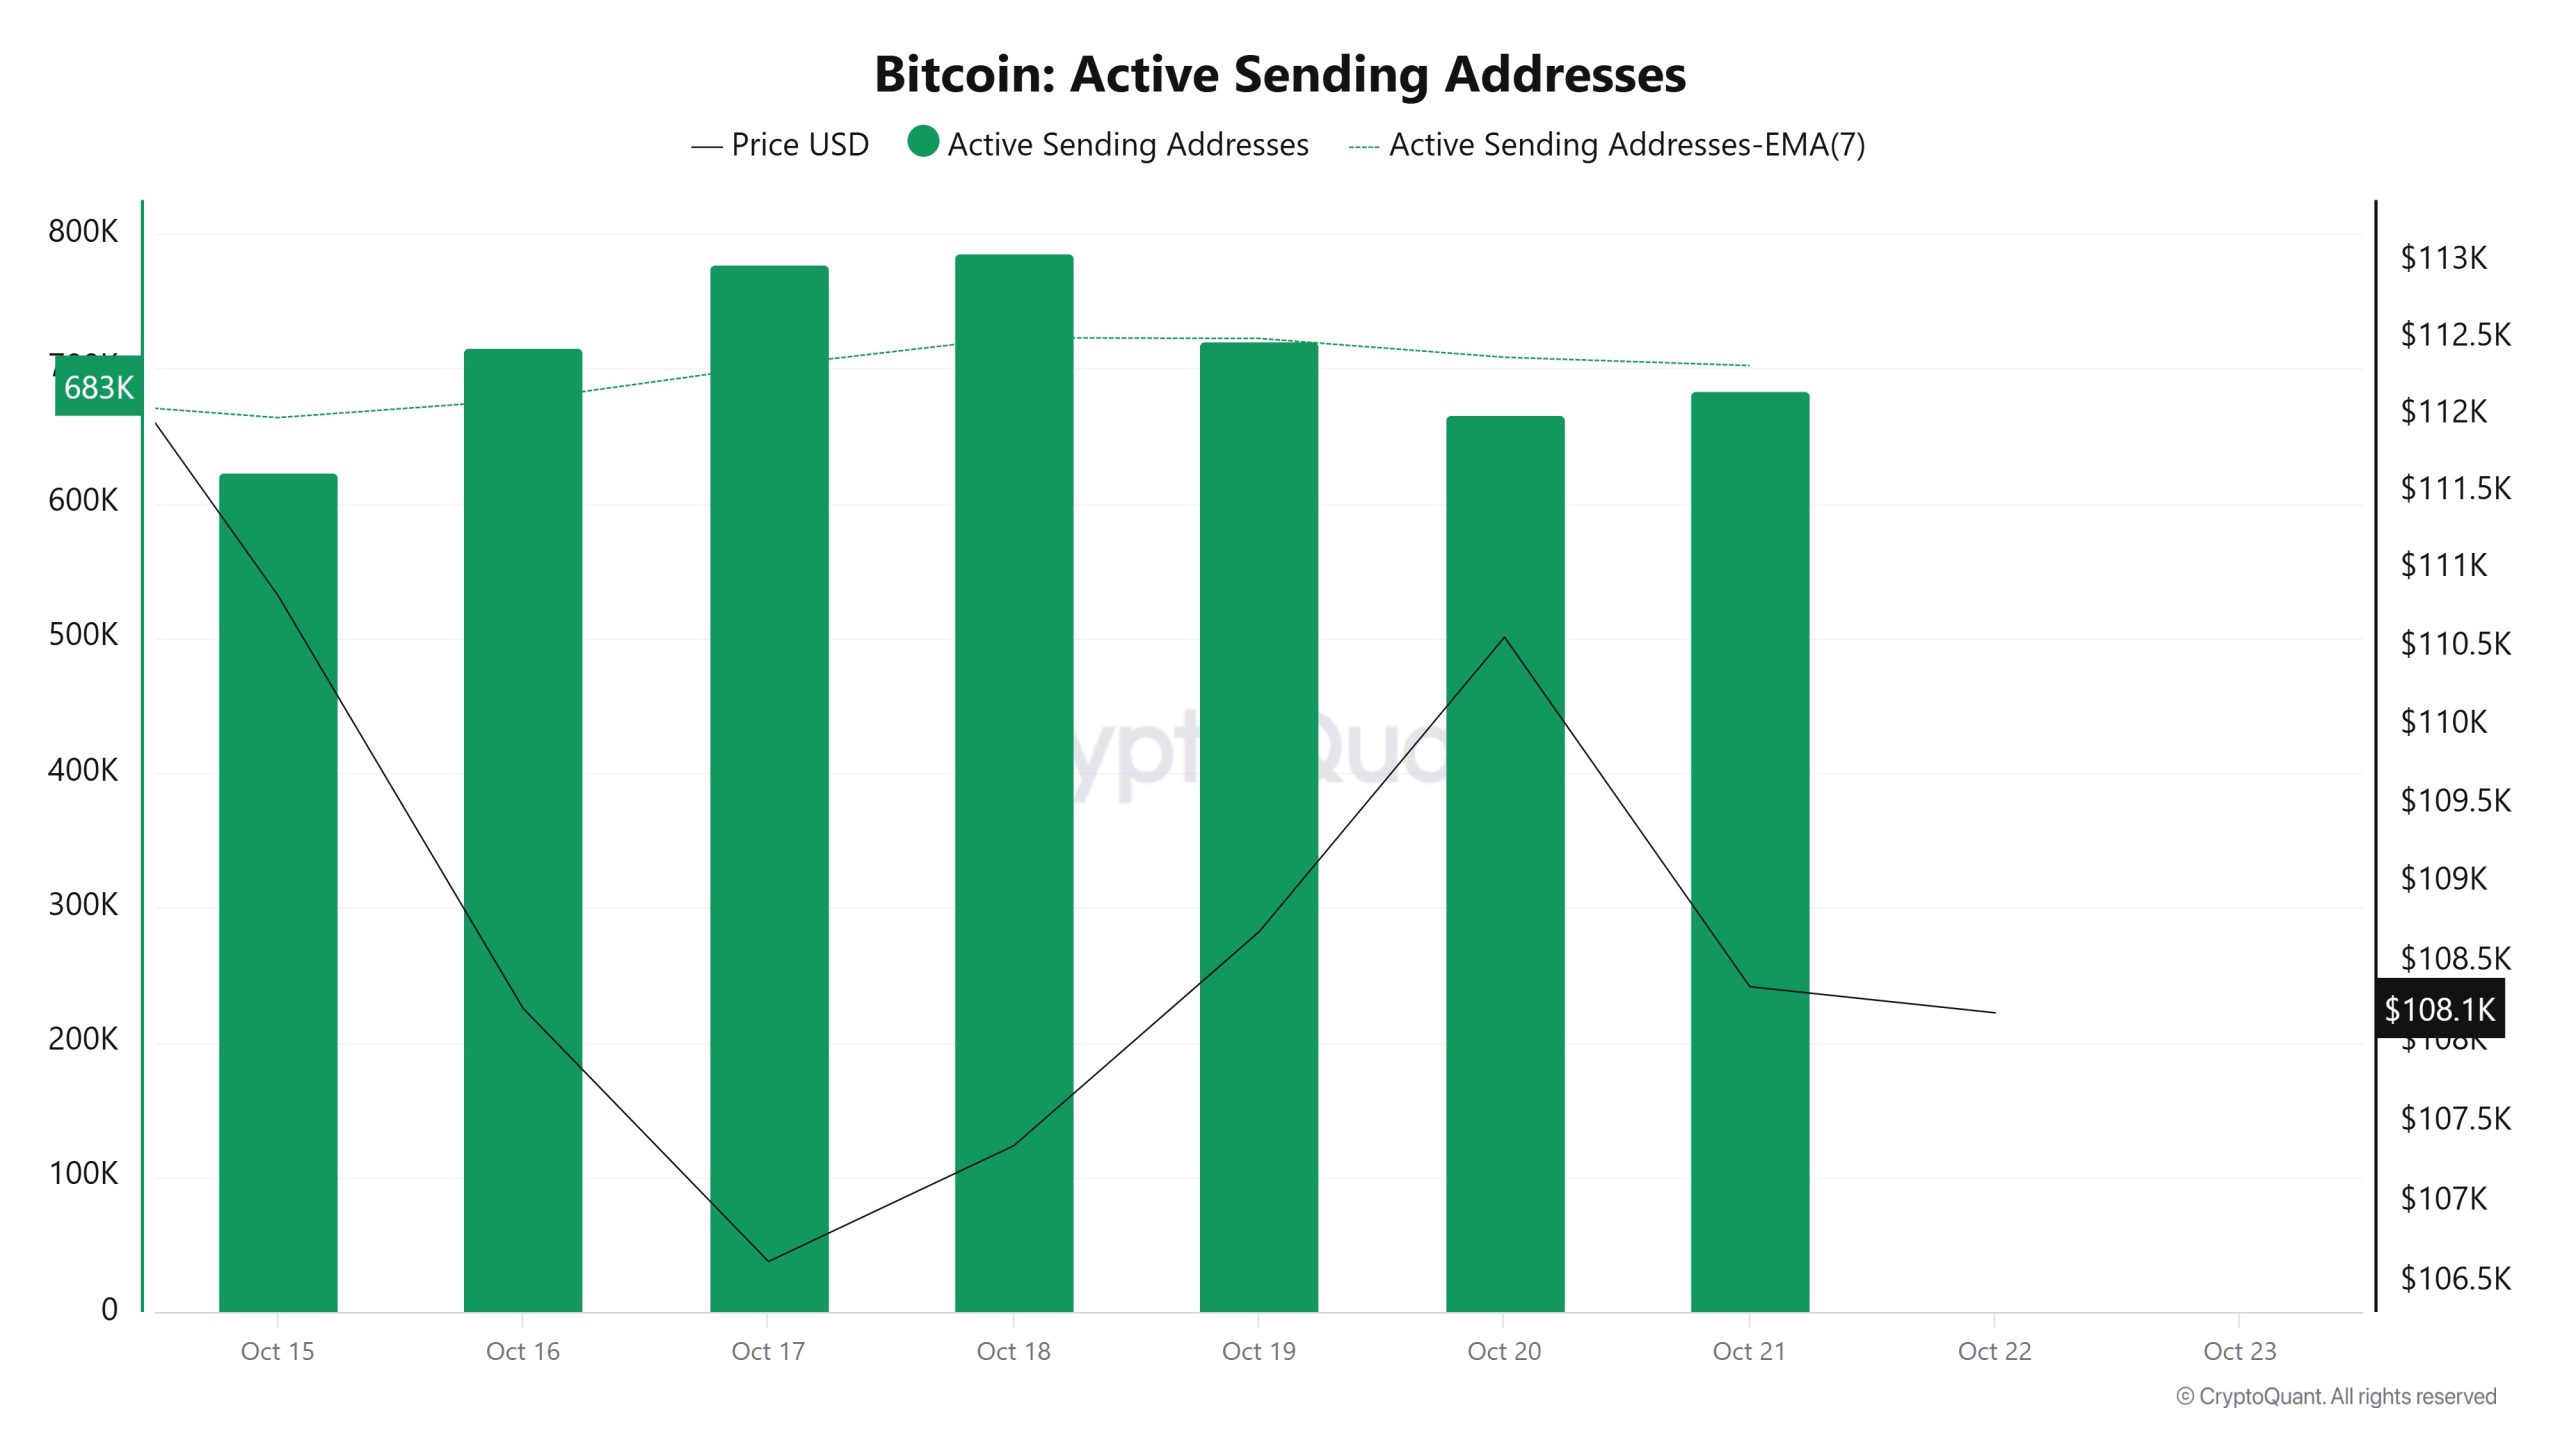
Between October 15 and October 22, active receiving addresses experienced a normal increase along with the Black Line (price line). On the day the price reached its peak, active receiving addresses rose to 544,206 levels, indicating that buyers purchased Bitcoin at around $112,000 levels.
“Bitcoin Active Receiving Addresses – Image to be added”
Breakdowns
MVRV
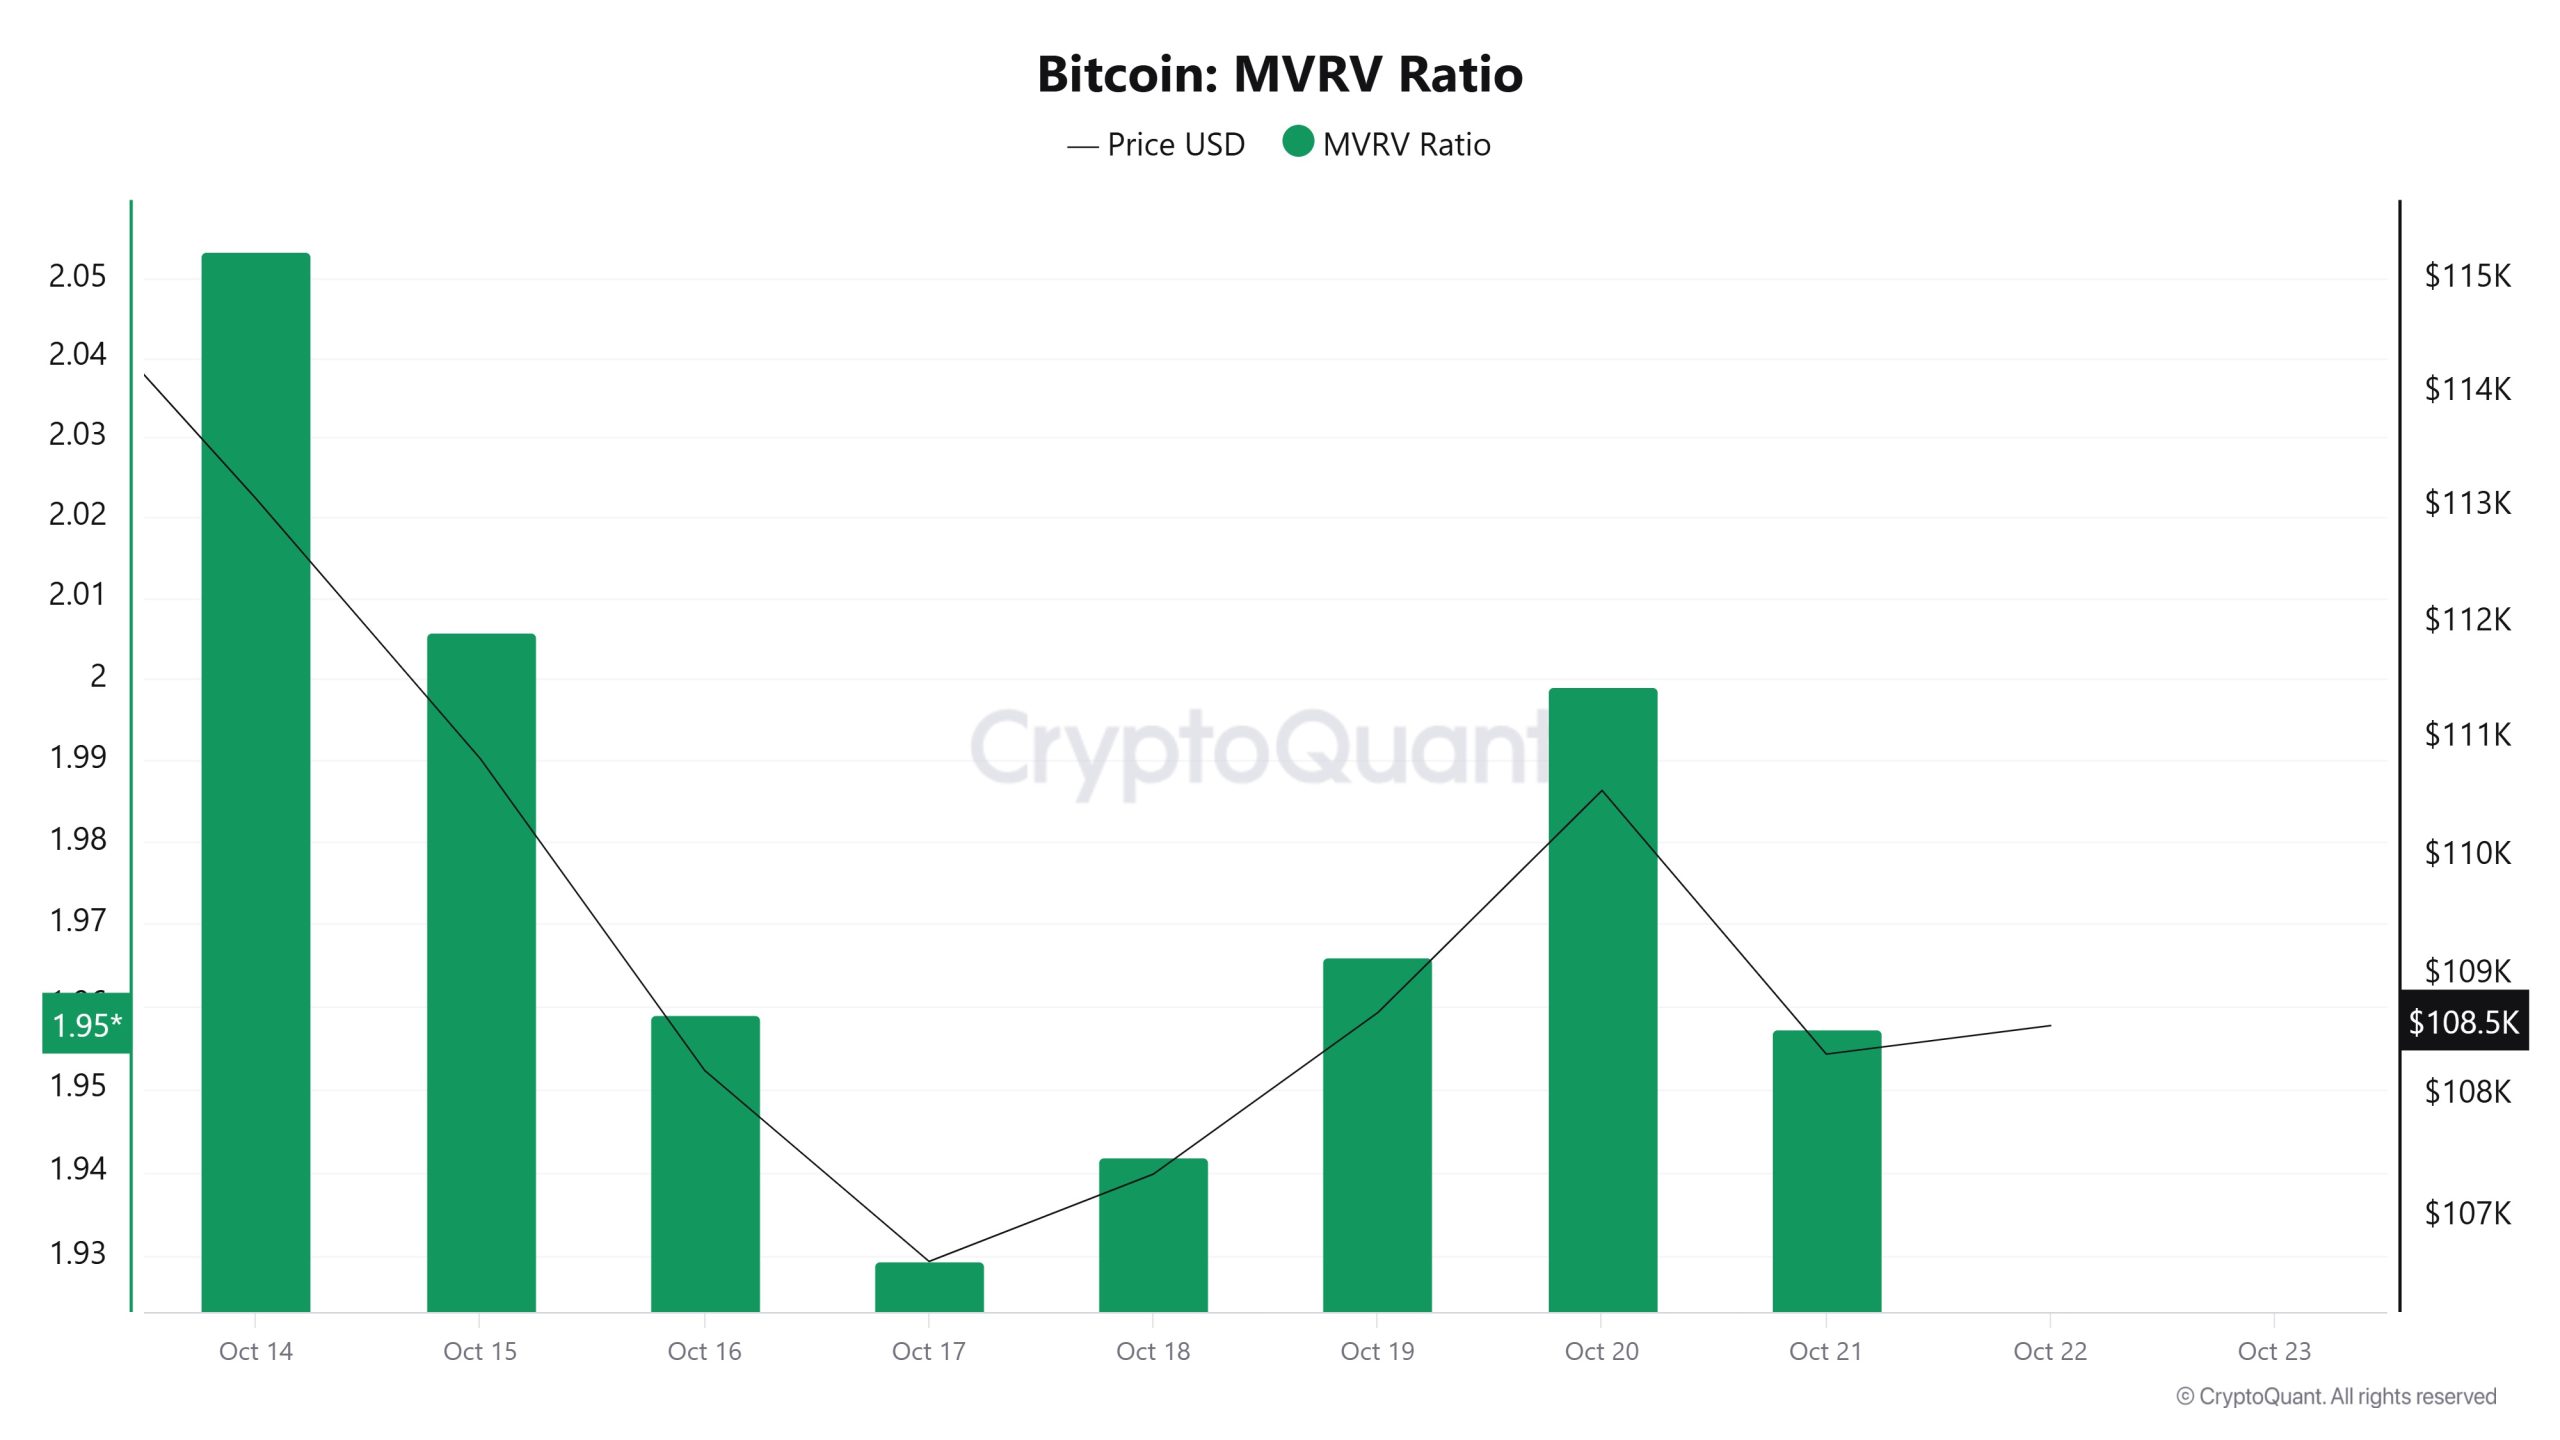
On October 15, when the Bitcoin price was $110,831, the MVRV Ratio was at 2.005.
As of October 21, the Bitcoin price fell to $108,344, recording a 2.24% decline, while the MVRV Ratio fell to 1.957, recording a 2.39% decline.
Realized Price
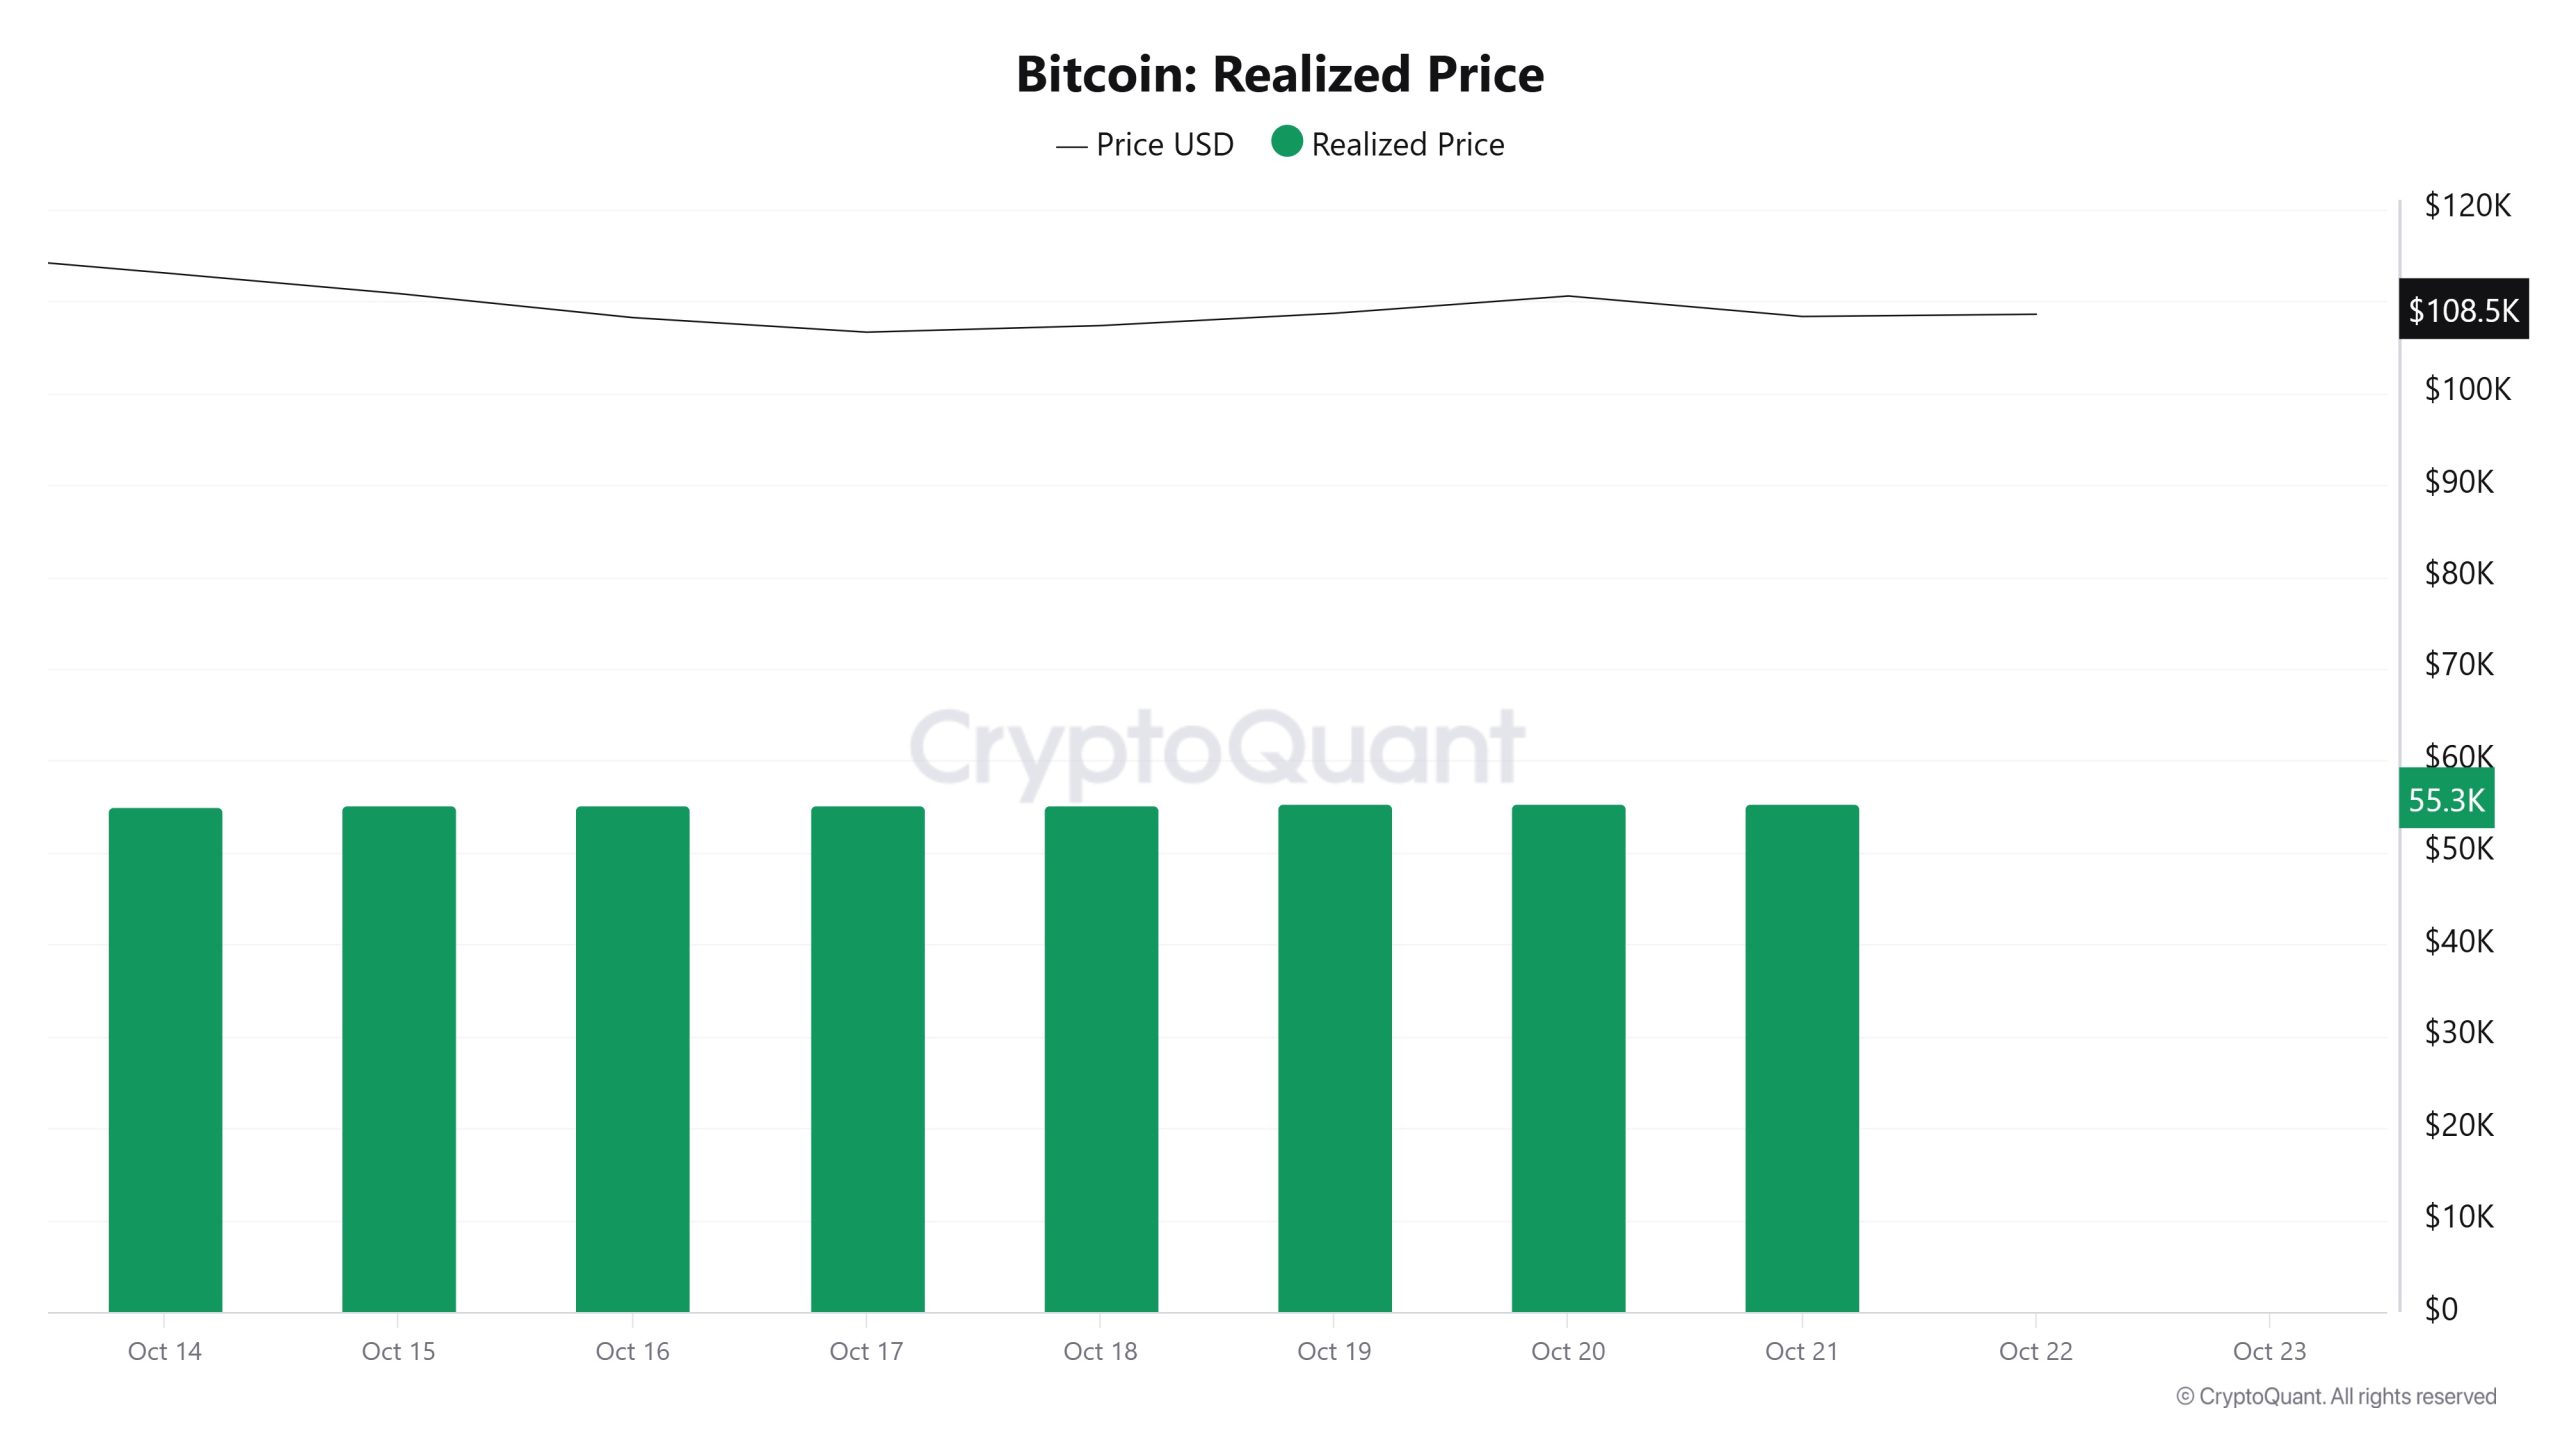
On October 15, while the Bitcoin price was at $110,831, the Realized Price stood at $55,257.
As of October 21, the Bitcoin price fell to $108,344, while the Realized Price rose to $55,354, recording a 0.18% increase.
Spent Output Profit Ratio (SOPR)
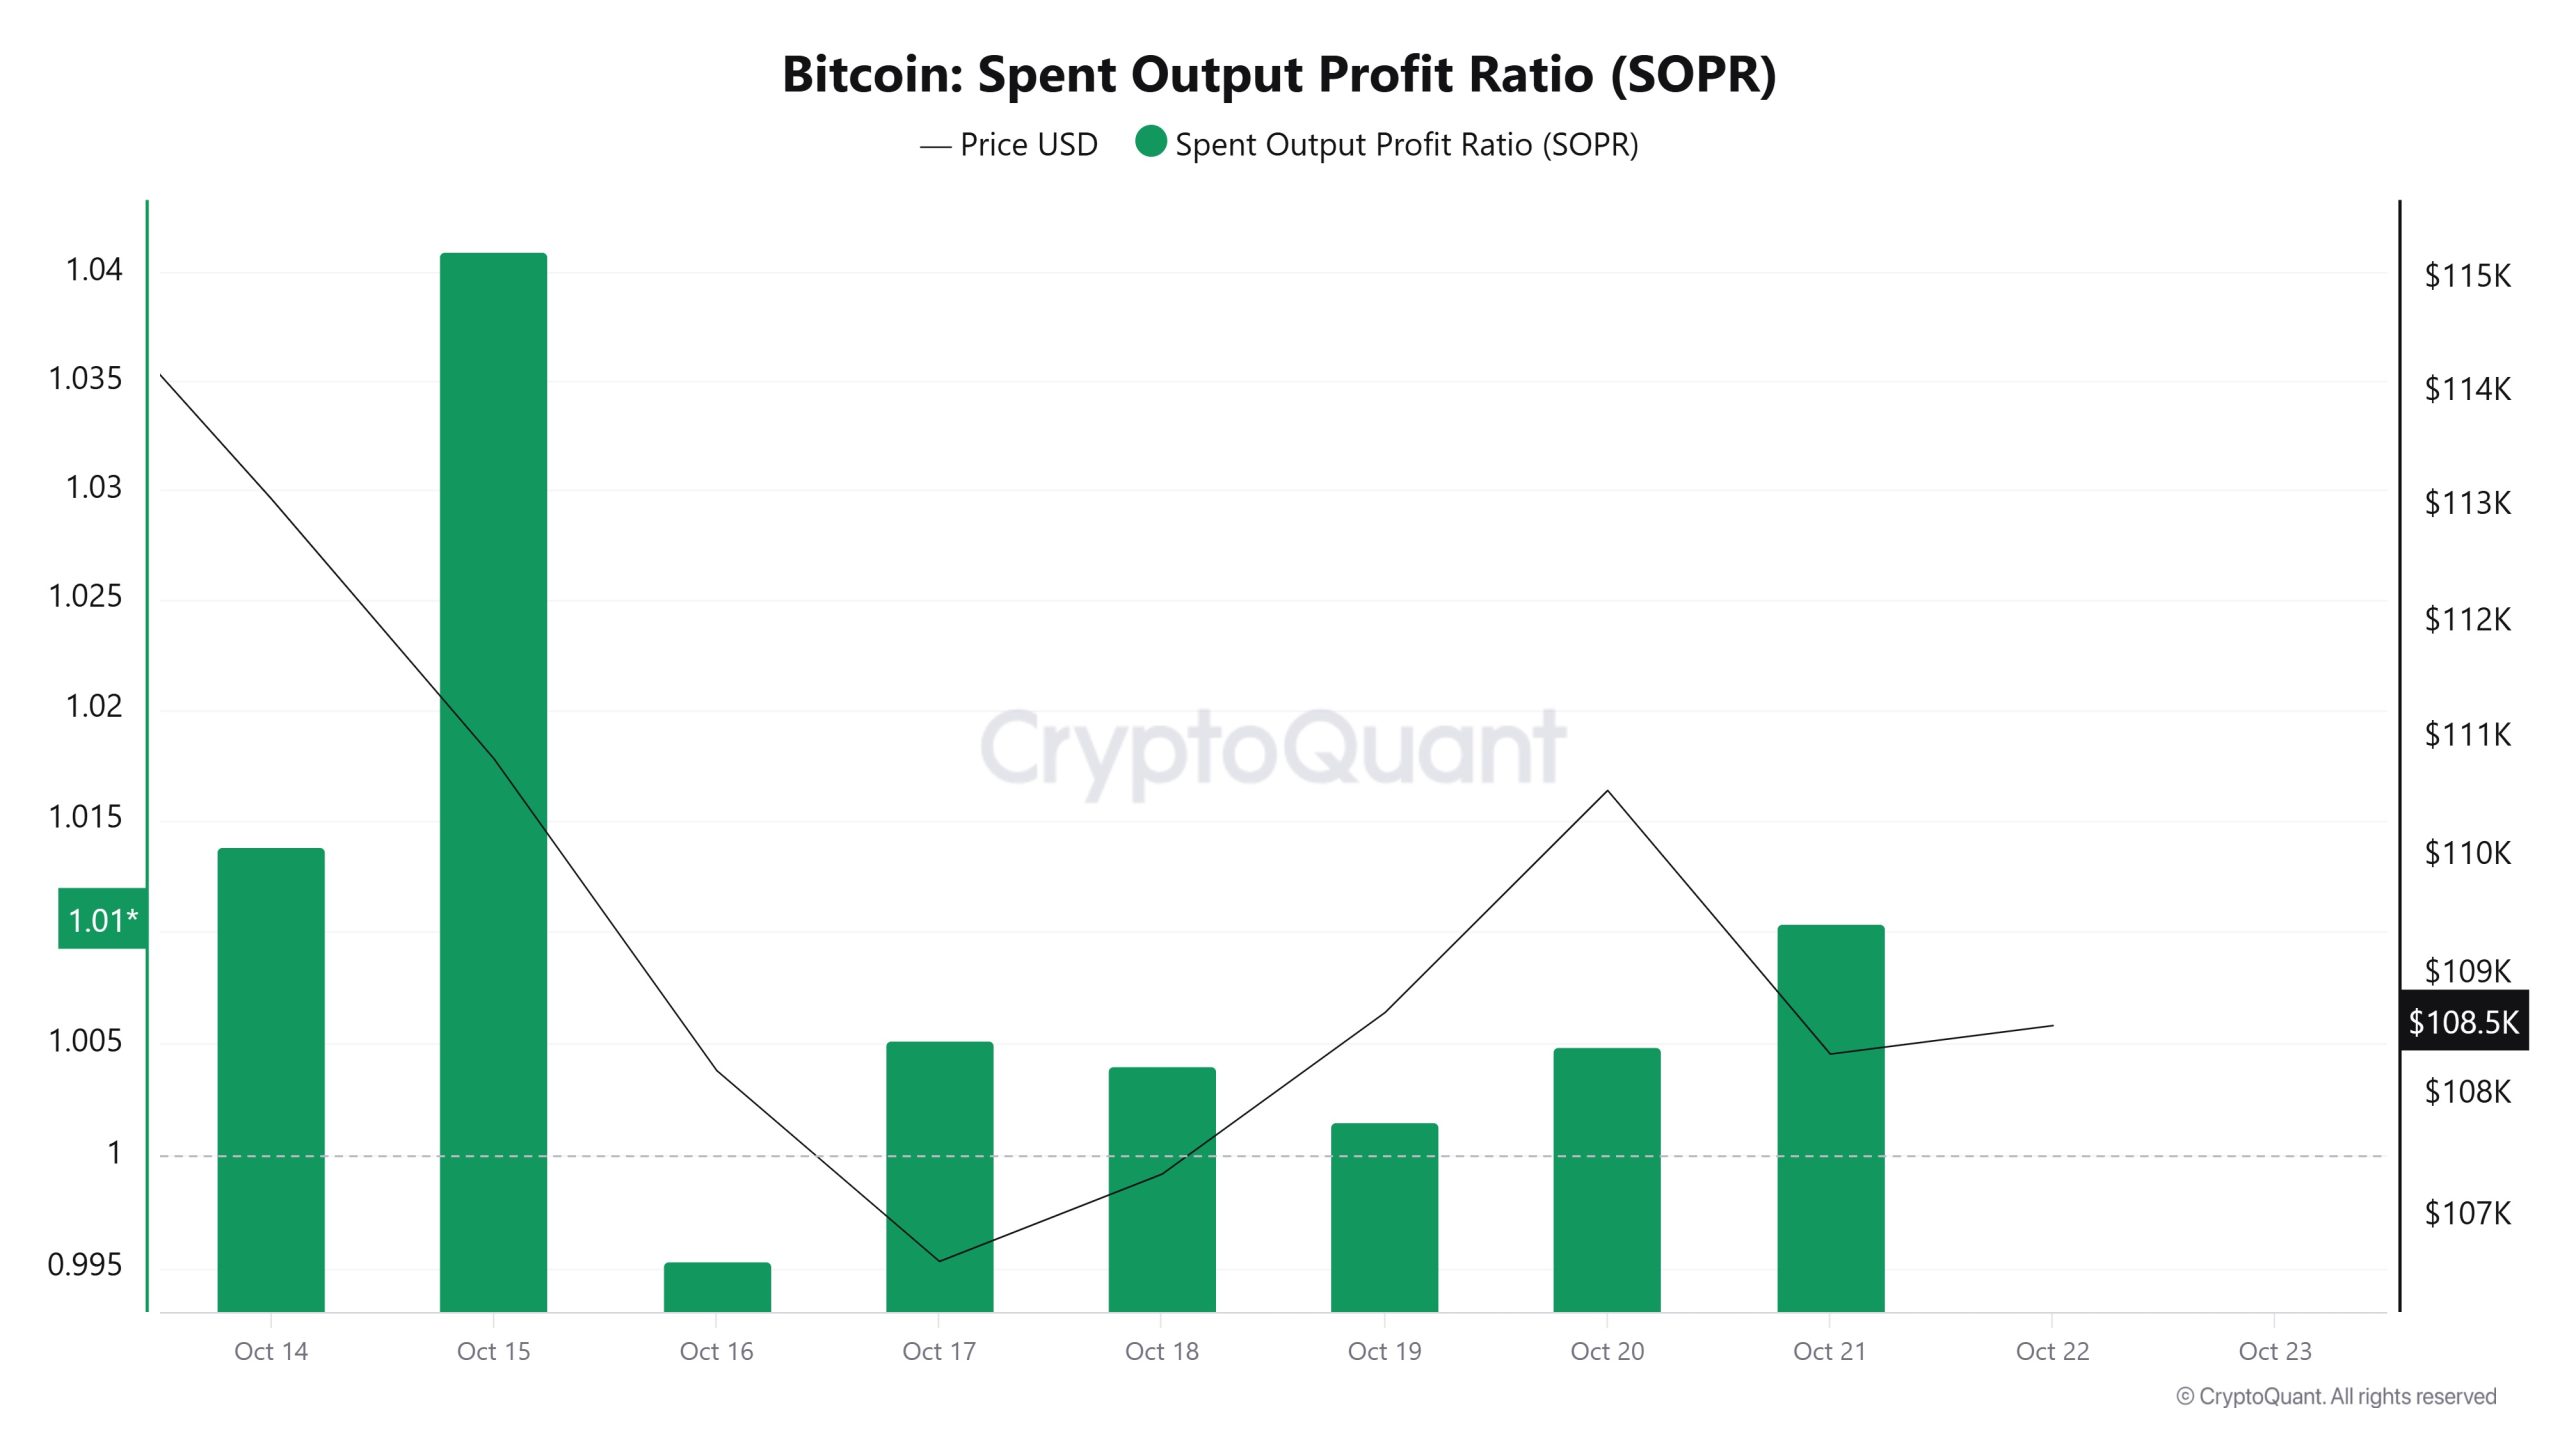
On October 15, when the Bitcoin price was $110,831, the SOPR metric was at 1.041.
As of October 21, while the Bitcoin price fell to $108,344, the SOPR metric declined to 1.010, recording a 2.98% drop.
Derivatives
Open Interest
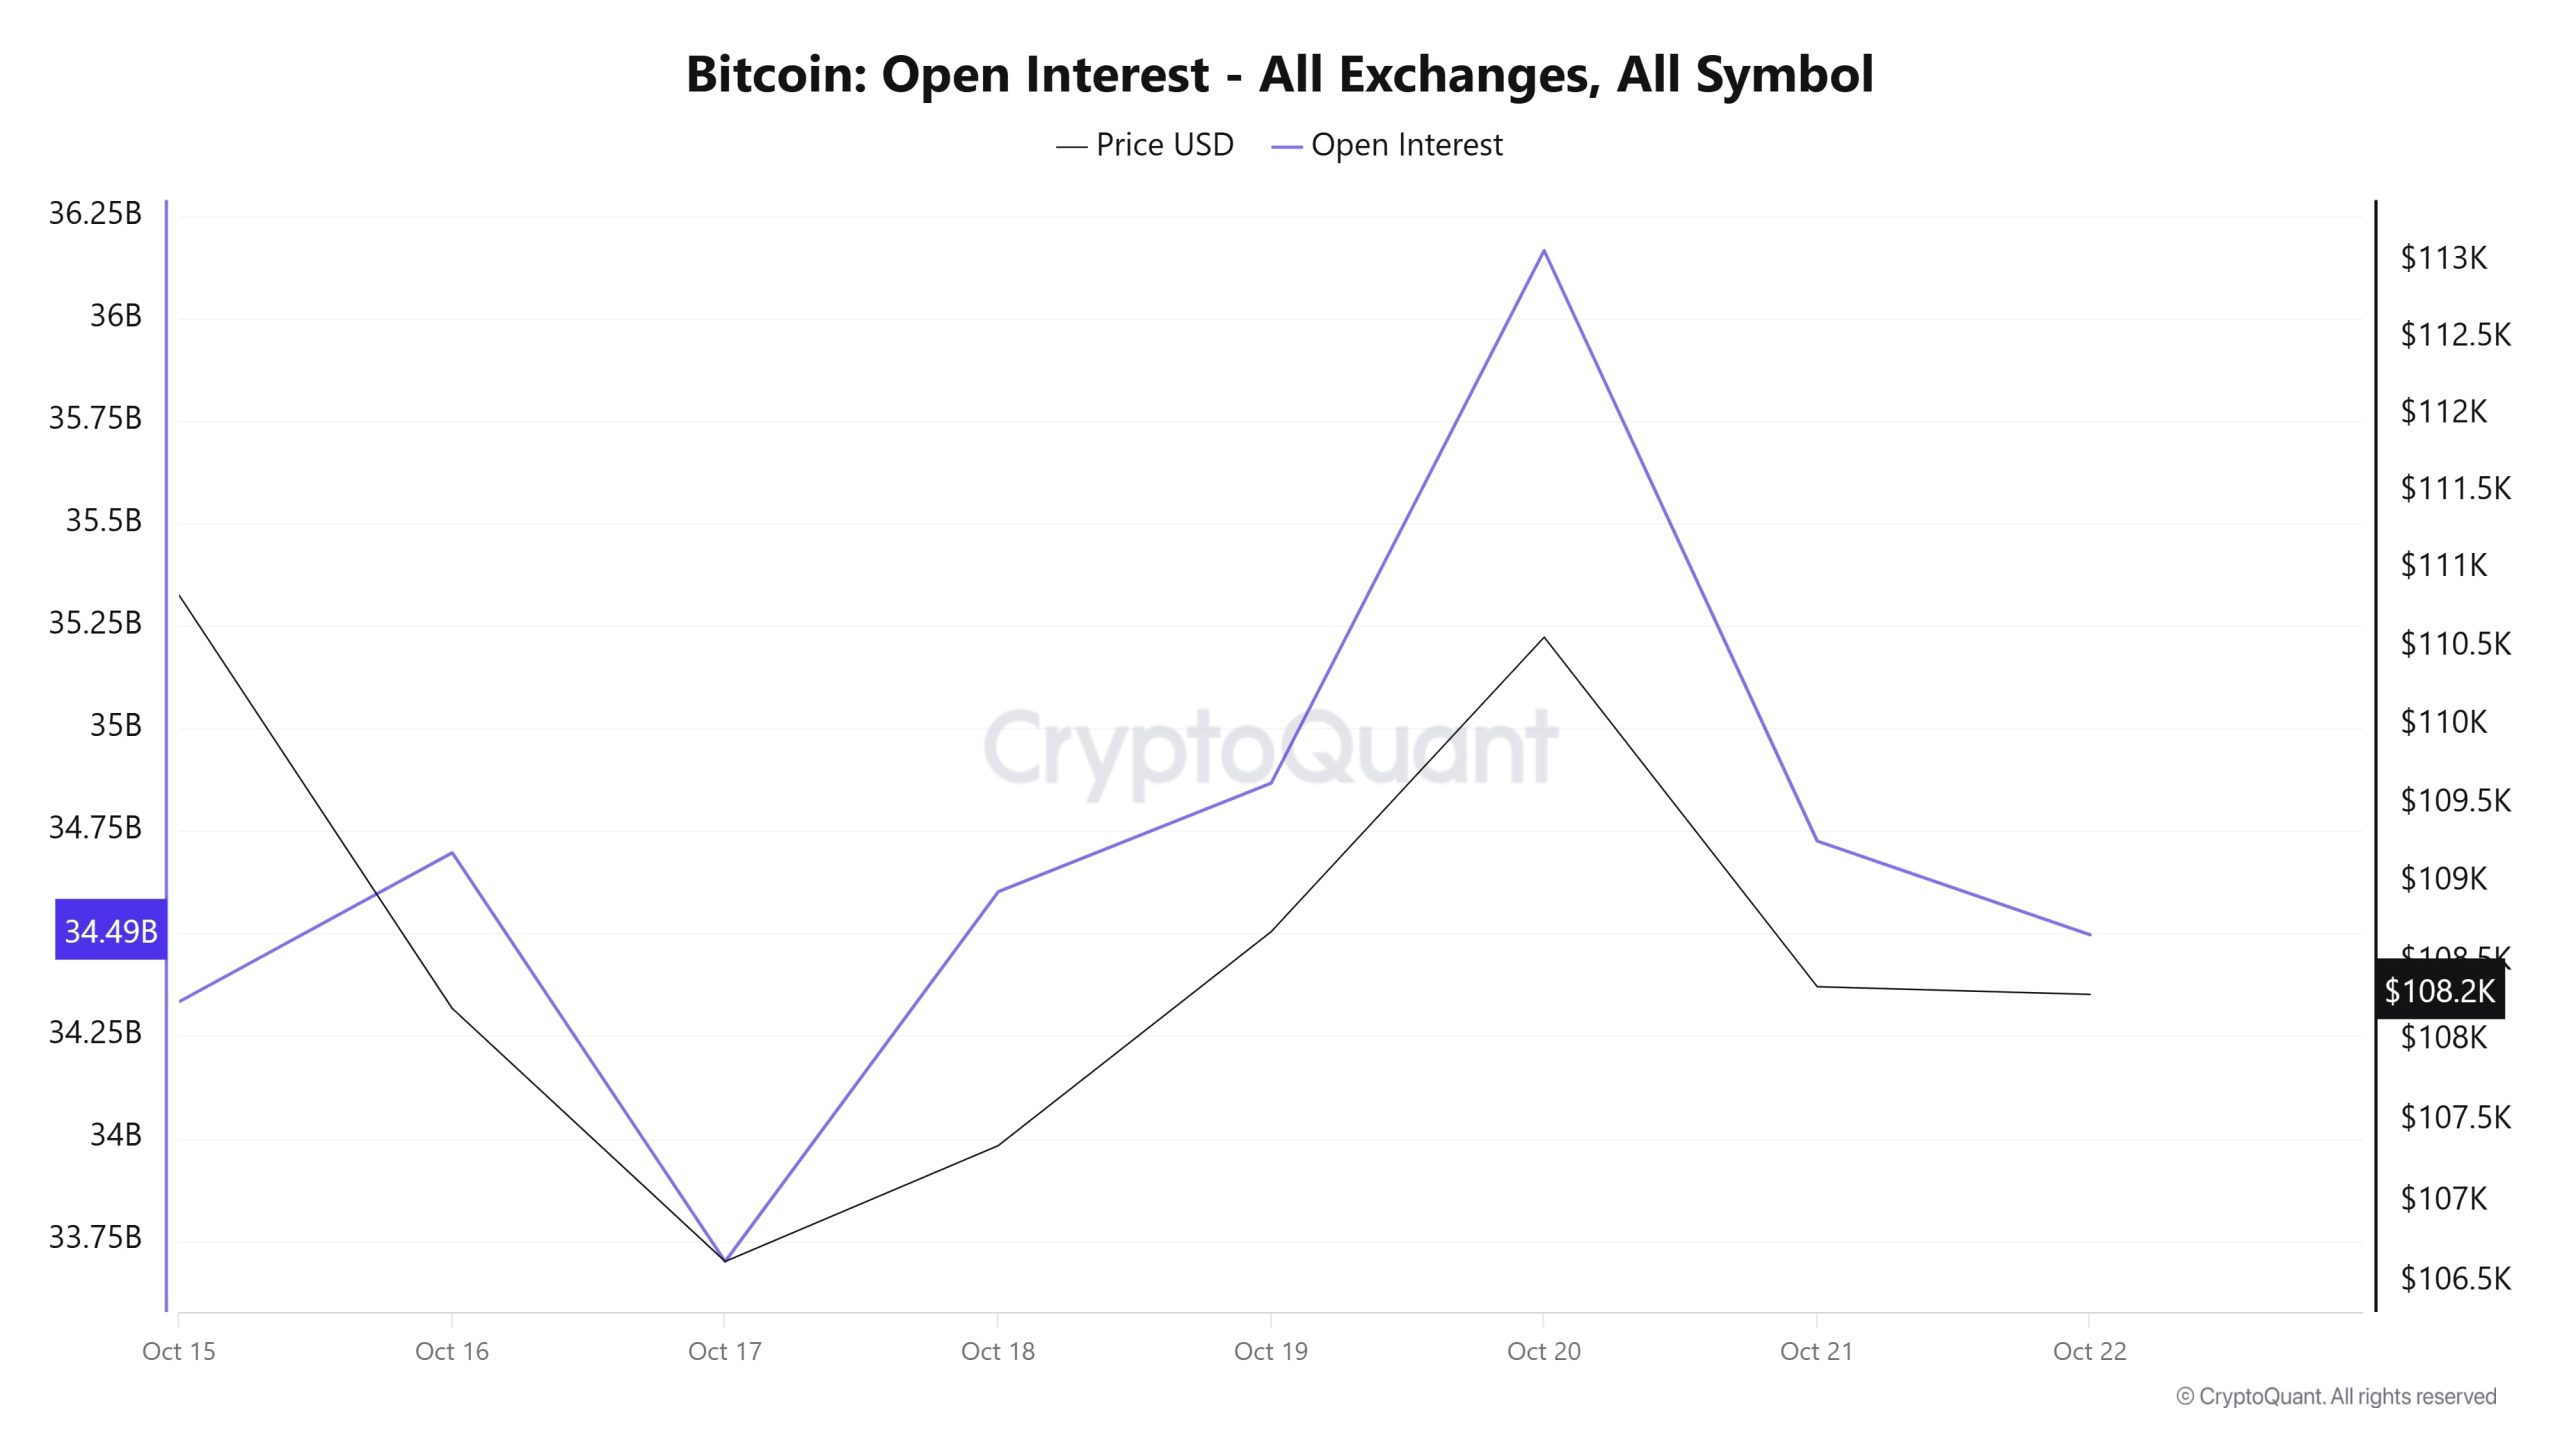
According to the chart, there has been a clear correlation between Bitcoin’s open interest and price in recent days. On October 15, both the price and open interest were at high levels, while around October 17, both hit a low. Then, on October 20, there was a strong rise, with open interest reaching approximately $36.2 billion and the price rising to around $112,000. However, on October 21–22, both the price and open interest fell sharply. This pattern indicates that short-term speculative movements and position closures are having an effect on the market. The decline in open interest may indicate that traders are adopting a cautious stance by reducing their leveraged positions. Overall, this decline following the rally can be interpreted as profit-taking and increased uncertainty.
Funding Rate
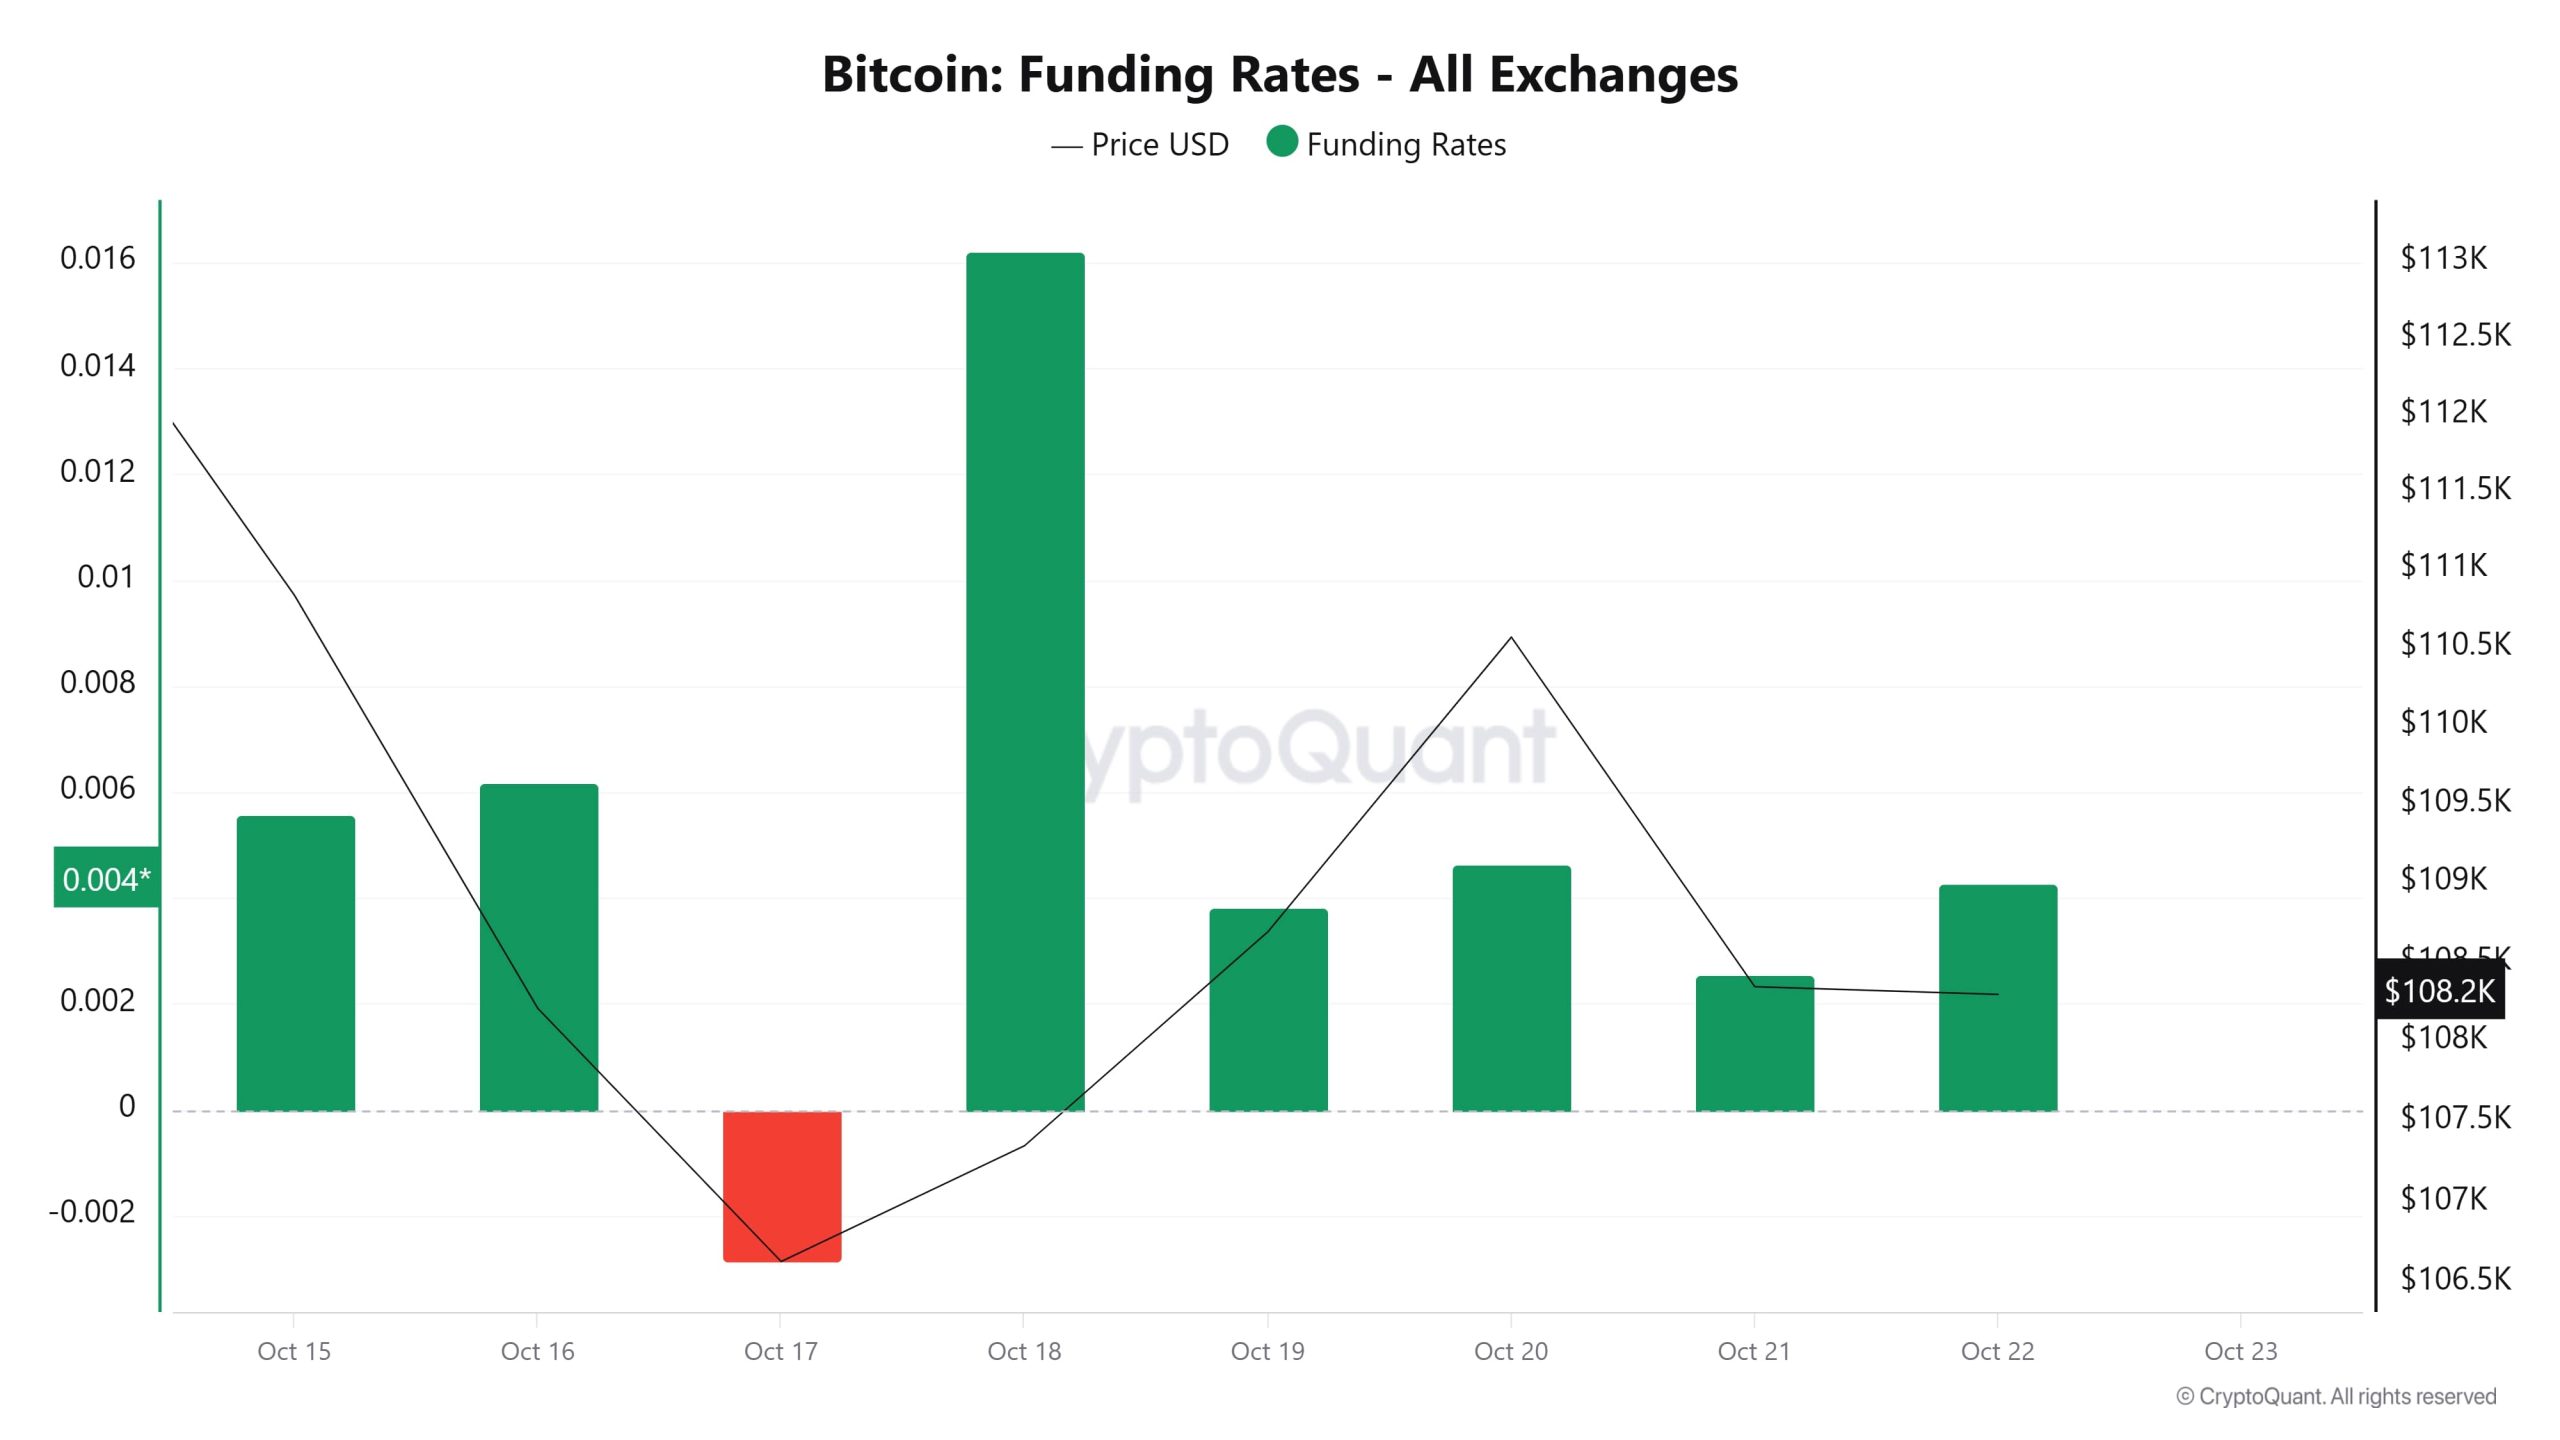
According to the graph, Bitcoin’s funding rate has been fluctuating in recent days. The rate, which was at positive levels on October 15–16, briefly turned negative on October 17, indicating that short positions gained ground. However, immediately afterwards, on October 18, there was a sharp jump, and the funding rate rose to 0.016. This situation indicates that long positions have become dominant in the market and that investors are acting on expectations of price increases.
In the following days, the rate rebalanced and remained in positive territory, albeit at more moderate levels. It is noteworthy that the funding rate also declined after the price peaked at around $112,000 on October 20 and then fell back to $108,200. This pattern indicates a decrease in excessive long positions in the market and an increase in expectations for a short-term correction.
Long & Short Liquidations
In the volatile market that fell to $103,500 last week and then rose to $114,000, $991 million in long positions and $249 million in short positions were liquidated.
| Dates | Long Volume (Million $) | Short Volume (Million $) |
|---|---|---|
| October 15 | 88.16 | 21.62 |
| October 16 | 183.34 | 18.19 |
| October 17 | 270.74 | 52.32 |
| October 18 | 5.70 | 7.30 |
| October 19 | 12.88 | 51.84 |
| October 20 | 34.59 | 36.67 |
| October 21 | 396.17 | 61.69 |
| Total | 991.58 | 249.63 |
Supply Distribution
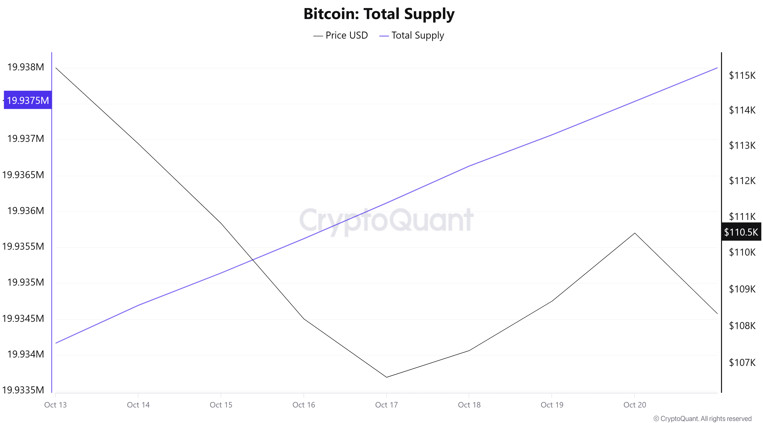
Total Supply: Reached 19,937,533 units, an increase of approximately 0.0169% compared to last week.
New Supply: The amount of BTC produced this week was 3,369.
Velocity: The velocity, which was 12.13 last week, reached 12.21 as of October 20.
| Wallet Category | 10/13/2025 | October 20, 2025 | Change (%) |
|---|---|---|---|
| < 1 BTC | 8.4366% | 8.4448% | 0.0974% |
| 1 – 10 BTC | 11.3536% | 11.3802% | 0.2343% |
| 10 – 100 BTC | 24.5032% | 24.5954% | 0.3765% |
| 100 – 1k BTC | 30.4374% | 30.4286% | −0.0289% |
| 1k – 10k BTC | 17.5146% | 17.2962% | −1.2485% |
| 10k+ BTC | 7.7543% | 7.8545% | 1.2936% |
According to the latest weekly data, the Bitcoin wallet distribution showed a mixed picture. The share of wallets holding less than 1 BTC increased from 8.4366% to 8.4448%, recording an increase of approximately 0.10%. The proportion of wallets holding between 1 and 10 BTC rose from 11.3536% to 11.3802%, an increase of approximately 0.23%. The share in the 10–100 BTC range rose from 24.5032% to 24.5954%, an increase of approximately 0.38%. The proportion of wallets in the 100–1,000 BTC range fell slightly from 30.4374% to 30.4286%, a decrease of approximately 0.03%. The share in the 1,000–10,000 BTC range fell from 17.5146% to 17.2962%, a decrease of approximately 1.25%. The share of wallets holding 10,000 BTC or more increased from 7.7543% to 7.8545%, showing an approximate increase of 1.29%.
Exchange Supply Ratio
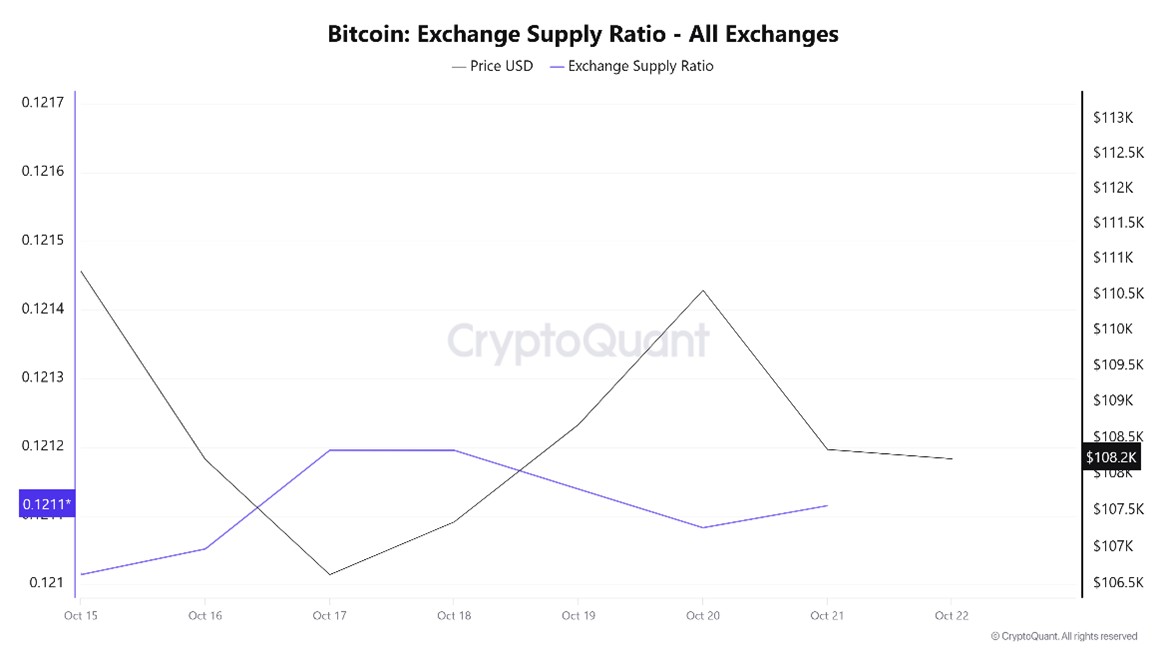
According to data obtained from the Bitcoin Exchange Supply Ratio table, which shows how much of the total supply of Bitcoins is held on exchanges, low rates have been observed this week. Following Trump’s statements regarding the China trade agreement, crypto assets declined, revealing a negative correlation between the Bitcoin price and the supply rate entering exchanges. This indicates that most Bitcoins are beginning to be withdrawn from wallets and that the market is not ready to buy.
Between October 15 and October 22, the Bitcoin Exchange Supply Ratio increased from 0.12101441 to 0.12111411. During this period, the Bitcoin price fell from $110,830 to $108,800. Notably, the divergence in the direction of these two variables this week indicates an increase in the amount of Bitcoin supplied to exchanges despite the price decline, suggesting that long-term investors may be holding onto their assets. A general downward trend in the Bitcoin price appears likely.
Exchange Reserve
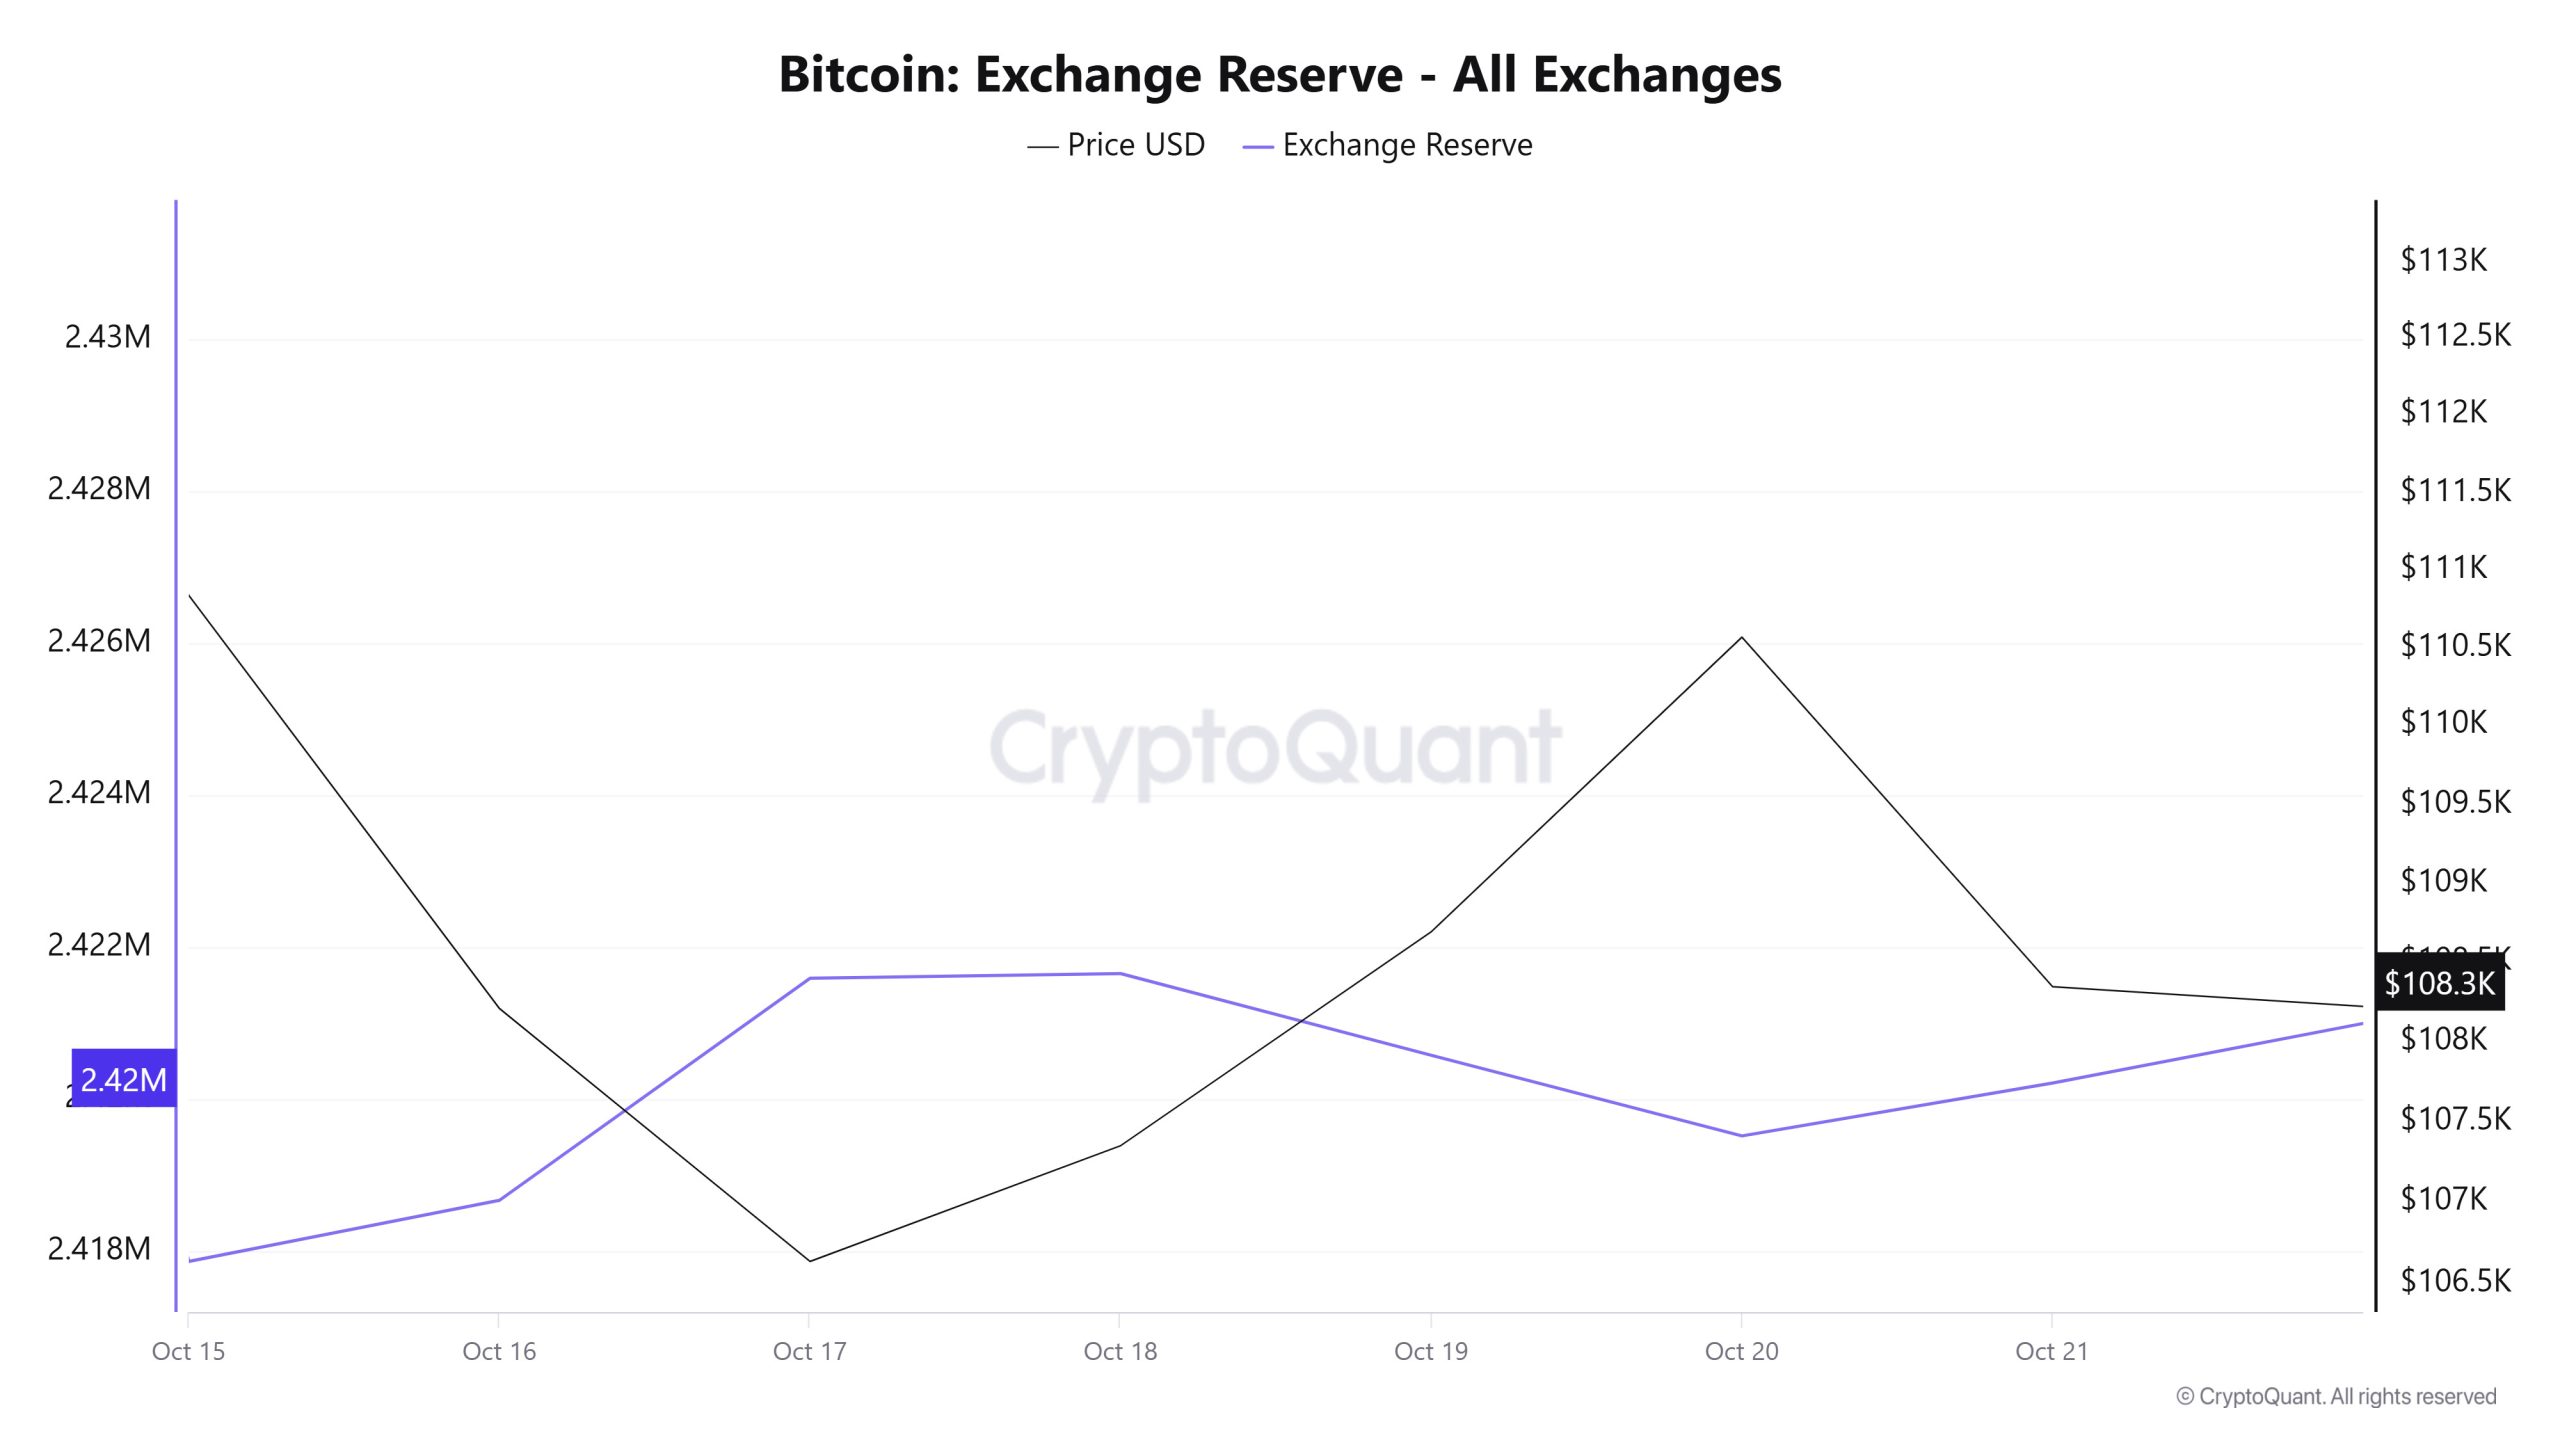
Between October 15 and 21, 2025, Bitcoin reserves on exchanges declined from approximately 2,431,172 BTC to 2,420,204 BTC, resulting in a net outflow of 10,968 BTC. During this period, exchange reserves decreased by 0.45%, while the Bitcoin price fell from $113,074 to $108,344, losing 4.18% of its value. The decrease in exchange reserves while the price was falling indicates that investors viewed this pullback more as an accumulation opportunity than a selling opportunity. This suggests that despite short-term selling pressure, long-term investors maintained their confidence in the market. However, the pressure on the price reveals that buying has not yet gained strong momentum and that the market is operating under weak demand conditions. In the short term, prices are likely to remain under downward pressure as selling pressure continues. In the long term, however, the decline in reserves indicates that a potential supply contraction could support prices again and lay the foundation for a possible recovery.
| Date | Exchange Inflow | Exchange Outflow | Exchange Netflow | Exchange Reserve | BTC Price ($) |
|---|---|---|---|---|---|
| October 15 | 31,919 | 45,236 | -13,317 | 2,417,855 | 113,074 |
| October 16 | 37,706 | 36,902 | 805 | 2,418,659 | 108,207 |
| October 17 | 45,503 | 42,577 | 2,926 | 2,421,585 | 106,631 |
| October 18 | 13,558 | 13,497 | 61 | 2,421,646 | 107,349 |
| October 19 | 11,487 | 12,562 | -1,075 | 2,420,571 | 108,690 |
| October 20 | 27,847 | 28,911 | -1,064 | 2,419,508 | 110,563 |
| October 21 | 48,244 | 47,547 | 698 | 2,420,204 | 108,344 |
Fees and Revenues
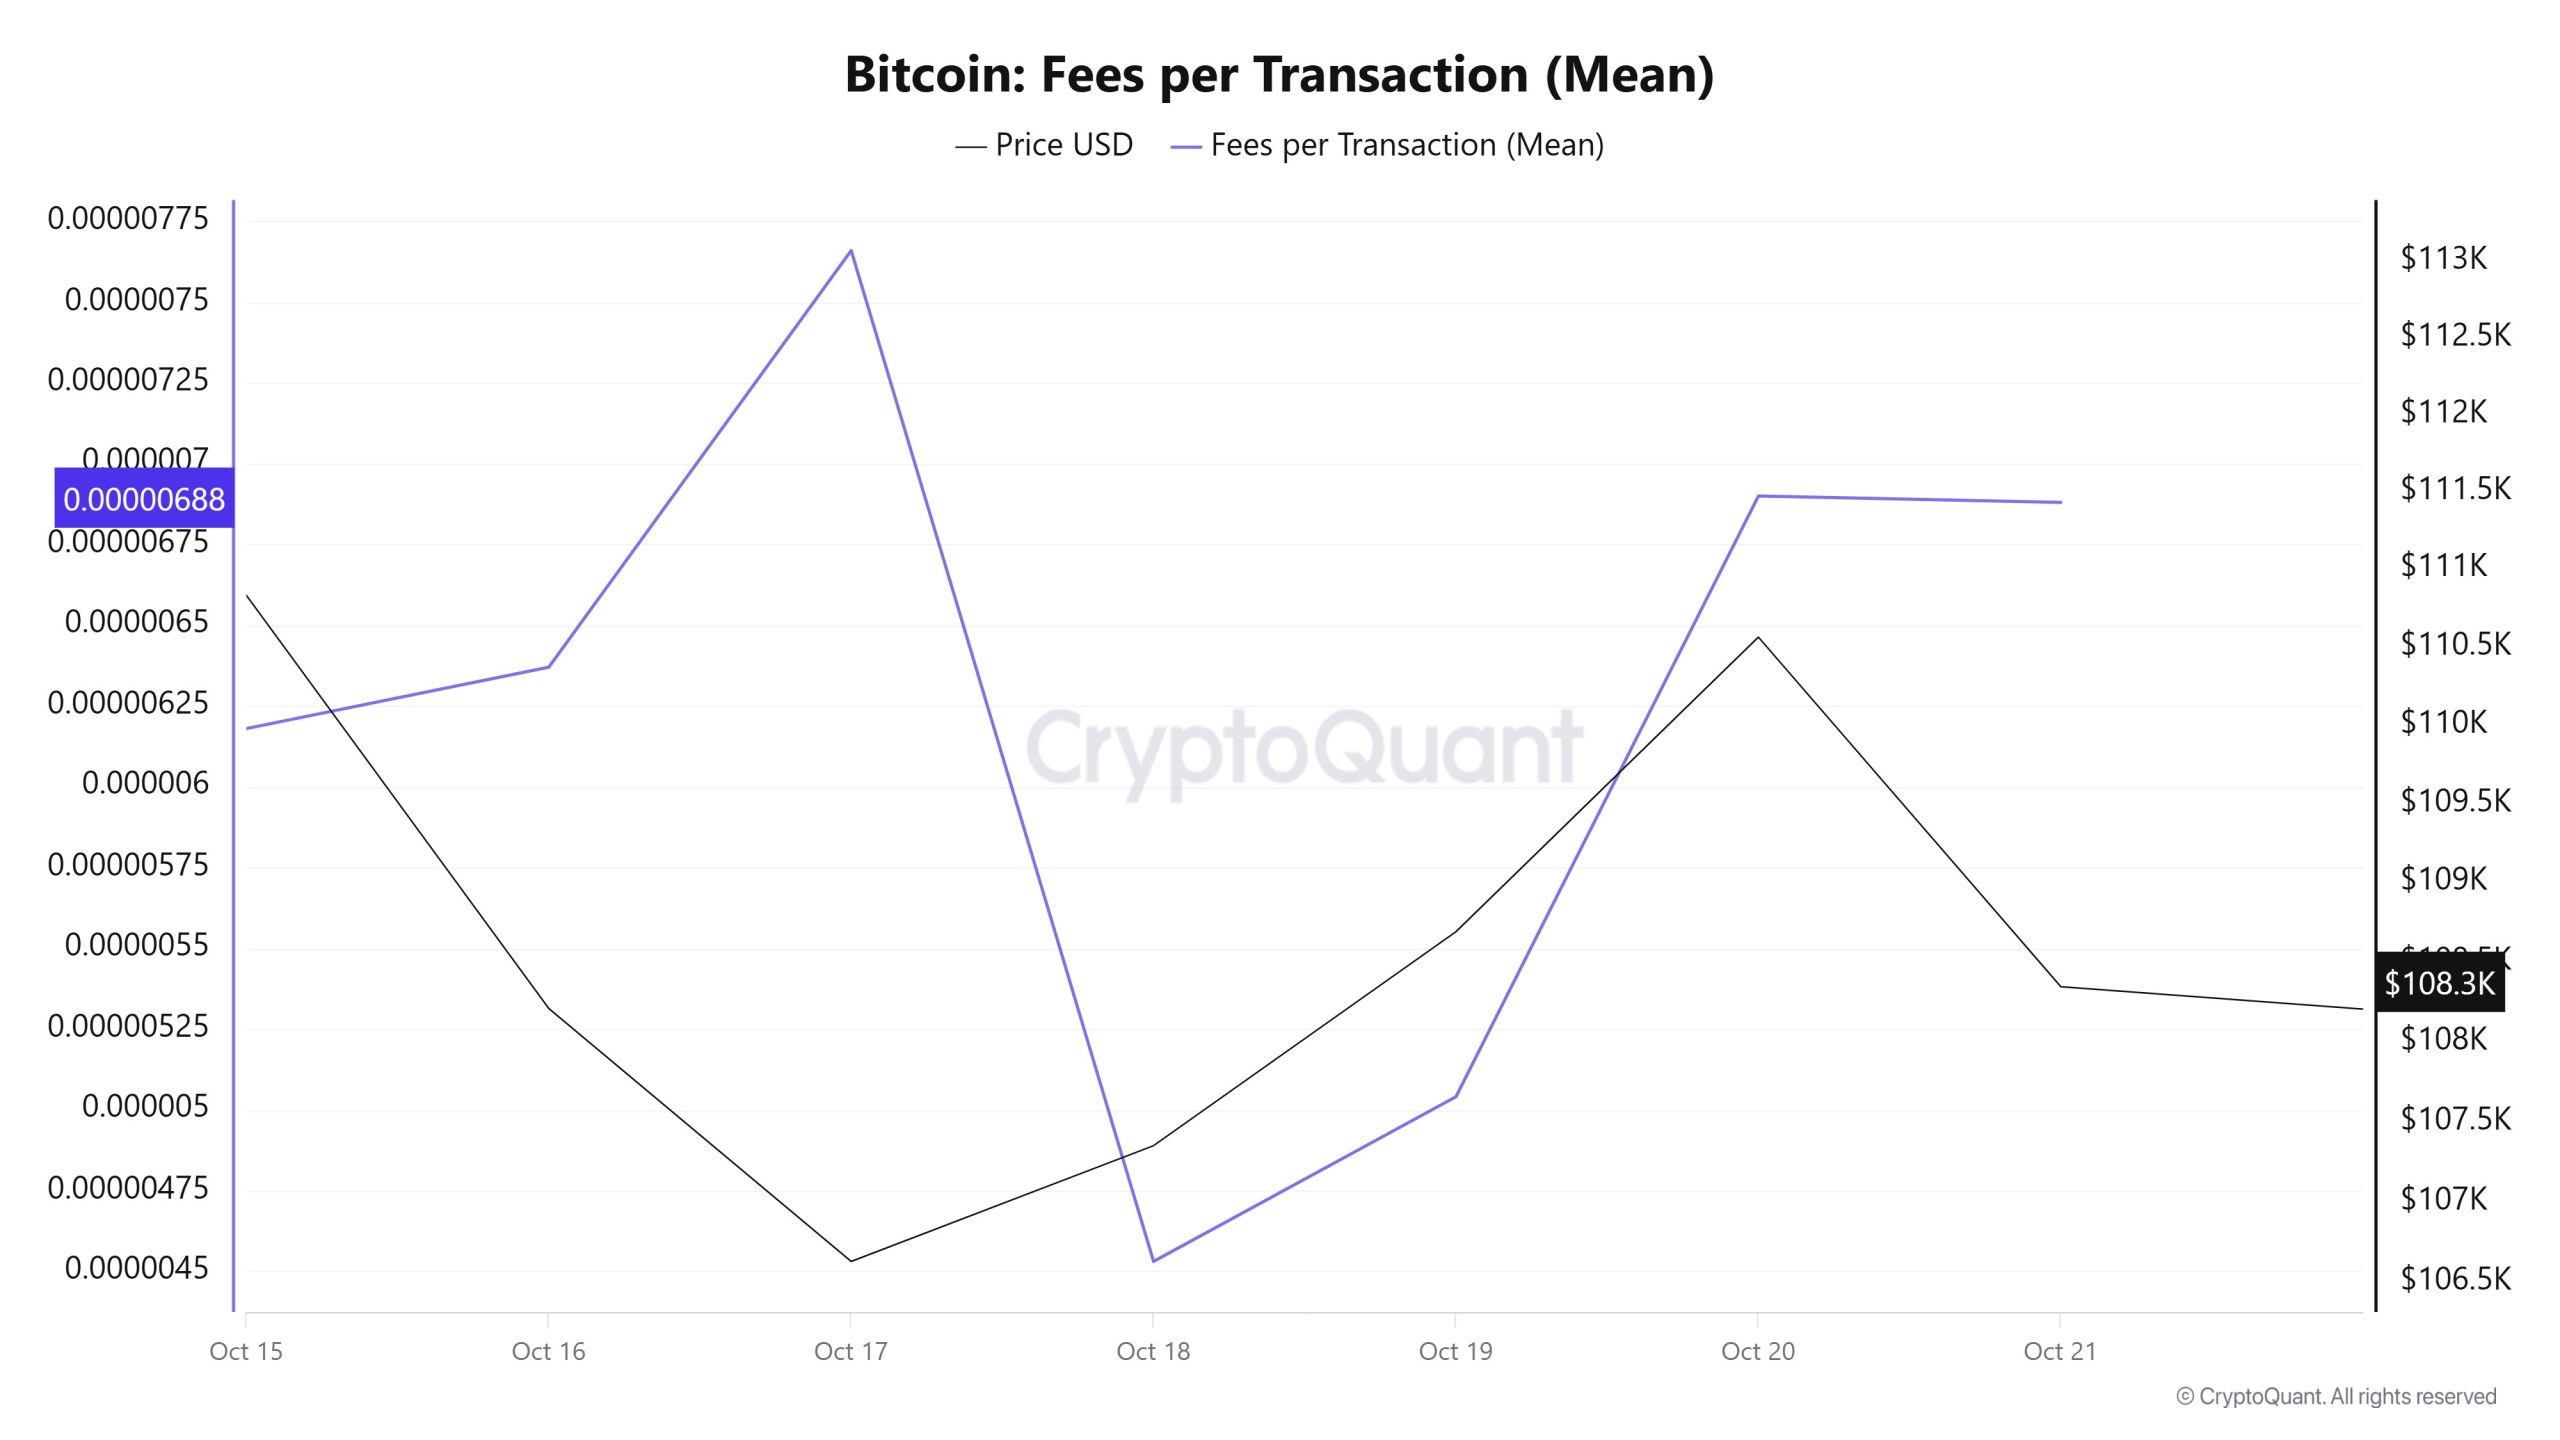
When examining the Bitcoin Fees per Transaction (Mean) data for October 15-21, it can be seen that on October 15, the first day of the week, the indicator stood at 0.00000618.
As of October 17, the value in question reached its peak level, but subsequently followed a fluctuating trend due to the volatility in Bitcoin prices, declining to 0.00000453 on October 18.
In the following days, the Bitcoin Fees per Transaction (Mean) indicator resumed its upward trend, closing at 0.00000688 on October 21, the last day of the week.
Bitcoin: Fees (Total)
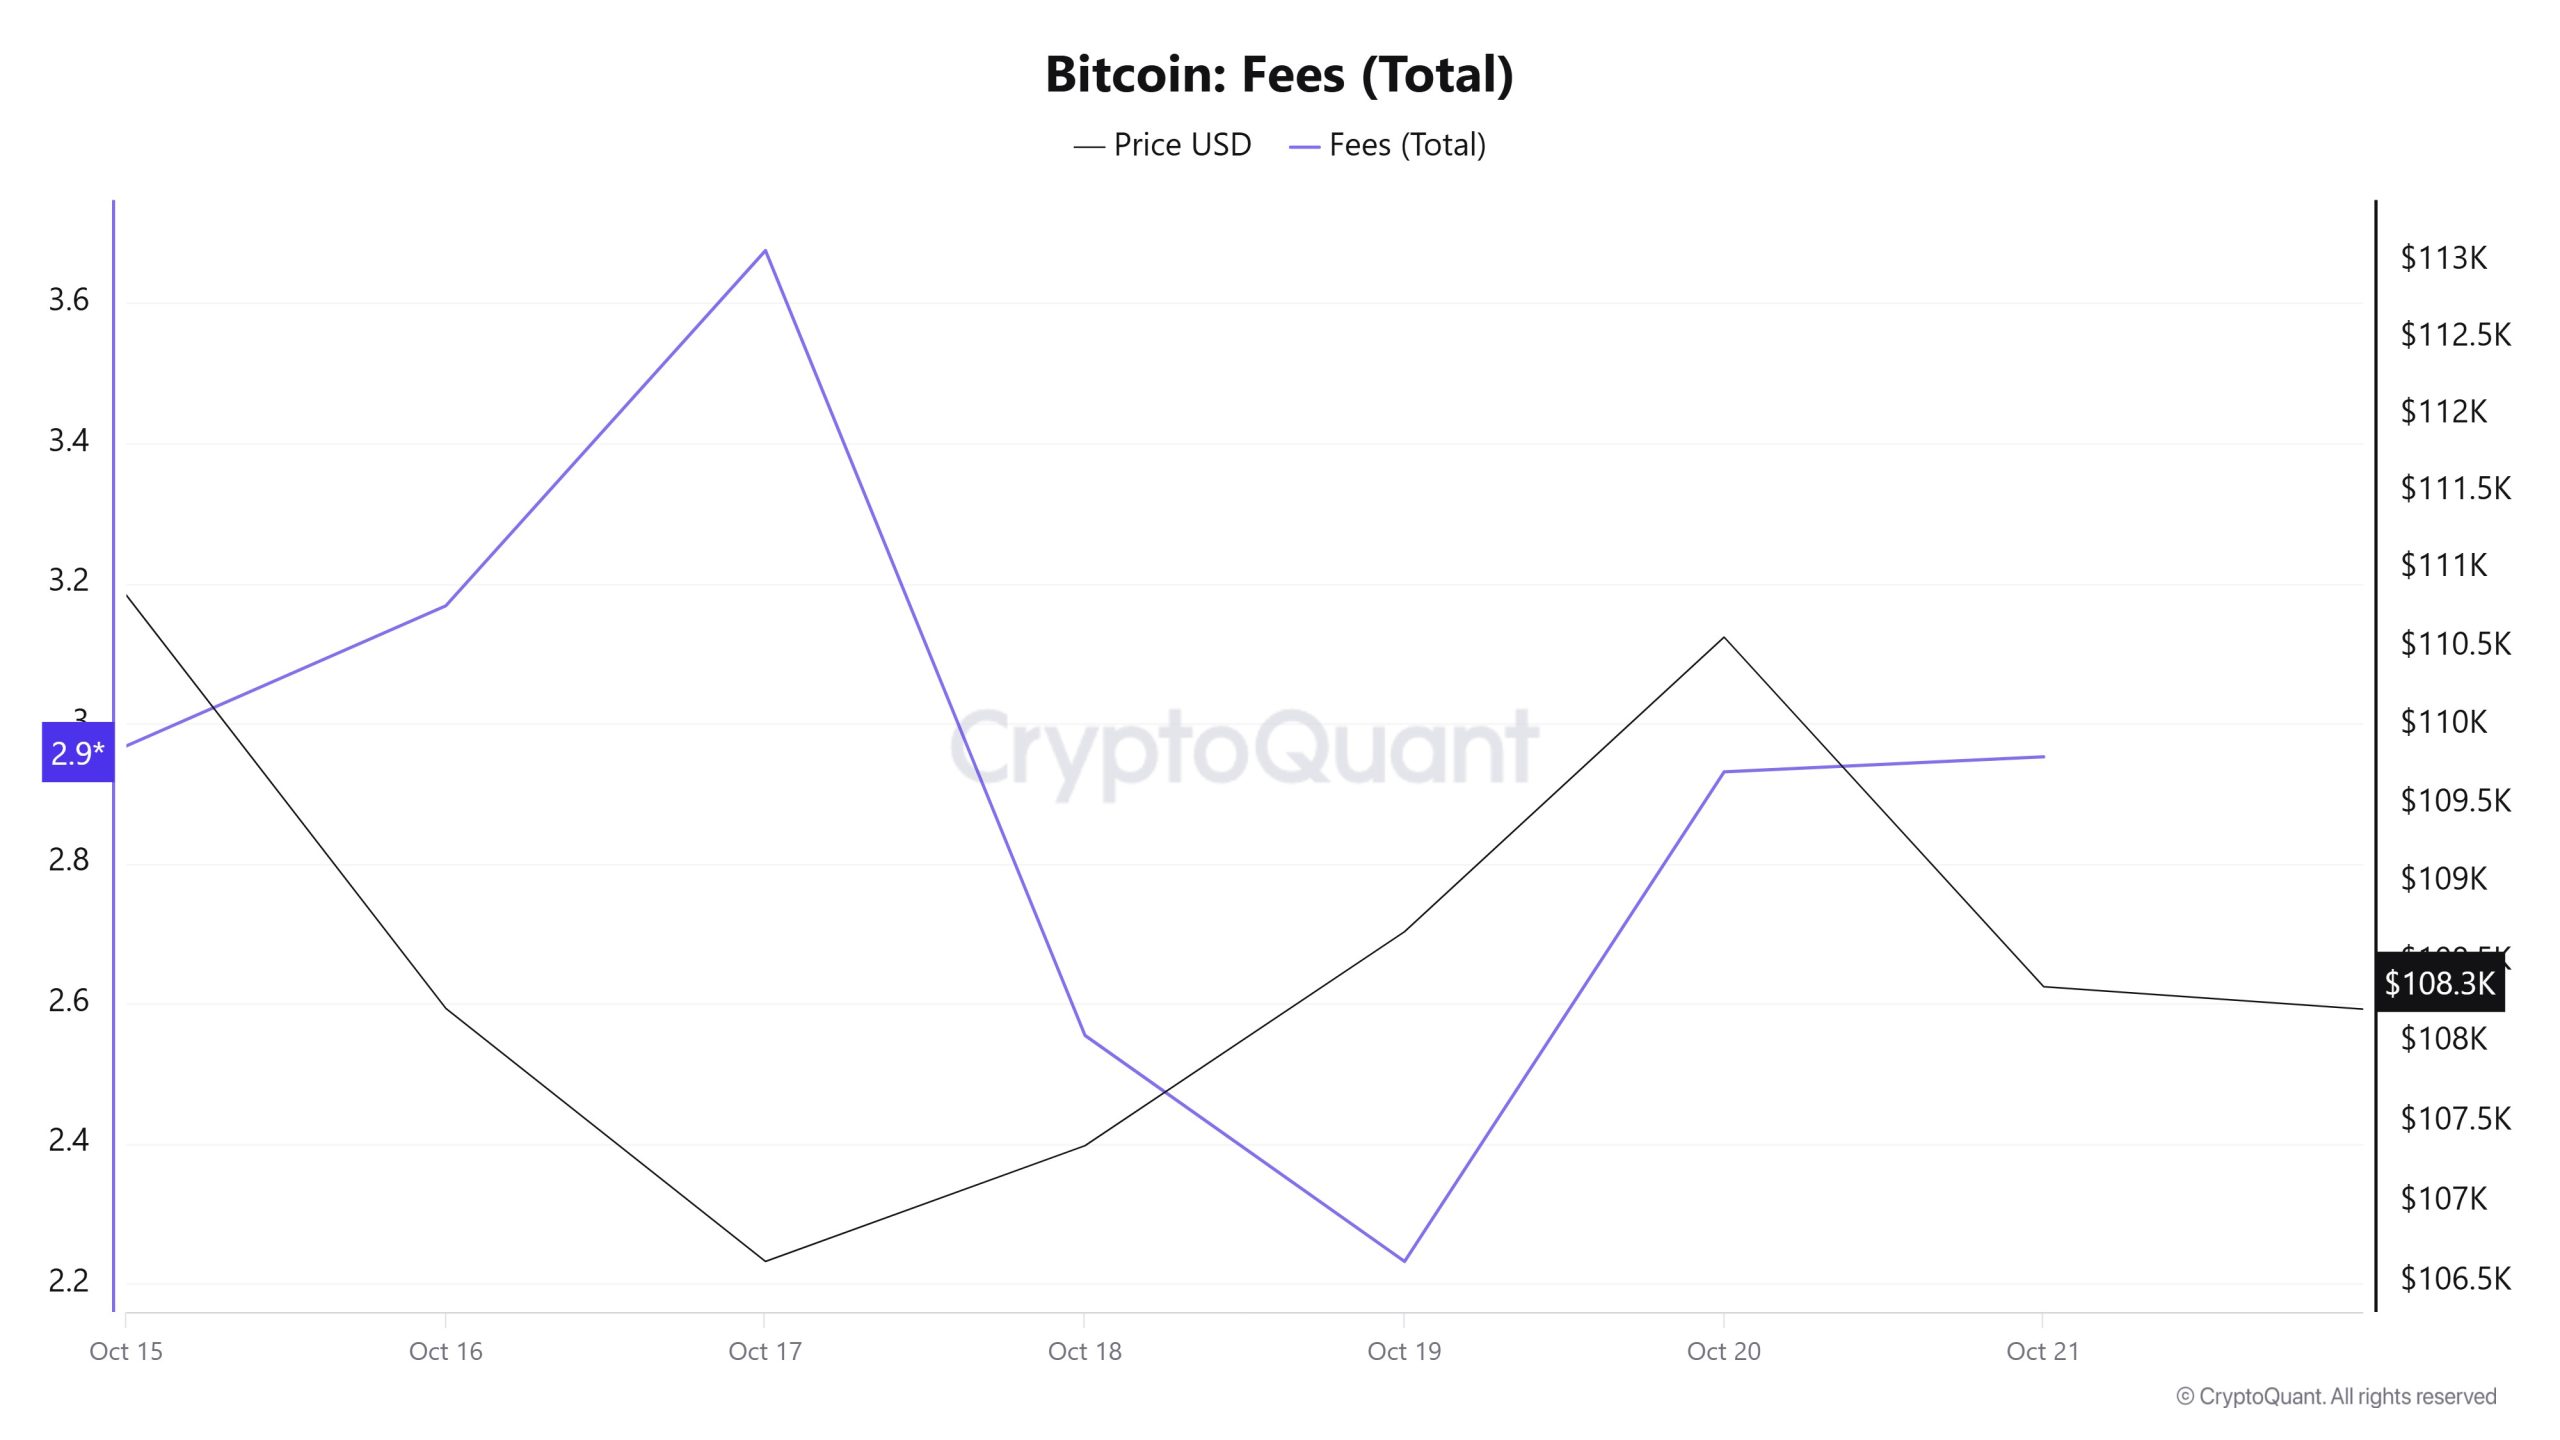
Similarly, when examining the Bitcoin Fees (Total) data between October 15 and 21, it is seen that the indicator reached 2.96788477 on October 15, the first day of the week.
As of October 17, the value in question reached its peak level, but subsequently followed a volatile trend due to the impact of Bitcoin price volatility, falling to 2.23185996 on October 19.
In the following days, the Bitcoin Fees (Total) indicator resumed its upward trend, closing at 2.95225 on October 21, the last day of the week.
Miner Flows
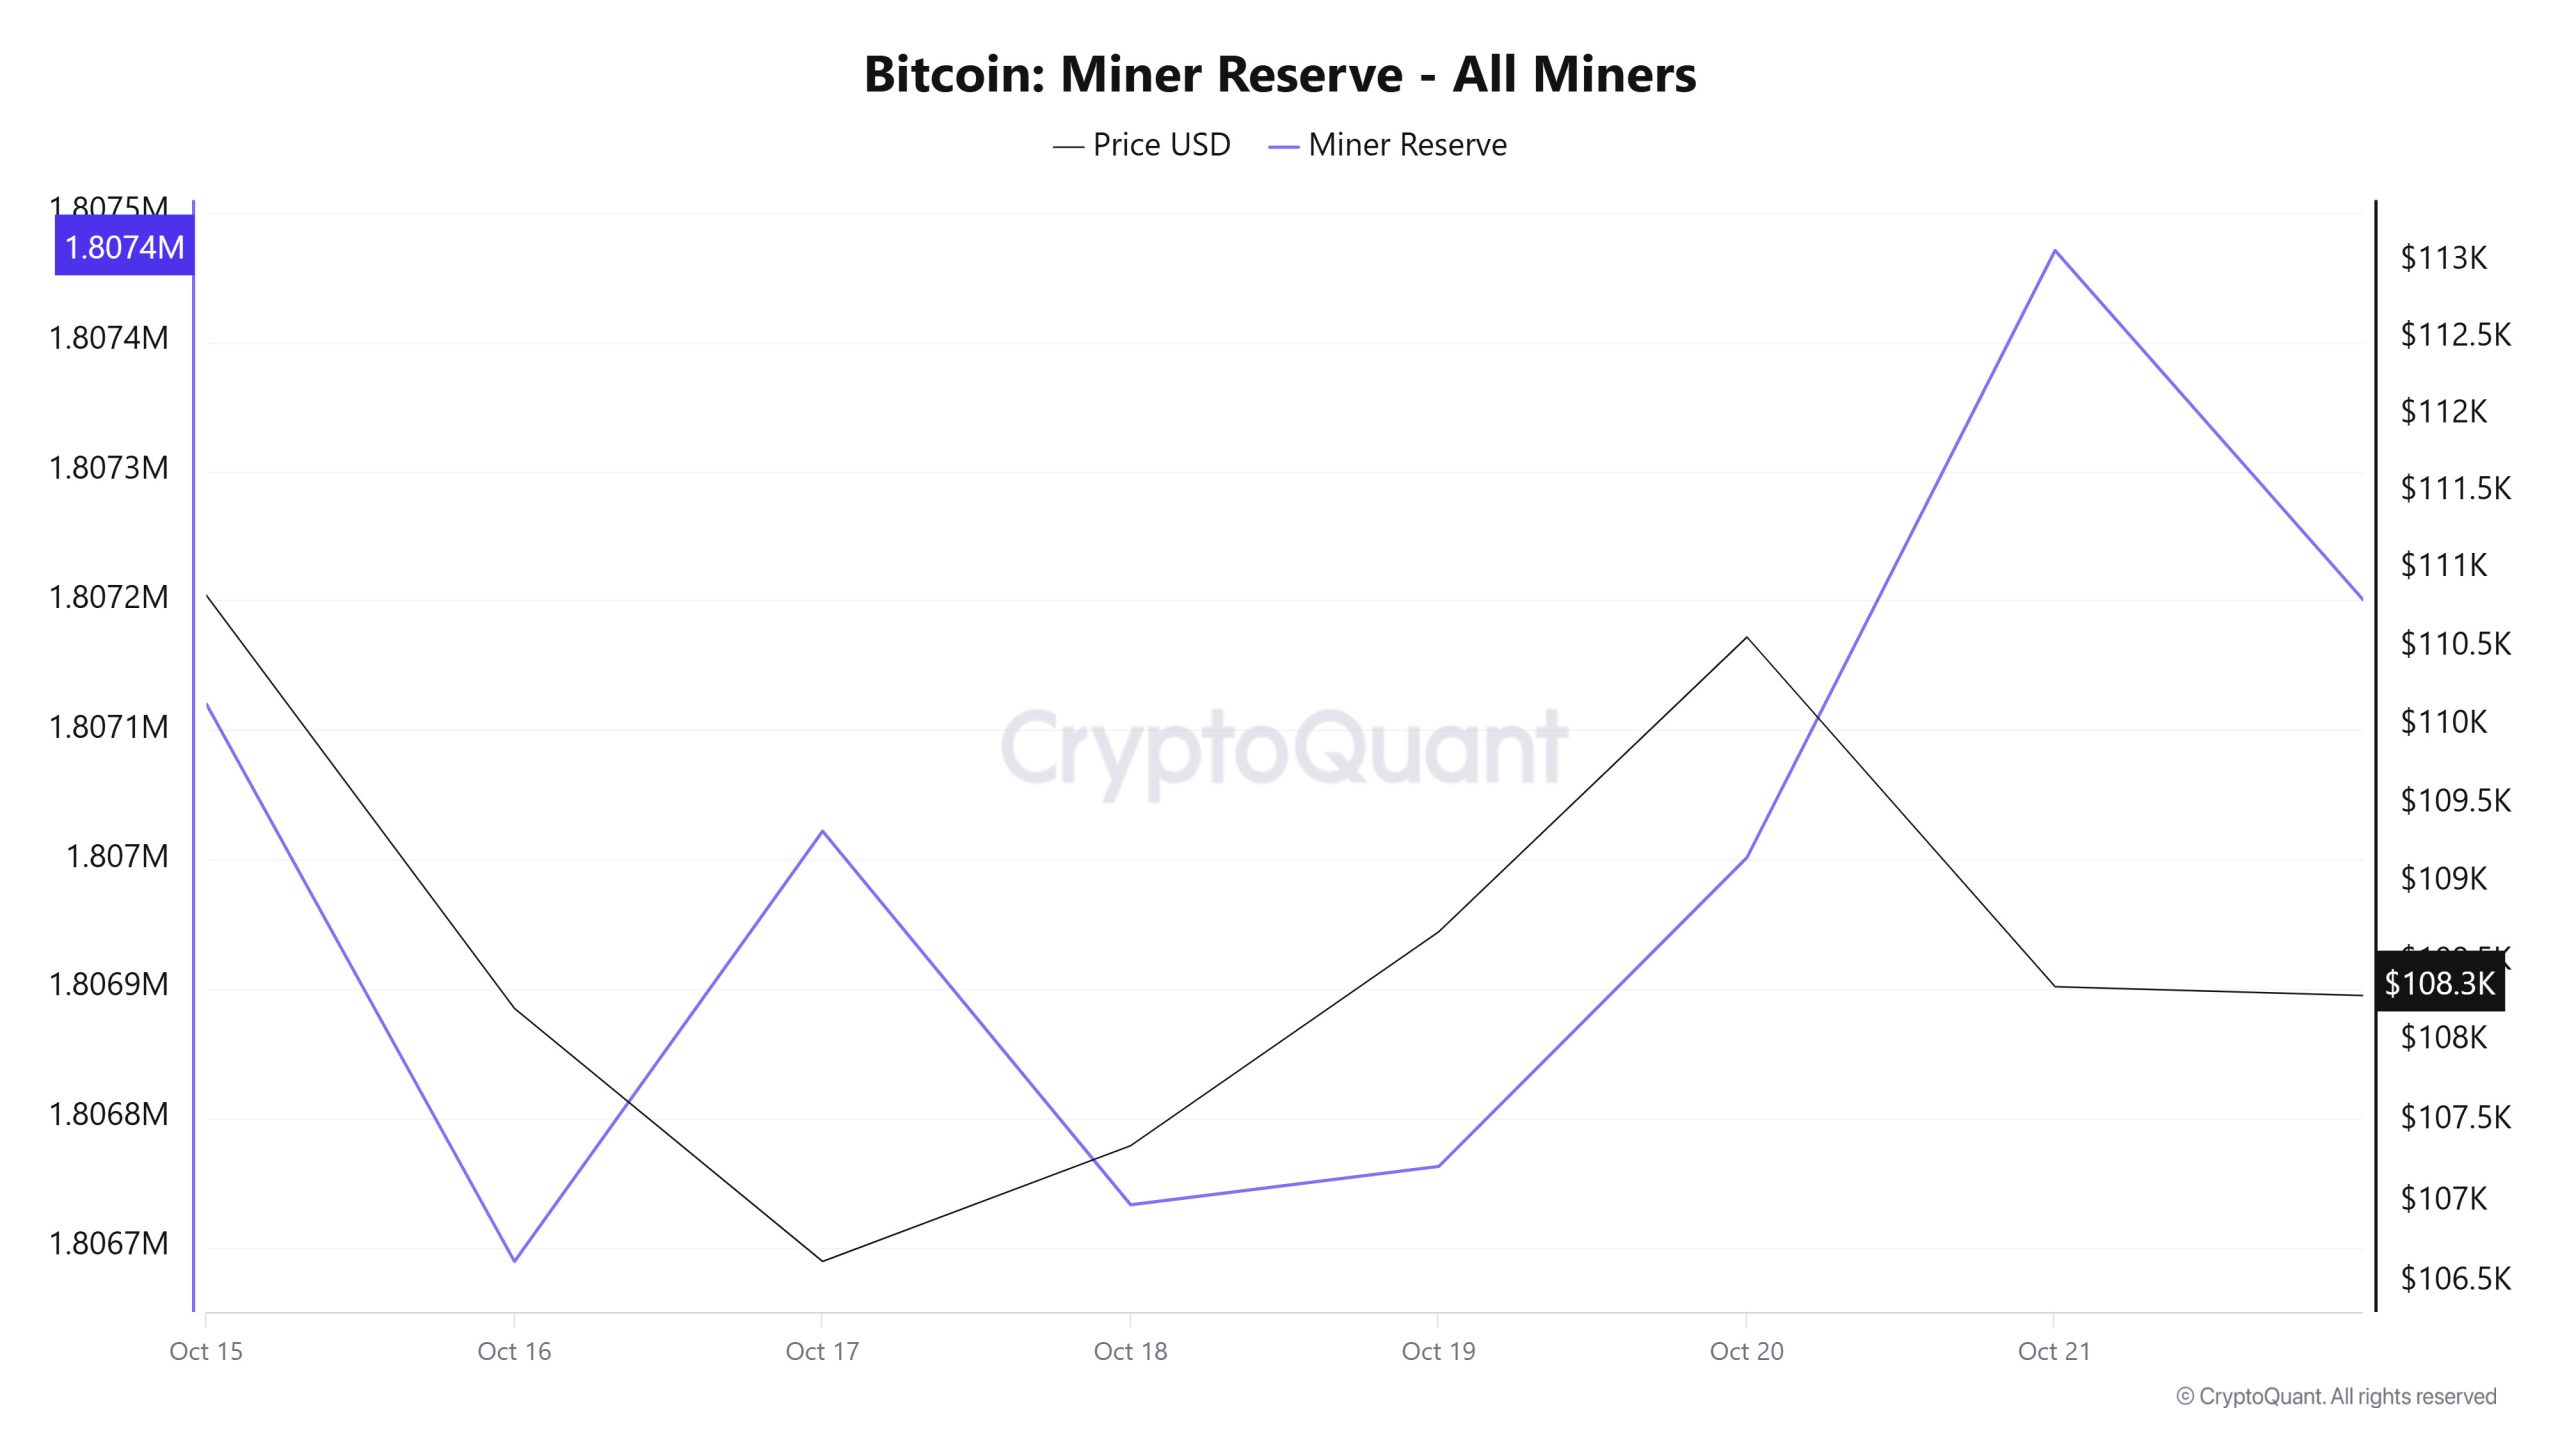
According to data obtained from the Miner Reserve table, an increase in Bitcoin reserves held in miners’ wallets has been observed this week. A time-dependent correlation structure between the Bitcoin price and miner reserve was observed during the period examined. However, the general trend indicates that a positive correlation between these two variables is dominant.
Miner Inflow, Outflow, and Netflow
Between October 15 and 21, 49,078 Bitcoin were withdrawn from miners’ wallets, while 49,379 Bitcoin were deposited into miners’ wallets during the same period. This week’s Miner Netflow was 301 Bitcoin. Meanwhile, the Bitcoin price was $110,831 on October 15 and $108,344 on October 21.
Throughout the week, Bitcoin inflows into miner wallets (Miner Inflow) exceeded Bitcoin outflows from miner wallets (Miner Outflow), resulting in a positive net flow (Miner Netflow).
| Oct. 15 | Oct. 16 | Oct. 17 | Oct. 18 | Oct. 19 | Oct. 20 | Oct. 21 | |
| Miner Inflow | 7324.77 | 7,708.06 | 11,062.66 | 2804.17 | 2602.25 | 5,211.63 | 12,665.27 |
| Miner Outflow | 7374.50 | 8,138.87 | 10,730.04 | 3093.03 | 2,572.58 | 4,972.93 | 12,196.01 |
| Miner NetFlow | -49.74 | -430.81 | 332.62 | -288.86 | 29.67 | 238.70 | 469.25 |
Transaction
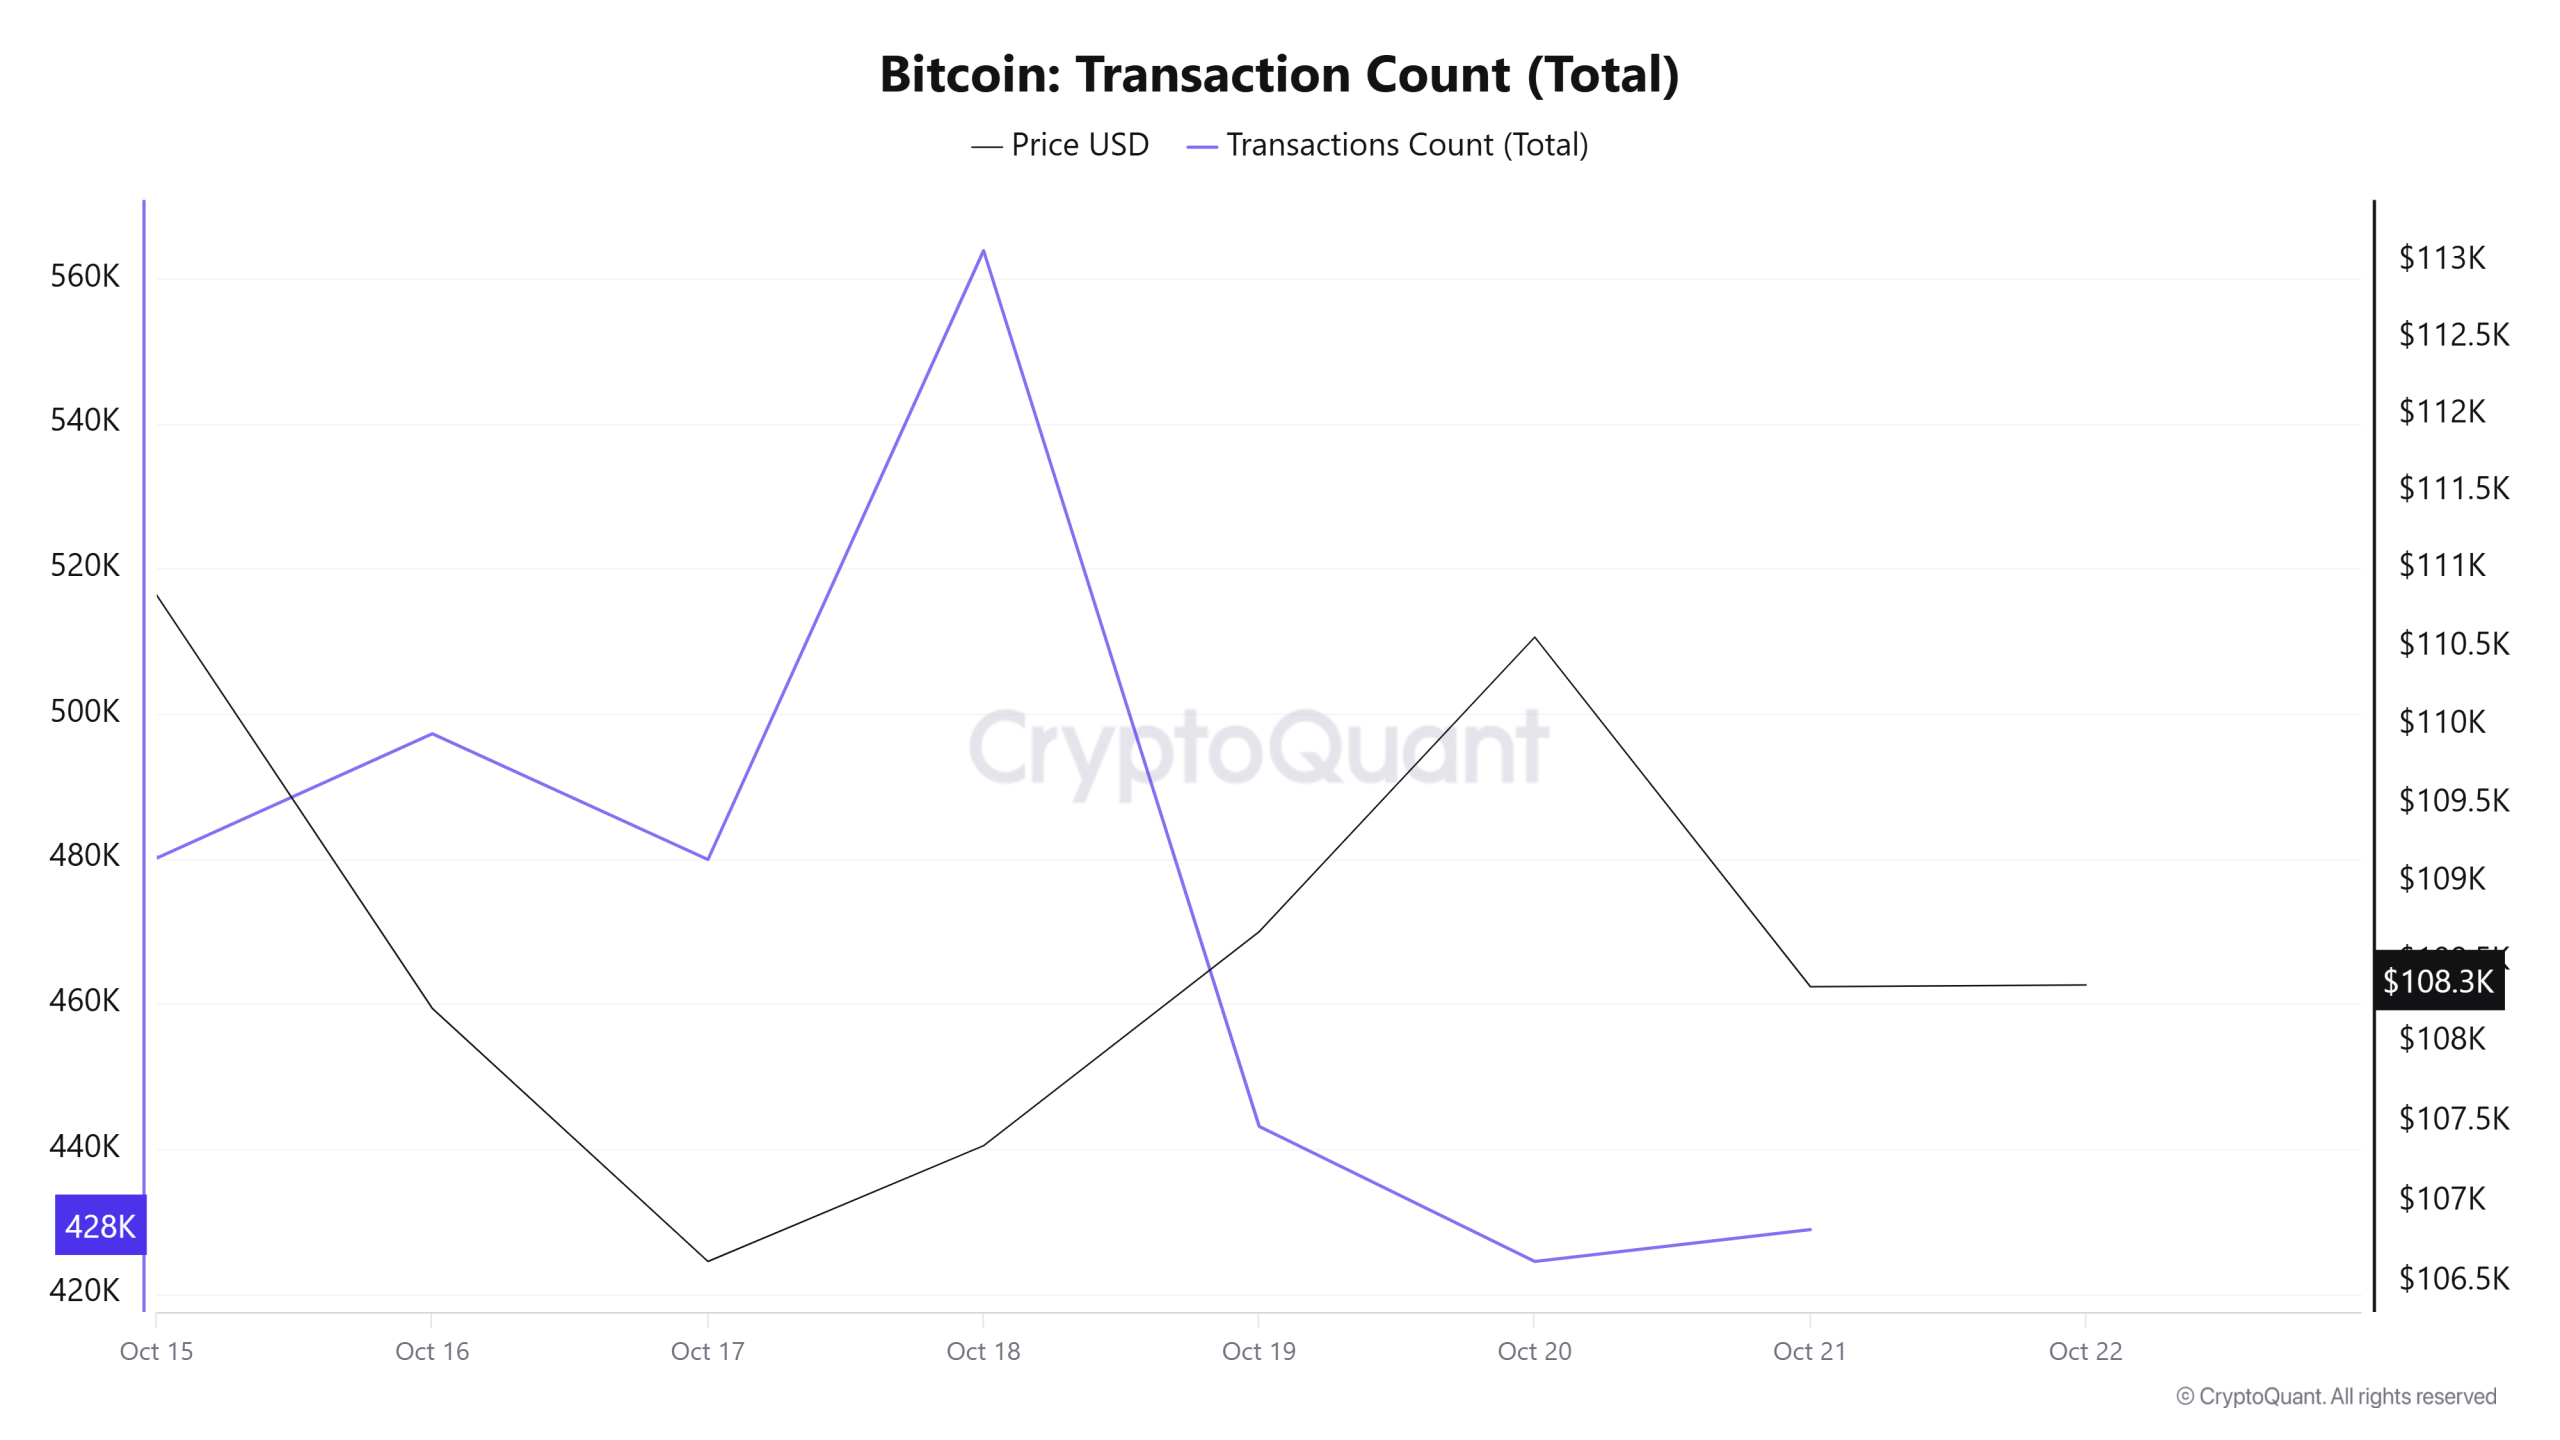
Last week, 3,171,664 transactions were processed on the Bitcoin network, while this week the number of transactions increased by 4.6% to 3,317,616. The highest transaction volume of the week occurred on October 18 with 563,853, while the lowest transaction count was recorded on October 20 with 424,504. The period between October 15-18 saw a sustained increase in transactions, peaking on the 18th before rapidly declining until October 21. The increase in transaction count compared to the previous period, coupled with the fact that transaction volume continued to rise over the weekend, creates an interesting situation that has been observed for three consecutive weeks. When examining the relationship between transaction count and price, a negative correlation ratio appears to be predominant throughout the week, suggesting that this period may have seen a higher concentration of transfers for selling Bitcoin.
Tokens Transferred
Last week, a total of 5,911,874 BTC was transferred, while this week the amount of tokens transferred decreased by 8.1% to 5,432,483 BTC. The highest daily transfer of the week occurred on October 17 with 1,023,023 BTC, while the lowest transfer volume was recorded on October 18 with 547,666 BTC. The correlation between the amount of tokens transferred and the price fluctuated throughout the period. In on-chain activity, the rapidly declining transfer amounts on October 17-18, combined with the transaction count peaking on the 18th, suggest that the movements on October 17 were driven by whale activity, while those on the 18th were driven by small investors’ actions, creating price action. Therefore, it is highly probable that the high-capital segment purchased at the local bottom price during the period, while the low-capital segment followed this movement one day later, as observed at .
Whale Activities
Whale Data
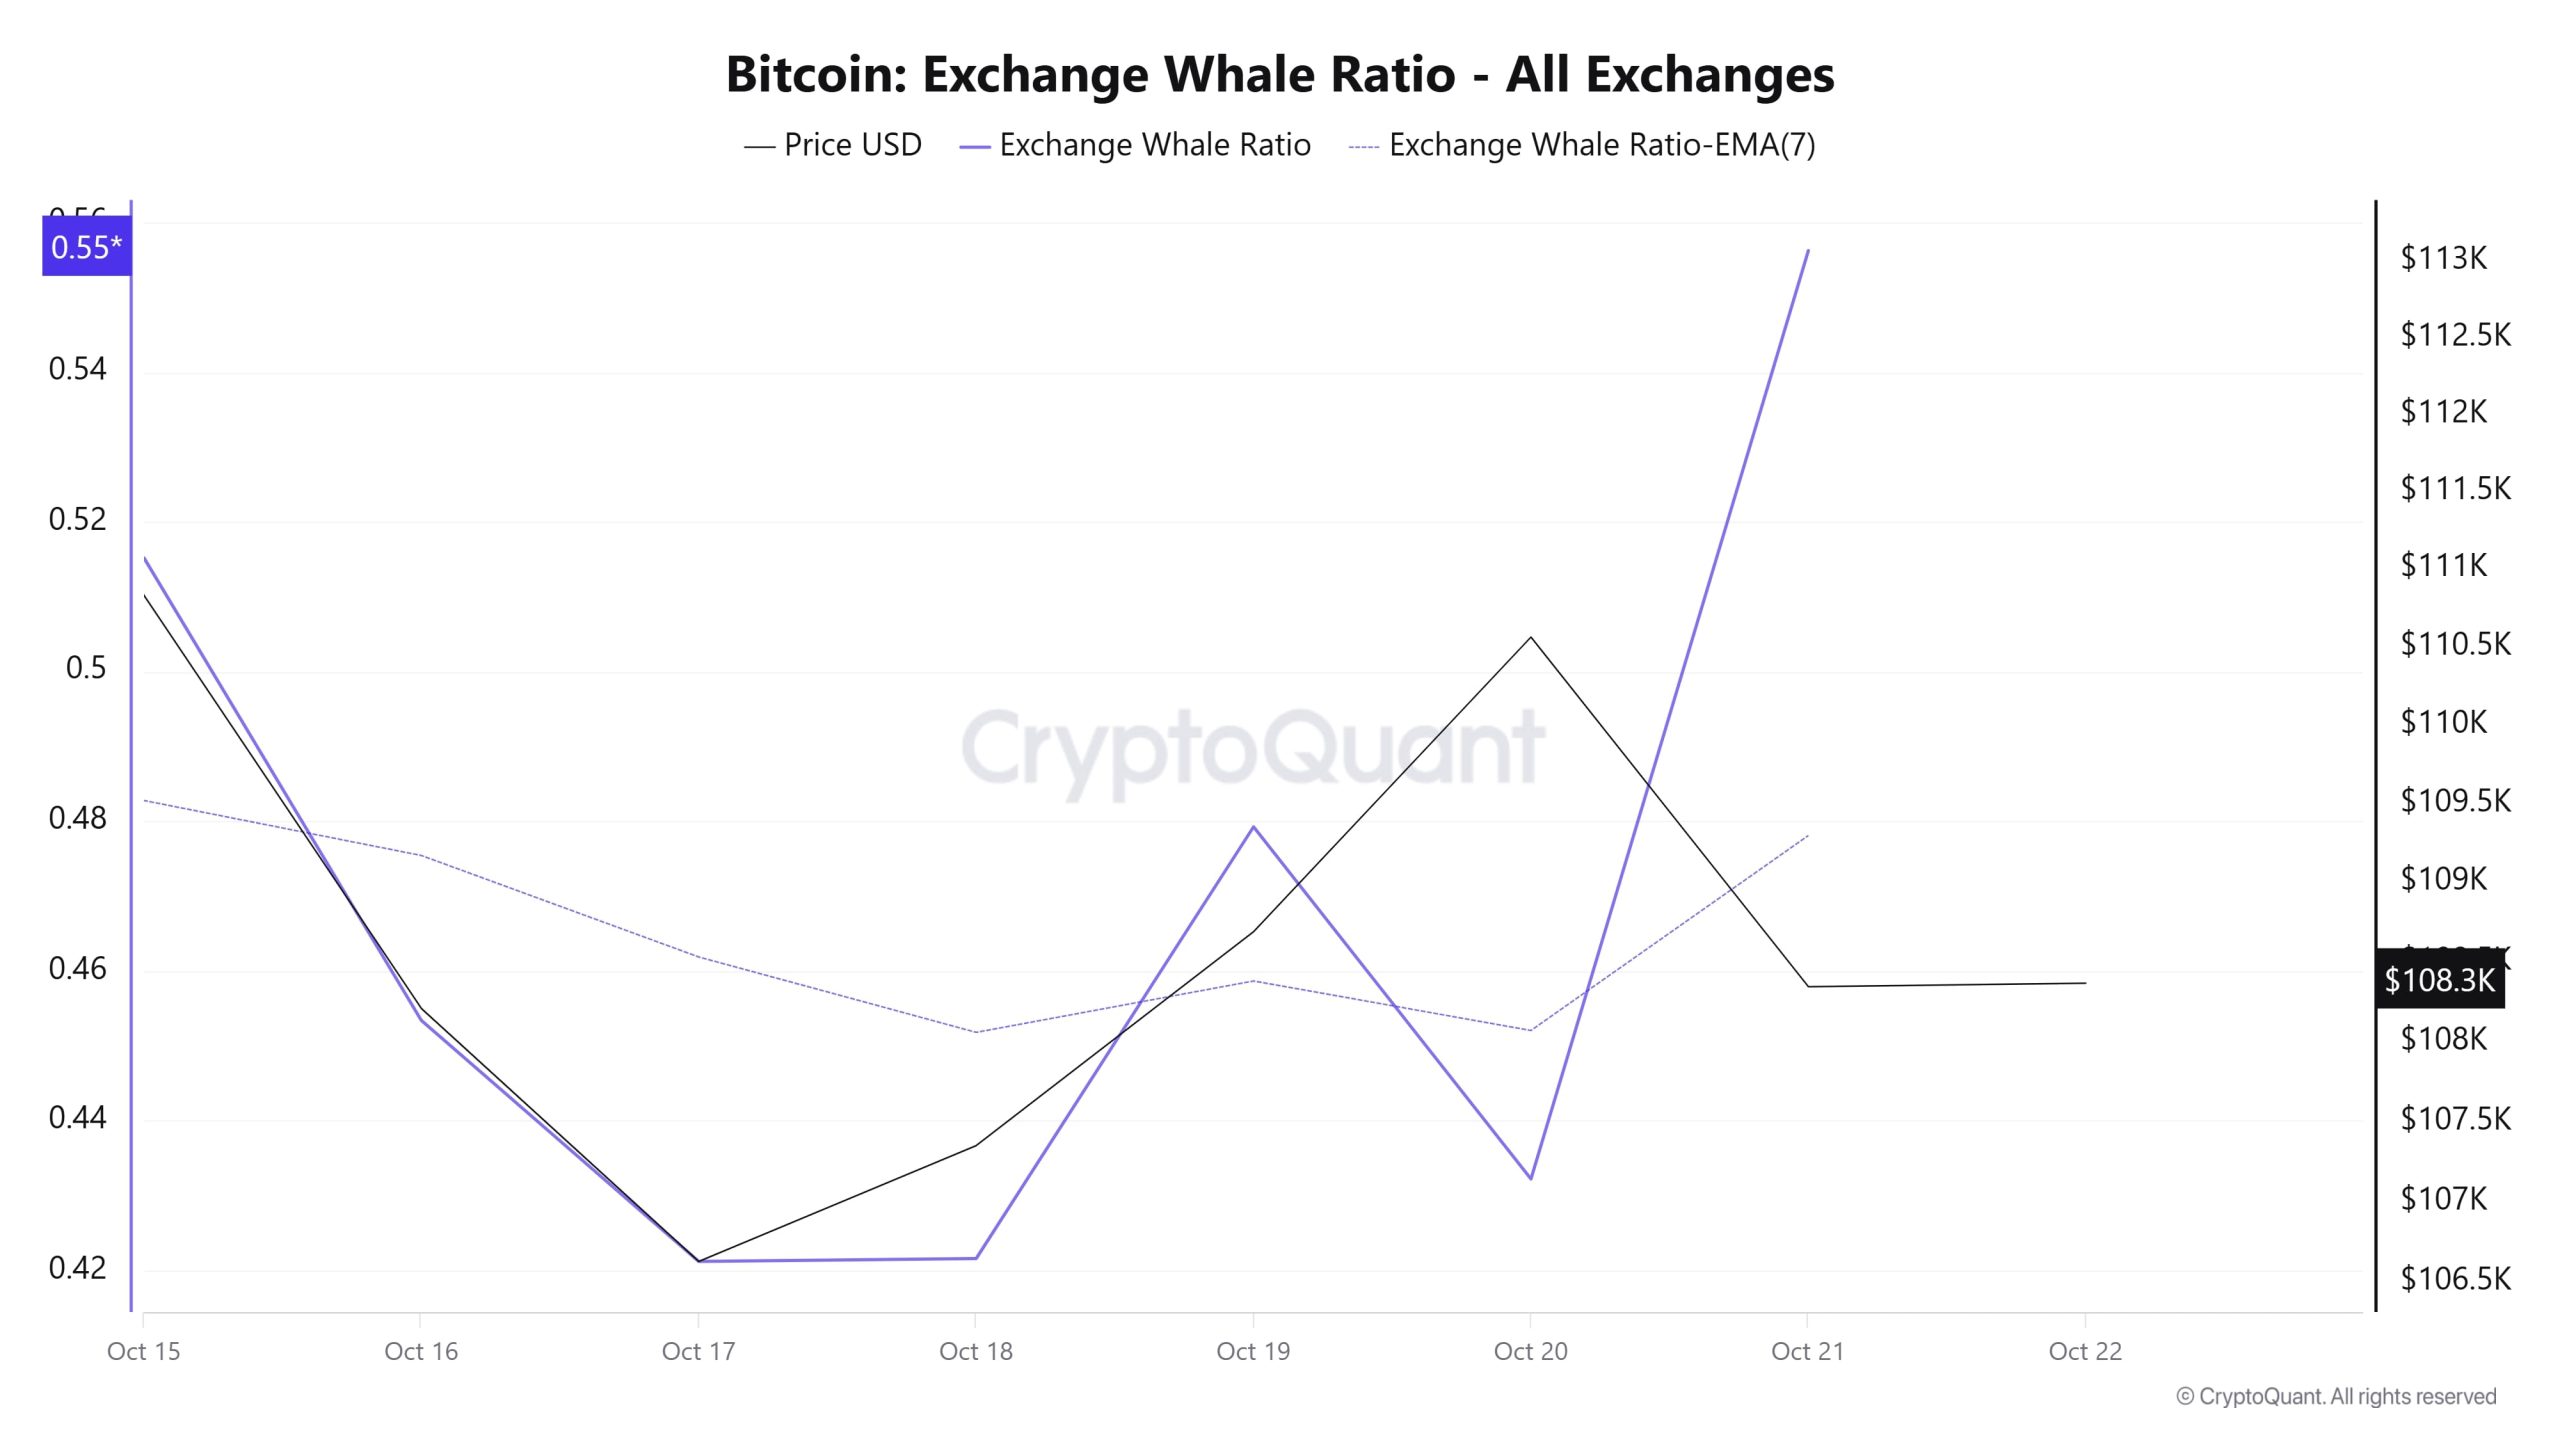
According to data from the cryptocurrency market over the last 7 days, whale activity on centralized exchanges declined from the beginning to the middle of the period but began to rise after the middle of the period. Looking at the Exchange Whale Ratio metric, on October 15, the first day of the 7-day period, the ratio of whales using centralized exchanges was 0.515. It reached its lowest point on October 18, falling to 0.421. When this ratio is above the 0.35–0.45 range, it generally means that whales are frequently using centralized exchanges. Currently at 0.556, the metric is also at its highest point in the process. BTC traded between $103,700 and $113,600 during this period. At the same time, total BTC transfers decreased by 8% compared to last week, with 5,432,483 BTC moving. Whales are increasingly transferring their crypto assets to exchange-traded funds (ETFs). Asset managers such as BlackRock are actively collaborating with these investors. Over $3 billion has been converted into spot Bitcoin ETFs. On-chain data showed that the number of whale addresses holding between $10,000 and $100,000 in BTC continues to decline. In contrast, it showed that addresses holding between 100 and 1,000 Bitcoin continue to increase. The downward trend, accompanied by market uncertainty and high liquidations, does not appear to have ended yet. As a result, Bitcoin’s current on-chain dynamics indicate that the market is under selling pressure.
BTC Onchain Overall
| Metric | Positive 📈 | Negative 📉 | Neutral ➖ |
|---|---|---|---|
| Active Addresses | ✓ | ||
| Breakdowns | ✓ | ||
| Derivatives | ✓ | ||
| Supply Distribution | ✓ | ||
| Exchange Supply Ratio | ✓ | ||
| Exchange Reserve | ✓ | ||
| Fees and Revenues | ✓ | ||
| Miner Flows | ✓ | ||
| Transaction | ✓ | ||
| Whale Activity | ✓ |
*The metrics and guidance provided in the table do not alone explain or imply any expectation regarding future price changes in any asset. Digital asset prices can fluctuate based on numerous variables. The on-chain analysis and related guidance are intended to assist investors in their decision-making process, and basing financial investments solely on the results of this analysis may lead to unfavorable outcomes. Even if all metrics produce positive, negative, or neutral results simultaneously, the expected outcomes may not materialize depending on market conditions. It would be beneficial for investors reviewing the report to take these warnings into consideration.
Legal Notice
The investment information, comments, and recommendations contained in this document do not constitute investment advisory services. Investment advisory services are provided by authorized institutions on a personal basis, taking into account the risk and return preferences of individuals. The comments and recommendations contained in this document are of a general nature. These recommendations may not be suitable for your financial situation and risk and return preferences. Therefore, making an investment decision based solely on the information contained in this document may not result in outcomes that align with your expectations.
NOTE: All data used in Bitcoin on-chain analysis is based on CryptoQuant.