
Technical Analysis – November 19, 2025
BTC/USDT
ADP’s weekly employment indicator points to a gradual improvement in job losses, while the increase in jobless claims maintains uncertainty due to data updates. Fed members adopted a cautious stance, emphasizing that a December rate cut is not guaranteed, while President Trump announced his decision on the new Fed chair. On the international front, Saudi Arabia’s pledge to increase investments in the US is noteworthy, while the lack of progress in China-Japan talks keeps global risk headlines on the agenda.
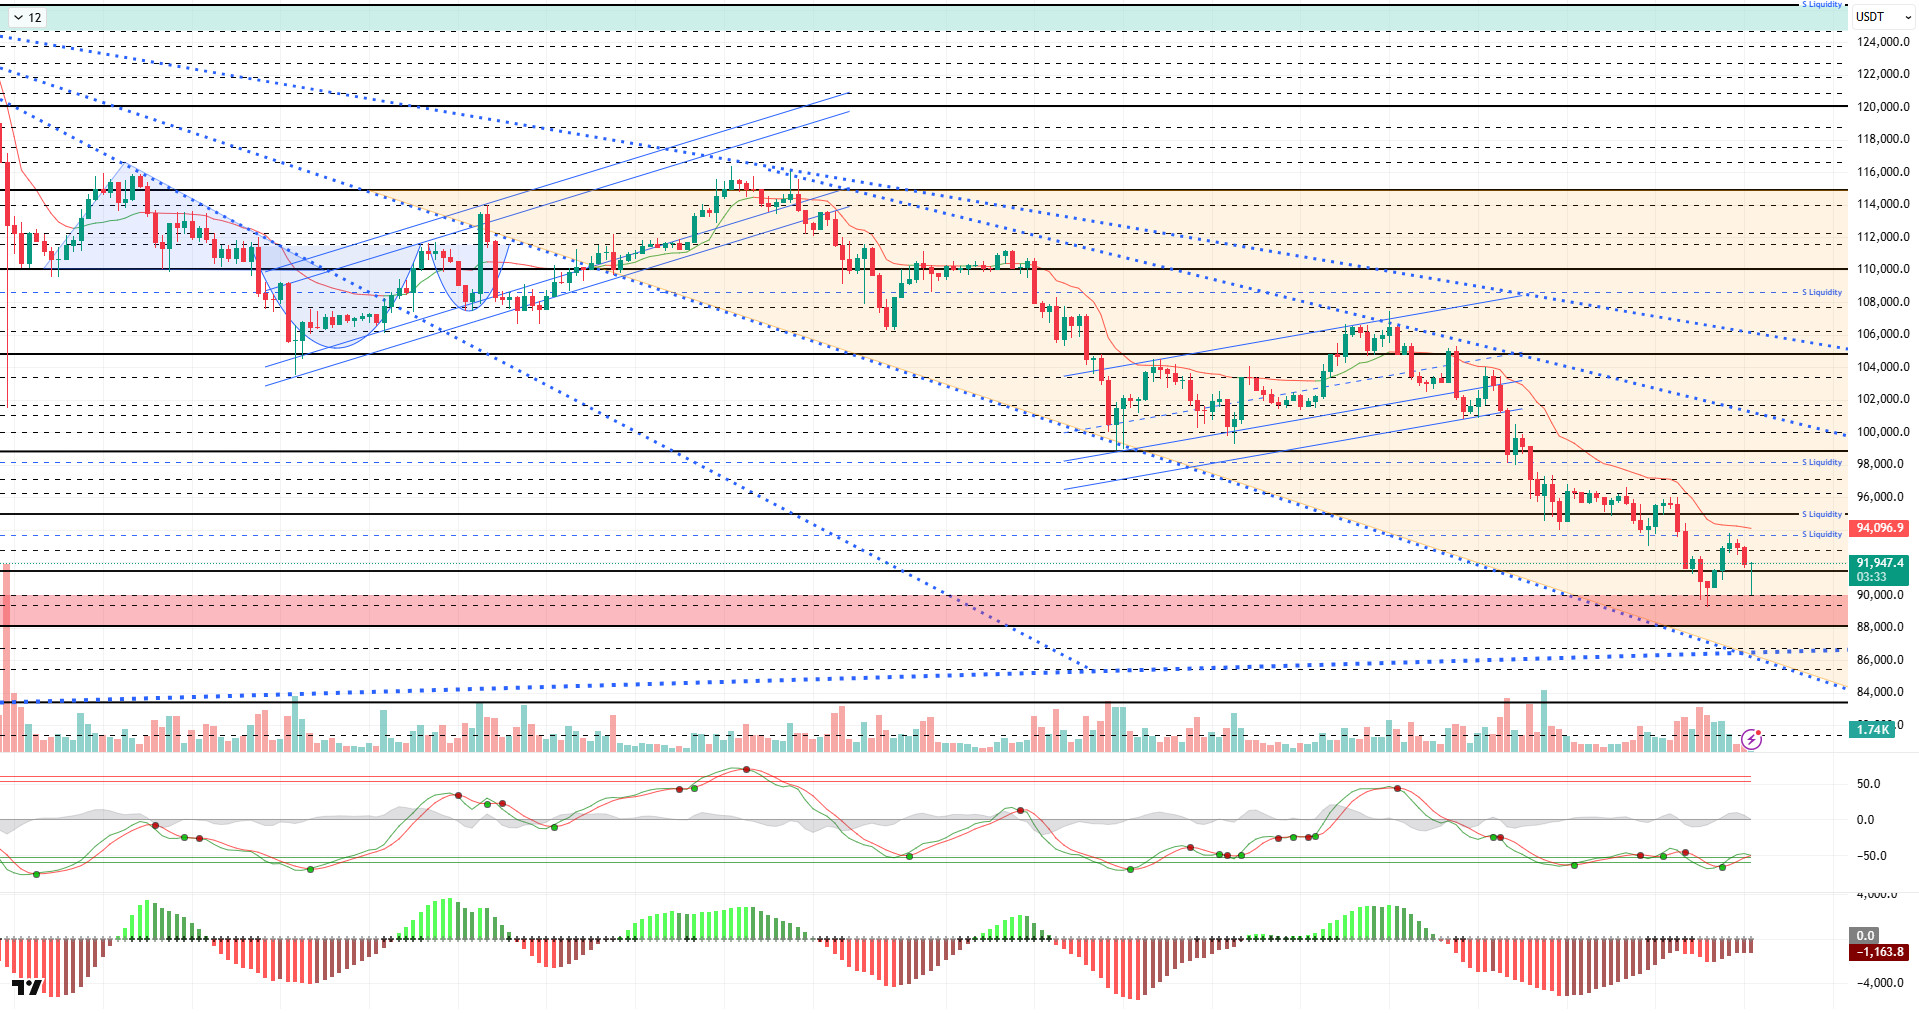
Technically speaking, BTC tested the 93,700 level with yesterday’s jump. However, unable to stay there, the price reversed direction and spiked to the 90,000 level. The price, which recorded a weak rebound within the falling trend structure, continues to look bearish and is trading at the 92,000 level at the time of writing.
Technical indicators reflect indecision, with the Wave Trend (WT) oscillator generating a buy signal in the oversold zone, while the histogram on the Momentum (SM) indicator is attempting to regain strength after reaching maximum weakness in the negative zone. The Kaufman Moving Average (KAMA) is currently positioned above the price at the $94,000 level.
According to liquidation data, the recent decline has largely liquidated short- and medium-term buy levels, while annual buy levels appear to be targeted. However, the weight of sell levels continues to be evident. As the selling pressure increases, the short-term level at $93,000 is being liquidated, while the next selling level is concentrated at $94,000. Accumulation continues within the $97,000–$98,000 range over a broader time frame.
In summary, the weakening of expectations for Fed interest rate cuts, the decline in the value of technology stocks in global markets, and increasing geopolitical risks are significantly increasing selling pressure in the market. On the technical side, while the price continues to sustain its reaction from the 89,000 level, the weight of sell-side positions continues in liquidity data. Going forward, closing above the 90,000 level again will be critical for the price to gain momentum, and the 93,700 resistance level will be monitored once more in an upward movement. In the event of potential selling pressure, the 90,000 level emerges as a critical reference point.
Supports: 90,000 – 89,000 – 88,100
Resistances: 91,400 – 92,600 – 93,700
ETH/USDT
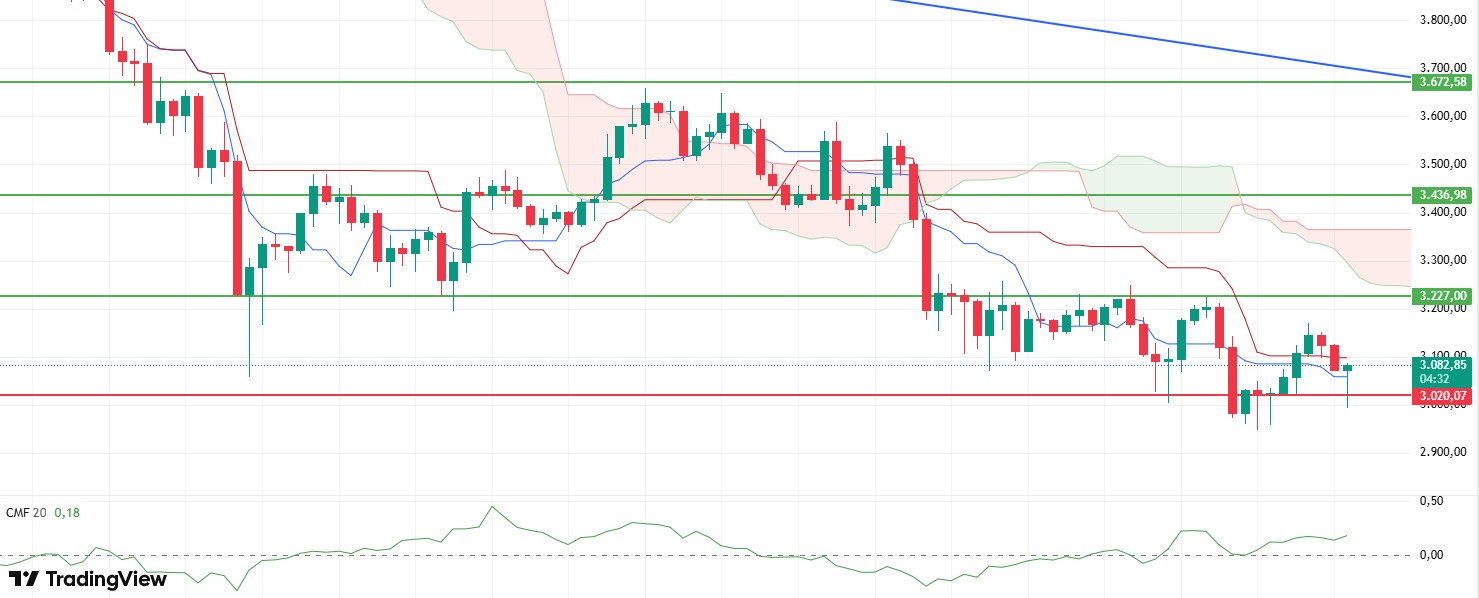
After rising to $3,170 yesterday evening, ETH fell below $3,000 in the morning due to selling pressure in this region. With short-term rebound buying, the price regained the $3,020 level and is currently trying to stabilize around the $3,080 region. Despite the sharp pullback, the price’s quick recovery indicates that buyers are still active in the short term.
The Chaikin Money Flow (CMF) indicator continued its upward movement in positive territory despite the morning’s decline. The uninterrupted liquidity flow and the indicator’s strengthening suggest that the downward movement stemmed primarily from futures positions. The sustained demand on the spot side supported the price’s rapid rebound from below $3,000.
In the Ichimoku indicator, the price breaking above the Tenkan level again strengthens the short-term positive trend. However, the price still trading below the kumo cloud indicates that a clear trend reversal has not yet formed. The failure to settle above the Kijun level also signals that medium-term pressure persists.
The $3,020 level is the main support point for the day. As long as the price holds above this level, the possibility of a move towards the $3,227 resistance zone remains strong. A drop below $3,020 could accelerate selling pressure and trigger a deeper pullback.
Below the Form
Supports: 3,020 – 2,760 – 2,550
Resistances: 3,227 – 3,436 – 3,672
XRP/USDT
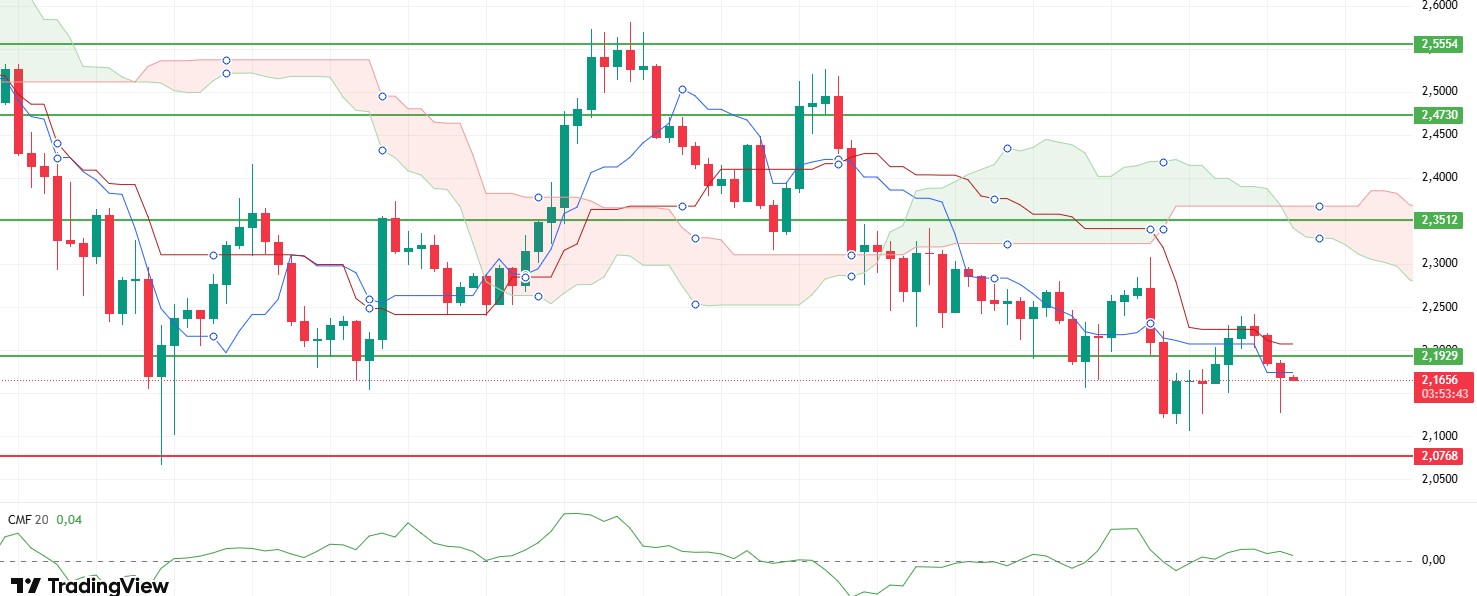
XRP broke through the $2.19 resistance level yesterday, rising to $2.23, but pulled back to $2.13 in the morning hours due to selling pressure in that region. Following this sharp correction in price, buyers have re-entered the market, and XRP is currently attempting to stabilize around $2.17. In the short term, the entry of rebound buying has prevented the price from shifting into a completely weak structure.
The Chaikin Money Flow (CMF) indicator maintaining a flat appearance in the positive zone indicates that market liquidity remains balanced and there has been no strong outflow. The steady flow of liquidity helps the price seize the opportunity to recover after a sharp decline.
On the Relative Strength Index (RSI) side, the weak structure persists. As the indicator moves sideways, no strong momentum is observed. This scenario suggests that short-term upward attempts may remain limited.
The Ichimoku indicator shows a largely similar picture. The price remaining below the kumo cloud indicates that there has been no improvement in the trend structure and that technical pressure persists. The failure to stay above the Tenkan and Kijun levels also suggests that short-term weakness remains intact.
In the overall outlook, regaining the $2.19 level could increase the likelihood of strengthening in the short term and support a recovery. If the price remains below this level, price movements may continue within a narrow band, and a weak outlook may prevail, bringing a horizontal structure to the fore.
Supports: 2.0768 – 1.9092 – 1.7729
Resistances: 2.1929 – 2.3512 – 2.4730
SOL/USDT
Arkham Intelligence data shows that the company transferred over $200 million worth of SOL to a centralized exchange. Forward Industries transferred 1.9 million SOL to a centralized exchange. VanEck launched a zero-commission Solana Staking ETF.
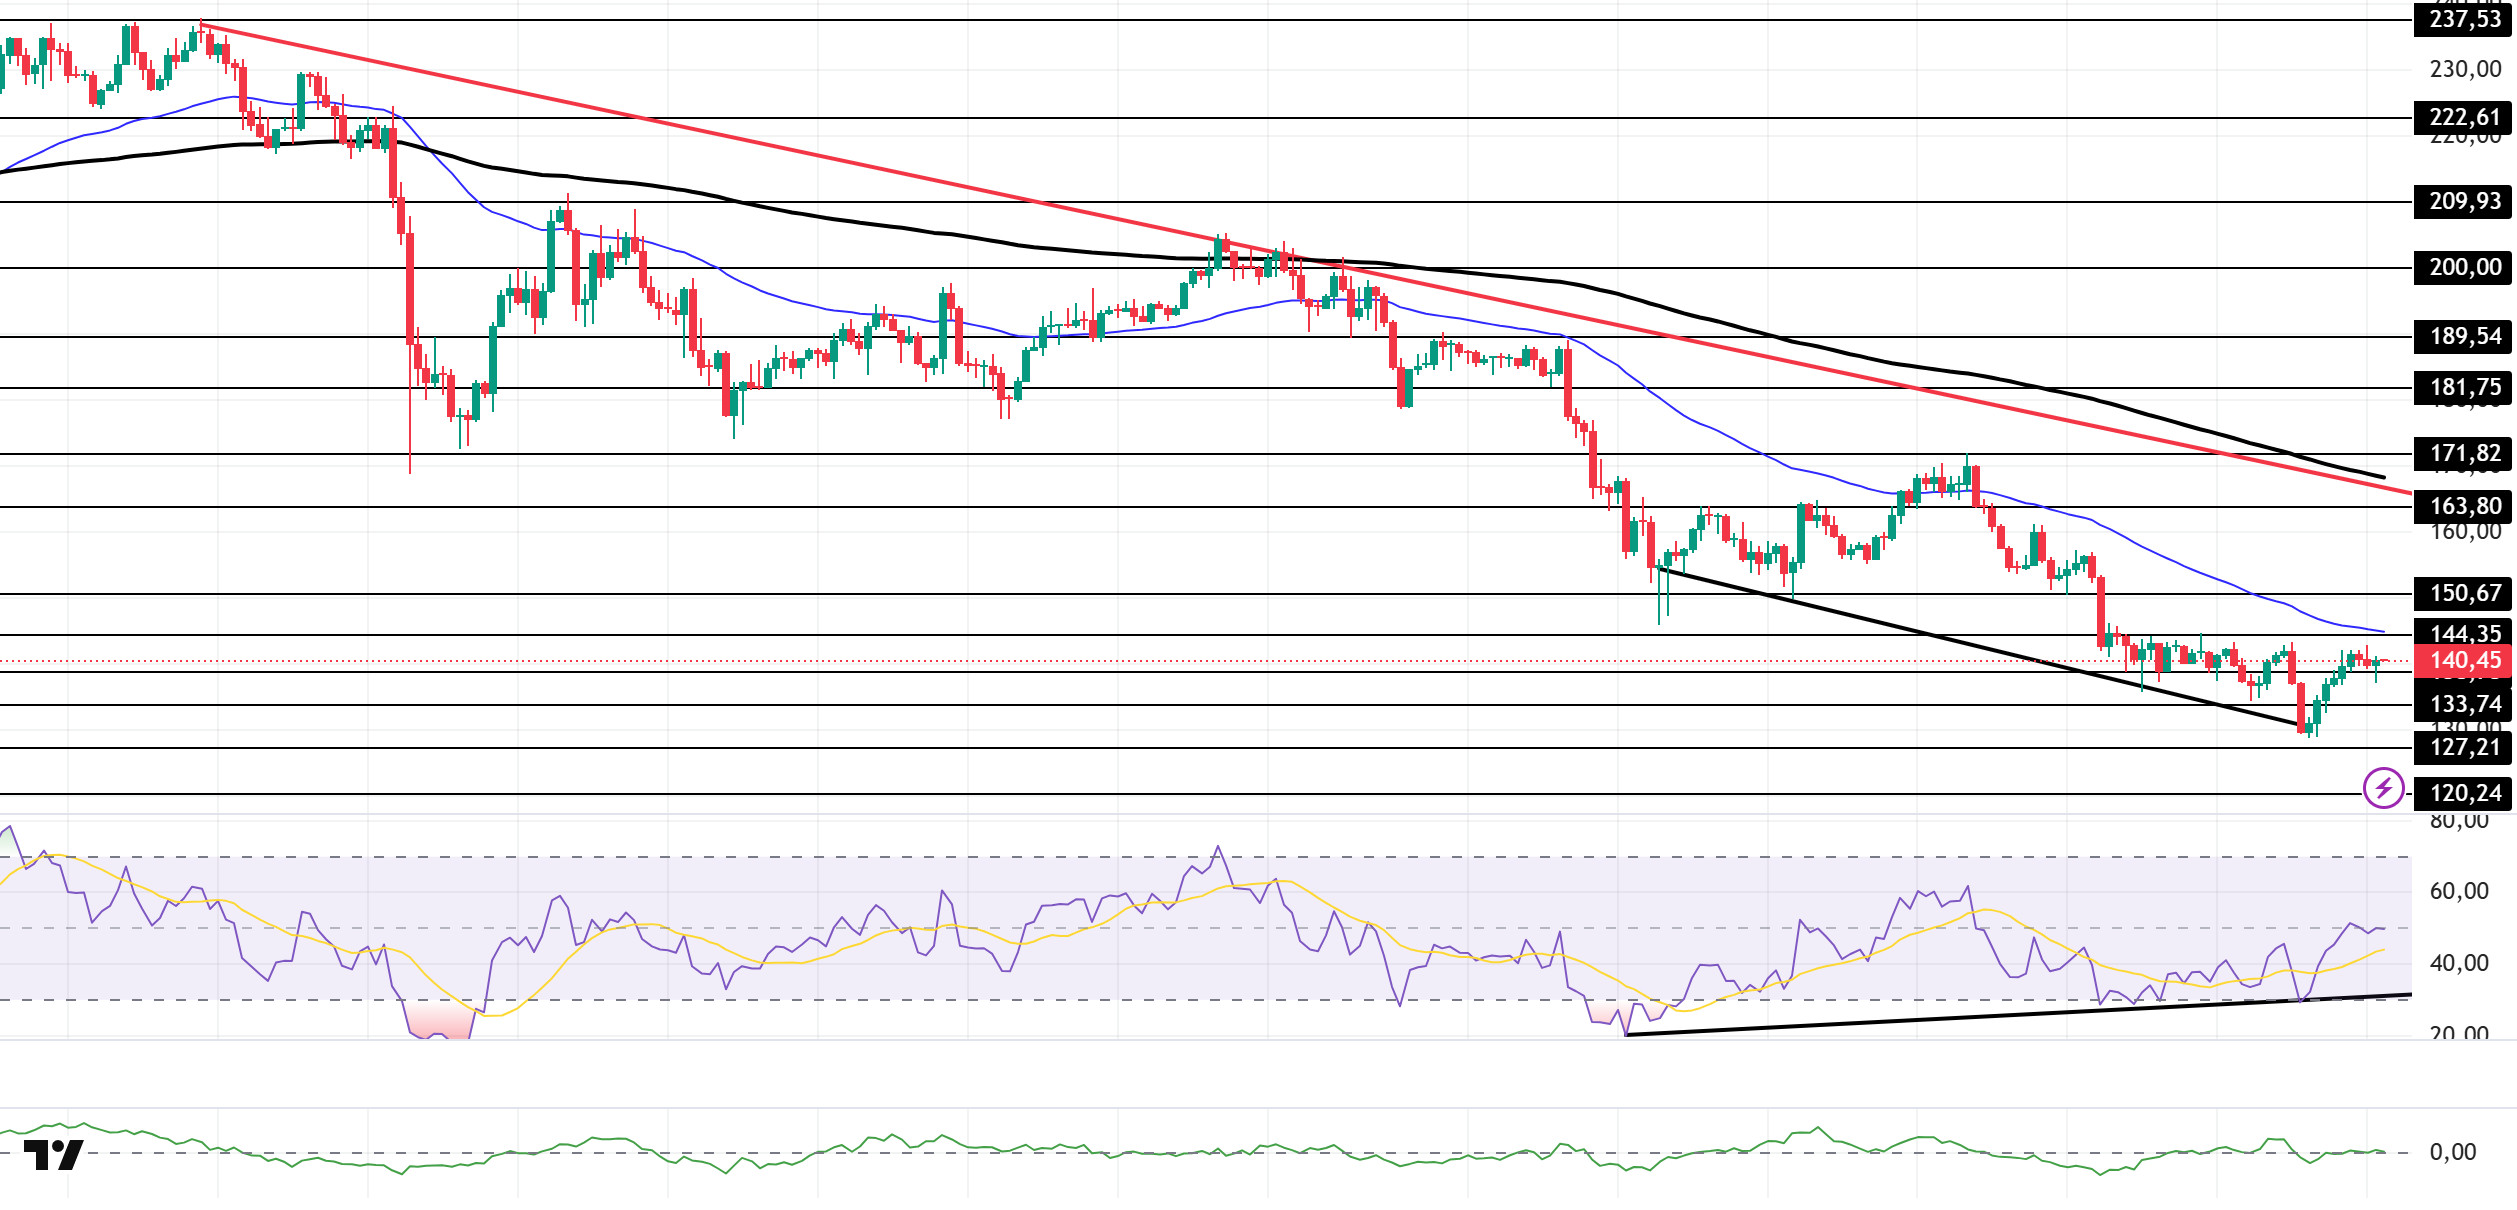
The SOL price traded sideways. The asset remained in the lower region of the downtrend that began on October 6. Breaking below the strong support level of $133.74 with a strong candle, the price gained momentum and rose above the $138.73 level. Currently testing the $138.73 level as support, the price could test the 50 EMA (Blue Line) moving average if the uptrend continues. If the pullback persists, the $127.21 level could act as support.
The price continued to remain below the 50 EMA (Exponential Moving Average – Blue Line) and 200 EMA (Black Line) on the 4-hour chart. This indicates a potential downtrend in the medium term. Additionally, the price being below both moving averages suggests a downward trend in the short term. On the other hand, the gap between the two moving averages shows that the asset may experience a horizontal or upward movement. Chaikin Money Flow (CMF-20) is at a neutral level. However, the balance in cash inflows may continue to keep the CMF at a neutral level. The Relative Strength Index (RSI-14) remained in negative territory. It is also above the rising line that began on November 4. This indicates increased buying pressure. There is also a bullish divergence. If there is an uptrend due to macroeconomic data or positive news related to the Solana ecosystem, the $150.67 level stands out as a strong resistance point. If this level is broken upwards, the uptrend is expected to continue. If pullbacks occur due to developments in the opposite direction or profit-taking, the $120.24 level could be tested. A decline to these support levels could increase buying momentum, presenting a potential upside opportunity.
Supports: 138.73 – 133.74 – 127.21
Resistances: 144.35 – 150.67 – 163.80
DOGE/USDT
The Grayscale Dogecoin ETF is expected to launch on November 24.
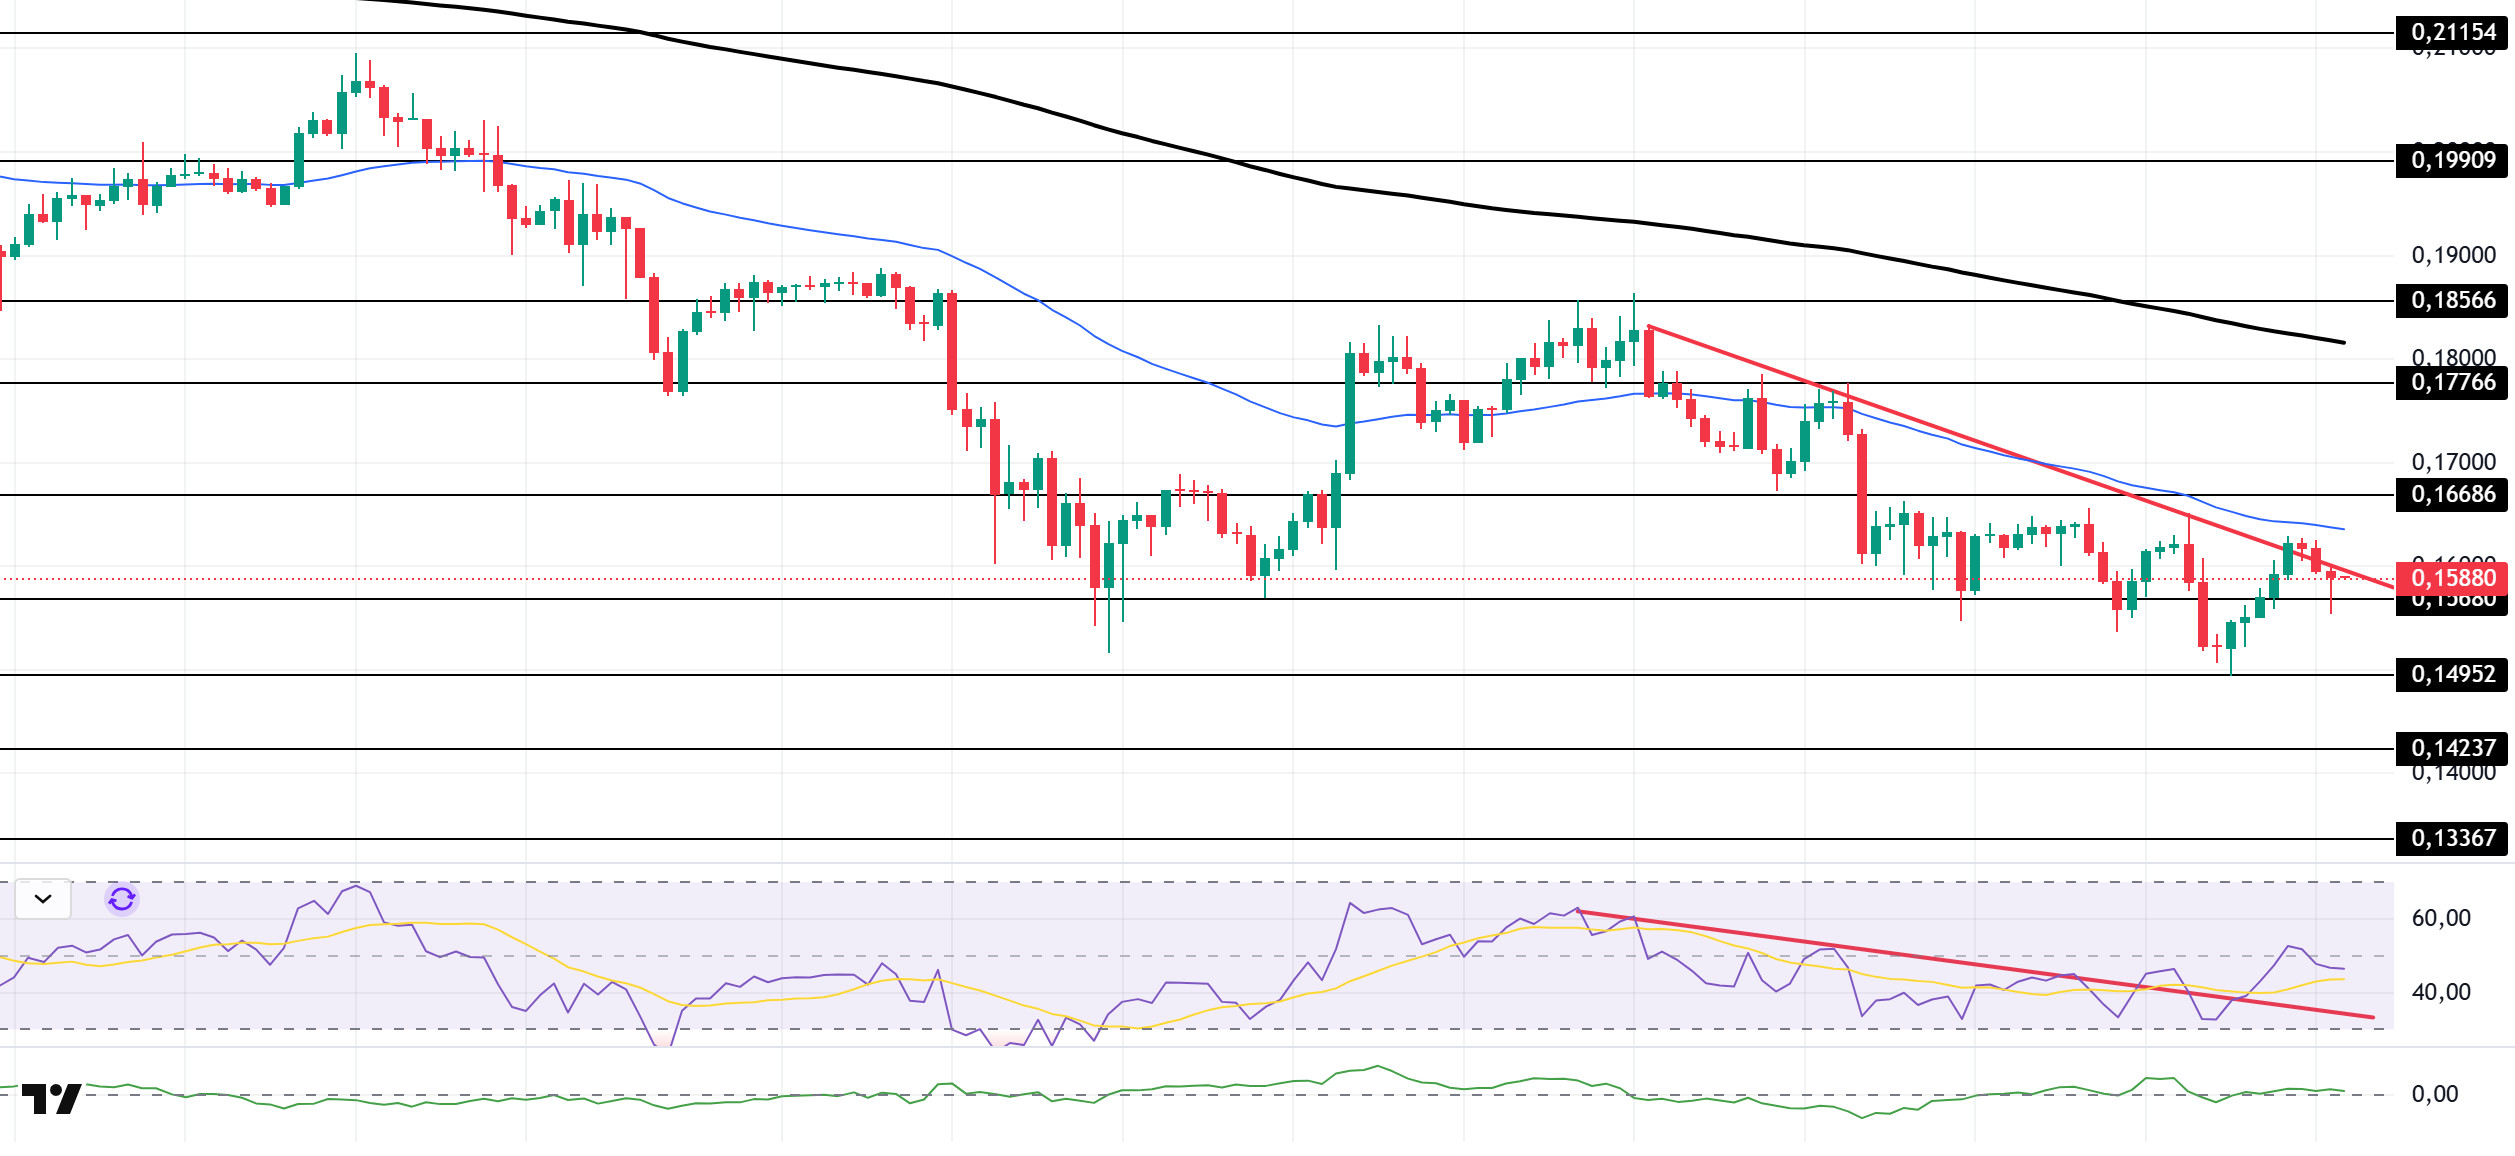
The DOGE price traded in a narrow range. The asset remained in the lower region of the downtrend that began on November 11. The price tested the downtrend and the 50 EMA (Blue Line) moving average as resistance and retreated from there. It is currently testing the $0.15680 level as support. If the uptrend continues, it may test the $0.16686 level as resistance. If it experiences a pullback, it may retest the $0.14952 level.
On the 4-hour chart, the 50 EMA (Exponential Moving Average – Blue Line) remained below the 200 EMA (Black Line). This indicates that a downtrend may begin in the medium term. The price being between the two moving averages indicates that the price is in a decision phase in the short term. On the other hand, the large difference between the two moving averages increases the potential for the asset to experience a horizontal or upward movement. The Chaikin Money Flow (CMF-20) is at a neutral level. Additionally, a decrease in cash inflows could push the CMF into negative territory. The Relative Strength Index (RSI-14) is in the middle of the negative zone. It also remained above the downward trend that began on November 10, indicating buying pressure. In the event of potential increases driven by political developments, macroeconomic data, or positive news flow within the DOGE ecosystem, the $0.17766 level emerges as a strong resistance zone. Conversely, in the event of negative news flow, the $0.14237 level could be triggered. A decline to these levels could increase momentum and initiate a new wave of growth.
Supports: 0.15680 – 0.14952 – 0.14237
Resistances: 0.16686 – 0.17766 – 0.18566
SHIB/USDT
In the second half of November, the flow of SHIB to centralized exchanges within the Shiba Inu ecosystem accelerated significantly. Approximately 60 billion SHIB were transferred to exchange wallets in the last 24 hours, while the total inflow over a few days reached around 120 billion. On-chain data showing that the amount of tokens entering exchanges exceeds the amount leaving them indicates that preparations for selling are coming to the fore in the market. In particular, the fact that similar-sized exchange inflows in the past have been followed by aggressive selling raises the possibility of a strong wave of selling this time around. Although some commentators suggest this movement could also be interpreted as large investors gradually accumulating tokens through liquidity sweeping and stop-hunting scenarios, the dominant signal in the current picture is that the accelerated flow of SHIB to exchanges is perceived as sales-oriented in the short term.
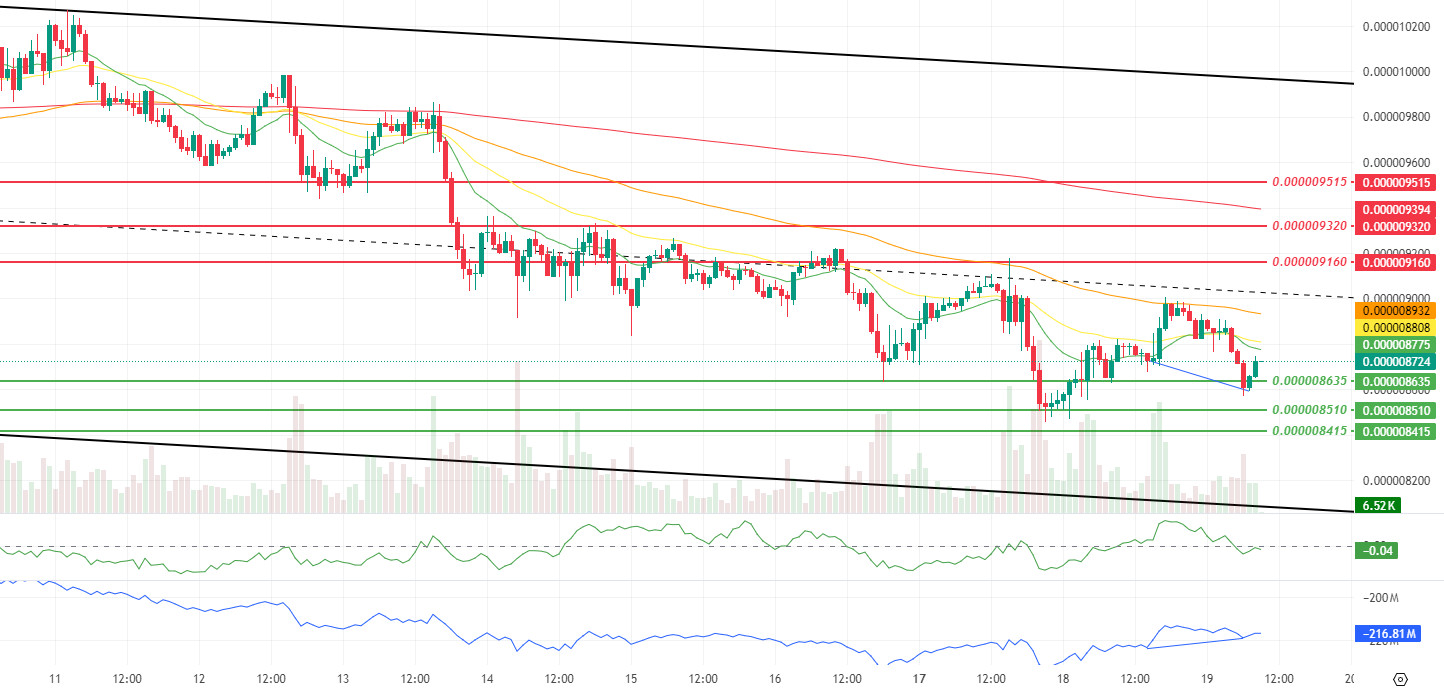
The technical picture shows that the bottom formation attempts highlighted in our previous analysis have begun to be digested amid weakening momentum and volatility. Although there was a pullback in both momentum and volatility compared to yesterday, the relatively limited decline in volume indicates that the selling pressure is progressing in a wait-and-see mode and with partial profit-taking rather than becoming aggressive. The fact that the price is still trading below the Smoothed Moving Average (SMMA) 9, SMMA 21, SMMA 50, and SMMA 200 periods confirms that the pressure in the main trend is maintained, while the positive divergence (Blue Line) observed between the On Balance Volume (OBV) oscillator and the price suggests that a gradual accumulation process may be underway in the bottom areas. The price moving towards the middle band of the descending channel makes this band a critical threshold in terms of direction confirmation in the short term, while the Chaikin Money Flow (CMF) indicator returning to negative territory indicates that the pace of new capital inflows is slowing and that current attempts at a rebound are struggling to evolve into a strong trend reversal for now.
In the short term, the $0.000008635, $0.000008510, and $0.000008415 bands remain the closest and most critical support levels; as long as the price manages to hold above this region, attempts to rebound towards the $0.000008735 and $0.000008881 levels may remain on the agenda, supported by the positive divergence in the OBV. If these thresholds are breached, the $0.000009160, $0.000009320, and $0.000009515 levels emerge as the first significant resistance zones. Particularly, if these upper resistances are permanently retaken with increasing volume, a clearer confirmation of recovery can be obtained on the momentum side, and a more meaningful upward scenario towards the upper bands of the descending channel structure may come into play. Conversely, if the price continues to remain below the SMMA periods and the descending channel structure, and the Chaikin Money Flow (CMF) indicator continues to move in negative territory, the current pricing should be considered a weakened downtrend phase, limited by the rebound potential provided by the positive OBV divergence within the main downtrend. (SMMA9: Green Line, SMMA21: Yellow Line, SMMA50: Orange Line, SMMA 200: Red Line)
Supports: 0.000008635 – 0.000008510 – 0.000008415
Resistances: 0.000009160 – 0.000009320 – 0.000009515
Legal Notice
The investment information, comments, and recommendations contained herein do not constitute investment advice. Investment advisory services are provided individually by authorized institutions taking into account the risk and return preferences of individuals. The comments and recommendations contained herein are of a general nature. These recommendations may not be suitable for your financial situation and risk and return preferences. Therefore, making an investment decision based solely on the information contained herein may not produce results in line with your expectations.

