
Technical Analysis
BTC/USDT
While Fed members remain divided over expectations for interest rate cuts, mixed non-farm payroll data continues to split market pricing ahead of the December meeting. Amid this divergence, Trump’s Fed chair nominee Kevin Hassett is further fueling the debate by arguing that slowing the pace of easing would deepen the economic slowdown. The US moving seized crypto assets to new wallets is being watched as a sign of large-scale activity, while on the geopolitical front, Trump’s attempt to rebuild relations with Pakistan and Japan’s stimulus package drew attention.
From a technical perspective, BTC continued its relentless decline, falling below the major trend support and spiking to the 81,400 level amid heavy selling pressure. After testing the 93,000 level in the previous analysis, the price lost the 90,000 and 85,000 reference areas, recording seven consecutive negative candles. At the time of writing, the price is trading at the 84,400 level amid a rebound.
Technical indicators show that the Wave Trend (WT) oscillator, after an indecisive buy/sell signal, turned upward by giving a buy signal but then returned to the oversold zone. The histogram on the Momentum (SM) indicator, after reaching maximum weakness in the negative zone, once again failed in its attempt to regain strength. The Kaufman Moving Average (KAMA) is currently at the $89,000 level, positioned above the price.
According to liquidation data, while trades opened last year in the buy zone were targeted, the entire 80,000 band resulted in liquidation. In contrast, selling levels remain concentrated at $88,000 and $94,000, while accumulation continues within the broader $97,000–$98,000 range.
In summary, while disagreements over expectations for a December interest rate cut in the Fed minutes and pressure from geopolitical developments came to the fore, US unemployment data came in above expectations. Nvidia’s strong earnings report had a limited positive impact on the price. On the technical side, the price continued its downward momentum, pulling the new low to 81,400. Liquidity data indicates that selling-heavy positions continue to dominate. For a subsequent rebound, the price will need to retest the 85,000 level and then follow the major trend line; otherwise, selling pressure will intensify, and the 81,400 level will be monitored as a new low.
Supports: 83,300 – 81,400 – 80,000
Resistances: 85,400 – 86,700 – 88,000

ETH/USDT
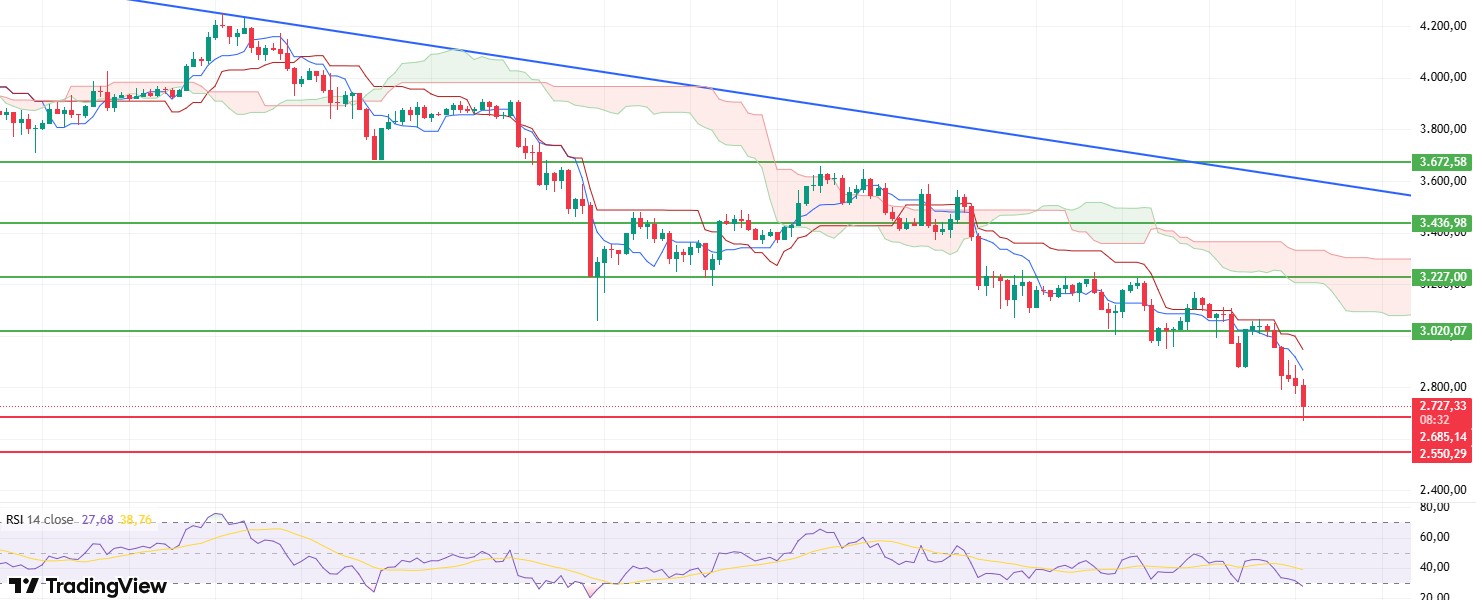
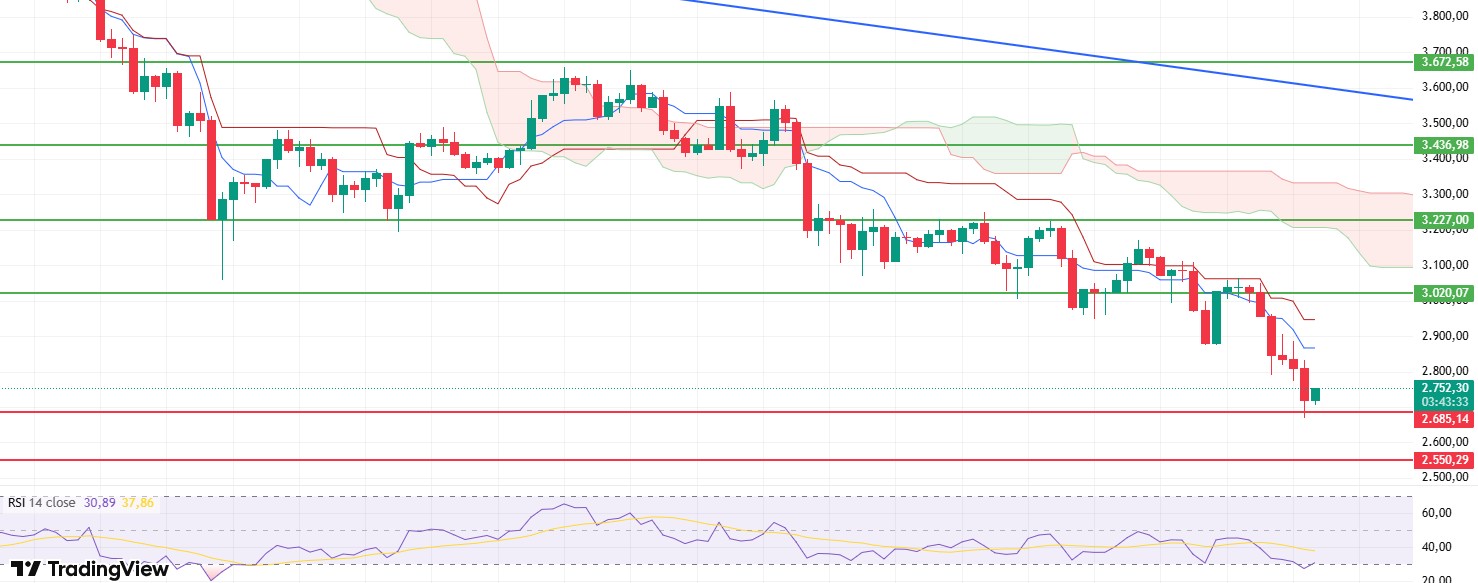
The ETH price fell below the $3,020 level yesterday evening and then dropped to $2,700 in the morning hours as selling pressure intensified. This sharp decline clearly showed that the market is struggling to find direction in the short term and that buyers are pulling back.
The Chaikin Money Flow (CMF) indicator has moved back into negative territory, signaling a marked increase in liquidity outflows. The Cumulative Volume Delta (CVD) indicator, which had remained strong on the spot side in recent days, also turned downward as of yesterday, supporting the weakness on the CMF side and confirming that selling pressure has intensified across the market.
The Relative Strength Index (RSI) indicator has fallen to the oversold zone. The indicator still maintains its weak appearance and reflects continued momentum loss. This structure indicates that short-term rebound rallies may remain limited.
The Tenkan level has been lost again in the Ichimoku indicator. With the price remaining below both the Kijun level and the kumo cloud, the technical structure has completely shifted into negative territory. This outlook indicates that the downtrend is still effective and sellers remain in control.
Looking at the overall picture, the ETH price is likely to test the $2,685 support level during the day. If it stays below this level, the decline is expected to continue. If it stays above $2,685, limited rebound rallies may be seen, but technical indicators do not yet support a strong recovery.
Below the Form
Supports: 2,685 – 2,550 – 2,331
Resistances: 3,020 – 3,227 – 3,436
XRP/USDT
After losing its $2.07 support level yesterday, the XRP price fell to $1.85 as selling accelerated. Reactionary buying in this region pushed the price back above the critical $1.90 threshold, and it is currently attempting to stabilize at the $1.94 level. In the short term, the price appears to be trying to hold above support after sharp volatility.
The Relative Strength Index (RSI) fell to the oversold zone, clearly revealing the weakness in momentum. Although the indicator remains weak, a possible rebound from the oversold zone could pave the way for short-term attempts by buyers.
The Chaikin Money Flow (CMF) continues its downward movement in negative territory, indicating intensified liquidity outflows. The continued weakness of capital inflows into the market signals that buyers are still struggling to gather strength.
The Ichimoku indicator maintains its weak outlook. The price remaining below the cloud and the inability to sustain levels above short-term resistance indicate that the trend has not yet turned positive. The technical structure generally remains seller-dominated.
Looking at the overall picture, as long as the XRP price stays above the $1.90 level, upward attempts may be seen. However, if this level is lost, selling pressure is expected to increase again, and steeper declines may come to the fore.
Supports: 2.0768 – 1.9092 – 1.7729
Resistances: 2.1929 – 2.3512 – 2.4730
SOL/USDT
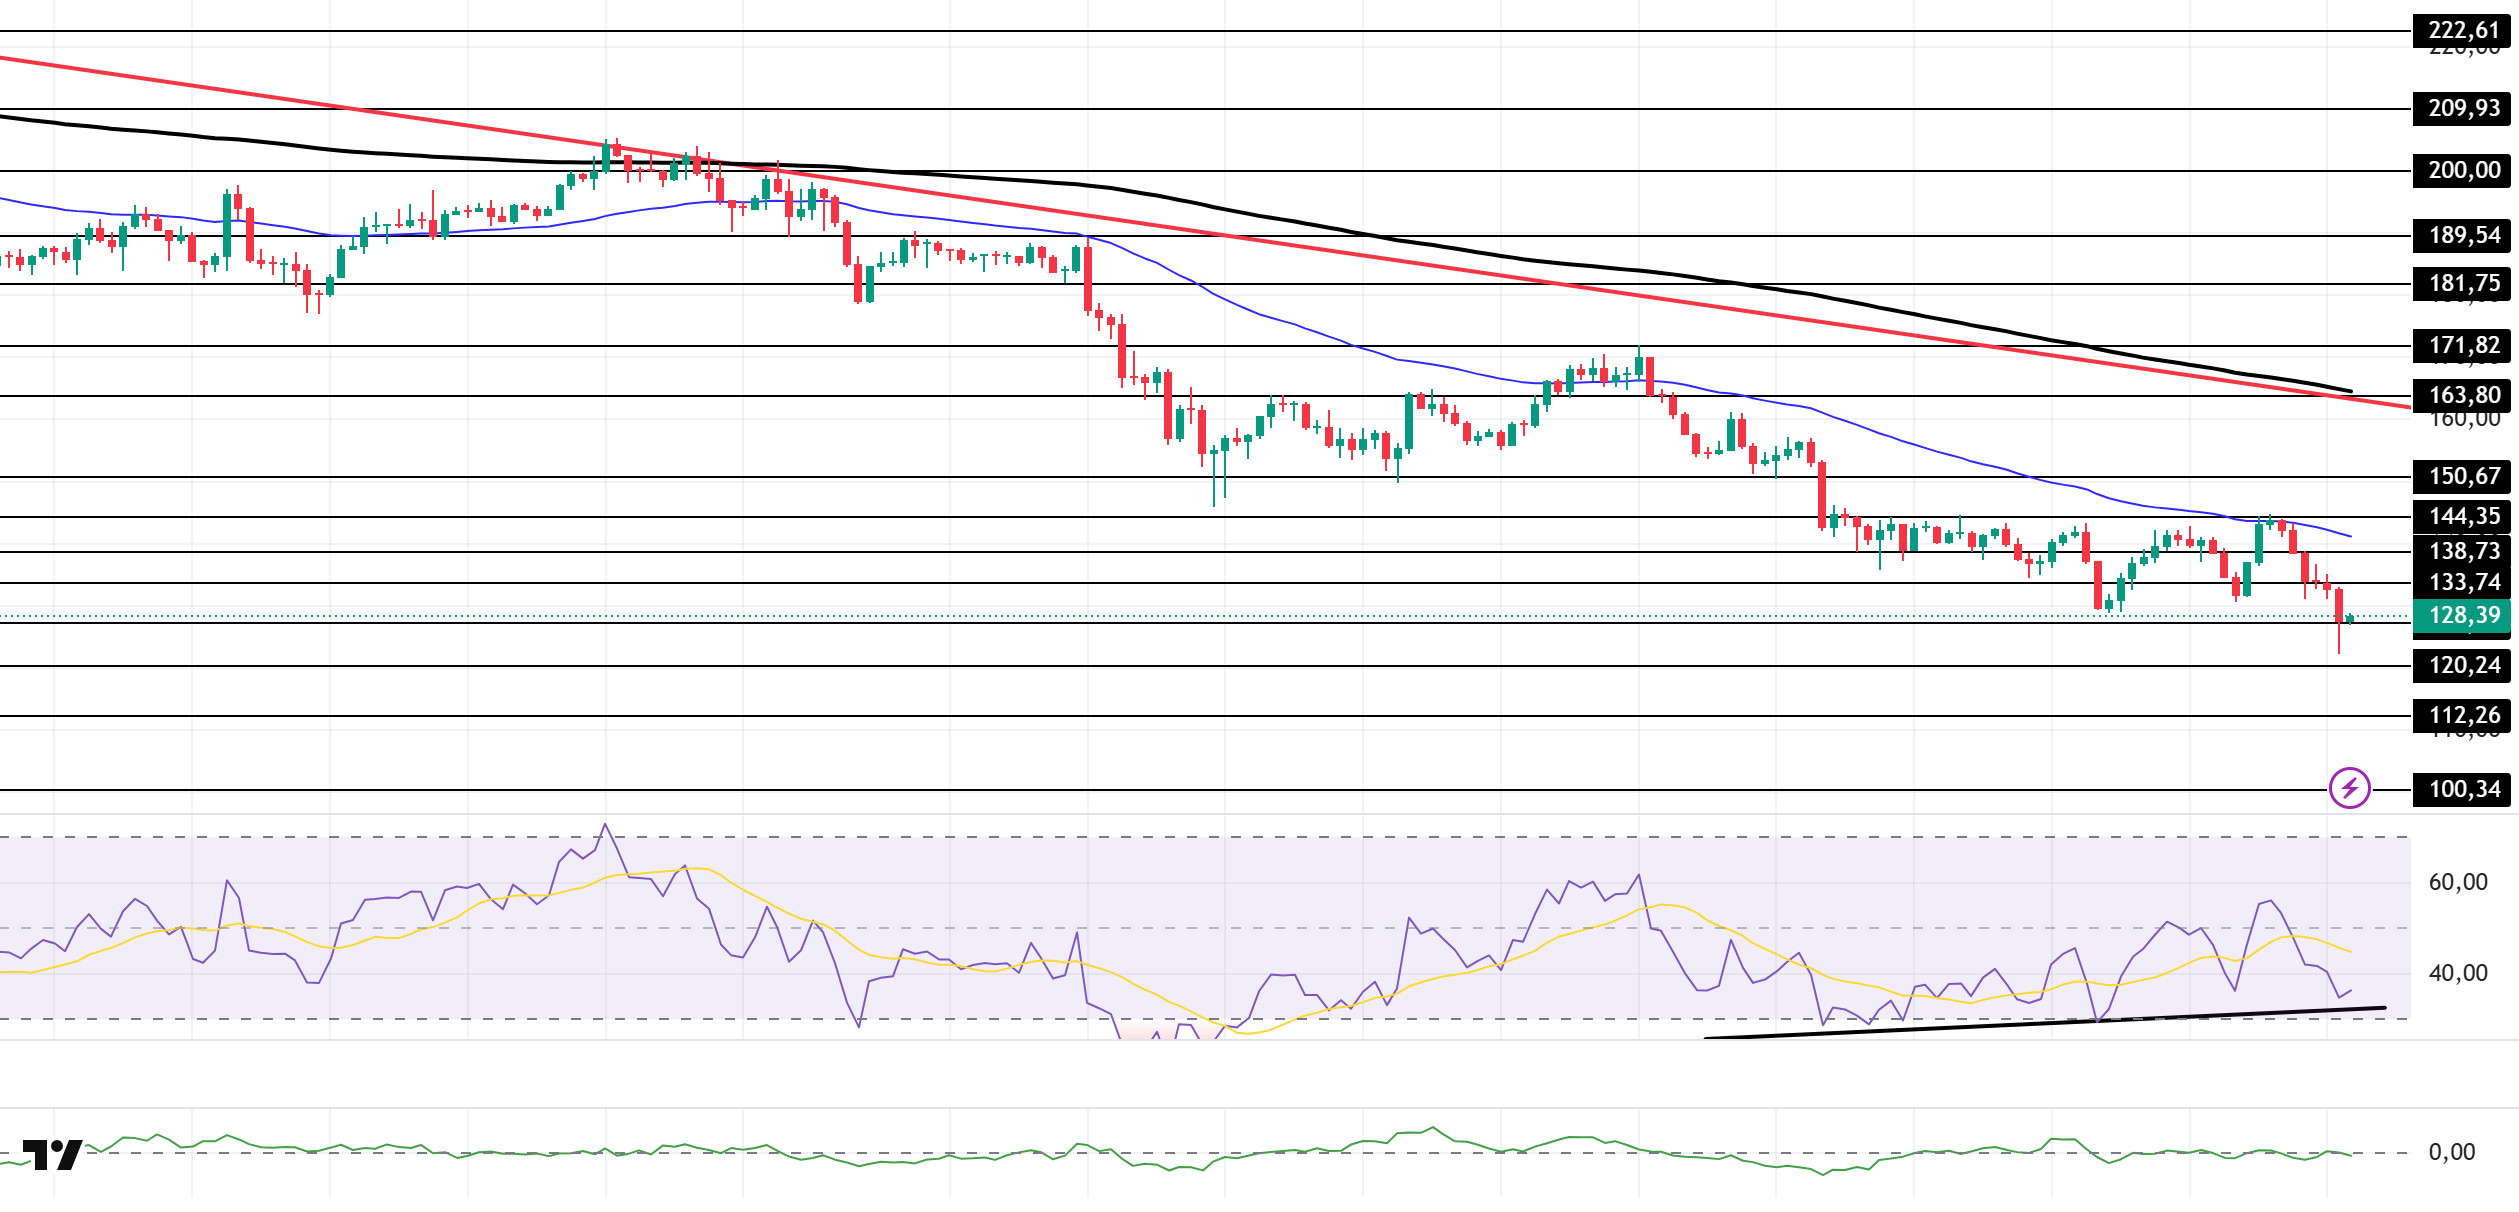
SOL experienced a pullback. The asset remained in the lower region of the downtrend that began on October 6. It tested the strong resistance level of $144.35 and the 50 EMA (Blue Line) moving average but failed to break through, resulting in a pullback. Currently trading below $133.74, the price could find support at $120.24 if the decline continues. If an uptrend begins, it could retest the 50 EMA moving average.
On the 4-hour chart, it remained below the 50 EMA (Exponential Moving Average – Blue Line) and 200 EMA (Black Line). This indicates that it may be in a medium-term downtrend. At the same time, the price being below both moving averages shows us that the asset is in a downward trend in the short term. On the other hand, the gap between the two moving averages shows that the asset may experience a sideways or upward movement. Chaikin Money Flow (CMF-20) is at a neutral level. However, the decrease in cash inflows may push the CMF into negative territory. The Relative Strength Index (RSI-14) has fallen to the middle of the negative zone. At the same time, it is above the upward trend that began on November 4. This indicates that buying pressure continues. If there is an uptrend due to macroeconomic data or positive news related to the Solana ecosystem, the $150.67 level stands out as a strong resistance point. If this level is broken upwards, the uptrend is expected to continue. If pullbacks occur due to developments in the opposite direction or profit-taking, the $120.24 level could be tested. A decline to these support levels could increase buying momentum, presenting a potential upside opportunity.
Supports: 127.21 – 120.24 – 112.26
Resistances: 133.74 – 138.73 – 144.35
DOGE/USDT
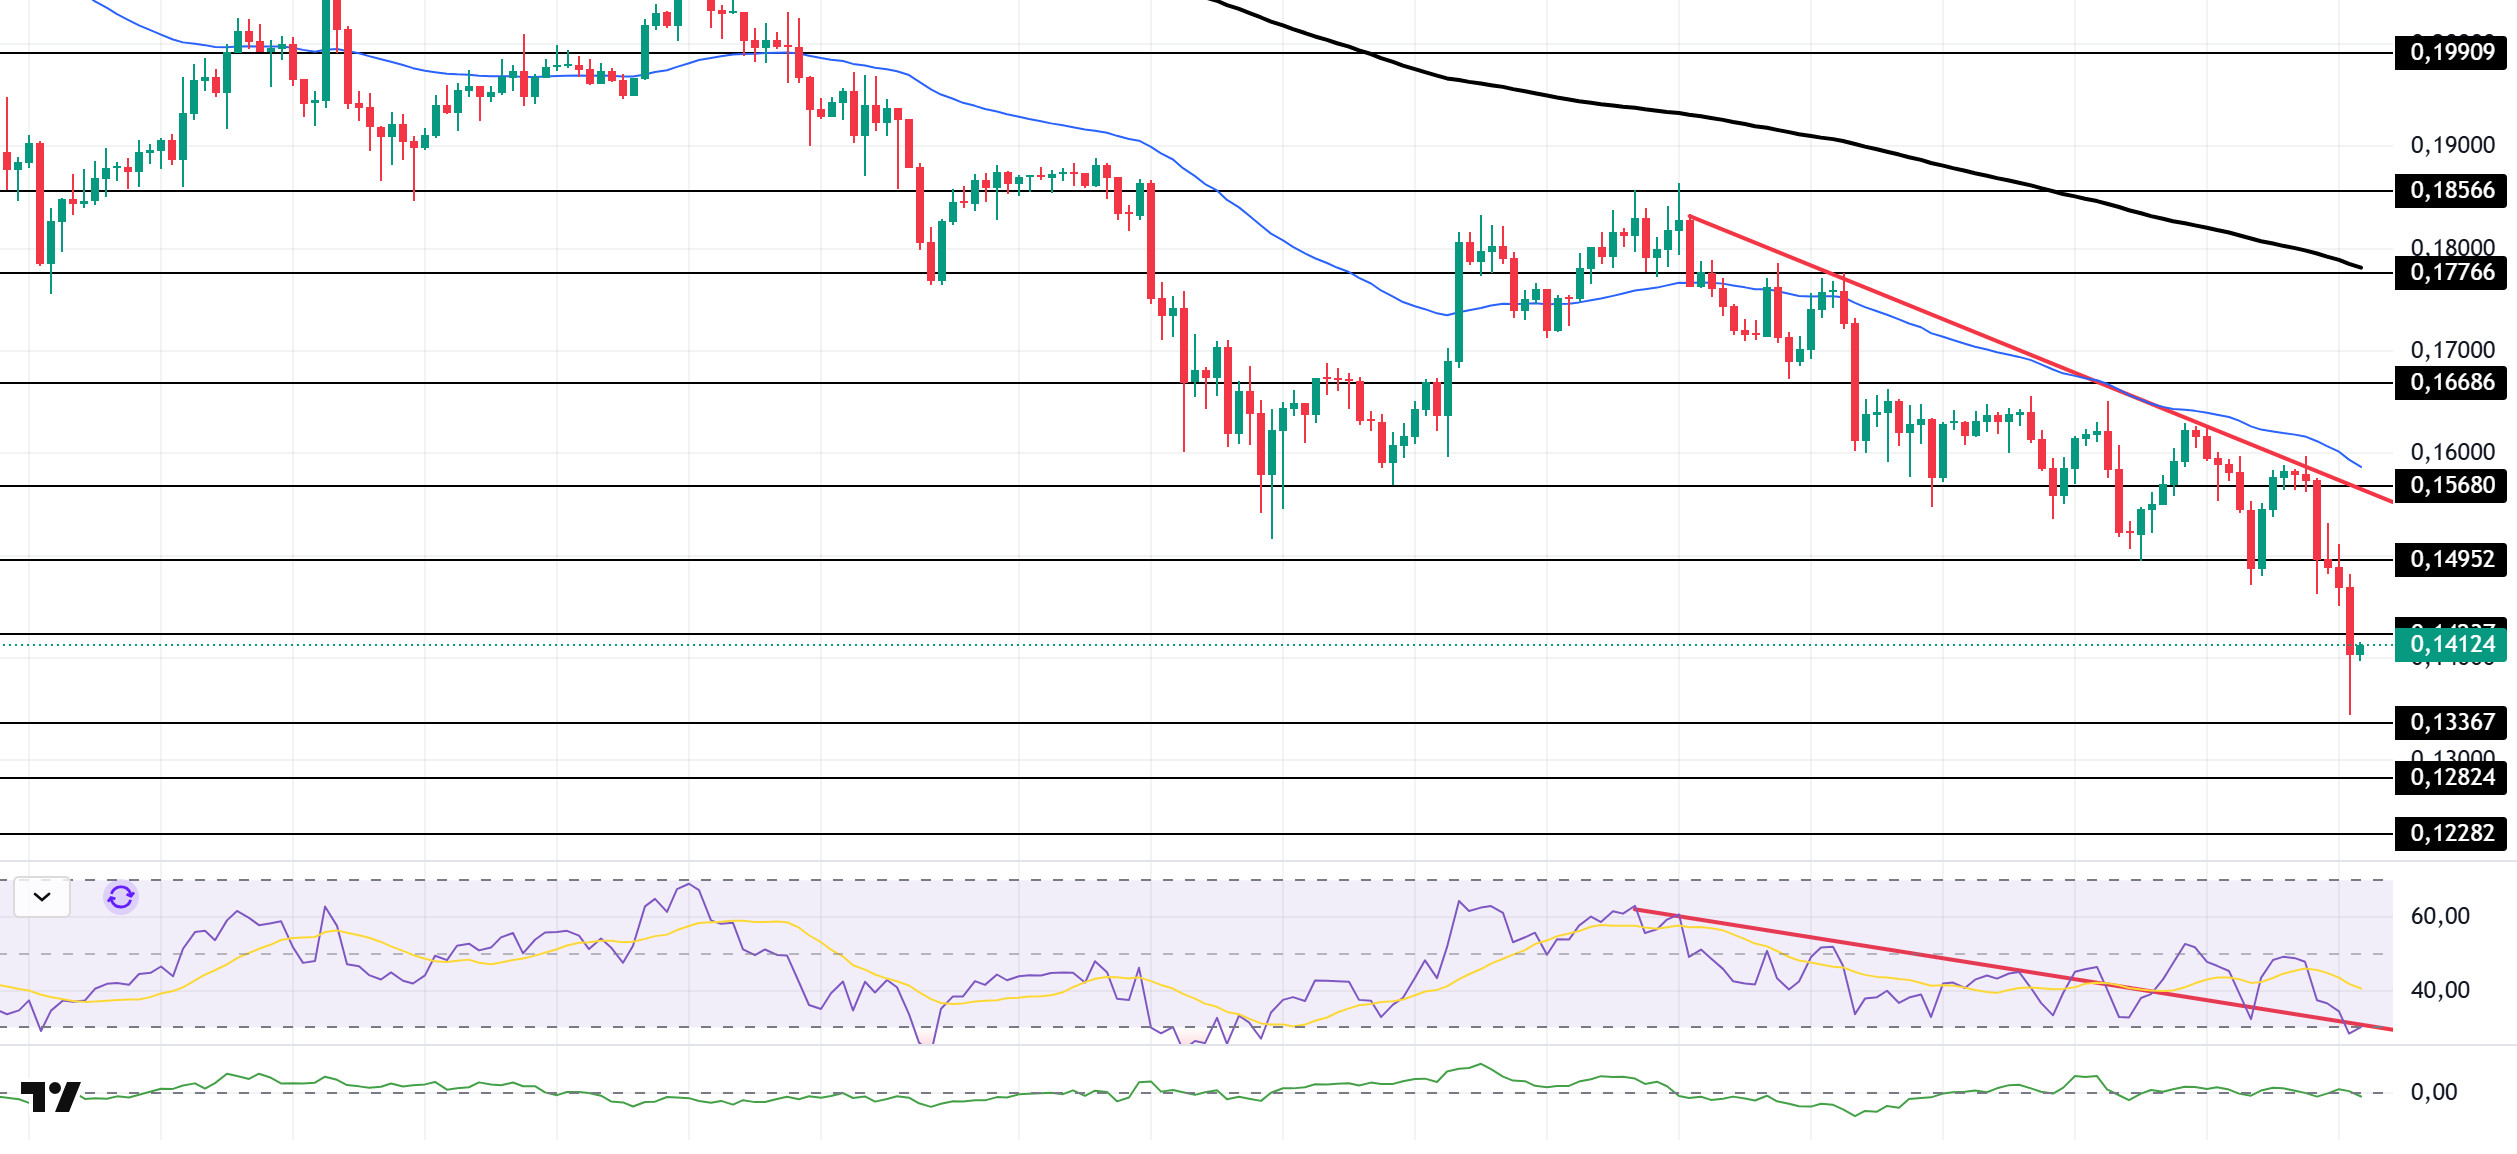
The DOGE price experienced a decline. The asset continued to trade in the lower region of the downtrend that began on November 11. Testing the downtrend as resistance, the price failed to break through and retreated, moving into the lower region of the strong support level at $0.12824. If the retreat continues, it could test the $0.14237 level. If it experiences an uptrend, it may test the 50 EMA (Blue Line) moving average and the $0.15680 level as resistance.
On the 4-hour chart, the 50 EMA (Exponential Moving Average – Blue Line) remained below the 200 EMA (Black Line). This indicates that a downtrend may begin in the medium term. The price being below both moving averages indicates a downward trend in the short term. On the other hand, the large difference between the two moving averages increases the potential for the asset to move sideways or upward. The Chaikin Money Flow (CMF-20) is at a neutral level. Additionally, a decrease in cash inflows could push the CMF into negative territory. The Relative Strength Index (RSI-14) is near the neutral level in the negative zone. It also broke below the downward trend that began on November 10, signaling increased selling pressure. In the event of potential increases driven by political developments, macroeconomic data, or positive news flow within the DOGE ecosystem, the $0.17766 level stands out as a strong resistance zone. Conversely, in the event of negative news flow, the $0.13367 level could be triggered. A decline to these levels could increase momentum and initiate a new wave of growth.
Supports: $0.13367 – $0.12824 – $0.12282
Resistances: 0.14237 – 0.14952 – 0.15680
SUI/USDT
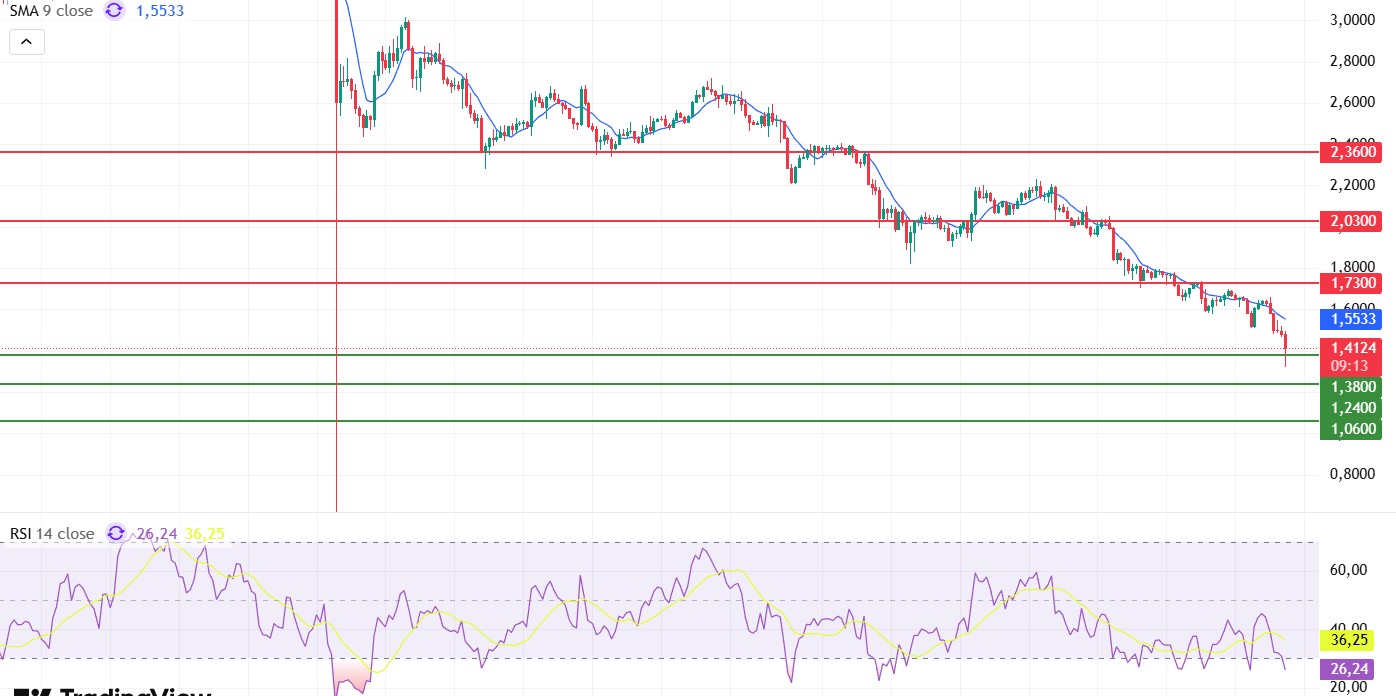
Looking at Sui’s technical outlook, we see that the price has been moving sideways around the $1.41 level on a 4-hour basis, influenced by fundamental developments. The Relative Strength Index (RSI) is currently in the 26.24 – 36.25 range. This range indicates that the market is trading close to the buy zone; a drop in the RSI to the 35.00 – 25.00 range could signal a potential buying point. If the price moves upward, the resistance levels of $1.73, $2.03, and $2.36 can be monitored. However, if the price falls to new lows, it could indicate that selling pressure is intensifying. In this case, the support levels of $1.36, $1.24, and $1.06 come to the fore. Based on the trend line, a pullback to $1.06 appears technically possible. According to Simple Moving Averages (SMA) data, Sui’s average price is currently at $1.55. The price remaining above this level indicates that the current uptrend could technically continue.
Supports: 1.06 – 1.24 – 1.38
Resistances: 1.73 – 2.03 – 2.36
Legal Notice
The investment information, comments, and recommendations contained herein do not constitute investment advice. Investment advisory services are provided individually by authorized institutions taking into account the risk and return preferences of individuals. The comments and recommendations contained herein are of a general nature. These recommendations may not be suitable for your financial situation and risk and return preferences. Therefore, making an investment decision based solely on the information contained herein may not produce results in line with your expectations.


