
Weekly Fundamental Analysis Report
Fear & Greed Index
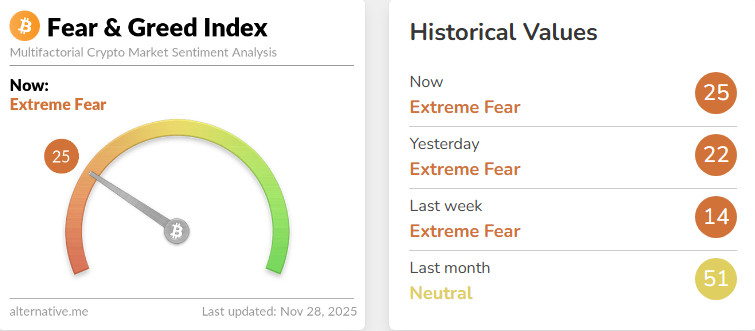
Source: Alternative.me
Change in Fear and Greed Value: +11
Last Week’s Level: 14
This Week’s Level: 25
This week’s rise in the Fear and Greed Index from 14 to 25 was driven by a gradual easing of tensions following an initial period of heightened fear. As the week began, Bitcoin’s drop to the $80,000–85,000 range and the liquidation of approximately $1.7 billion in leveraged positions pulled the index down to the 11–14 range, creating a clear panic pricing in the “extreme fear” zone. November became one of the historically weakest periods for spot Bitcoin ETFs, particularly with the approximately $903 million net outflow seen on November 20, reinforcing this fear base with the perception that ETFs were also selling.
Later in the week, both crypto-specific and macro headlines shifted this panic structure into a phase of declining fear. Bitmine’s announcement of a purchase of 28,625 ETH, worth approximately $82 million, in the dip zone signaled that institutional investors were not backing down, particularly boosting sentiment on the Ethereum side. News that tensions between the US and China could partially ease following the Trump-Xi phone call and the acceptance of the Beijing invitation, along with reports that Nvidia could be allowed to sell its H200 AI chips to China, created a limited risk-on sentiment in technology and risky assets. In the US, the postponement of September PCE data and some macro data to December 5 brought a short-term “wait-and-see” mode to the fore instead of a new inflation shock. Towards the end of the week, Bitcoin tested above $90,000 again, liquidations calmed down, and the index rose to the 20+ band, with Fear and Greed closing the week at 25, shifting from deep panic to a more balanced but still fear-dominated regime.
Crypto Fund Flows

Source: CoinShares
Overview:
Crypto markets continued the week with significant declines. The week continued with declines due to negative statements from FED members. As a result of these developments, Bitcoin lost approximately 10% of its value during the week.
Litecoin (LTC): LTC saw inflows of $3.3 million.
Cardano (ADA): Cardano saw an inflow of $0.1 million this week.
Ripple (XRP): XRP saw $89.3 million in fund inflows this week.
Other: Sector-specific and project-based increases in altcoins, along with the general market outlook, brought about a $1.0 million inflow in fund flow data.
Fund Outflows:
Ethereum (ETH): Along with spot ETH outflows, Ethereum saw $589.0 million in outflows this week.
Bitcoin (BTC): Bitcoin continues to see outflows from investors this week. Bitcoin-focused funds experienced an outflow of 1.267 billion dollars.
SUI: Negative market effects also impacted the Sui ecosystem. This situation continued with $5.0 million in outflows from Sui.
Solana (SOL): Solana saw an outflow of $156.2 million.
Multi-asset: Outflows were observed in the multi-asset group.
Crypto Total Market Cap
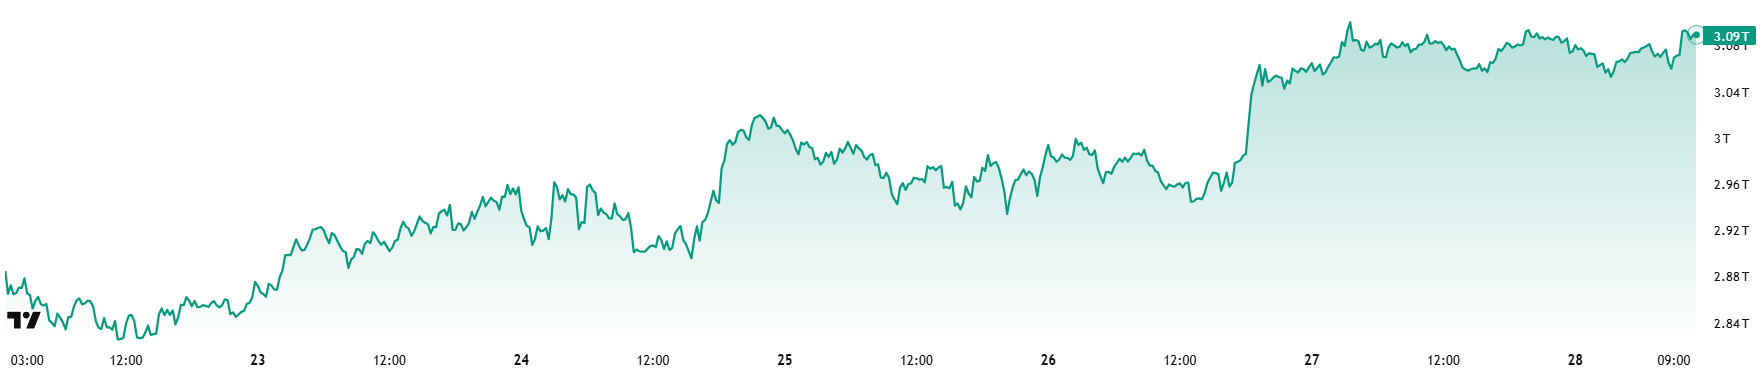
Source: Tradingview
- Last Week’s Market Value: $2.92 Trillion
- This Week’s Market Value: $3.09 Trillion
This week, the cryptocurrency market grew by approximately $162 billion, advancing 5.56% and bringing the total market value to $2.91 trillion. The week’s peak was $3.11 trillion, while the lowest level was $2.88 trillion. Thus, the market moved within a band of $228 billion, which translates to a volatility of 7.92%. While this is calmer than last week’s wild 18% range, the crypto market is still moving at its classic “weekly average candle length” level.
Total 2
Starting the week with a market value of $1.28 trillion, the Total 2 index rose 5.82% during the week, gaining approximately $69.4 billion in value and ending the period at around $1.26 trillion. The weekly high was $1.27 trillion, while the low was $1.18 trillion. In other words, the index fluctuated within a range of $95 billion, which corresponds to a volatility of approximately 8% for the period. With this rise, Total 2 is now approaching its all-time high, with only about 40% left to go. This means that expectations for movement among major altcoins are beginning to form.
Total 3
Total 3 started the week with a total value of $0.853 trillion, grew by approximately $38 billion during the week, recording a 4.49% increase, and closed the week at $0.891 trillion. The volatility between the week’s highest and lowest values was only 6.88%. Thus, Total 3 retained its title as the most stable index this week, and interestingly, this picture has remained unchanged for three weeks. While the market as a whole presents a completely positive outlook, the fact that the strongest performance is unexpectedly coming from Total 3 could be seen as a small but sweet signal for “that famous altcoin season” should the current pullback end.
The index-volatility ranking of Total > Total 2 > Total 3 shows that the dominant movement among the majors is concentrated first in Bitcoin and then in Ethereum. Furthermore, the gap between Total 2 and Total 3 widening significantly for the first time in weeks also implies that a slight recovery has begun in Ethereum’s market share.
Altcoin Season Index
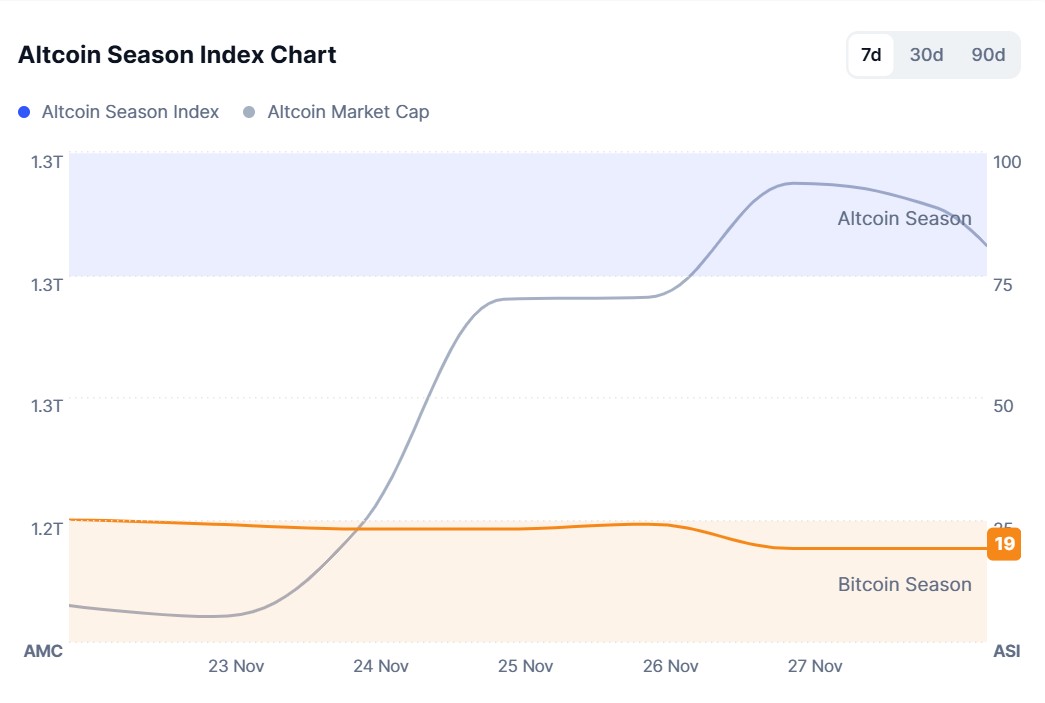
Source: Coinmarketcap
- Last Week’s Index Value: 27/100
- This Week’s Index Value: 21/100
Between November 21 and November 28, 2025, there was a slight decline in the correlation between altcoin market dominance (Altcoin Market Cap) and the Altcoin Season Index. The graph shows that this week, on November 24 , the index fell to 23, indicating that the Altcoin Market Cap reached 1.27T. When the index rose this week, the top 5 coins leading the rise were Aster, Zec, M, Myx, and Dash. On November 27, the index fell from 26 to 21, indicating the potential for a decline in the altcoin season.
Bitcoin Dominance
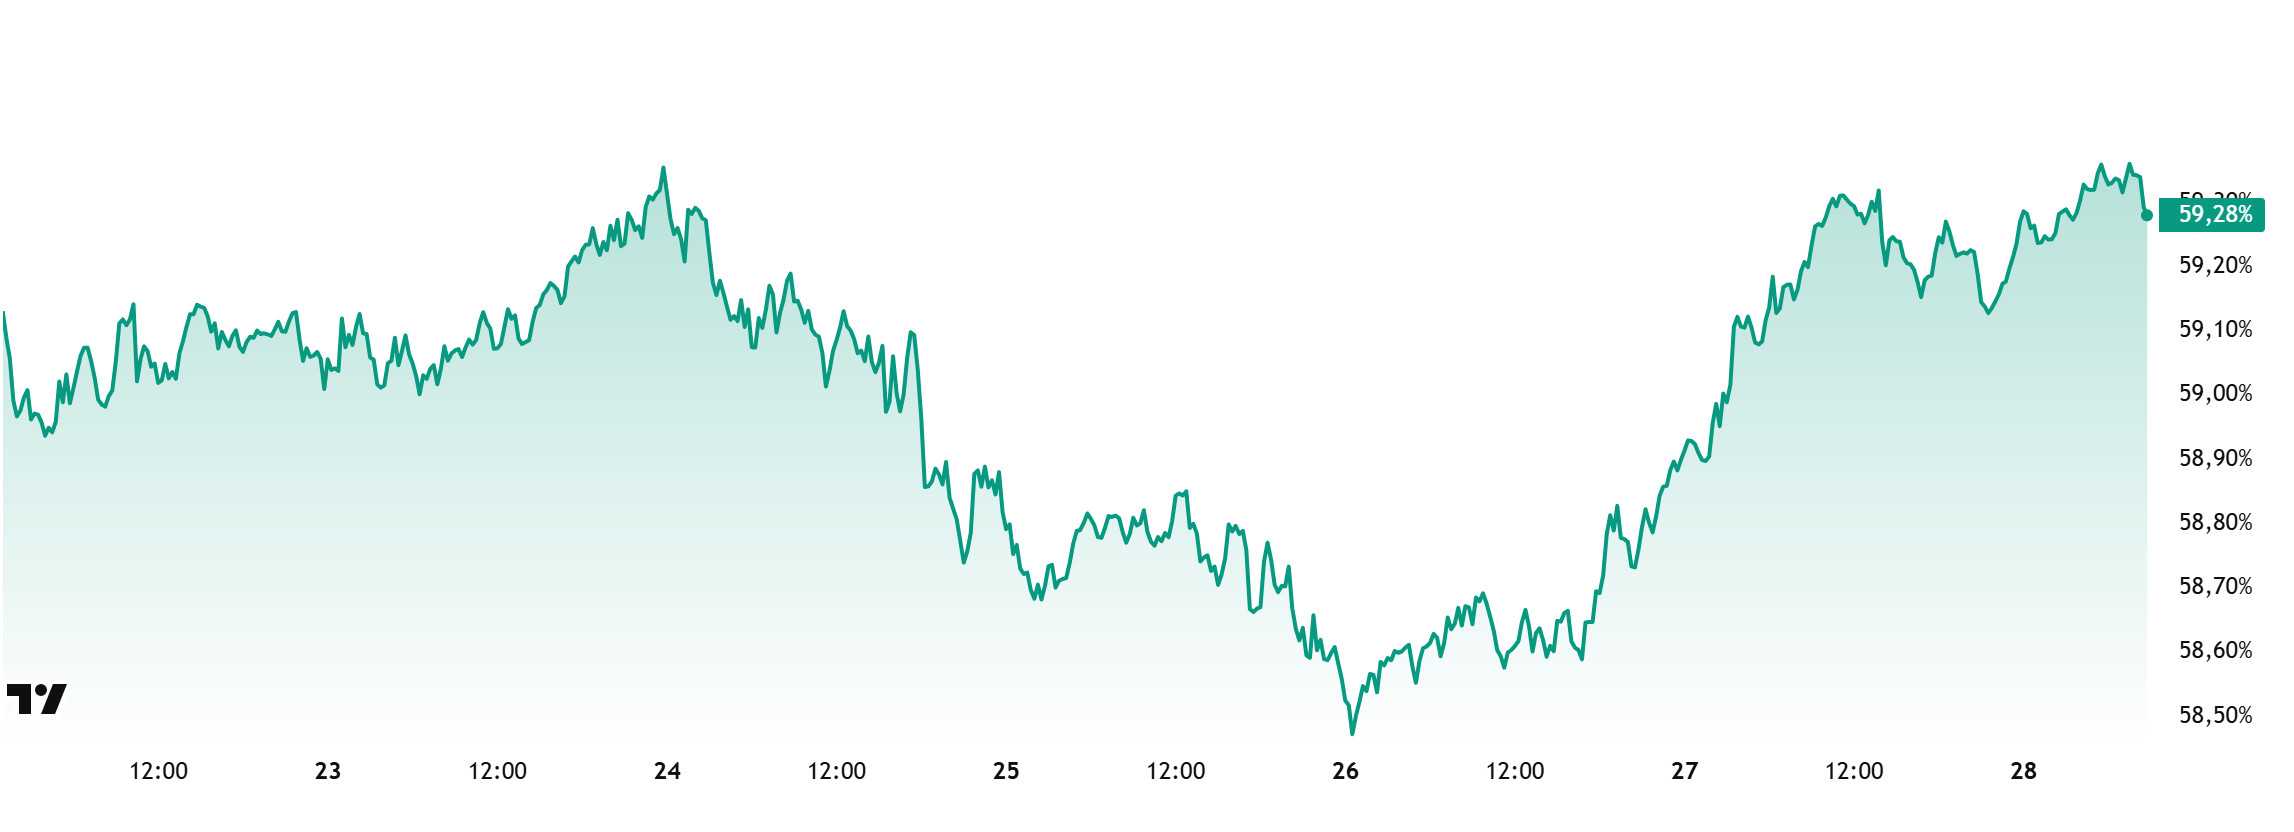
Source: Tradingview
“BTC.D Visual to be Added”
Weekly Change:
- Last Week’s Level: 59.00%
- This Week’s Level: 59.28%
Bitcoin dominance started the week at 59.24%, fell to 58.49% during the week, but then rose slightly and is currently at 59.28%.
This week, Capital B, Europe’s first Bitcoin treasury company, purchased 5 Bitcoin, DDC Enterprise purchased 100 Bitcoin, and Bitplanet purchased 45 Bitcoin. Additionally, data on Bitcoin spot ETFs shows a net outflow of $1.3 million to date.
While the weakness in corporate buying appetite persists, it is noteworthy that retail investors continue to sell through ETFs, although the intensity of sales has gradually decreased compared to previous weeks. The uncertainty in the markets, driven by the Fed, continues to weaken capital inflows into crypto assets and limit buying appetite for Bitcoin. The net outflows observed in spot ETFs indicate that selling pressure could regain strength in the short term. Even under all these macro pressures, it is noteworthy that Bitcoin is showing more resilient pricing compared to Ethereum and other major altcoins. In this context, if institutional demand continues to recover cautiously, BTC dominance is expected to maintain its current strong position and continue its horizontal consolidation in the 58%–61% range.
Ethereum Dominance
Source: Tradingview
“ETH.D Chart Image to be Added”
Weekly Change:
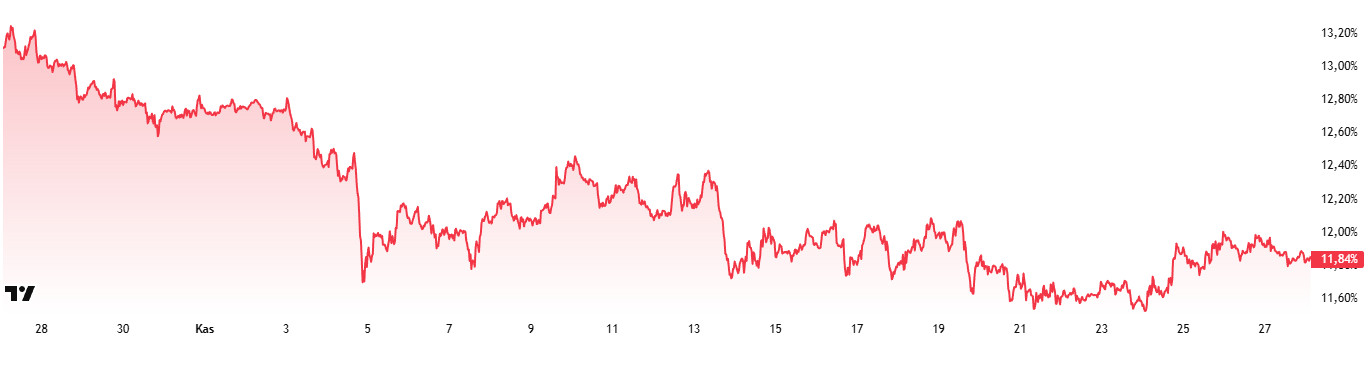
- Last Week’s Level: 11.57%
- This Week’s Level: 11. 84%
Ethereum dominance, which rose to 15% levels in mid-August, lost momentum and entered a downward trend. However, this negative outlook ended above the 11.50% level as of this week and has regained positive momentum.
Accordingly, Ethereum dominance ended last week at 11.57% and is currently trading at around 11.84% according to the latest data. During the same period, Bitcoin dominance also recorded a positive trend similar to Ethereum.
The key developments affecting Ethereum dominance are as follows:
According to Lookonchain data, BitMine purchased 28,625 ETH worth approximately $82.1 million. A purchase of this magnitude indicates that institutional or treasury-like assets are continuing to accumulate ETH. On the market side, such purchases are generally associated with long-term strategic expectations and staking positions; in the short term, they can have a tightening effect on supply.
Meanwhile, Ethereum’s block gas limit has been increased from 45 million to 60 million. This increase aims to expand the network’s transaction capacity and reduce congestion during peak periods. The change was automatically implemented with the approval of a large majority of validators and is considered by Ethereum Foundation researchers to be a natural continuation of last year’s scaling momentum.
Bitcoin Spot ETF

Source: Darkex Research Department
Netflow Status: Between November 21-27, a total of $237.2 million in net inflows occurred into Spot Bitcoin ETFs. No clear direction emerged in flows during this period. While a strong inflow of $238.4 million on November 21 was notable, an outflow of $151 million on November 24 partially reversed this effect. The reappearance of a $128.7 million inflow on November 25 indicated that investor appetite had not completely waned. Fund-based inflows were primarily supported by Fidelity FBTC.
Bitcoin Price: Bitcoin opened at $86,530 on November 21 and closed at $91,313 on November 27. During this period, the BTC price gained 5.53%. The 3.61% increase seen on November 26, in particular, progressed in parallel with positive flows on the ETF front.
Cumulative Net Inflow: By the end of the 470th trading day, the cumulative total net inflow into Spot Bitcoin ETFs rose to $57.615 billion.
| Date | Coin | Open | Close | Change % | ETF Flow (mil $) |
|---|---|---|---|---|---|
| November 21, 2025 | BTC | 86,530 | 85,070 | −1.69% | 238.4 |
| November 24, 2025 | BTC | 86,850 | 88,438 | +1.83% | −151.0 |
| November 25, 2025 | BTC | 88,438 | 87,325 | −1.26% | 128.7 |
| November 26, 2025 | BTC | 87,325 | 90,480 | +3.61% | 21.1 |
| November 27, 2025 | BTC | 90,480 | 91,313 | +0.92% | 0 |
| Total for Nov 21–27, 2025 | +5.53% | 237.2 | |||
This period saw a moderate but steady recovery in Spot Bitcoin ETFs. Following the sharp outflows in previous weeks, signs of stabilization in flows emerged. The fact that only one day of negative flows was observed in the last four trading days indicated that institutional investors’ risk appetite was beginning to normalize. The BTC price supported this picture and followed an upward trend during this period. If ETF inflows continue to strengthen in the coming days, the short-term recovery on the Bitcoin side could potentially turn into a broader upward movement . However, the fact that the net flow balance has not yet fully stabilized indicates that short-term volatility may persist.
Ethereum spot ETF
Source: Darkex Research Department
“ETH ETF Visual to be Added”
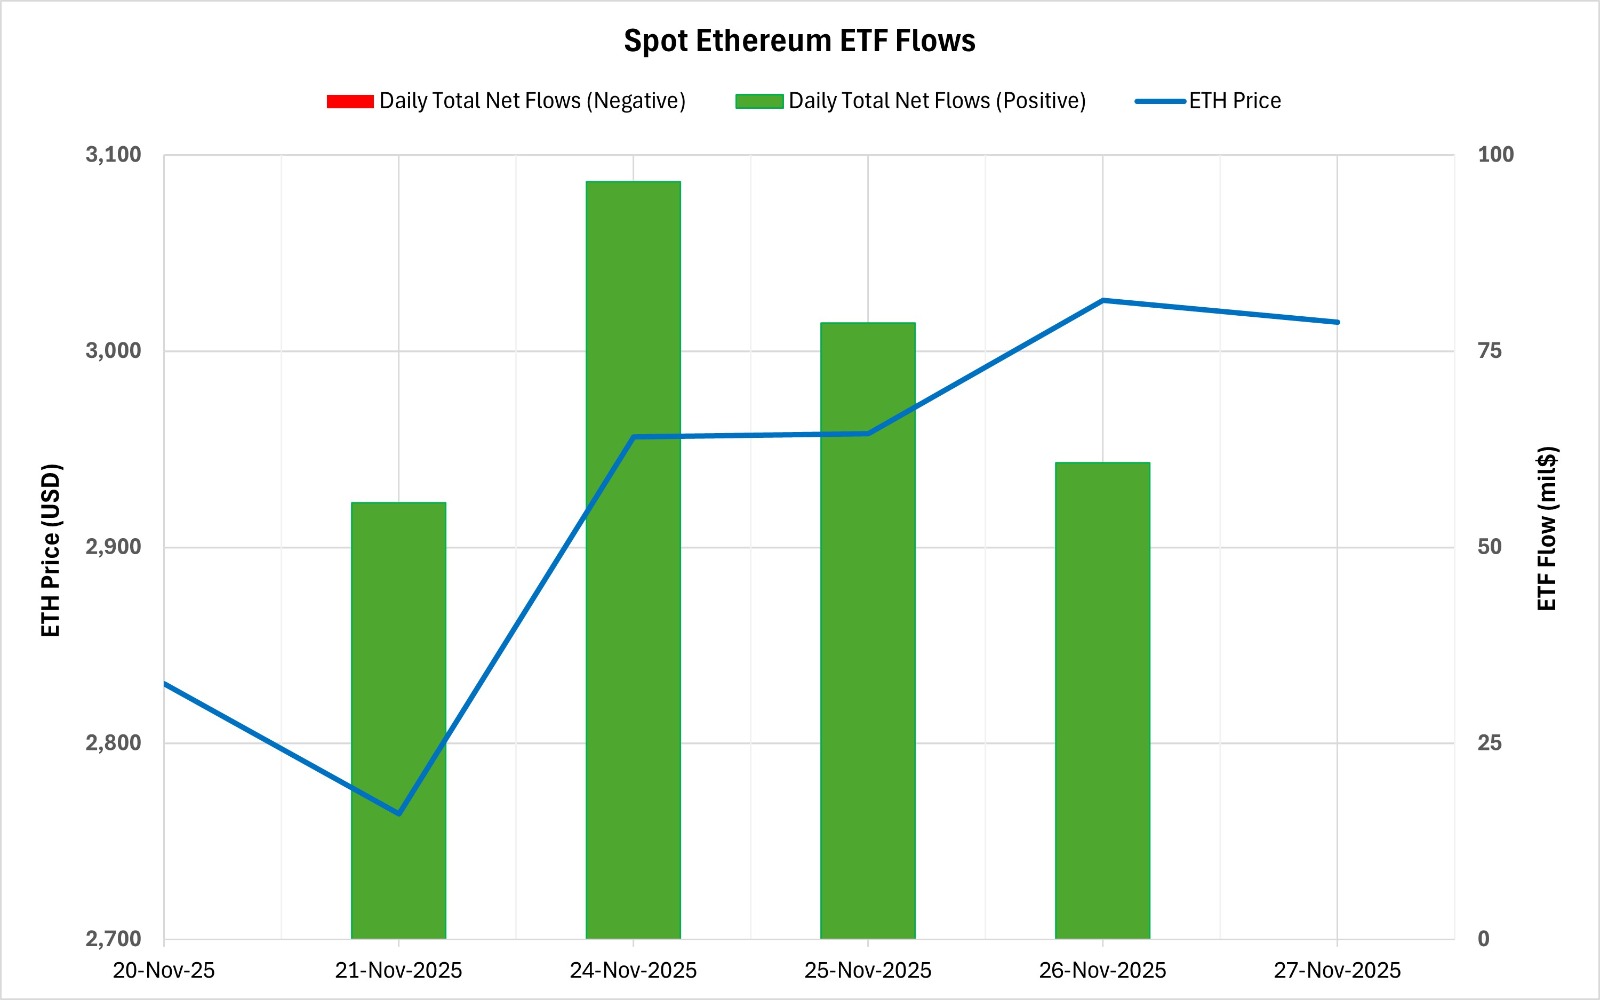
Between November 21-27, 2025, a total of $291.7 million in net inflows occurred into Spot Ethereum ETFs. The negative flow series, which lasted for eight trading days, ended on November 21. A recovery has begun on the ETF side. Inflows into Fidelity FETH and BlackRock ETHA were particularly prominent during this period. The continuation of positive flows over the last four trading days indicated a marked improvement in institutional demand. The cumulative total net inflow into Spot Ethereum ETFs rose to $12.887 billion as of the 340th trading day.
| Date | Coin | Open | Close | Change % | ETF Flow (mil $) |
|---|---|---|---|---|---|
| November 21, 2025 | ETH | 2,830 | 2,764 | −2.35% | 55.7 |
| November 24, 2025 | ETH | 2,801 | 2,956 | +5.54% | 96.6 |
| November 25, 2025 | ETH | 2,956 | 2,958 | +0.06% | 78.6 |
| November 26, 2025 | ETH | 2,958 | 3,026 | +2.30% | 60.8 |
| November 27, 2025 | ETH | 3,026 | 3,015 | −0.37% | 0 |
| Total for Nov 21–27, 2025 | +6.52% | 291.7 | |||
Ethereum opened at $2,830 on November 21 and closed at $3,015 on November 27. During this period, ETH gained 6.52% in value. The simultaneous strengthening of this recovery in the Ethereum price with fund inflows indicated a resurgence in institutional risk appetite. In particular, the simultaneous rise in both price and flows between November 24-26 indicates that short-term momentum has shifted in favor of ETH. If spot ETH ETF inflows continue steadily in the coming days, this could create a supportive environment for the ETH price. However, if flows weaken again, the impact of the current recovery may be limited.
Bitcoin Options Distribution
Source: Laevitas
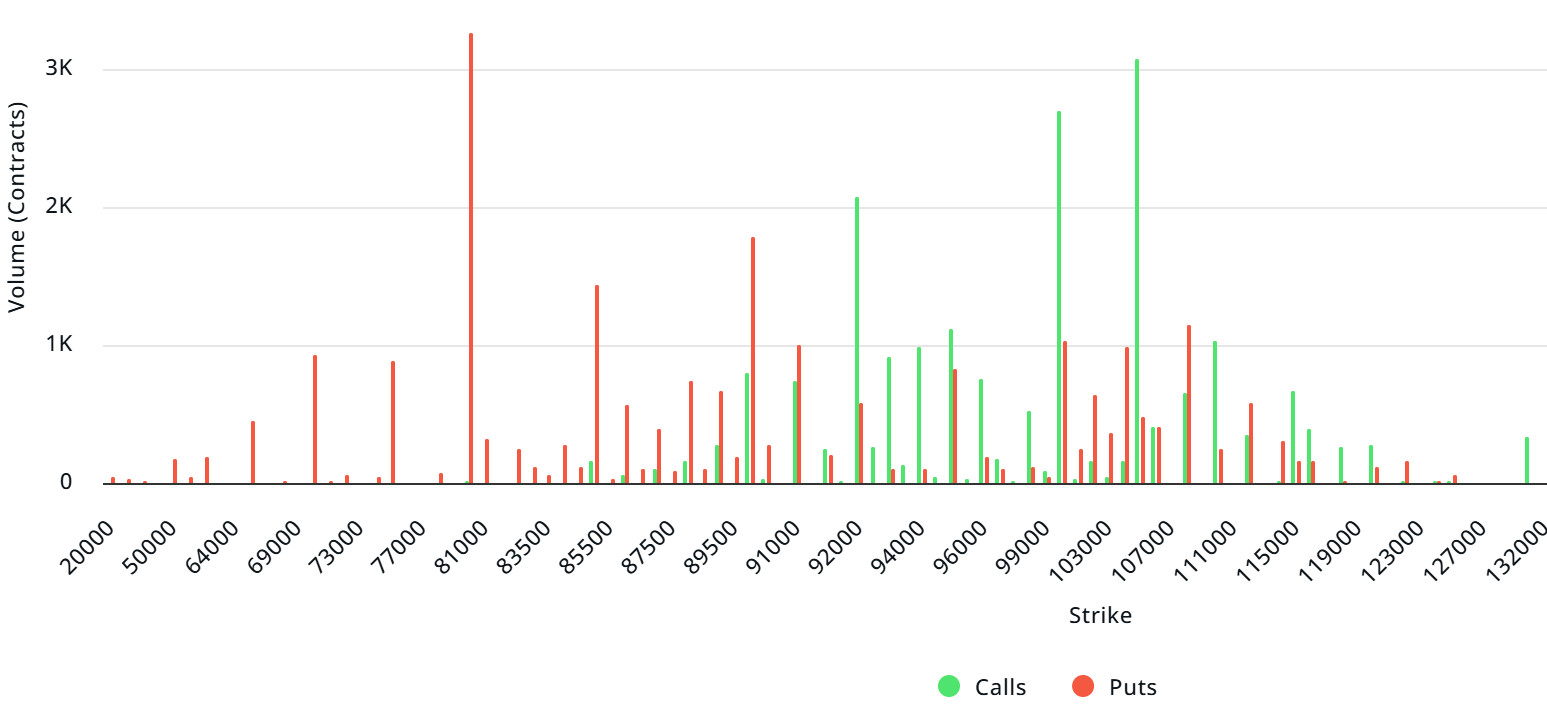
BTC: Notional: $13.18B | Put/Call: 0.58 | Max Pain: $100K
Deribit Data: Deribit data shows that BTC option contracts with a notional value of approximately $13.18 billion expire today. At the same time, looking at the risk transformation over the next week based on the last 24 hours’ data, put options are dominating over call options in terms of risk hedging. However, this dominance is gradually decreasing. When examining expected volatility (IV), it is below realized volatility (RV). On the other hand, the negative spread metric indicates low risk appetite in the market and suggests that put options are expensive. Skew values are also pointing downward today and for the coming week.
Laevitas Data: Examining the chart, we see that put options are concentrated in a wide band between $80,000 and $108,000. Call options, on the other hand, are spread across a broad base between the $92,000 and $110,000 levels. At the same time, the $100,000 level appears to be resistance, while the $90,000 level appears to be support. On the other hand, there are 3.26K put options at the $80,000 level, where they peak, and a decrease in put volume is observed after this level. Furthermore, 3.07K call option contracts peak at the $105,000 level. Looking at the options market, we see that put contracts dominate on a daily and weekly basis.
Option Maturity:
Put/Call Ratio and Maximum Pain Point: Looking at the options in the latest 7 days of data from Laevitas, the number of call options increased by approximately 32% compared to last week, reaching 201.06K. In contrast, the number of put options decreased by 6% compared to last week, reaching 158.55K. The put/call ratio for options is set at 0.58. This indicates that there is less demand for call options than put options among investors. Bitcoin’s maximum pain point is seen at $100,000. BTC is currently priced at $91,300, and if it fails to break above the pain point of $100,000, a continued decline is foreseeable.
Ethereum Options Distribution

Source: Laevitas
ETH: $1.76 B notional | Put/Call: 1.00 | Max Pain: $3,400
Laevitas Data: Looking at the data in the chart, we see that put options are concentrated in a fairly wide band, particularly between the $2,500 and $3,000 price levels. The highest put volume is at the $2,500 level, with approximately 12K contracts. On the other hand, call options show a notable concentration between the $3,400 and $4,100 levels. The $3,400 level stands out in particular, with a high call volume of approximately 8K contracts.
Deribit Data: First, we see that ATM volatility rose to 48.96, recording a double-digit increase on a daily basis. This rise indicates that the market expects a wider price range in the short term and that uncertainty has increased significantly. The 25-delta risk reversal falling to -1.76 and remaining in negative territory during the same period confirms that the trend is predominantly priced downwards. The market pricing the put side more aggressively than the call side confirms this expectation.
On the volume side, while call volume shows a notable increase, the expansion in put volume is more striking. The double-digit increase in put volume suggests either new expectations of a decline or the beginning of stronger hedging of existing long positions. This combination generally supports weakening risk appetite and reinforces signals that pricing is more likely to remain neutral to negative in the short term.
Option Expiration:
Ethereum options with a nominal value of $1.76 billion expired on November 28. The Max Pain level was calculated at $3,400, while the put/call ratio stood at 1.00.
Legal Notice
The investment information, comments, and recommendations contained in this document do not constitute investment advisory services. Investment advisory services are provided by authorized institutions on a personal basis, taking into account the risk and return preferences of individuals. The comments and recommendations contained in this document are of a general nature. These recommendations may not be suitable for your financial situation and risk and return preferences. Therefore, making an investment decision based solely on the information contained in this document may not result in outcomes that align with your expectations.
