
Technical Analysis
BTC/USDT
Iran’s consideration of using cryptocurrency in arms trade is a concrete example of the shift towards alternative financial channels under sanctions; while the US imposing taxes on cross-border money transfers and the implementation of the CARF application led by the UK indicate that control over crypto transactions is tightening. Turkmenistan’s legalization of cryptocurrency mining and trading reveals that energy-rich countries view this area as a means of economic diversification.
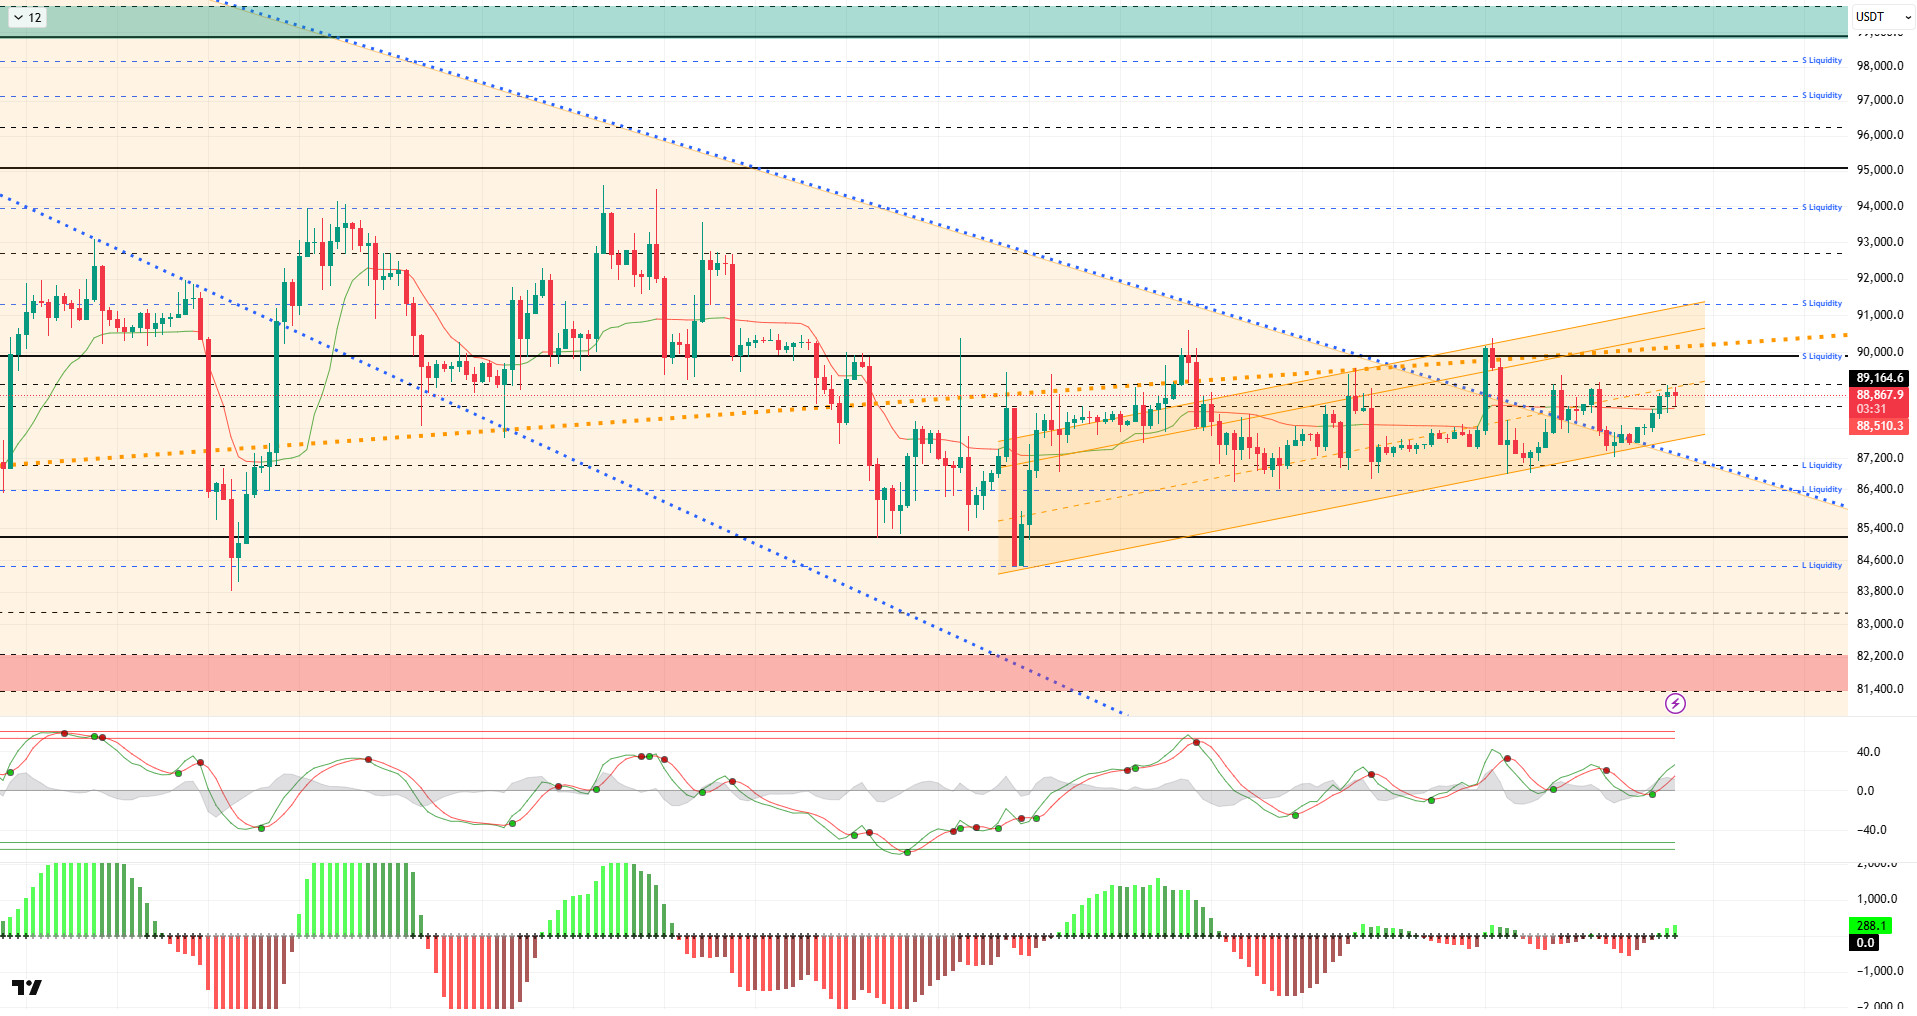
From a technical perspective, BTC continued its upward trend, supported by the lower trend line of the rising channel it formed. In the first days of the year, the price, which was heading towards the 90,000 reference level, traded above the falling orange band and below the major rising channel. The tendency to close 2025 negatively, as mentioned in previous analyses, ended with a 6.34% decline after a two-year hiatus. In quarterly terms, the price closed the fourth quarter with a 23.07% decline, marking its worst performance in the last seven years. The price also closed October, November, and December negatively, experiencing its worst cycle in recent years.
Technical indicators show that the Wave Trend (WT) oscillator is giving a buy signal again at the channel’s middle band, while the histogram on the Squeeze Momentum (SM) indicator has successfully transitioned back into positive territory. The Kaufman Moving Average (KAMA) is currently just below the price level at $88,500.
When examining liquidation data, it is seen that buy-side transactions are concentrated at the 86,000–87,000 level, In contrast, sell orders have re-accumulated in the short term at the 89,000 – 90,000 level, while the 91,000 level stands out as a liquidity zone in the broader timeframe.
In summary, Iran’s move to solidify the use of cryptocurrency in trade, the US imposing taxes on cross-border transactions, and the UK initiating oversight of cryptocurrency were among the most notable developments in early 2026. When examining liquidity data, it appears that areas with concentrated short-term trading activity are being targeted, while long-term selling levels have yet to be tested.BTC started the new year with a slight positive rise, and at this stage, the short-term resistance level of 88,500 stands out as the area for the price to regain momentum. Closings and pricing above this level, along with momentum, bring the 90,000 reference area back into focus as the target zone. In the event of a breakout, the price may move towards liquidity zones parallel to the channel band. In the event of potential selling pressure, 87,700 stands out as the short-term trend line, while 86,000 will be monitored as another liquidity zone.
Supports: 86,300 – 85,000 – 84,000
Resistances: 88,500 – 89,000 – 90,000
ETH/USDT
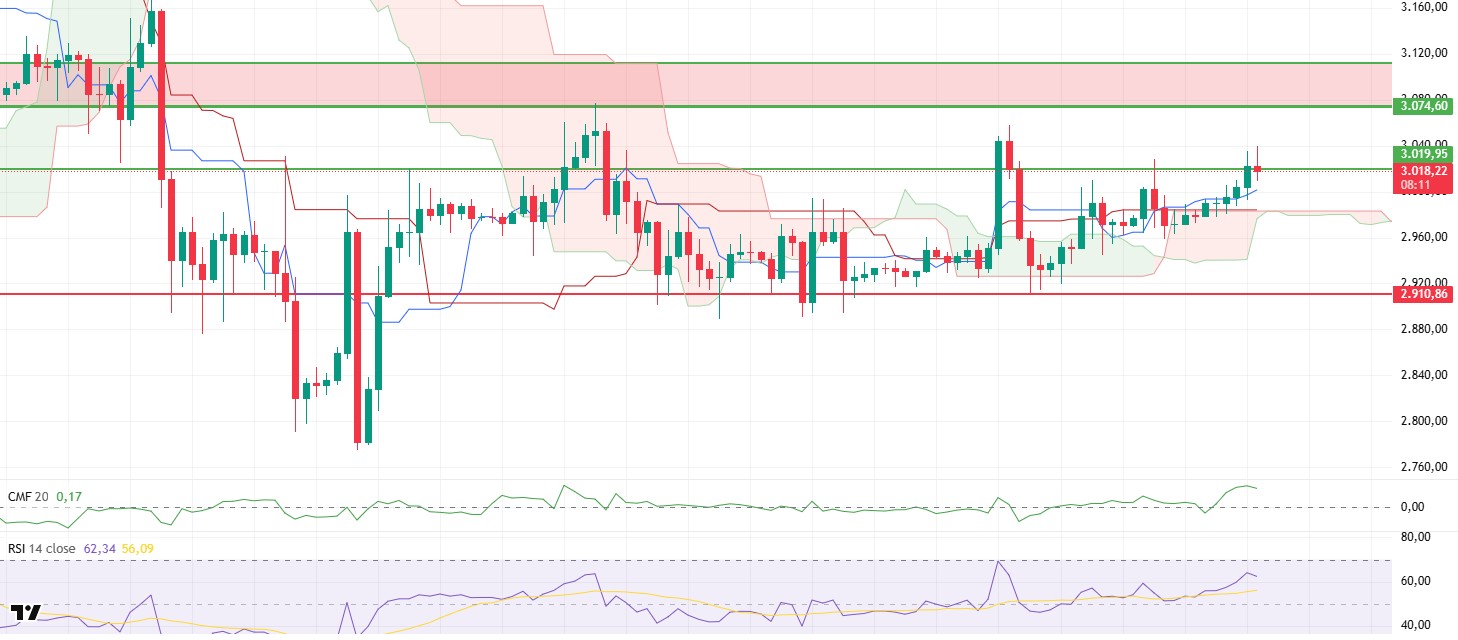
The ETH price has been hovering around the same threshold for the past two days. The $3,020 region was tested on Wednesday and met with selling pressure. Last night, this area was tested once again, and pricing is still occurring just around this level. These repeated attempts indicate that the market is approaching a decision point and that this band will be decisive in clarifying the direction.
Looking at the money flows, it appears that the latest attempts have occurred on a different basis than previous attacks. Chaikin Money Flow (CMF) gained momentum in positive territory, indicating that the recent rise was supported by liquidity. The fact that money flows, which remained weak during previous pullbacks, are stronger this time stands out as one of the factors increasing the likelihood of breaking through the $3,020 level.
On the momentum side, which moves in tandem with price, the picture is more negative. The Relative Strength Index (RSI) rose along with the increase, reaching 64. However, at this point, while the price is attempting new highs, the RSI is not strengthening to a greater extent, indicating that there is a risk of a pullback in the short term. This structure indicates that buyers need to be more decisive for the upward movement to continue.
The Ichimoku indicator presents a clearly positive outlook. The price continues to remain above the thinned Kumo cloud, and the Tenkan and Kijun levels have been breached upward. This positioning confirms that buyers still hold the advantage in terms of the overall trend and that the technical structure remains intact. As long as pricing above the cloud is maintained, the primary trend can be said to remain upward.
In the intraday assessment, the critical threshold again stands out at the $3,020 level. If sustainability is achieved above this region, the next resistance area at the $3,074 level may come into focus. If the area marked with a red rectangle on the chart is breached, the upward momentum could gain significant speed. On the downside, the $2,910 level continues to serve as the main support. As long as this region holds, pullbacks can be interpreted as short-term pauses. Overall, the direction for ETH points upward , but the decision appears to depend on price behavior around the $3,020 level.
Below the Form
Supports: 3,019 – 2,910 – 2,727
Resistances: 3,074 – 3,227 – 3,368
XRP/USDT
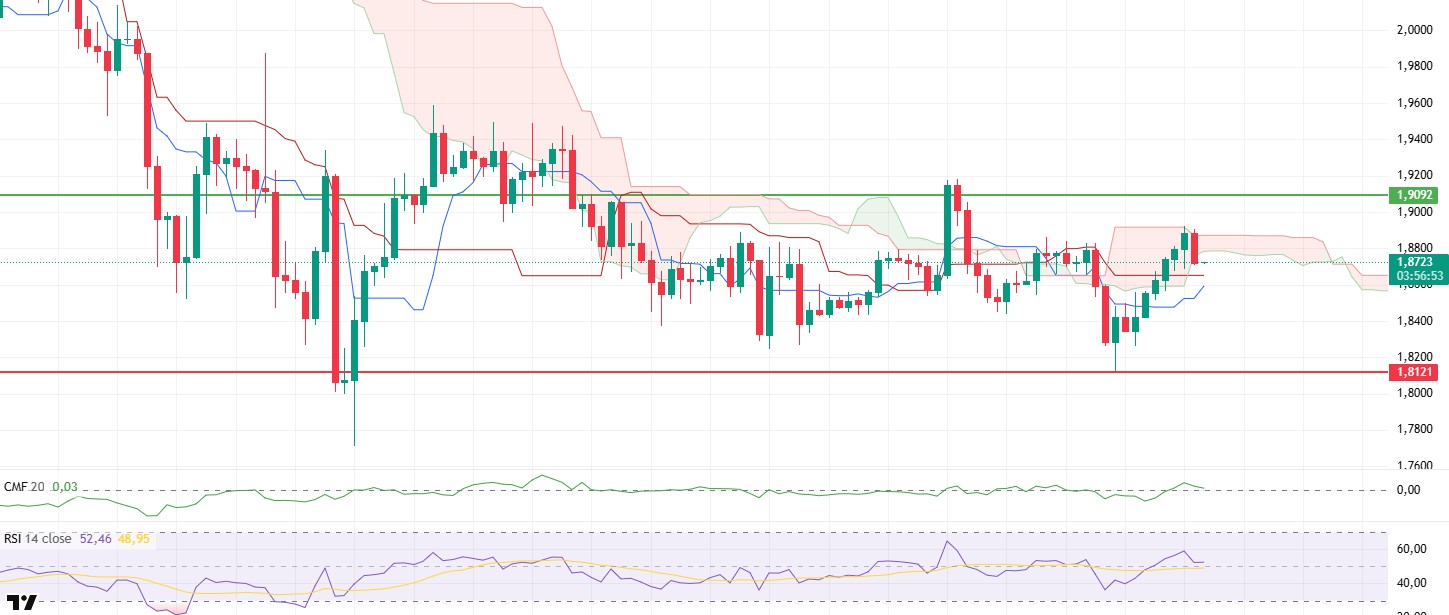
The XRP price experienced volatile price movements on Wednesday. Sales accelerated in the first part of the day due to technical weaknesses, and the price fell to the $1.81 support level. Buying activity from this area halted the decline, and the price rebounded. The rebound carried the price up to the $1.89 level, which is the upper band of the cloud. However, this area could not be breached, and the price experienced a limited pullback from there. The resulting picture shows that buyers from below are still active, but they are encountering strong resistance on the upside.
Although an improvement accompanying the rise in liquidity is observed, this movement has not yet gained strength. The Chaikin Money Flow (CMF) has moved into positive territory, but the weak slope indicates that the amount of money entering the market is limited. This structure explains why upward attempts have not been sustainable. It would not be surprising for the price to struggle at resistance levels unless liquidity continues to increase.
The momentum indicator, which moves in tandem with price, is also giving a similar warning. Although the Relative Strength Index (RSI) managed to rise above the 50 level during the uptrend, it has reverted to a downward trend with the pullback. This outlook indicates that buyers gained strength for a short time but were unable to maintain it. This fragility on the momentum side is making it difficult for the price to open up more room to the upside.
On the Ichimoku indicator side, the picture is more balanced. Although the price has pulled back from the upper band of the Kumo cloud, it has managed to stay above the Tenkan and Kijun levels. This indicates that the short-term structure has not completely broken down and that buyers are still in the game. From a technical perspective, the outlook is not weak, but a clear trend has not yet formed.
Intraday assessment has eyes back on the $1.90 level. The price is likely to retest this area. If this resistance is broken, the upward movement could become more sustained. On the downside, the $1.81 level remains a critical support.
Supports: 1.8121 – 1.6224 – 1.5146
Resistances: 1.9092 – 2.0543 – 2.1731
SOL/USDT
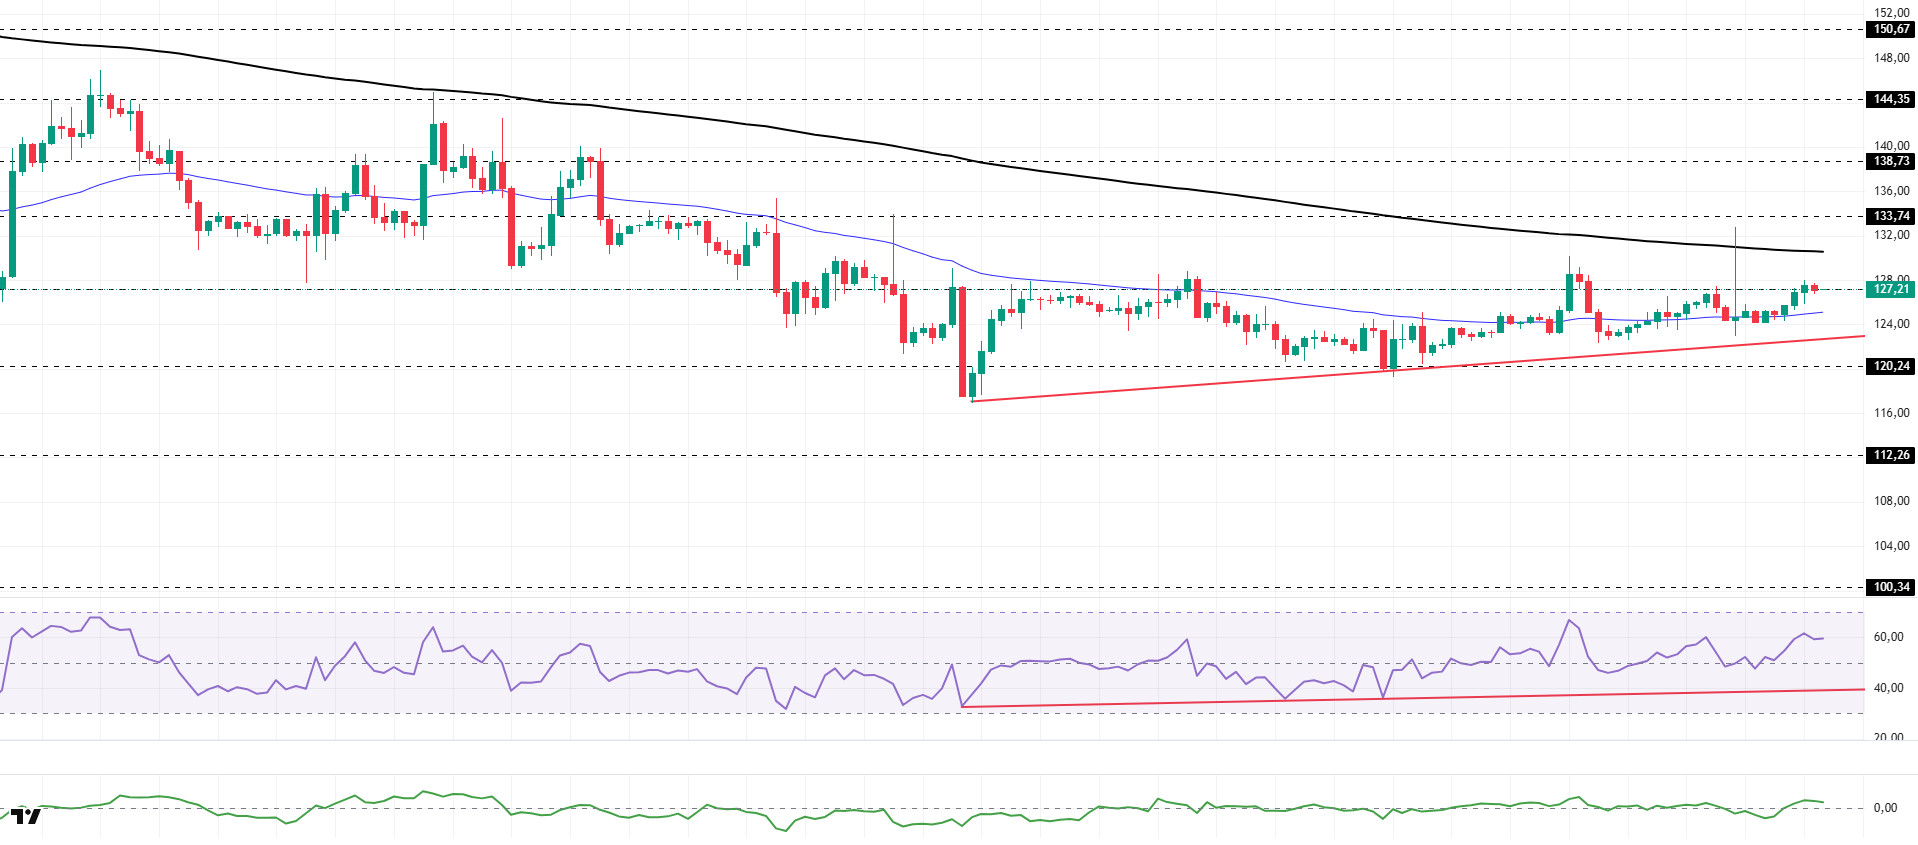
The SOL price showed an upward trend. The asset continued to trade in the upper region of the rising line that began on December 18. Testing the strong resistance level of $127.21, the price gave a bullish signal by closing above this level. Currently, the asset has moved above the 50 EMA (Blue Line) moving average. If the uptrend continues, it may test the 200 EMA (Black Line) moving average as resistance. In case of a pullback, the upward trend could act as support.
The price remained below the 50 EMA (Exponential Moving Average – Blue Line) and 200 EMA (Black Line) on the 4-hour chart. This indicates that the downtrend is continuing in the medium term. At the same time, the price being between the two moving averages signaled that the asset is in a decision phase in the short term. The Chaikin Money Flow (CMF-20) is in positive territory. However, an increase in money inflows could push the CMF to the upper levels of positive territory. The Relative Strength Index (RSI-14) rose from neutral to positive levels. It also remained above the rising line that began on December 18. These indicate that buying pressure continues. If there is an uptrend due to macroeconomic data or positive news related to the Solana ecosystem, the $138.73 level stands out as a strong resistance point. If this level is broken upwards, the uptrend is expected to continue. In the event of pullbacks due to developments in the opposite direction or profit-taking, the $120.24 level could be tested. A decline to these support levels could increase buying momentum, presenting a potential opportunity for an uptrend.
Supports: 127.12 – 120.24 – 112.26
Resistances: 133.74 – 138.73 – 144.35
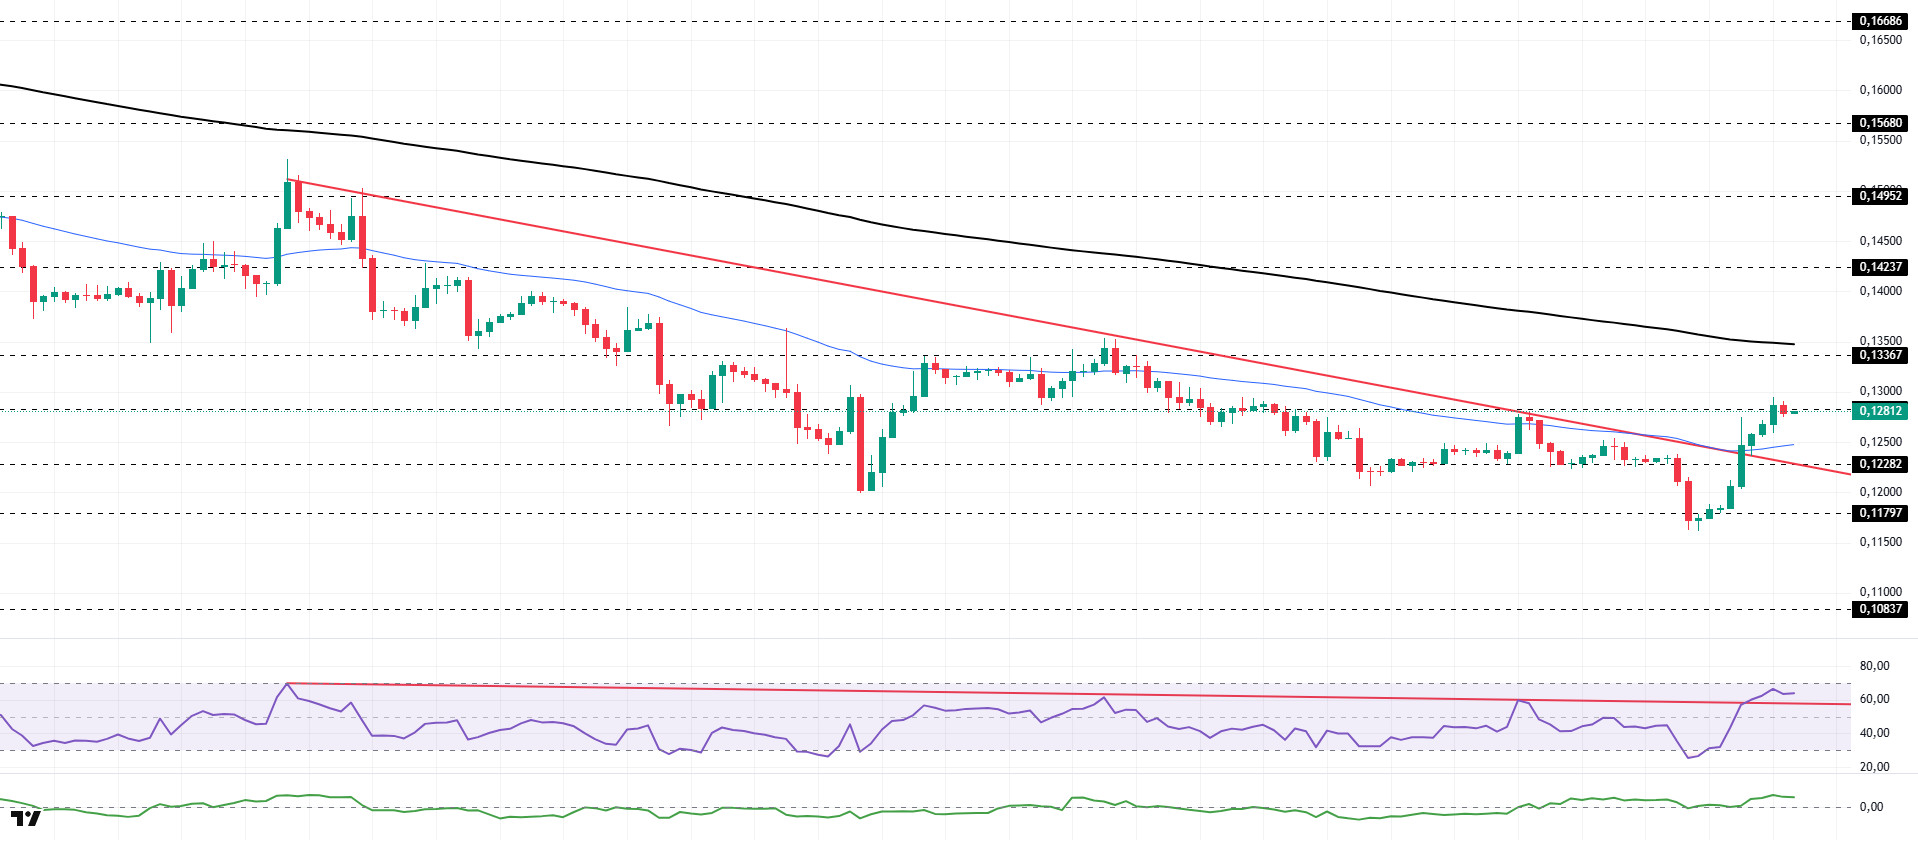
DOGE/USDT
The DOGE price experienced an uptrend. The asset tested the 50 EMA (Blue Line) moving average and the descending trend that began on the 9th as resistance and broke through, strengthening its uptrend. Currently testing the $0.12824 level as support, the price may test the 200 EMA (Black Line) moving average as resistance upon closing above this level. In the event of a continued pullback, it may test the descending trend line and the 50 EMA (Blue Line) moving average as support.
On the 4-hour chart, the 50 EMA (Exponential Moving Average – Blue Line) remained below the 200 EMA (Black Line). This indicates that the downtrend could continue in the medium term. The price trading between the two moving averages indicates that the price is in a decision phase in the short term. The Chaikin Money Flow (CMF-20) remained in positive territory. Additionally, an increase in money inflows could push the CMF to the upper levels of the positive zone. The Relative Strength Index (RSI-14) rose from the middle of the negative zone to the overbought level. At the same time, it crossed above the upper zone of the downward trend that began on December 9. This signaled increased buying pressure. In the event of potential increases driven by political developments, macroeconomic data, or positive news flow within the DOGE ecosystem, the $0.14237 level stands out as a strong resistance zone. Conversely, in the event of negative news flow, the $0.11797 level could be triggered. A decline to these levels could increase momentum and initiate a new wave of growth.
Supports: 0.12282 – 0.11797 – 0.10837
Resistances: 0.12824 – 0.13367 – 0.14237
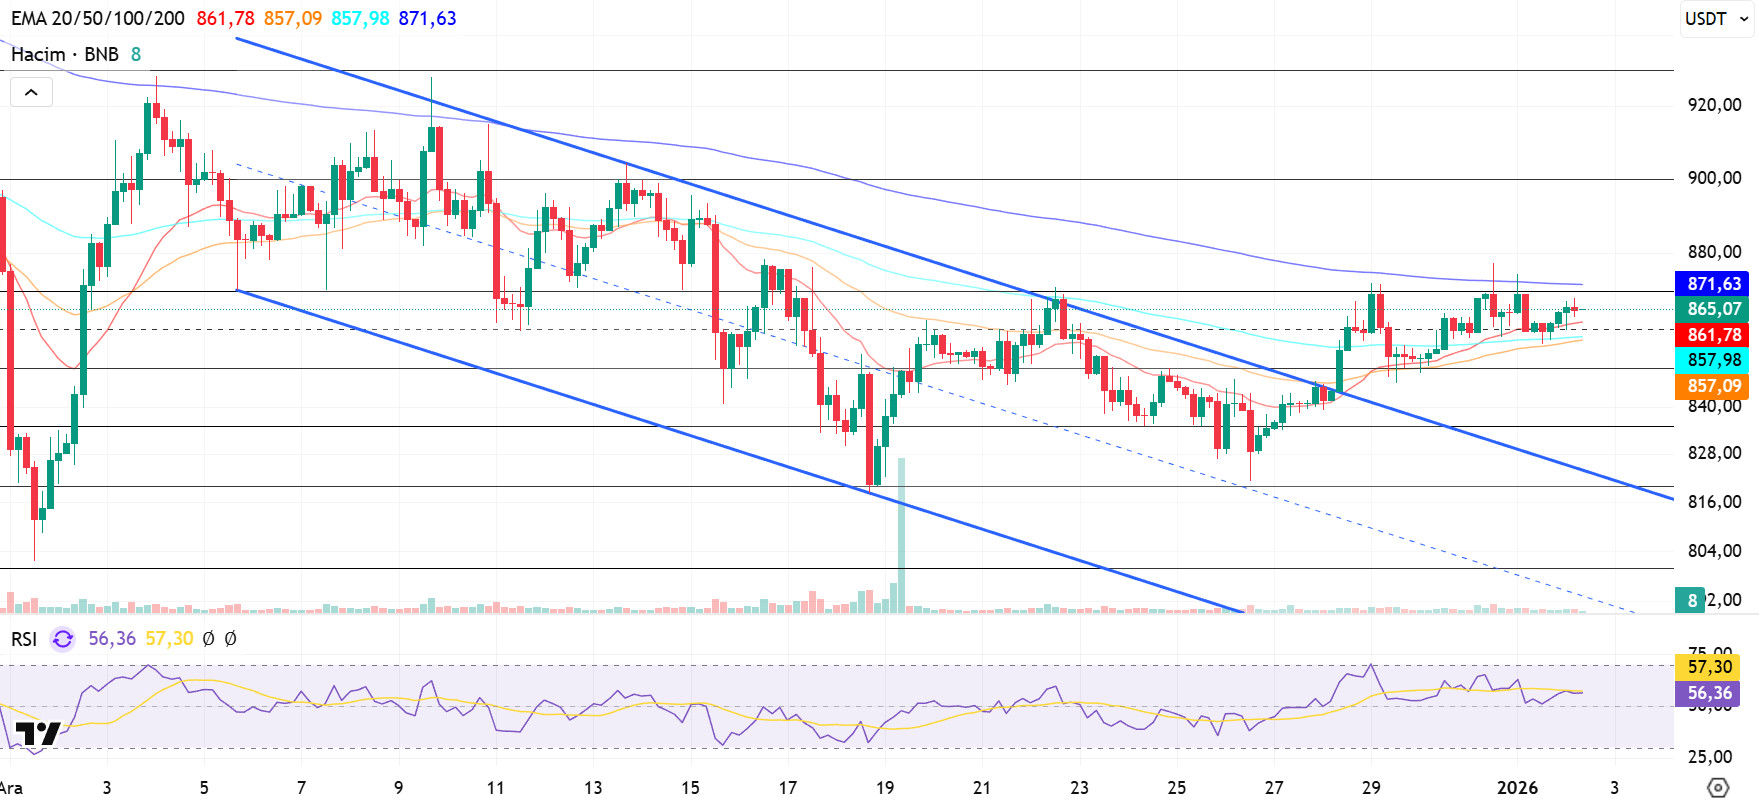
BNB/USDT
From a technical perspective, BNB/USDT gained positive momentum with the support provided by the new candles and rose to the $930 level; however, increased selling pressure was observed in this region depending on market conditions. With the effect of increased selling pressure, the asset appears to have continued its movement within a declining channel for some time.
However, BNB, which turned upward with the support it received from the middle band of the descending channel, gained positive momentum by breaking the upper band of the channel upward. In this direction, the asset rose above the previously determined target level of $860 and reached the $875 level. Although partial pressure is seen at these levels, the overall technical outlook is considered to maintain its positive structure.
Currently trading in the $850–875 range, technical indicators for BNB show that low trading volume is limiting the upward momentum. Additionally, the RSI indicator reaching the 70 level with the recent rises and reacting from this level indicates that a limited correction movement may continue in the short term.
Within the technical outlook, if buying appetite is maintained and market momentum strengthens, BNB is expected to retest the $875 resistance level in the first stage. Breaking above this level could potentially lead to a move above the descending trend line. If the trend breakout is confirmed and the price manages to hold above this level, a rise towards the $900 and $930 levels is technically possible.
On the other hand, if selling pressure increases, the price is expected to retest the $850 support level. If this level is broken downward, a pullback towards the $835 and $820 support zones may come into play.
Supports: 850 – 835 – 820
Resistances: 875 – 900 – 930
Legal Notice
The investment information, comments, and recommendations contained herein do not constitute investment advice. Investment advisory services are provided individually by authorized institutions taking into account the risk and return preferences of individuals. The comments and recommendations contained herein are of a general nature. These recommendations may not be suitable for your financial situation and risk and return preferences. Therefore, making an investment decision based solely on the information contained herein may not produce results in line with your expectations.

