
Technical Analysis
BTC/USDT
President Trump’s statements emphasizing his health and cognitive competence have reignited leadership debates ahead of the upcoming election process. Meanwhile, Forbes’ 2026 outlook indicates that institutionalization, tokenization, and artificial intelligence integration in crypto markets are fundamentally transforming investment dynamics. In this context, H100’s official confirmation of its Bitcoin holdings demonstrates the growing prevalence of BTC as a strategic asset on corporate balance sheets.
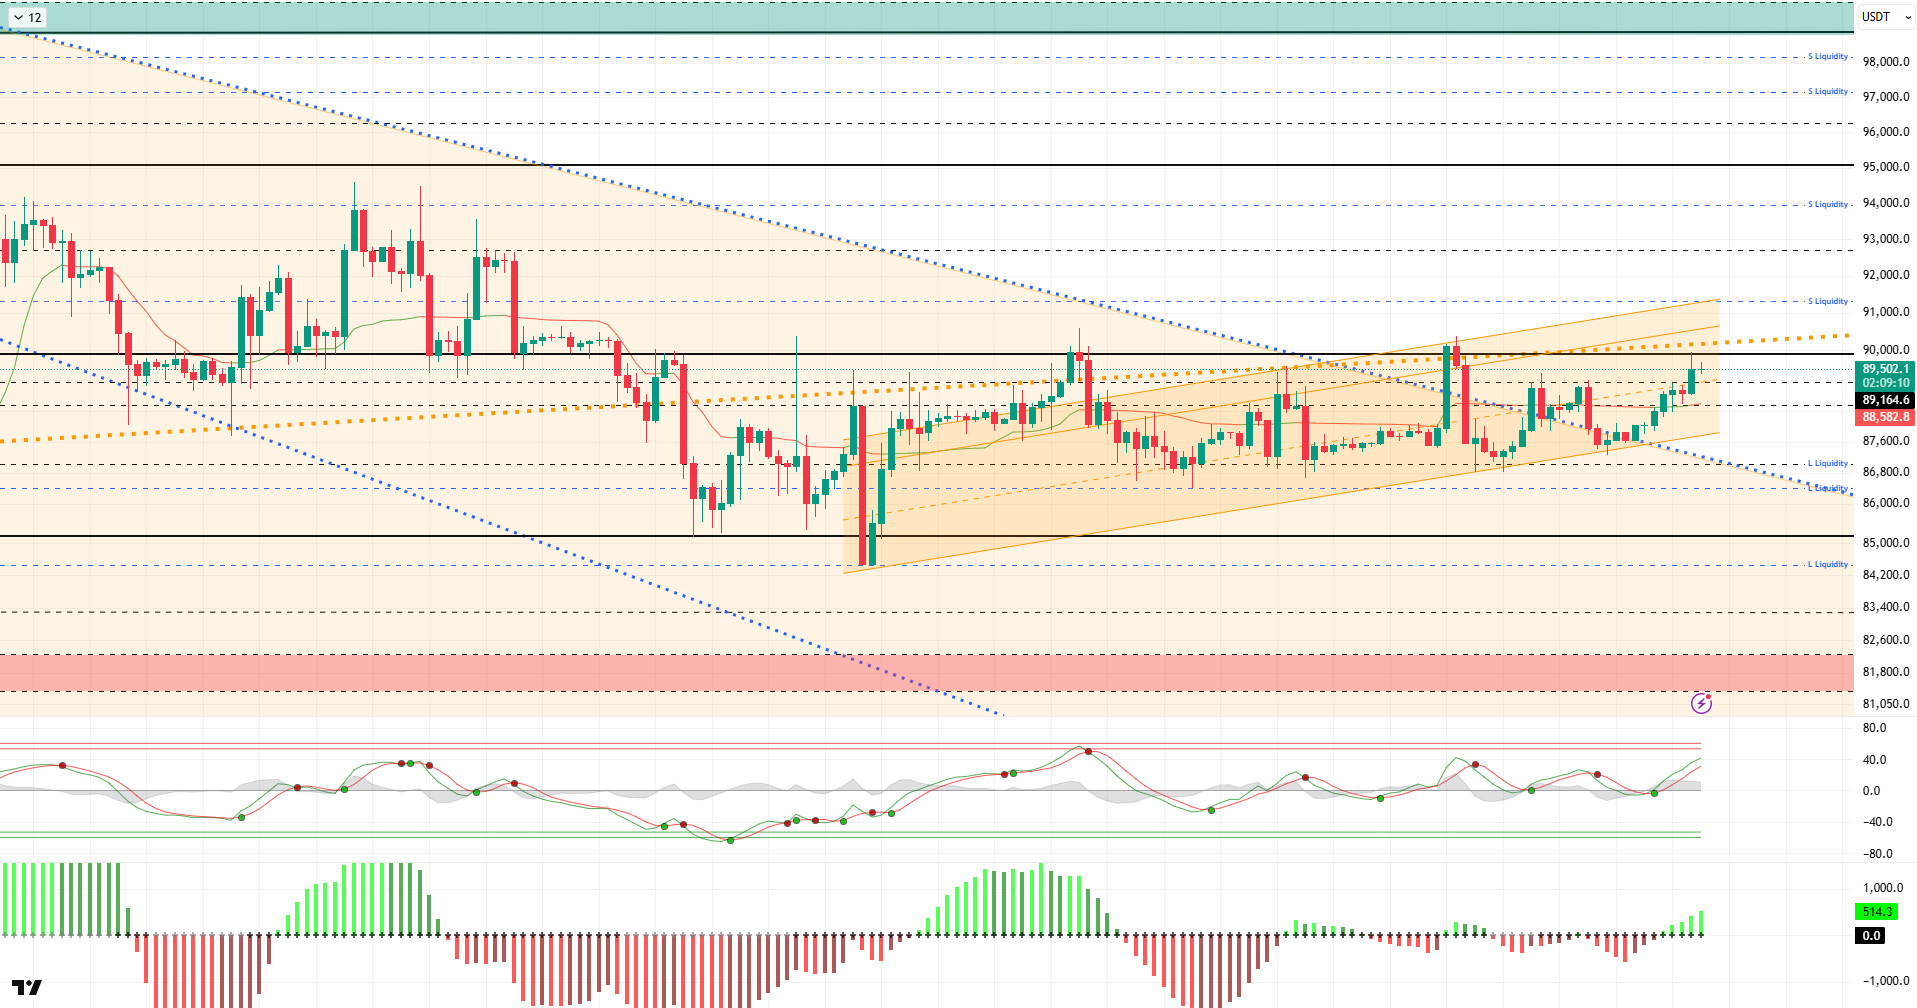
From a technical perspective, BTC tested the 90,000 reference level again during the day, compared to the previous analysis. The price, which continues to move within the upward channel, appears to be pushing this area and maintaining a positive trajectory for the year. In this context, the breakout of the 90,000 reference point, which has long served as resistance, emerges as a critical level to monitor for momentum gaining traction in the upward direction.
Technical indicators show that the Wave Trend (WT) oscillator is giving a buy signal again in the middle band of the channel, while weakening near the overbought zone. The histogram on the Squeeze Momentum (SM) indicator has successfully transitioned back into positive territory. The Kaufman Moving Average (KAMA) is currently at $88.582, just below the price.
When examining liquidation data, it is seen that buy-side transactions are concentrated at the 86,000–87,000 level. In contrast, sell-side transactions were liquidated in the short term at the 89,000–90,000 level. In a broader time frame, the 91,000 level stands out as a liquidity area.
In summary, the absence of any developments that could fundamentally affect the price is currently keeping the upward momentum alive. Looking at liquidity data, it appears that areas with concentrated short-term trading are being targeted, while long-term selling levels have not yet been tested. BTC, which started the new year positively with an upward trend, now faces the short-term resistance level of 88,500 as it seeks to regain momentum.Closes and price movements above this level, along with momentum, would bring the 90,000 reference area back into focus as a target. In the event of a breakout, the price could move towards liquidity areas again, parallel to the channel band. In the event of potential selling pressure, 87,700 would emerge as the short-term trend line, while 86,000 would be monitored as another liquidity area.
Supports: 86,300 – 85,000 – 84,000
Resistances: 88,500 – 89,000 – 90,000
ETH/USDT
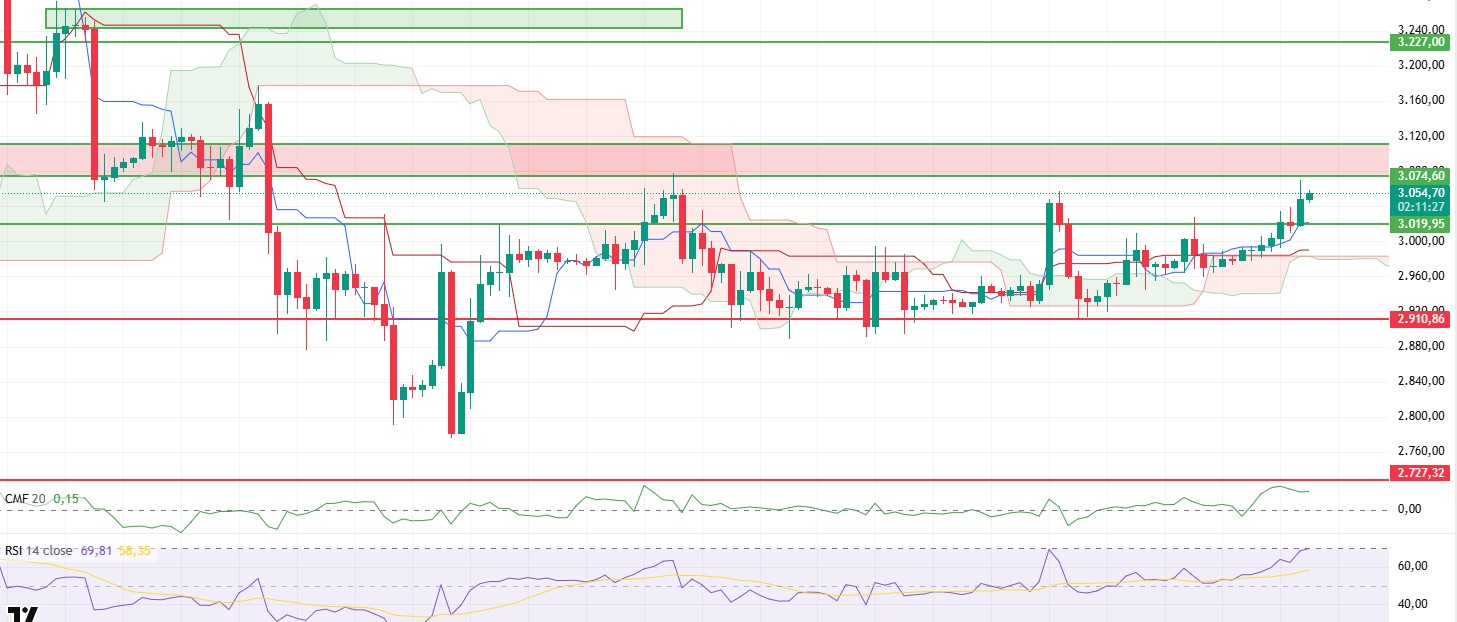
On the ETH side, the price movement during the day largely confirmed the framework drawn in the morning. After maintaining stability above the $3,020 level, purchases accelerated and the price moved towards the $3,074 resistance. After reaching this area, it retreated slightly. The fact that there has not been a clear breakout yet shows that this area is still functioning as a strong selling zone.
During the upward movement, liquidity support has not completely disappeared, but a weakening compared to the initial momentum is noticeable. Although the Chaikin Money Flow (CMF) remains in positive territory, profit-taking appears to have kicked in at this stage of the rally. Although liquidity flow is still supportive, we have entered a phase where buyers are acting more cautiously. This scenario makes it reasonable for the price to linger below resistance.
On the momentum side, a more sensitive structure is emerging. The Relative Strength Index (RSI) has risen to the upper limit of the overbought zone. The indicator being this inflated increases the risk of a pullback in the short term. This RSI outlook does not suggest that the uptrend has completely ended, but rather that the price may need to take a breather. Therefore, a re-test scenario appears more likely than sudden and sharp continuation movements.
Technically, the Ichimoku indicator chart has not changed and remains strong. The price is trading above the Kumo cloud, and the Tenkan and Kijun levels are being maintained. This structure indicates that the main trend is still upward and that any pullbacks may remain within the scope of technical corrections. As long as pricing remains above the cloud, the overall outlook cannot be considered impaired.
In the intraday assessment, the area marked with a red rectangle remains the main reference point. If the $3,074 level is exceeded, upward momentum could regain strength. Conversely, the current structure of the RSI increases the likelihood of a retest towards the $3,020 level. Maintaining this level is critical for the continuation of the upward structure. If the price falls below $3,020 , the pullback could deepen. Overall, the trend remains upward, but a volatile pricing process is expected in the short term.
Supports: 3,019 – 2,910 – 2,727
Resistances: 3,074 – 3,227 – 3,368
XRP/USDT
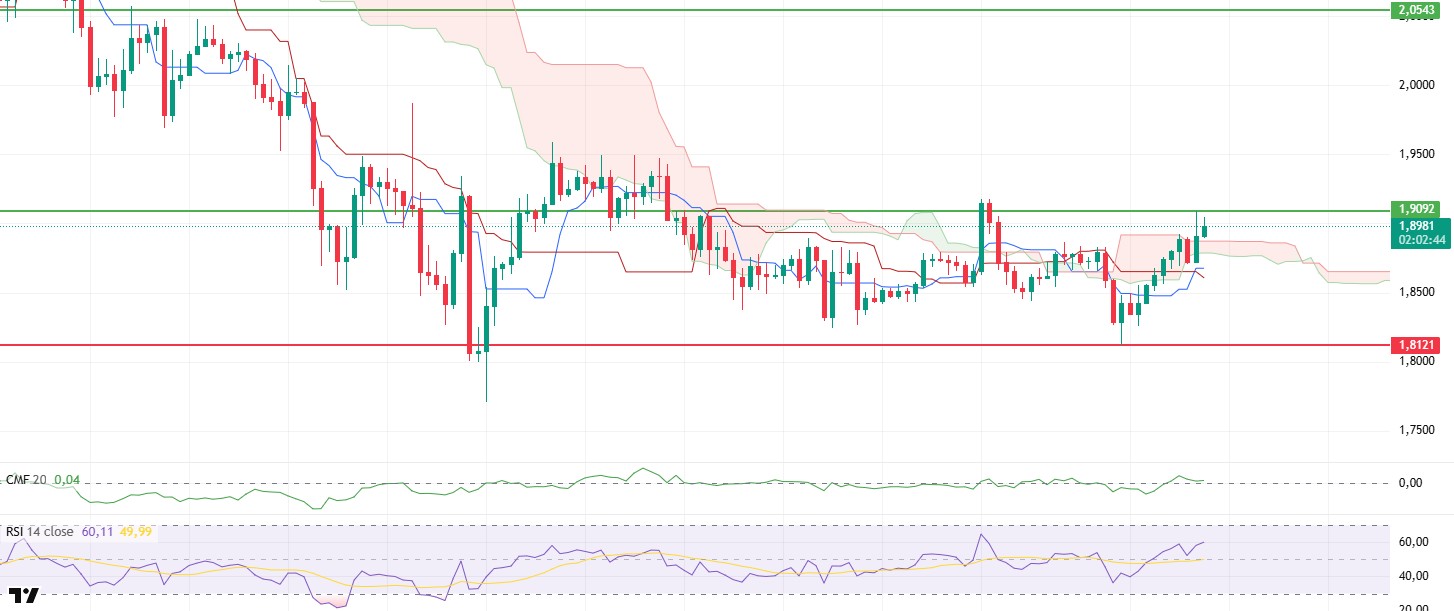
Later in the day, the XRP price largely confirmed the morning’s expected scenario and rose to the $1.90 level. The price slowing down after reaching this area indicates that the market is at a clear decision point. At this stage, the pricing around $1.90 suggests that the balance between buyers and sellers is at a very delicate point.
The liquidity picture remains cautious. The Chaikin Money Flow (CMF) is in positive territory, but the movement is quite weak. Although the presence of money entering the market is noticeable, this flow does not appear to have reached a level that would create a strong breakout. Therefore, the price is struggling to advance in upward attempts and is losing time at resistance levels.
On the momentum front, a more constructive outlook is emerging. The Relative Strength Index (RSI) has rebounded from the 52 level, regaining an upward trend. This movement indicates that buyers have not completely retreated and that upward momentum remains intact. The RSI’s ability to remain above this level stands out as one of the factors increasing the likelihood of the price holding in the resistance zone.
From a technical perspective, the Ichimoku indicator has reached a more positive point compared to this morning. The price has moved above the upper band of the Kumo cloud, technically entering positive territory. This outlook suggests that pressure has eased in the short term and buyers are beginning to gain technical superiority. The fact that the Tenkan and Kijun levels have been surpassed also supports this picture.
The overall focus has not changed. The $1.90 level remains key in terms of determining direction. If prices remain above this level, a more comfortable rise seems possible. Conversely, if $1.90 cannot be surpassed, it would not be surprising to see prices seek equilibrium again with a limited pullback. On the downside, the $1.81 level continues to serve as the main support at . The current picture suggests that the decision for XRP will continue to be shaped within these two levels.
Supports: 1.8121 – 1.6224 – 1.5146
Resistances: 1.9092 – 2.0543 – 2.1731
SOL/USDT
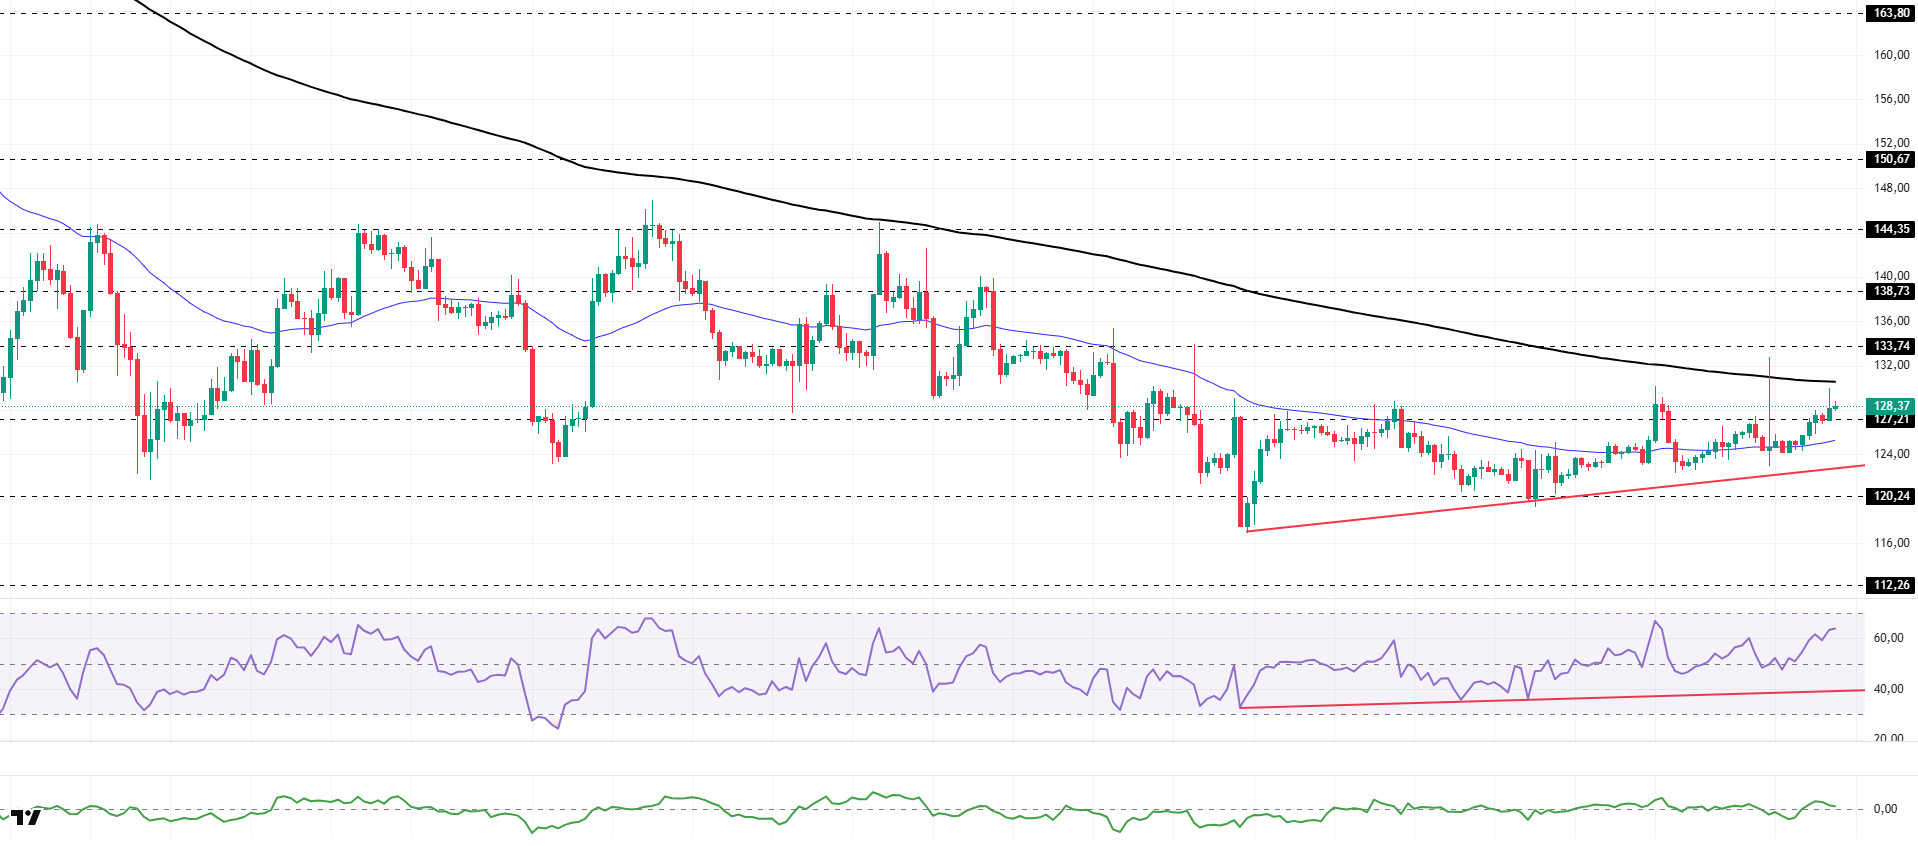
The SOL price showed an upward trend during the day. The asset continued to remain in the upper region of the upward trend that began on December 18. Testing the strong resistance level of $127.21, the price gave a bullish signal by closing above this level. Currently preparing to test the 200 EMA (Black Line) moving average as resistance, the asset could test the $133.74 level as resistance if the uptrend continues. In case of a pullback, it could test the 50 EMA (Blue Line) moving average as support.
On the 4-hour chart, it remained below the 50 EMA (Exponential Moving Average – Blue Line) and 200 EMA (Black Line). This indicates that the medium-term downtrend is continuing. At the same time, the price being between the two moving averages indicates that the asset is in a decision phase in the short term. The Chaikin Money Flow (CMF-20) is in positive territory. However, an increase in money inflows could push the CMF to the upper levels of the positive zone. The Relative Strength Index (RSI-14) maintains its position at positive levels. It also continues to trade above the upward trend line that began on December 18. These factors indicate that buying pressure persists. If there is an uptrend due to macroeconomic data or positive news related to the Solana ecosystem, the $138.73 level stands out as a strong resistance point. If this level is broken upwards, the uptrend is expected to continue. If there are pullbacks due to developments in the opposite direction or profit-taking, the $120.24 level could be tested. A decline to these support levels could increase buying momentum, presenting a potential opportunity for an upward move.
Supports: 127.21 – 120.24 – 112.26
Resistances: 133.74 – 138.73 – 144.35
DOGE/USDT
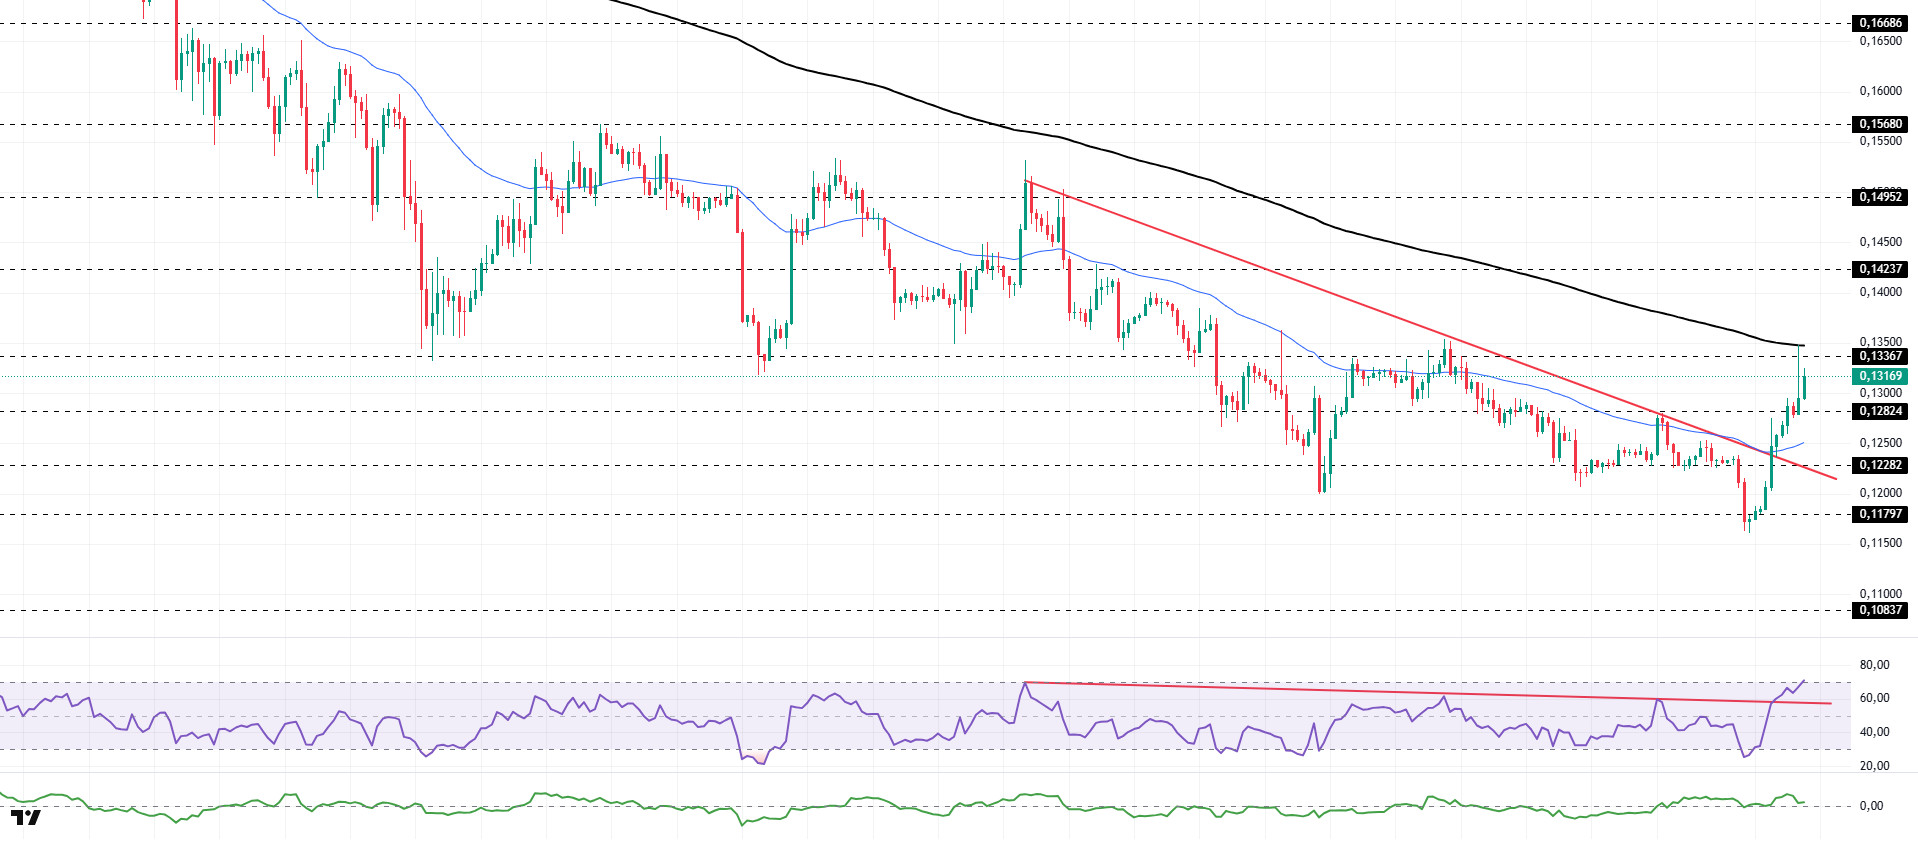
The DOGE price experienced an uptrend during the day. The asset tested the 50 EMA (Blue Line) moving average and the descending trend that began on the 9th as resistance, breaking through and strengthening its uptrend. Currently, the price, facing resistance at 0.13367 and the 200 EMA (Black Line) moving average, experienced a slight pullback. The price is now preparing to retest the 200 EMA moving average as resistance. If it closes above this level, it could test the $0.14237 level as resistance. In the event of a pullback, it could test the downward trend line and the 50 EMA (Blue Line) moving average as support.
On the 4-hour chart, the 50 EMA (Exponential Moving Average – Blue Line) remained below the 200 EMA (Black Line). This indicates that the downtrend could continue in the medium term. The price trading between both moving averages indicates that the price is in a decision phase in the short term. The Chaikin Money Flow (CMF-20) may remain in the positive zone. Additionally, the balance of money inflows and outflows may keep the CMF in positive territory. The Relative Strength Index (RSI-14) rose from the middle of the negative zone to the overbought level. This may bring a slight decline. At the same time, it crossed above the upper zone of the downward trend that began on December 9. This signaled increased buying pressure. In the event of an uptrend driven by political developments, macroeconomic data, or positive news flow in the DOGE ecosystem, the $0.14237 level stands out as a strong resistance zone. Conversely, in the event of negative news flow, the $0.11797 level could be triggered. A decline to these levels could increase momentum and initiate a new wave of growth.
Supports: 0.12824 – 0.12282 – 0.11797
Resistances: 0.13367 – 0.14237 – 0.14952
BNB/USDT
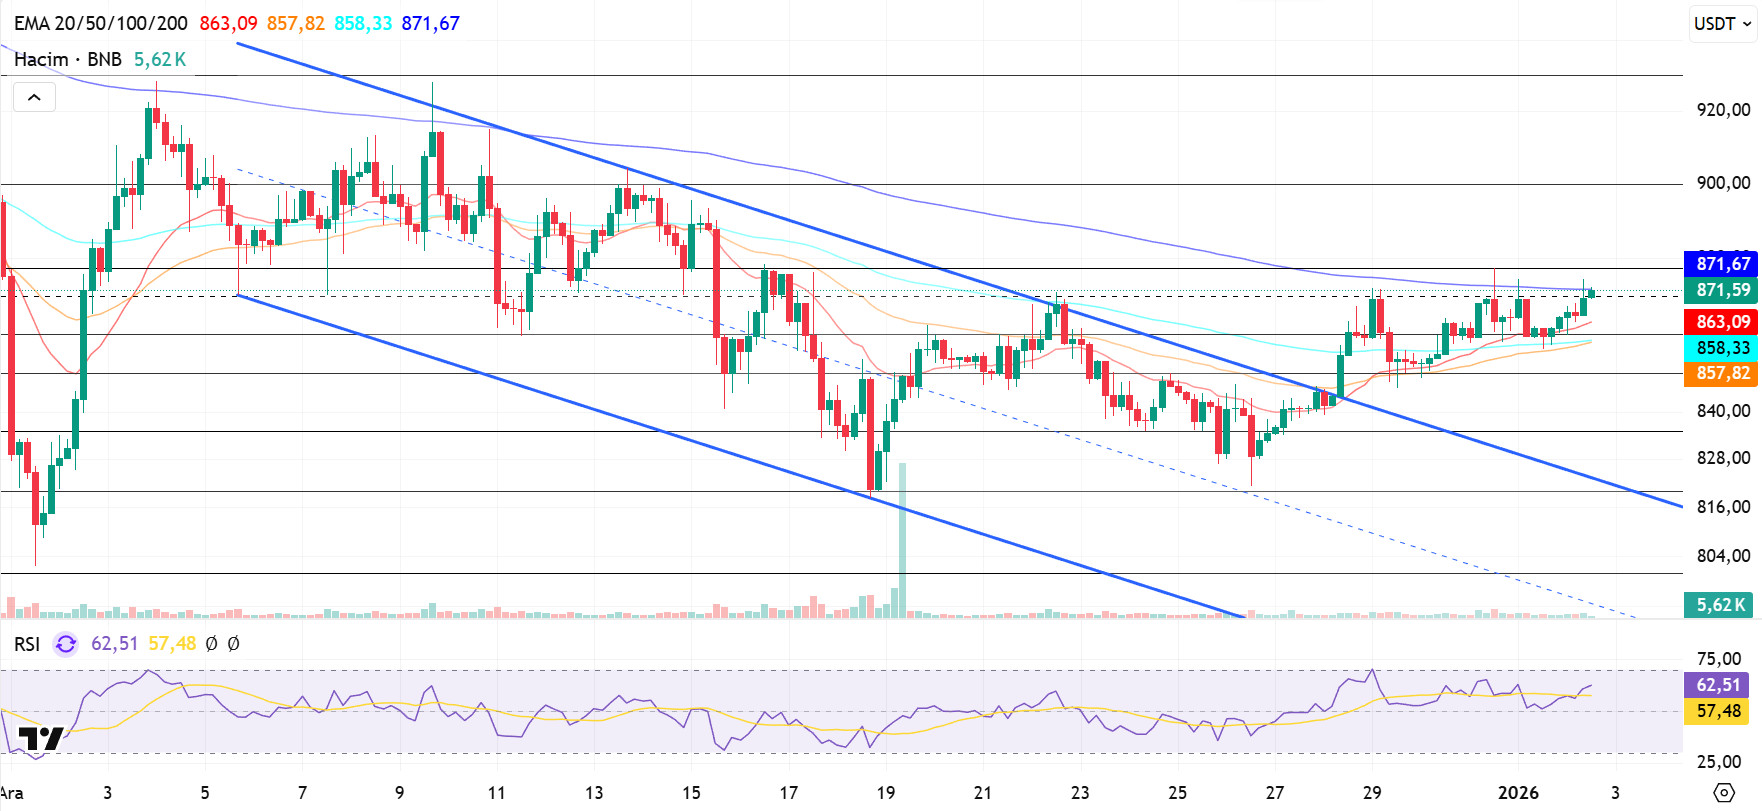
From a technical perspective, BNB/USDT gained positive momentum with the support provided by new candles and rose to the $930 level; however, increased selling pressure was observed in this region depending on market conditions. With the effect of increased selling pressure, the asset appears to have continued its movement within a declining channel for some time.
However, BNB, which turned upward with the support it received from the middle band of the descending channel, gained positive momentum by breaking the upper band of the channel upward. In this direction, the asset rose above the previously determined target level of $860 and reached the $875 level. Although partial pressure is seen at these levels, the overall technical outlook is considered to maintain its positive structure.
Currently trading in the $860–875 range, technical indicators for BNB show that low trading volume is limiting the upward momentum. Additionally, the RSI indicator reaching the 70 level with the recent rises and reacting from this level indicates that a limited correction movement may continue in the short term.
Within the technical outlook, if buying appetite is maintained and market momentum strengthens, BNB is expected to retest the $875 resistance level in the first stage. Breaking above this level could potentially lead to a move above the falling trend line. If the trend breakout is confirmed and the price manages to hold above this level, a rise towards the $900 and $930 levels is technically possible.
On the other hand, if selling pressure increases, the price is expected to retest the $860 support level. If this level is broken downward, a pullback towards the $ , $850 , and $835 support zones could come into play.
Supports: 860 – 850 – 835
Resistances: 875 – 900 – 930
Legal Notice
The investment information, comments, and recommendations contained herein do not constitute investment advice. Investment advisory services are provided individually by authorized institutions taking into account the risk and return preferences of individuals. The comments and recommendations contained herein are of a general nature. These recommendations may not be suitable for your financial situation and risk and return preferences. Therefore, making an investment decision based solely on the information contained herein may not produce results in line with your expectations.

