
BTC/USDT
Global markets are entering a critical week where Fed minutes and core PCE data will be decisive. While growth and inflation data in the US are being closely monitored in terms of the timing of interest rate cut expectations, the strong macro outlook supports a soft landing scenario. However, core inflation still hovering above target and uncertainties regarding tariffs are maintaining a cautious stance. On the crypto front, Strategy Management’s messages about balance sheet resilience and long-term bond plans have reignited discussions about risk appetite and leverage.
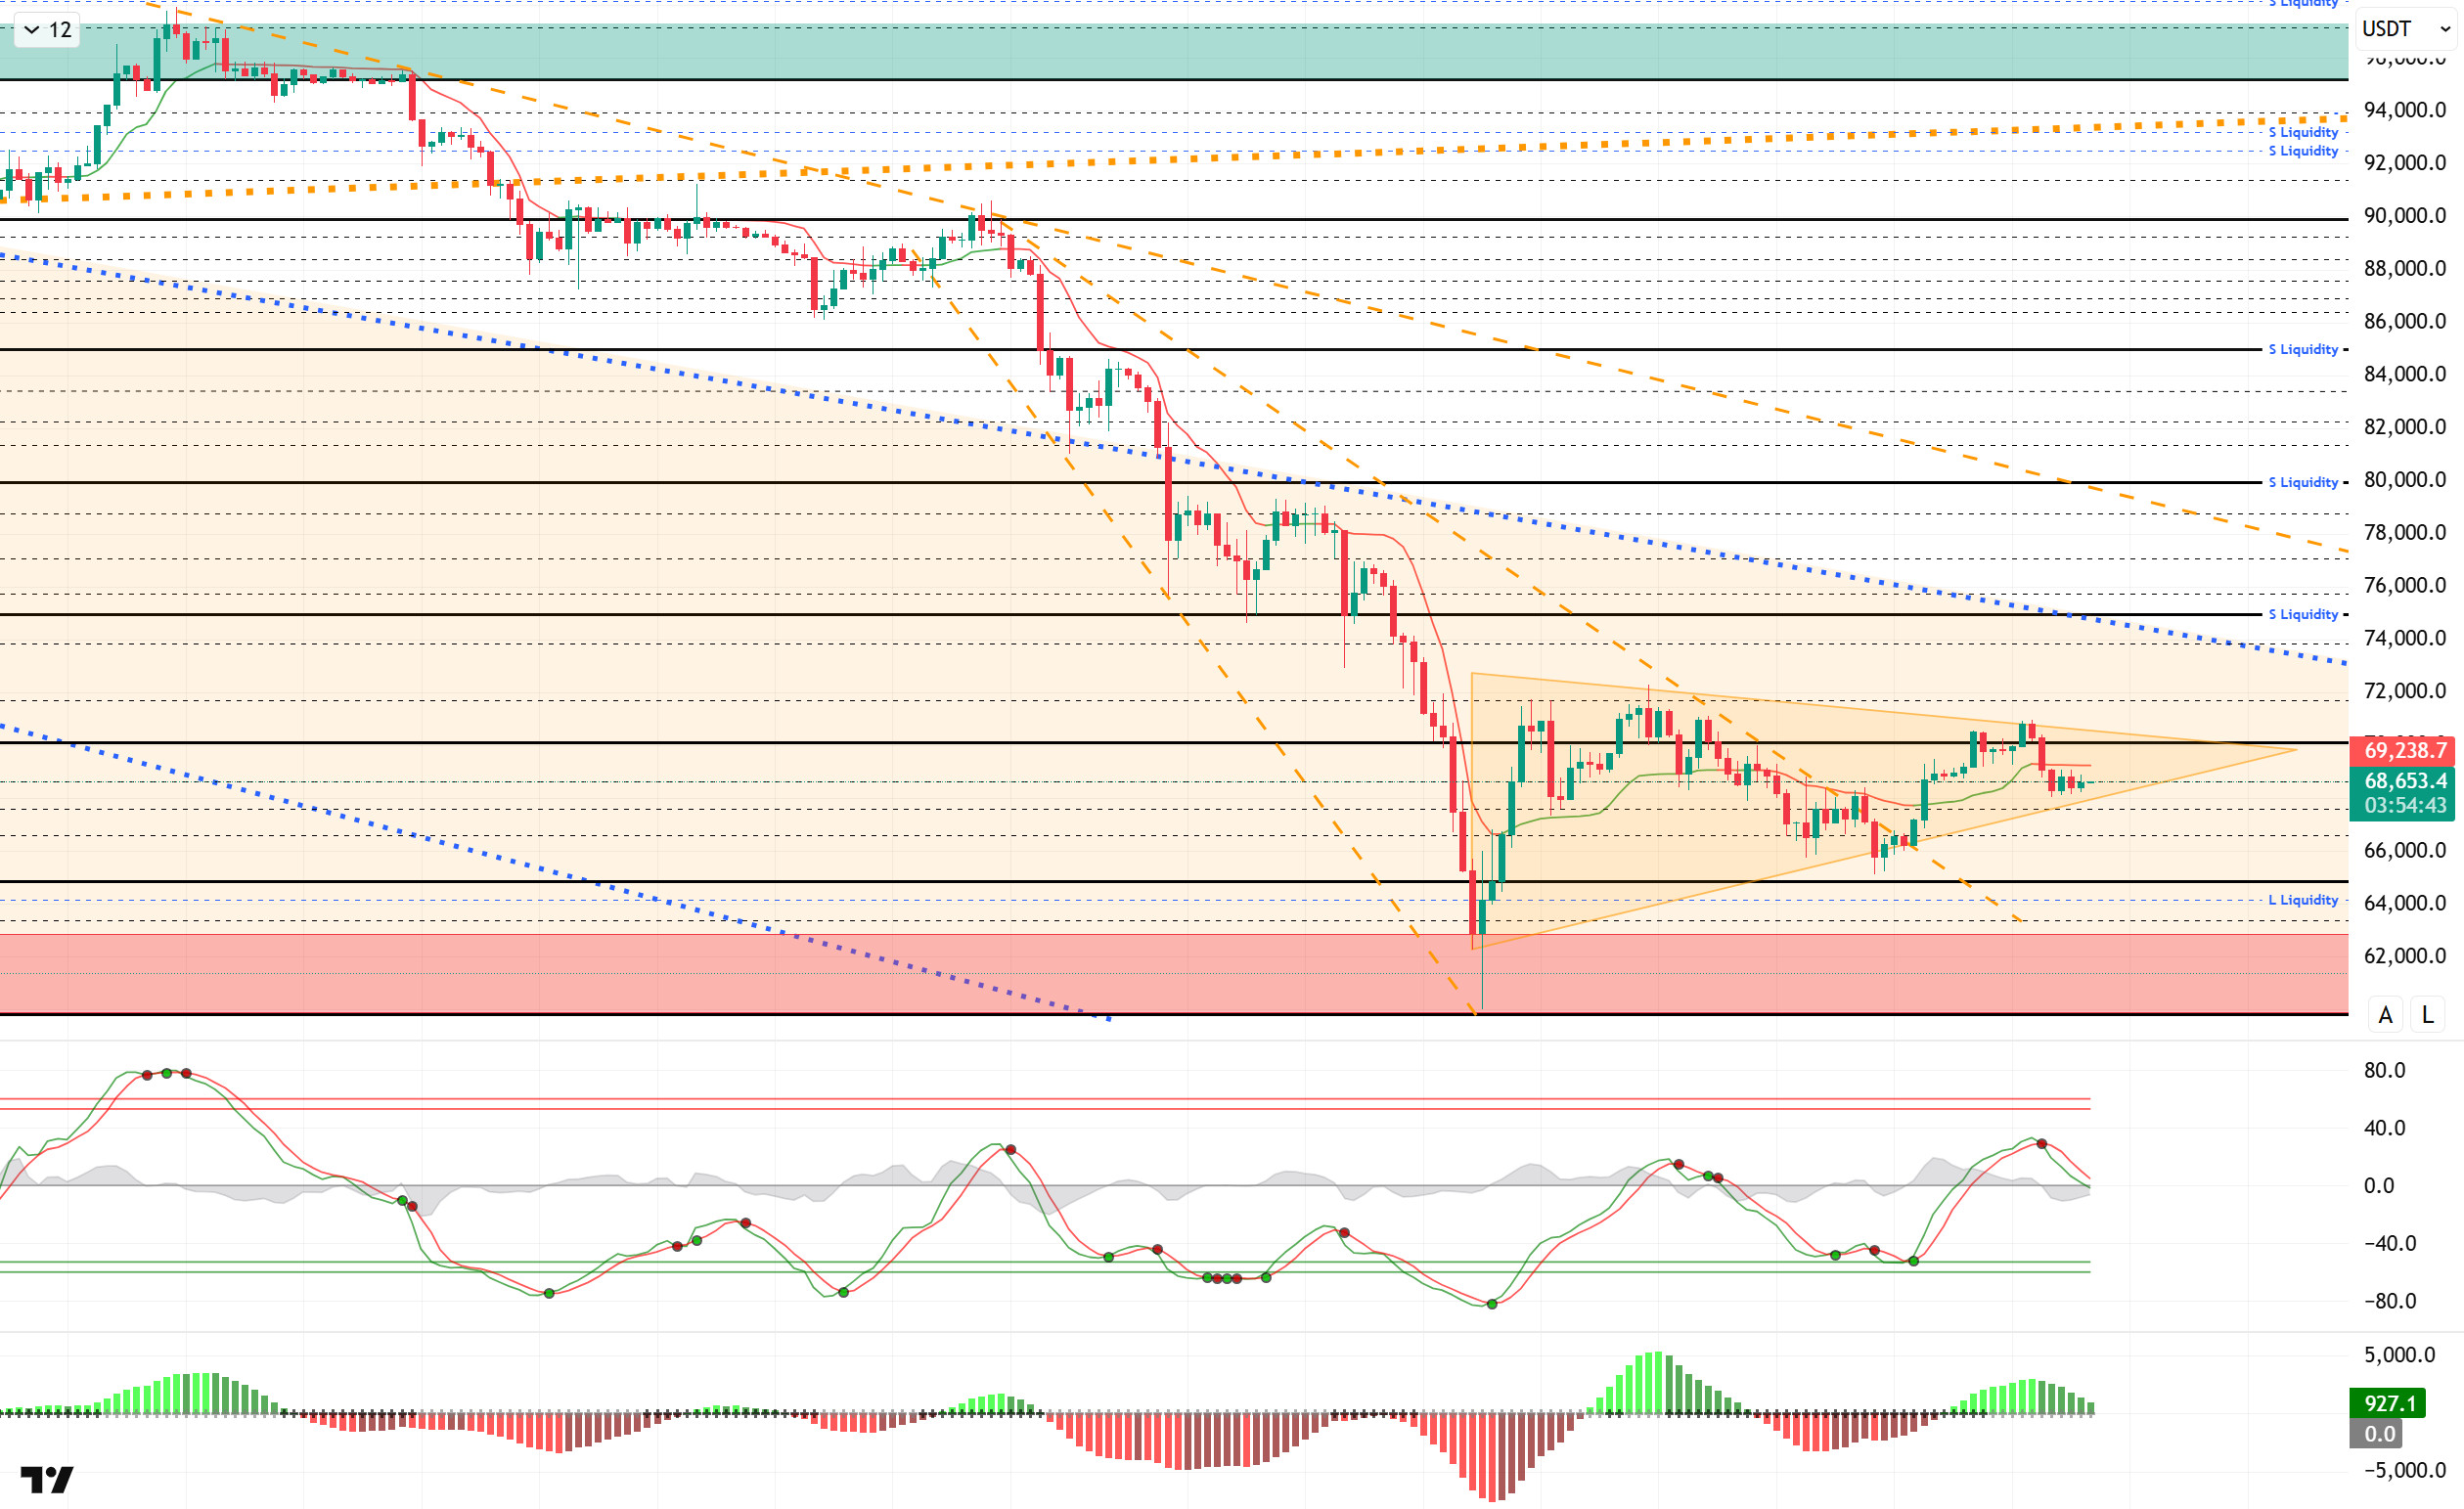
Technically, BTC gained upward momentum by forming its second rising bottom at the 65,000 level. With this momentum, the price rose above the 70,000 level once again, formed a descending peak here, and retreated slightly. BTC, which continues to trade within the symmetrical triangle it has formed, will give us an idea about the direction of the breakout price. In this context, while the 70,000 level brings an upward breakout, the 66,500 level emerges as the test area for downward breakouts.
Technical indicators show that the Wave Trend (WT) oscillator crossed the middle band of the parallel channel in line with the buy signals it gave in the oversold zone and has now switched back to a sell signal. The histogram on the Squeeze Momentum (SM) indicator is experiencing a loss of momentum in the positive zone again. The Kaufman Moving Average (KAMA) is currently trading above the price at the $69,243 level.
When examining liquidation data, the buy level first became the price’s target zone, then the sell level was liquidated with the recorded rise to 68,000 – 70,000. With the latest rise, transactions recorded intensity at the 68,300 level were liquidated. Looking at liquidity levels, the 71,000–72,000 band stands out in the short term on the sell side, while fragmented intensity is recorded within the 65,000–68,000 band.
In summary, macro data and FOMC minutes will be monitored on the US front this week, while geopolitical developments involving Iran, the US, and tariff decisions will shape market direction. While short-term buy/sell levels are targeted in liquidity data, long-term sell-side transactions maintain their intensity.Technically, BTC started the new year with strong momentum, tested the 98,000 level, then faced heavy selling pressure and retreated to the 60,000 level. Following this move, all monthly closes since September have been negative. Historically, BTC has not had consecutive negative closes in January and February, but it continues its negative performance in February.Looking at the current technical structure, after forming a rising bottom at the 65,000 level, the price tested the 70,000 levels. In the next stage, the breakout in the price with its symmetrical triangle structure will give us an idea about the direction.
Supports: 67,400 – 66,500 – 65,000
Resistances: 68,600 – 70,000 – 71,600
ETH/USDT
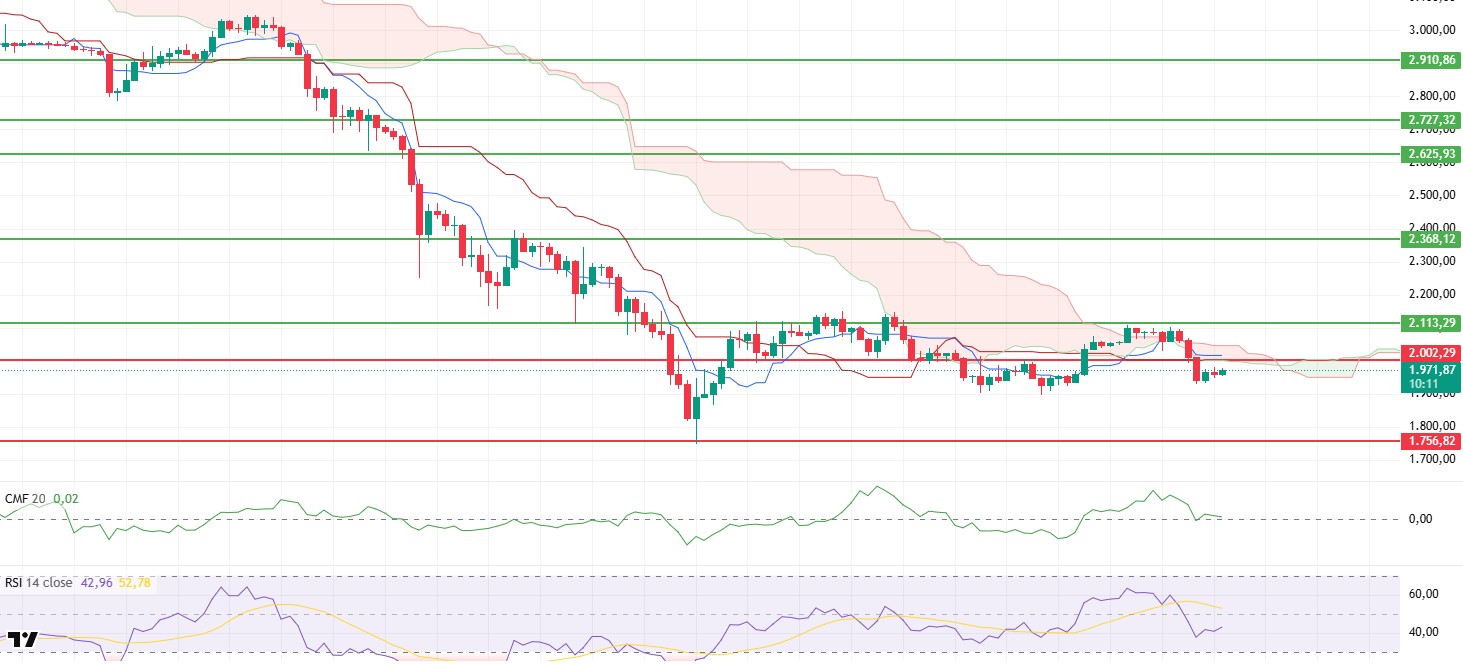
The ETH price continued to rise as the weekend approached, climbing to $2,105 on Saturday. However, this movement was not sustainable. Along with a drop of approximately $500 million in open interest, the closing of long positions triggered selling pressure, and the price pulled back sharply, retreating to the $1,960 region again. The current structure shows that upward attempts have not yet found solid ground and that fragility persists in the market.
Weakness in liquidity has become apparent again. The Chaikin Money Flow (CMF) indicator retreating to the zero line signals weakening buying appetite and a renewed acceleration in exits from the market. This outlook suggests that upward attempts may lack spot support and that upward movements may struggle to gain traction.
The Relative Strength Index (RSI) has retreated to the 37 level and is trading sideways in this region. The indicator’s persistence in the weak zone reveals that momentum is losing strength and buyers have not yet regained control. Unless there is a clear recovery in the RSI, upward attacks are more likely to remain limited.
The overall outlook in the Ichimoku indicator has not changed, and the weak structure remains. While the price continues to trade below the kumo cloud, the Tenkan and Kijun levels have not been strongly regained. This positioning confirms that the main trend remains downward and keeps alive the risk of resistance levels hindering upward attempts.
In the overall assessment, the $2,000 level continues to be a strong resistance zone in the short term. As long as this area is not breached, selling pressure is expected to continue, and the price is expected to search for downward areas again . On the downside, the $1,756 level maintains its main support position, and possible pullbacks towards this area would not be surprising from a technical perspective.
Supports: 1,756 – 1,539 – 1,290
Resistances: 2,002 – 2,113 – 2,368
XRP/USDT
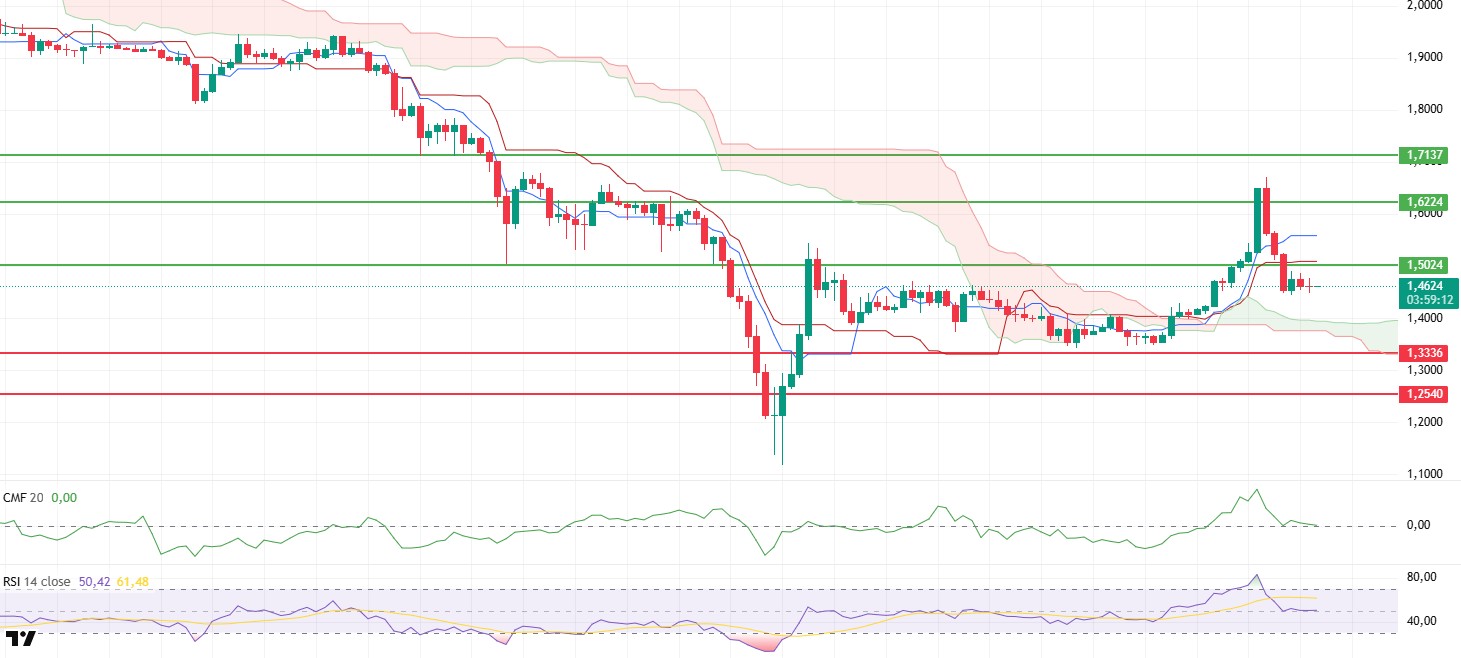
The XRP price showed high volatility throughout the weekend. It first rose to $1.67, surpassing the $1.50 level with strong buying. However, it failed to hold in this region and faced heavy selling, causing the price to retreat back to the $1.46 level. This volatile structure shows that upward attempts have not yet turned into a sustained trend and that profit-taking has quickly kicked in.
The liquidity outlook has weakened. The Chaikin Money Flow (CMF) has fallen to the zero line, signaling a renewed intensification of liquidity outflows in the market. This picture shows that, despite the recent upward attempt, buying appetite is not sustainable and a cautious stance is maintained on the spot side.
There is no clear strengthening on the momentum front either. The Relative Strength Index (RSI) retreated without producing a positive divergence, falling to the 50 level. This structure reveals that momentum remains in the neutral-weak zone and that buyers have been unable to generate strong momentum. It seems difficult for the uptrend to gain speed without a renewed upward slope on the RSI.
The Ichimoku indicator presents a mixed picture. While the price remaining above the kumo cloud is a positive factor for the medium-term outlook, the loss of the Tenkan and Kijun levels indicates that pressure may continue in the short term. Therefore, the technical structure has not yet produced a clear confirmation of strength.
In the overall assessment, even if limited pullbacks are seen in the short term, it is likely that the price will test the $1.50 level again. If this level is strongly exceeded, upward movement may gain momentum again. On the downside, the $1.33 level maintains its position as the main support. If this region is lost, selling pressure may intensify again.
Supports: 1.3336– 1.2540 – 1.0694
Resistances: 1.5024 – 1.6224 – 1.7137
SOL/USDT
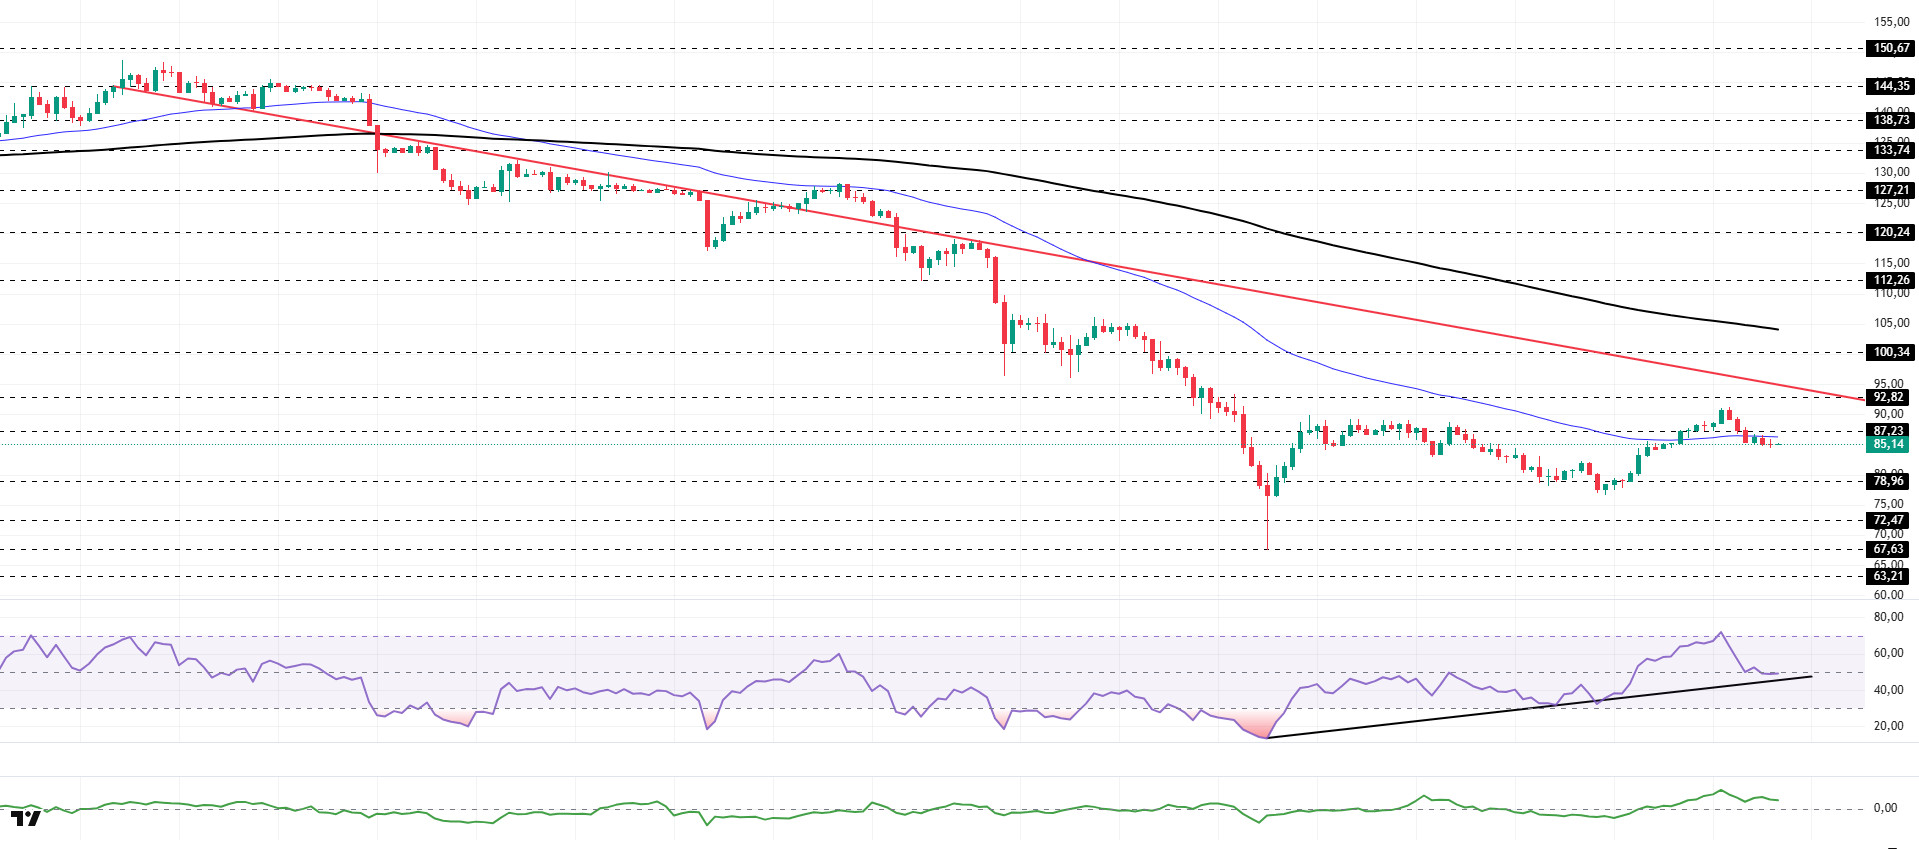
The SOL price experienced a pullback. The asset remained below the downward trend that began on January 13, signaling continued selling pressure. Testing the strong support level of $87.23 and the 50 EMA (Blue Line) moving average as support, the price broke below these levels, signaling increased selling pressure. Currently testing the 50 EMA moving average as resistance, the asset should be monitored at the $78.69 level if the pullback continues. If it experiences an uptrend, the downtrend could act as resistance.
On the 4-hour chart, the 50 EMA (Exponential Moving Average – Blue Line) continues to remain below the 200 EMA (Black Line). This indicates that the downtrend is continuing in the medium term. At the same time, the price being below both moving averages shows that the asset is trending downward in the short term. The Chaikin Money Flow (CMF-20) has moved into positive territory. However, an increase in money outflows could pull the CMF into negative territory. The Relative Strength Index (RSI-14) has retreated from the overbought zone to neutral levels. At the same time, it is preparing to test the rising trend that began on February 6 as support. A downward break could increase selling pressure. If there is an uptrend due to macroeconomic data or positive news related to the Solana ecosystem, the $100.34 level stands out as a strong resistance point. If this level is broken upward, the uptrend is expected to continue. In case of pullbacks due to developments in the opposite direction or profit-taking, it may test the $67.63 level. A decline to these support levels may increase buying momentum, presenting a potential upside opportunity.
Supports: 78.96 – 72.47 – 67.63
Resistances: 87.23 – 92.82 – 100.34
DOGE/USDT
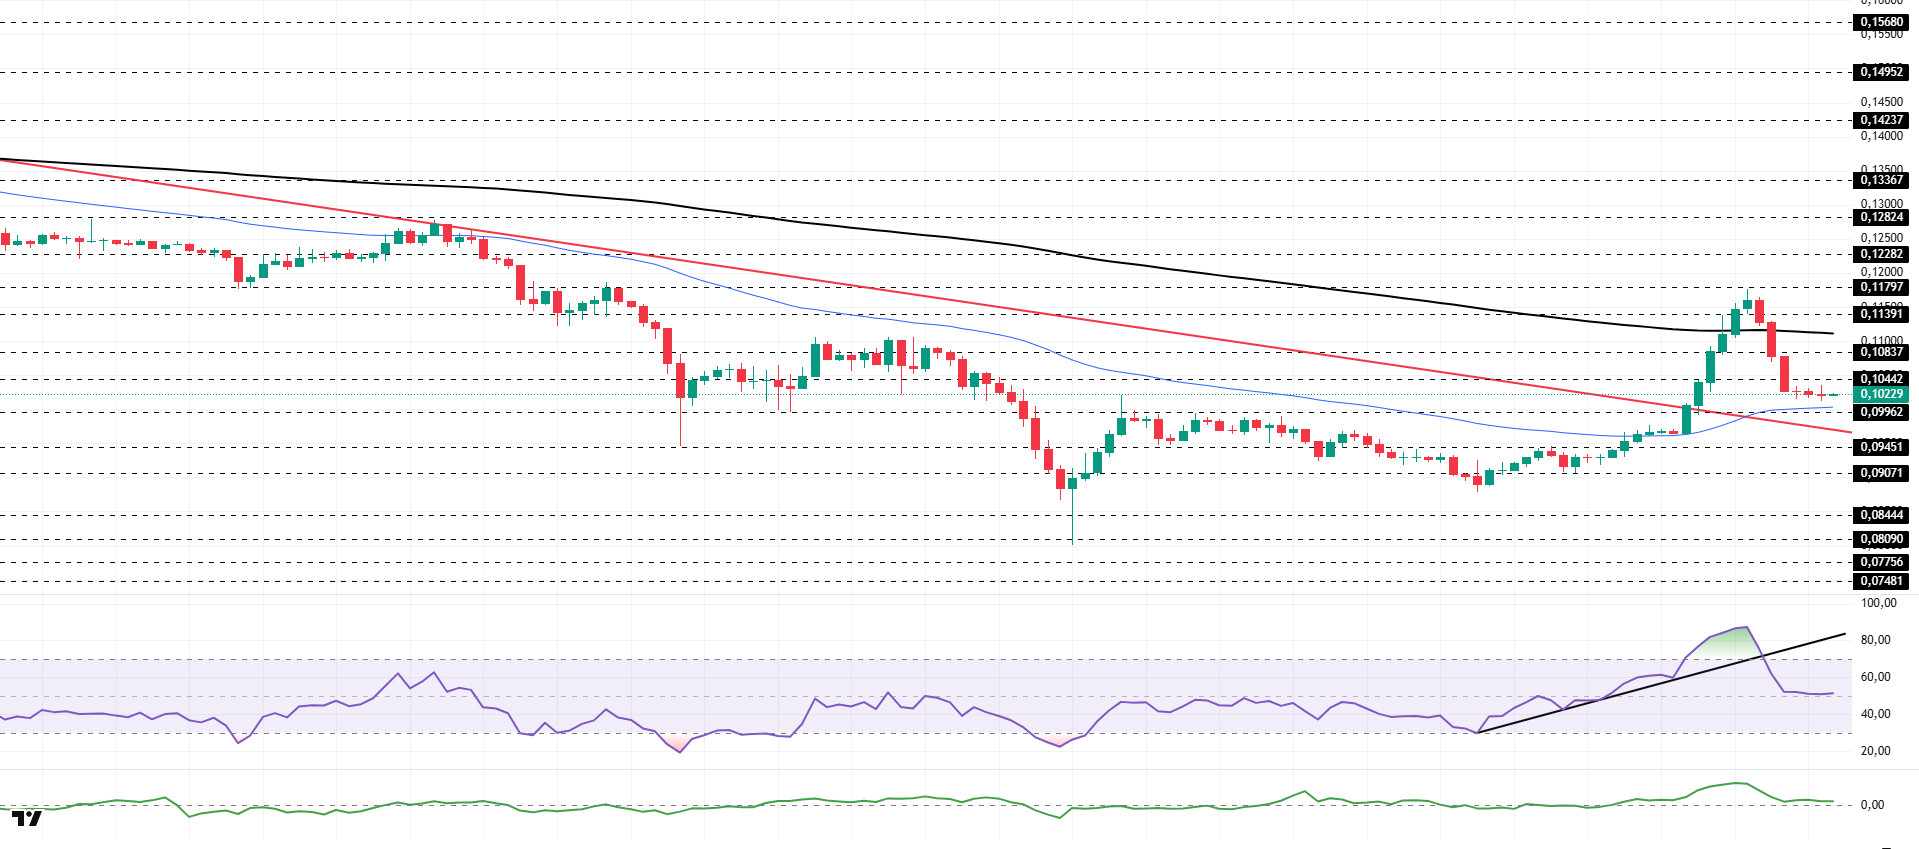
The DOGE price experienced a slight pullback after the rally. The asset moved into the upper region of the downtrend that began on January 14 and managed to hold there. The price, which pulled back from the strong resistance level of $0.11797, continued its decline by breaking below the 200 EMA (Black Line) moving average. Currently testing the 50 EMA (Blue Line) moving average as support, the asset may test the downward trend as support in candle closes below the 50 EMA moving average. If it rises from here, the 200 EMA moving average may act as resistance.
On the 4-hour chart, the 50 EMA (Exponential Moving Average – Blue Line) remained below the 200 EMA (Black Line). This indicates a medium-term downtrend. The price being between the two moving averages suggests that the price is in a decision phase in the short term. The Chaikin Money Flow (CMF-20) is in positive territory. Additionally, the increase in money inflows may keep the CMF in positive territory. The Relative Strength Index (RSI-14) has retreated from the overbought zone to neutral levels. At the same time, it crossed below the rising line that began on February 11, signaling that selling pressure may be building. In the event of an uptrend driven by political developments, macroeconomic data, or positive news flow in the DOGE ecosystem, the $0.11797 level stands out as a strong resistance zone. Conversely, in the event of negative news flow, the $0.08090 level could be triggered. A decline to these levels could increase momentum and initiate a new wave of growth.
Supports: 0.09962 – 0.09451 – 0.09071
Resistances: 0.10442 – 0.10837 – 0.11391
SUI/USDT
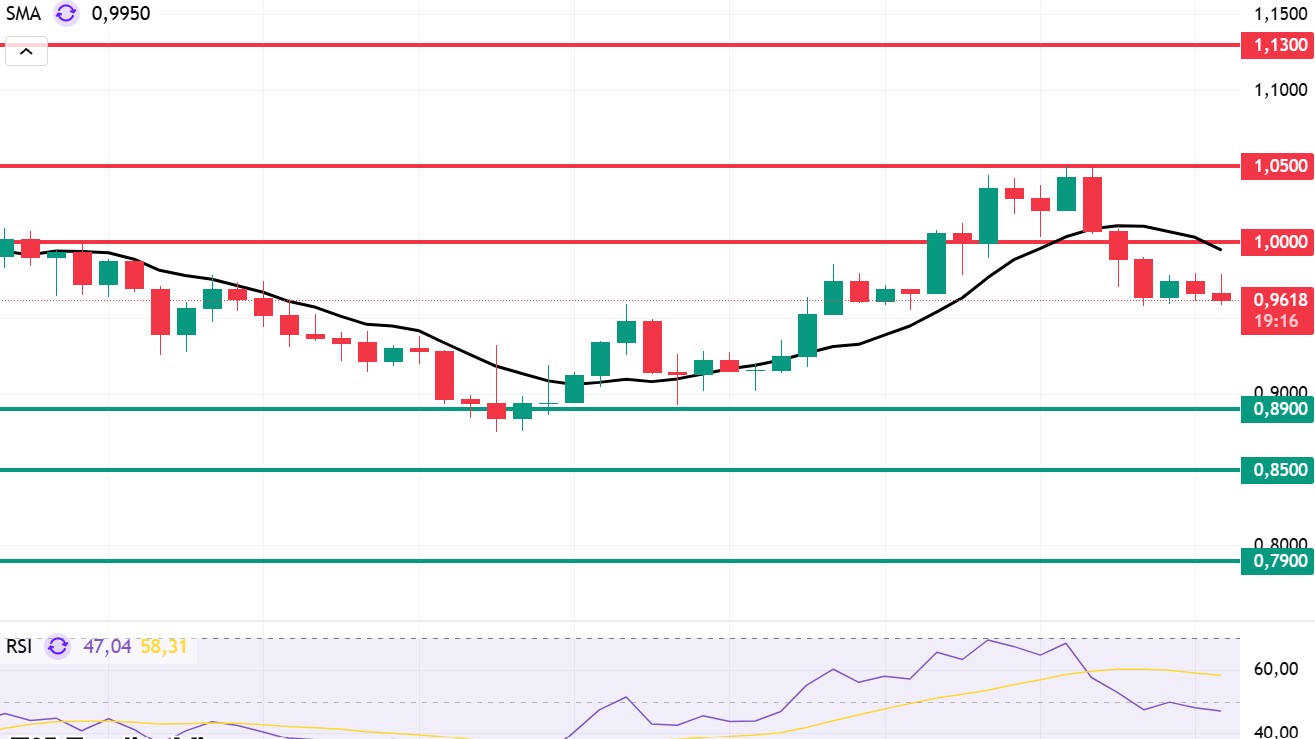
Looking at Sui’s technical outlook, we see that, influenced by fundamental developments, the price has fallen on the 4-hour chart and is now moving sideways around the $0.96 level. The Relative Strength Index (RSI) is currently in the 47.04 – 58.31 range. This range indicates that the market is trading at a point suitable for buying; however, if the RSI weakens and falls to the 35.00 – 40.00 range, it could signal a potential buying point. If the price moves upward, the resistance levels of $1.00, $1.05, and $1.13 can be monitored. However, if the price falls to new lows, it could indicate that selling pressure is intensifying. In this case, the $0.89 and $0.85 levels stand out as strong support zones. Based on the trend line, a pullback to $0.79 appears technically possible. According to Simple Moving Averages (SMA) data, Sui’s average price is currently at $0.99. If the price remains below this level, it could signal that the current upward trend may not continue technically. The downward trend of the SMA also supports this scenario.
Supports: 0.79 – 0.85 – 0.89
Resistances: 1.00 – 1.05 – 1.13
Legal Notice
The investment information, comments, and recommendations contained herein do not constitute investment advice. Investment advisory services are provided individually by authorized institutions taking into account the risk and return preferences of individuals. The comments and recommendations contained herein are of a general nature. These recommendations may not be suitable for your financial situation and risk and return preferences. Therefore, making an investment decision based solely on the information contained herein may not produce results in line with your expectations.

