
BTC/USDT
The Fed minutes indicated that the option of raising interest rates remains on the table if persistent risks to inflation are seen, while reporting that members largely favor keeping rates steady. Markets are pricing in rates remaining unchanged in March, with no rate cuts expected in the short term. On the geopolitical front, news that military options against Iran were presented to Trump and the EU’s announcement that it would respond to potential US tariffs increased risk premiums. Meanwhile, a crypto stablecoin meeting is scheduled to take place tomorrow.
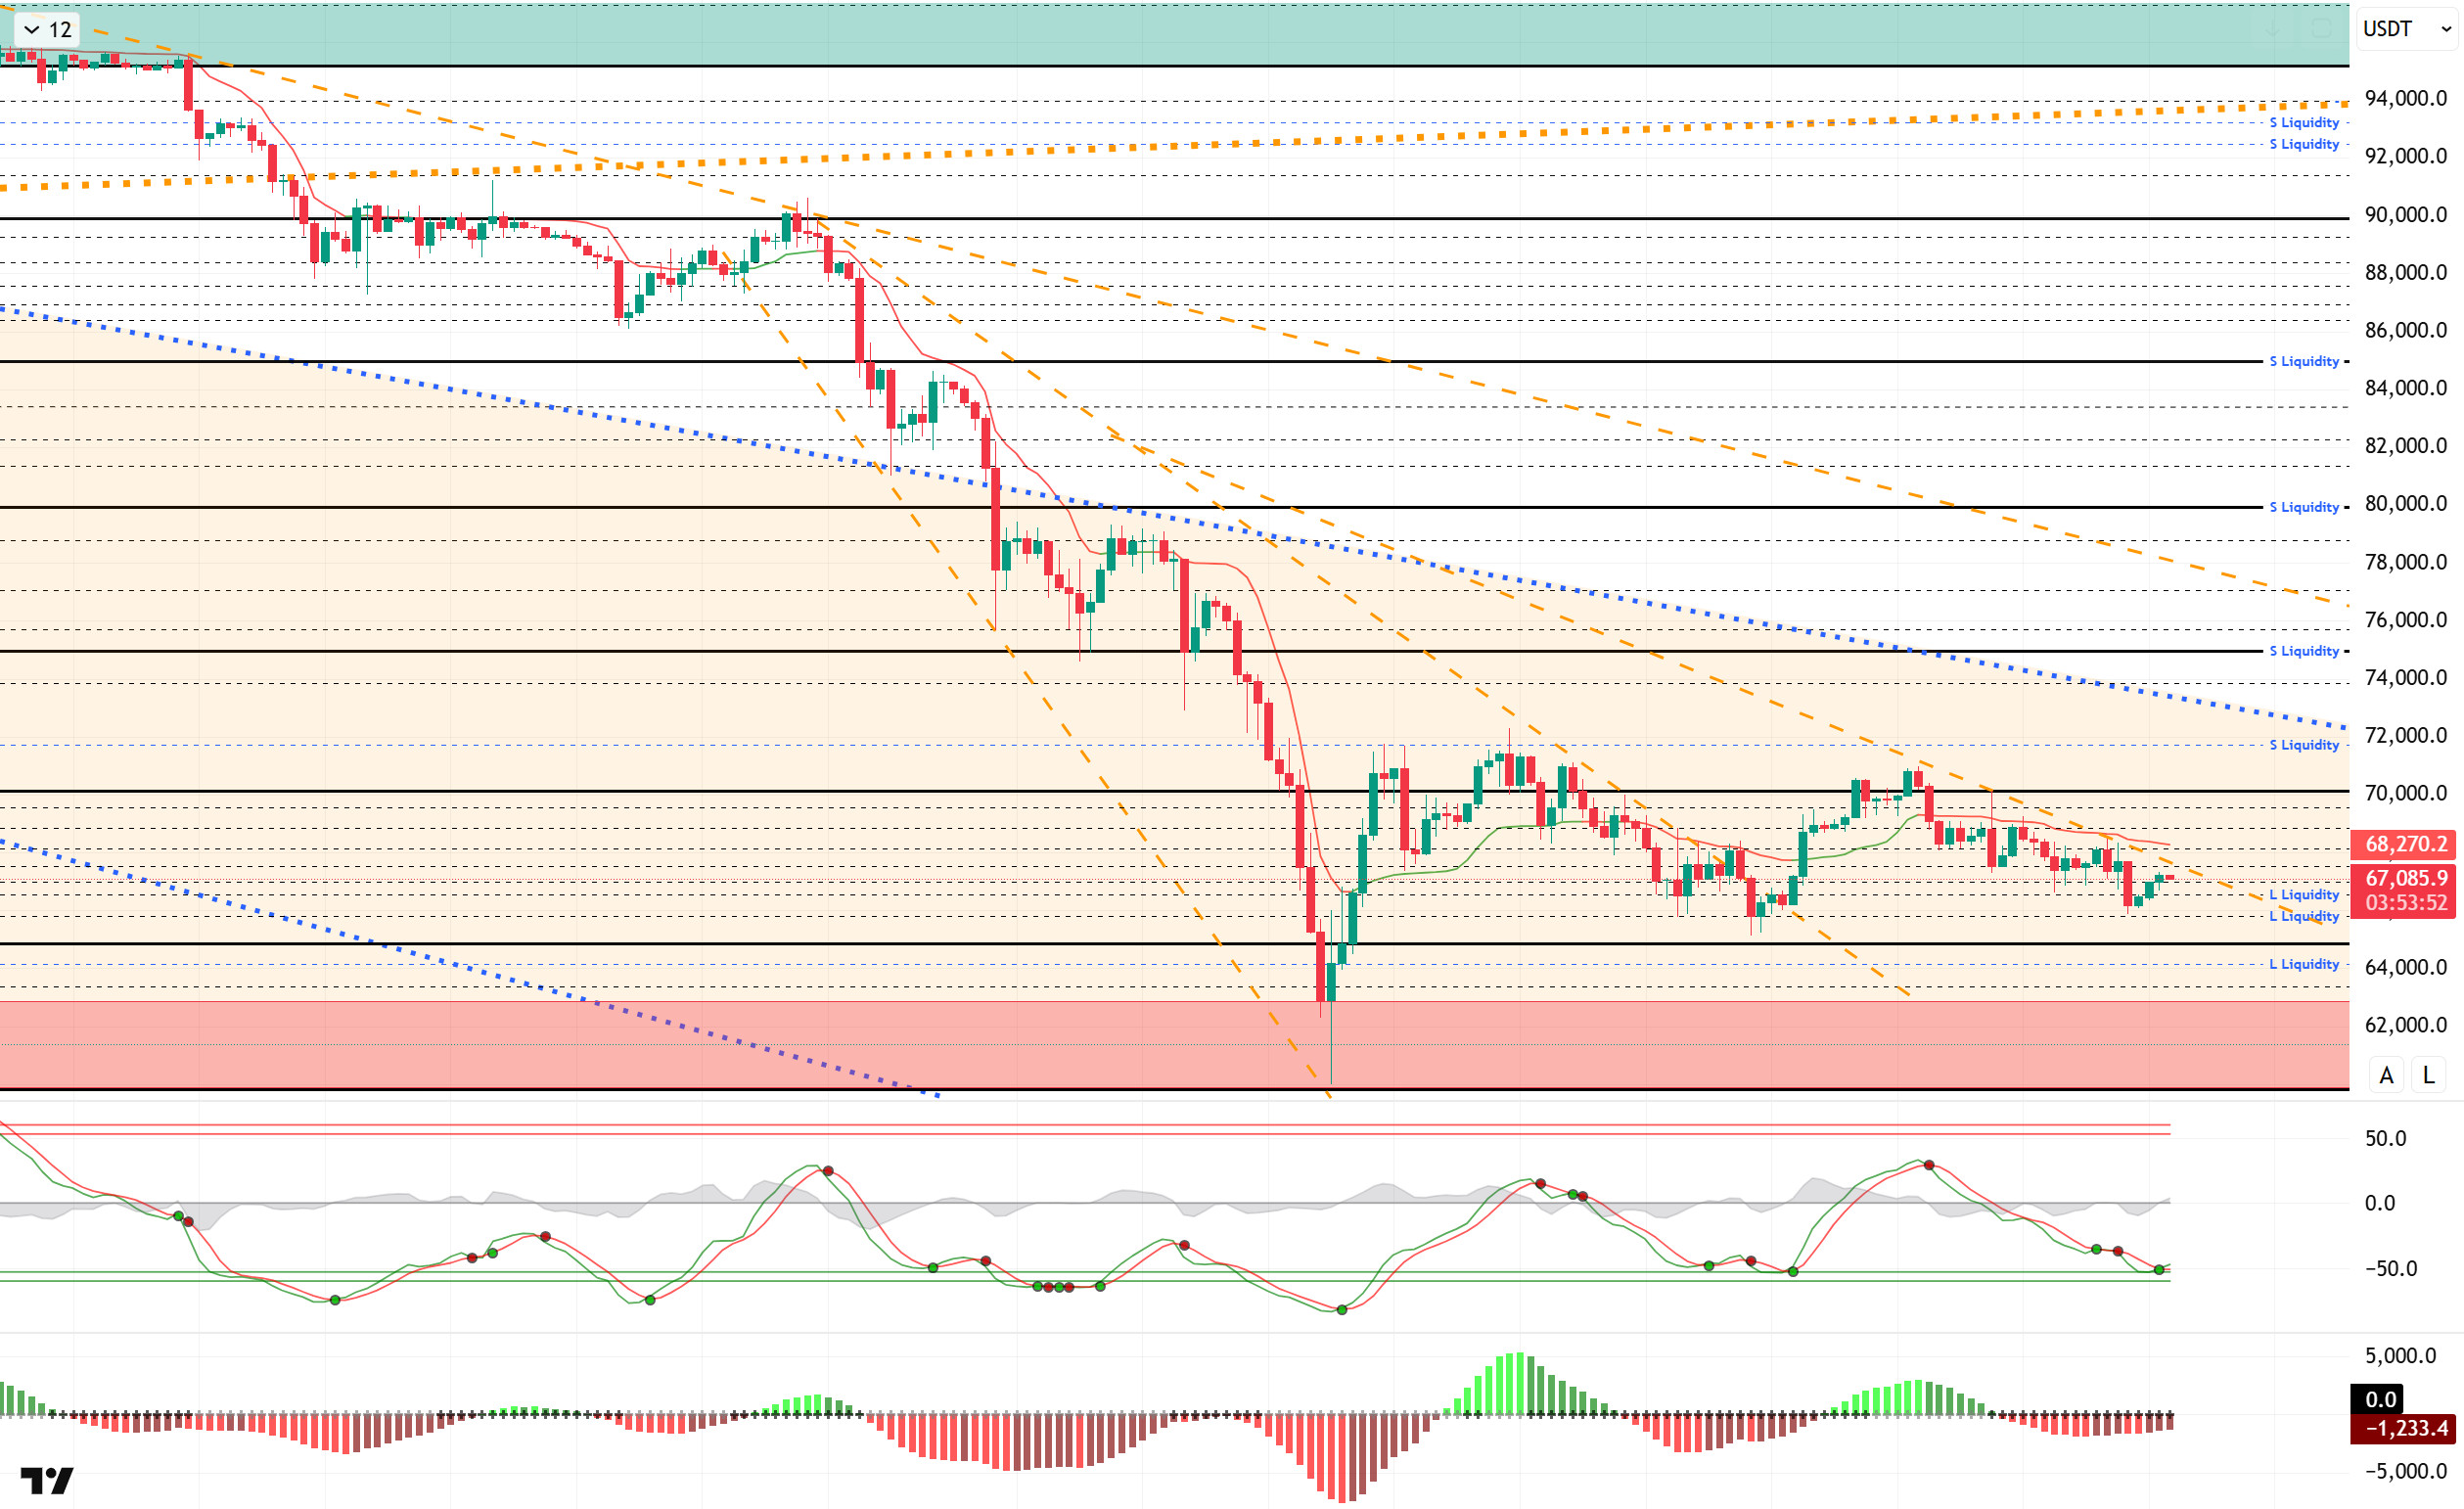
From a technical perspective, BTC lost its symmetrical triangle formation and formed a horizontal pattern within a minor downtrend in the short term. After testing the 68,200 level several times in previous analyses without breaking through, the price reversed direction and fell to the 66,000 level. Subsequently, the price recovered from this point and continued to trade above 67,000, indicating that the consolidation phase is ongoing. As the price has not yet recorded a clear breakout in terms of direction in the short term, the 67,400 level will be monitored as the breakout point for a minor upward movement.
Technical indicators show the Wave Trend (WT) oscillator has crossed into a buy signal just above the oversold zone. The histogram on the Squeeze Momentum (SM) indicator is attempting to regain momentum in negative territory. The Kaufman Moving Average (KAMA) is currently trading above the price level at $68.318.
When examining liquidation data, the 68,500 – 72,000 band stands out in the short-term selling tier, with the 71,400 level particularly notable as a liquidity area. The buy level resulted in liquidation at the 66,500 level. The next buy level recorded intensity between the 64,000 and 65,800 levels.
In summary, while the Fed minutes maintained a cautious stance on interest rate cuts, the tendency among Fed members to keep rates unchanged increased. The agreement recorded following the US-Iran talks did not last long, and tensions continue with preparations for military operations. While short-term trading levels were targeted in liquidity data, the market saw a slight increase in volume, with long-term sell-side transactions maintaining their intensity. Technically, BTC started the new year with strong momentum but encountered heavy selling pressure after testing the 98,000 level, retreating to 60,000. Following this movement, all monthly closings after September were negative, and BTC, which historically did not close negatively in January and February, continues its negative performance in February. Looking at the current technical structure, after forming a rising bottom at the 65,000 level, the price tested the 70,000 levels. In the next phase, once the consolidation phase is complete, the technical breakouts we mentioned will give us an idea of the direction.
Supports: 66,500 – 65,800 – 65,000
Resistances: 67,400 – 68,200 – 70,000
ETH/USDT
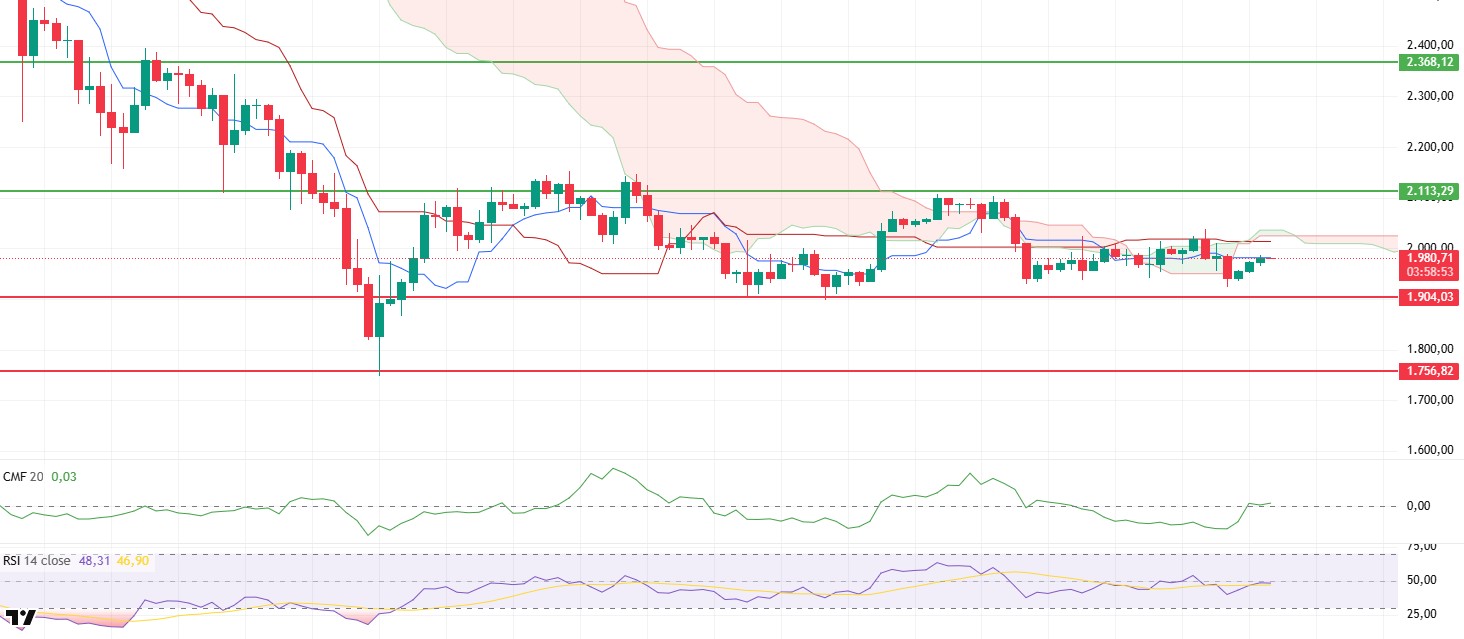
After struggling to break through the upper band of the cloud yesterday, the ETH price retreated under selling pressure and fell to the $1,920 level. With buying interest emerging from this area, the price rebounded to around $1,980 in the morning hours. Recent movements indicate that downward pressure has not completely ended, but buyers are starting to re-enter at lower levels.
A significant improvement in liquidity stands out. The Chaikin Money Flow (CMF) has risen into positive territory, signaling that money inflows into the market are regaining strength. This structure suggests that, despite the recent pullback, buying appetite in the spot market has increased and selling pressure may gradually balance out. This recovery in liquidity is an important factor supporting the short-term outlook.
The positive divergence observed in the Relative Strength Index (RSI) and CCI indicators during the recent decline indicates that the downward movement has lost momentum. The recovery in the RSI has not yet reached the strong trend zone, but it appears that momentum is beginning to recover. This structure supports the possibility of continued upward attempts during the day.
The Ichimoku indicator continues to show a mixed picture. The price’s inability to maintain stability above the kumo cloud raises questions about the main trend. On the other hand, the price holding above the Tenkan level prevents a completely negative picture from forming in the short term. The technical structure is currently far from providing clarity on the direction.
In the overall assessment, the strengthening in the CMF and the positive divergence in the RSI keep the possibility of an upward movement alive during the day. If sustainability above the $2,000 intermediate resistance level can be achieved, the price is expected to find room to move towards the $2,113 region. Conversely, the $1,900 level ( ) remains a critical short-term support, and a break below this region could reignite selling pressure.
Supports: 1,904 – 1,756 – 1,539
Resistances: 2,113 – 2,368 – 2,625
XRP/USDT
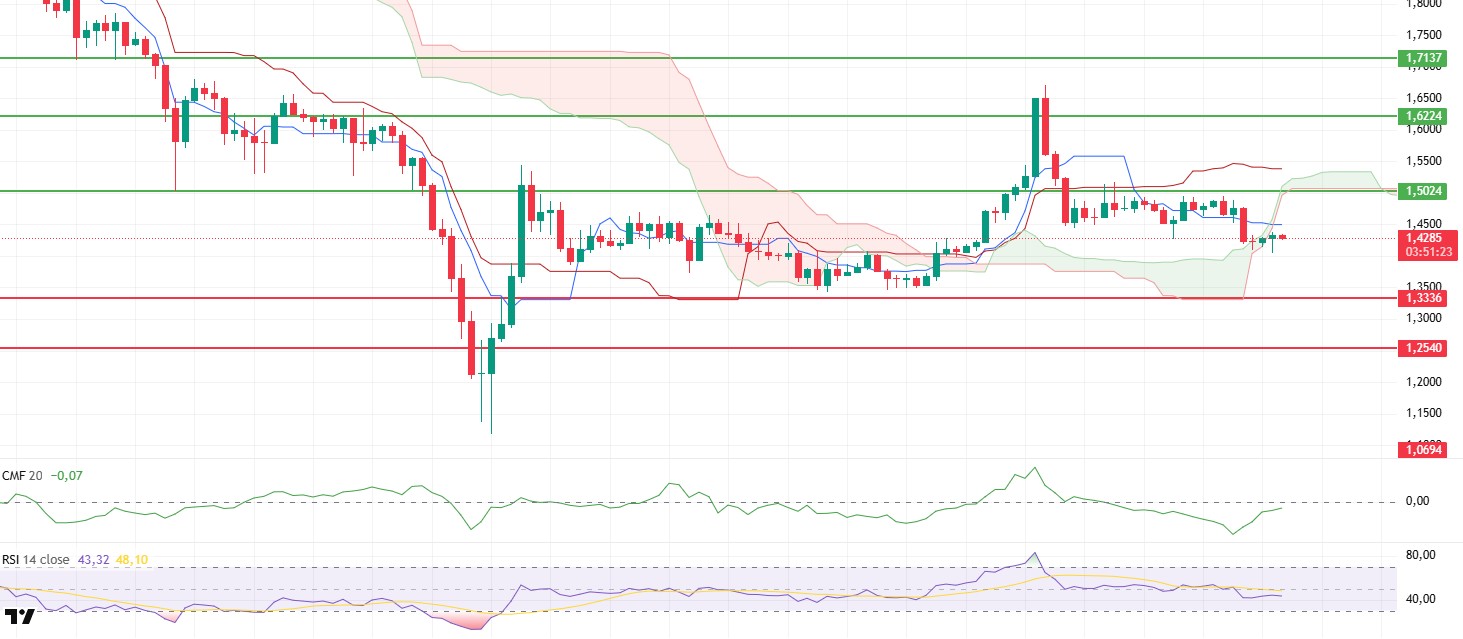
The XRP price retreated under selling pressure after failing to break through the $1.50 resistance level yesterday, falling back to around $1.40. The price, currently attempting to stabilize around $1.42, indicates that buyers have been unable to generate sufficient momentum at this critical resistance zone. This recent movement suggests that upward attempts remain weak for now and that the market is maintaining a cautious outlook.
The weak liquidity structure has not completely disappeared, but there is a noticeable recovery. Although the Chaikin Money Flow (CMF) remains in negative territory, it has increased its upward momentum. This outlook suggests that the outflow of money from the market has slowed and that selling pressure has begun to weaken compared to the previous period. However, it is difficult to speak of a strong and sustained rise until the CMF moves into positive territory.
The Relative Strength Index (RSI) is trading below both the MA and the 50 level. This structure confirms that buyers have not yet generated sufficient momentum and that there has been no significant strengthening on the momentum side. Unless there is a clear recovery on the RSI side, upward attacks are more likely to remain limited.
The technical picture on the Ichimoku indicator has turned negative again. The price retreating below the kumo cloud weakens the short-term outlook and indicates that the main trend remains under downward pressure. This positioning increases the risk of upward attempts facing resistance at resistance levels.
In the overall assessment, the $1.50 level continues to be decisive. As long as this area is not breached, downward pressure is expected to continue throughout the day. On the other hand, if $1.50 is broken with high volume and the recovery on the Chaikin Money Flow (CMF) side continues, upward momentum could regain strength. On the downside, the $1.33 level remains a key support.
Supports: 1.3336– 1.2540 – 1.0694
Resistances: 1.5024 – 1.6224 – 1.7137
SOL/USDT
Falcon Finance launched the SPYx Staking Vault on Solana. 10.18 million SOL (approximately $870 million) exited liquid staking protocols.
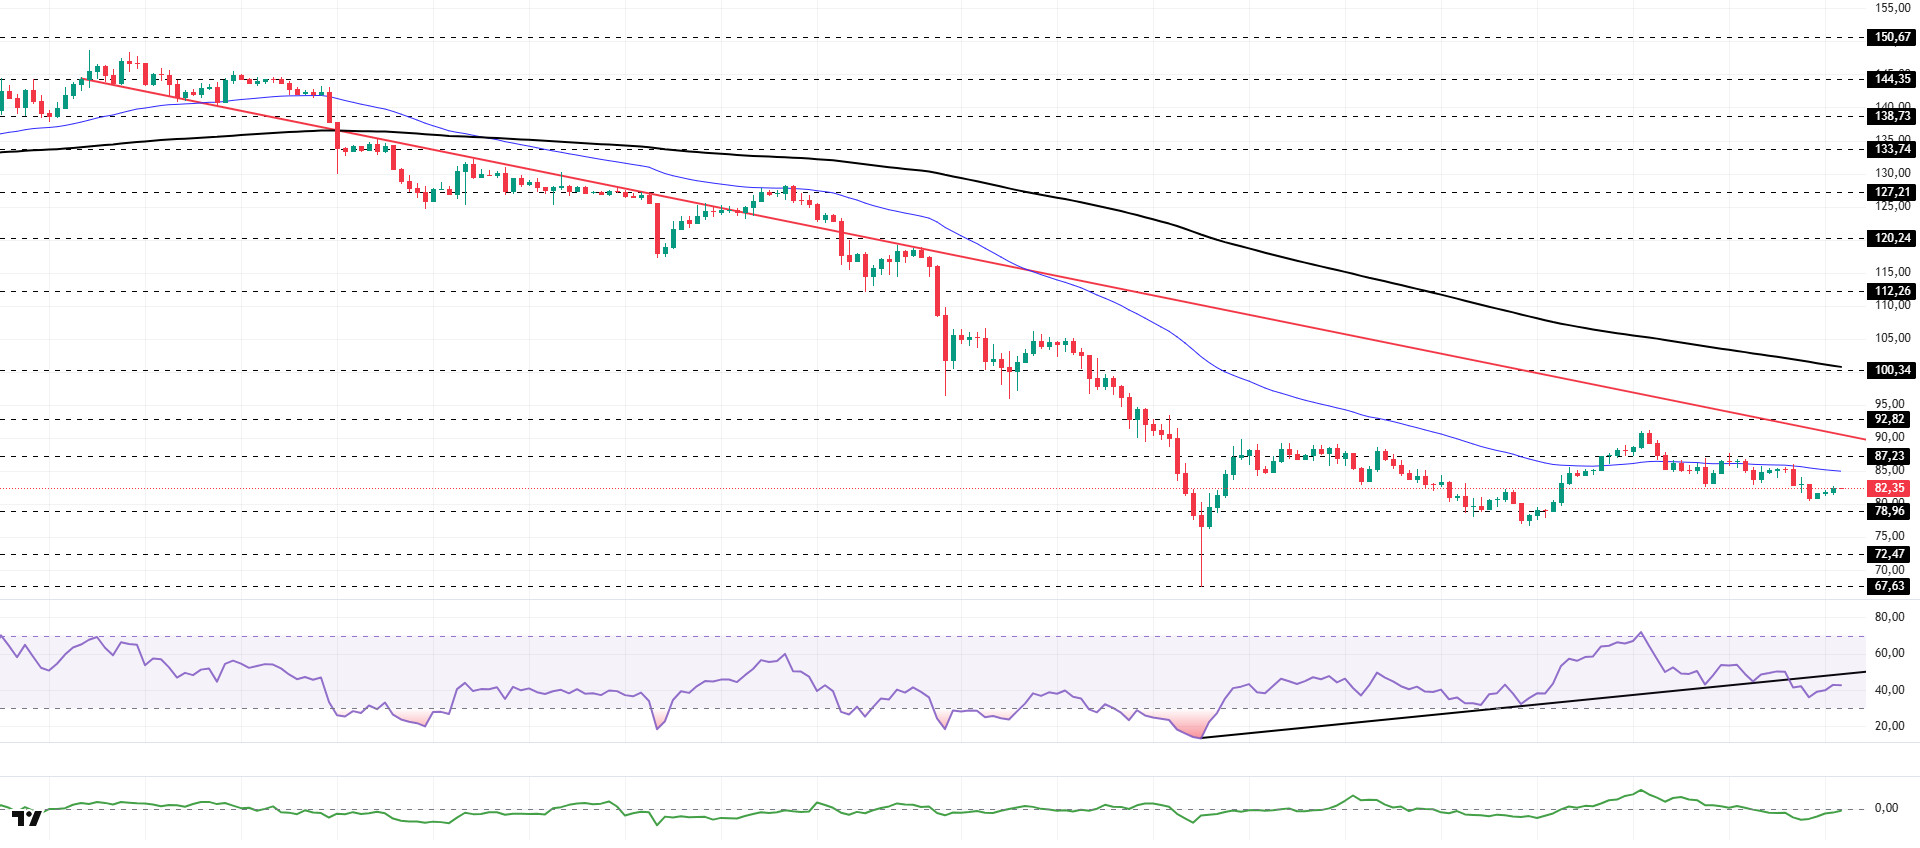
SOL experienced a slight pullback. The asset remained in the lower region of the downtrend that began on January 13, signaling continued selling pressure. Testing the 50 EMA (Blue Line) moving average, a strong support level, as resistance, the asset pulled back from this level and lost value. Currently preparing to test the 50 EMA moving average as resistance again, the price may test the downward trend as resistance if it closes above this level. If the pullback continues, it may test the $78.96 level as support.
On the 4-hour chart, the 50 EMA (Exponential Moving Average – Blue Line) continues to be below the 200 EMA (Black Line). This indicates that the downtrend continues in the medium term. At the same time, the asset trading below both moving averages indicates that the asset is trending downward in the short term. The Chaikin Money Flow (CMF-20) remained in negative territory. However, the balance of money inflows and outflows may keep the CMF in negative territory. The Relative Strength Index (RSI-14) moved into negative territory. At the same time, it broke below the upward trend that began on February 6, signaling that selling pressure may increase. If there is an upturn due to macroeconomic data or positive news related to the Solana ecosystem, the $100.34 level stands out as a strong resistance point. If this level is broken upwards, the uptrend is expected to continue. If pullbacks occur due to developments in the opposite direction or profit-taking, it may test the $67.63 level. A decline to these support levels could increase buying momentum, presenting a potential upside opportunity.
Supports: 78.96 – 72.47 – 67.63
Resistances: 87.23 – 92.82 – 100.34
DOGE/USDT
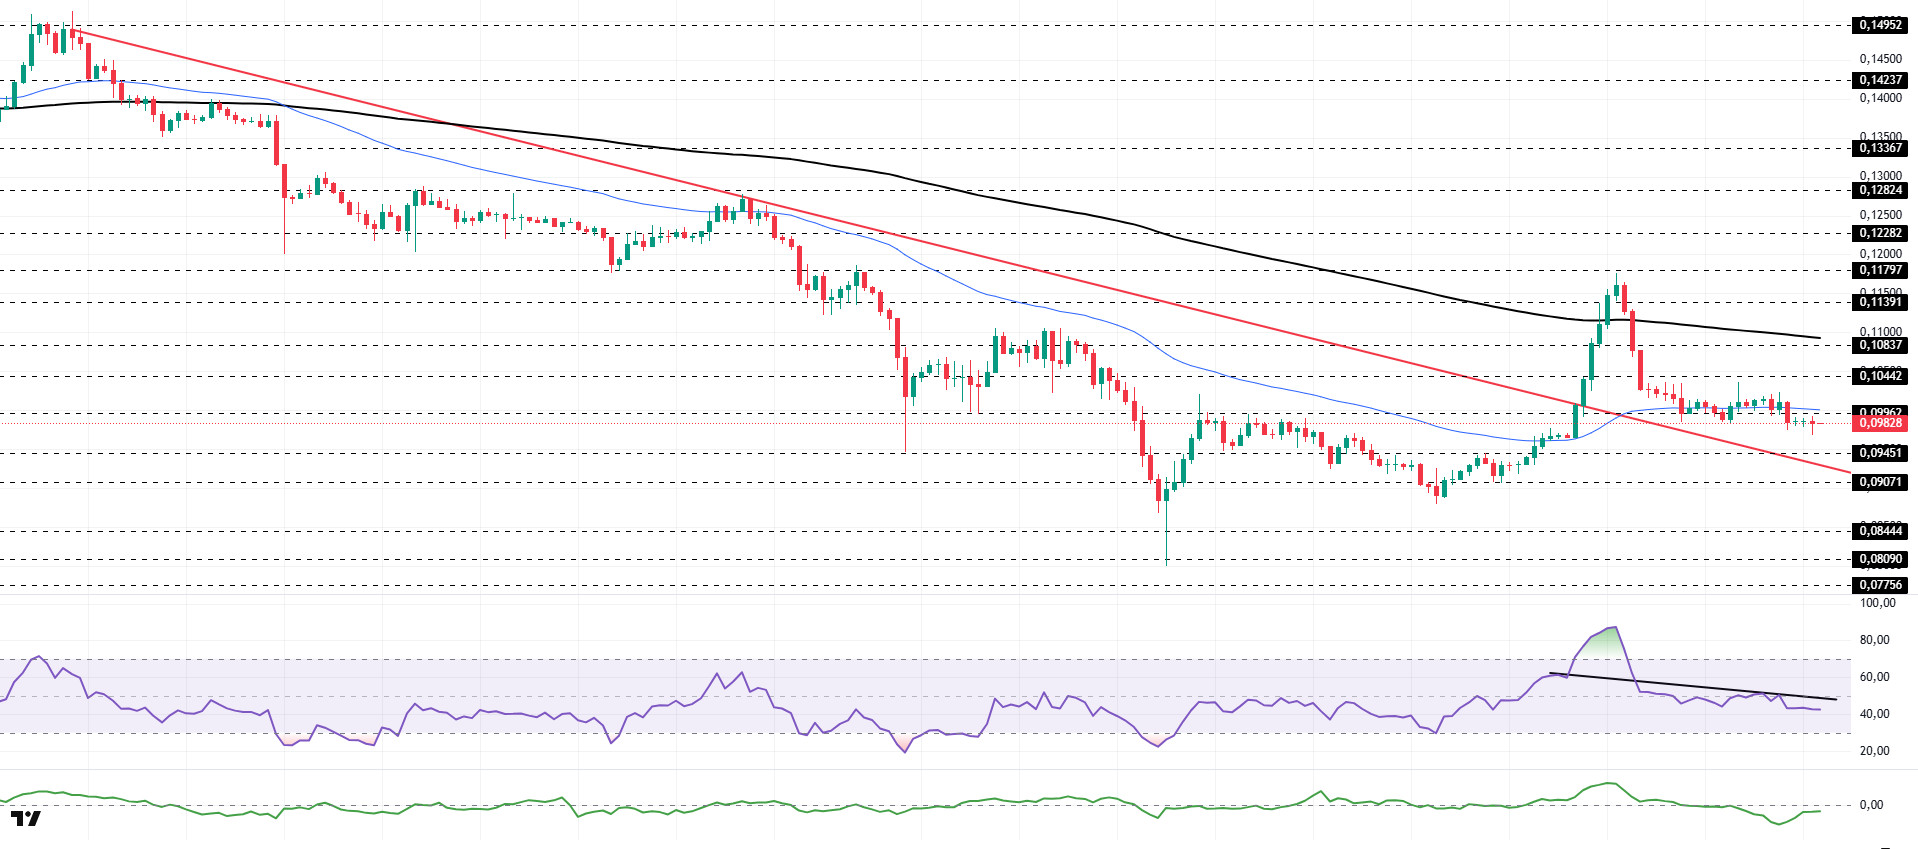
The DOGE price continued to move sideways in a narrow range. The asset remained in the upper region of the downtrend that began on January 14 and managed to hold there. The price, which experienced a pullback from the strong resistance level of $0.11797, deepened its decline by breaking below the 200 EMA (Black Line) moving average. Currently testing the 50 EMA (Blue Line) moving average as resistance, the asset may test the downward trend as support if it fails to close above this level. If it experiences an uptrend, the 200 EMA (Black Line) moving average may act as a resistance level.
On the 4-hour chart, the 50 EMA (Exponential Moving Average – Blue Line) remained below the 200 EMA (Black Line). This indicated that a medium-term downtrend was forming. The price being below both moving averages indicates a downward trend in the short term. The Chaikin Money Flow (CMF-20) remained in negative territory. Additionally, an increase in money outflows could pull the CMF deeper into negative territory. The Relative Strength Index (RSI-14) retreated from neutral levels to the middle of the negative zone. It also remained below the downward trend line that began on February 13. These developments signaled increased selling pressure. In the event of potential increases driven by political developments, macroeconomic data, or positive news flow within the DOGE ecosystem, the $0.11797 level stands out as a strong resistance zone. Conversely, in the event of negative news flow, the $0.08090 level could be triggered. A decline to these levels could increase momentum and potentially initiate a new wave of upward movement.
Supports: 0.09451 – 0.09071 – 0.08444
Resistances: 0.09962 – 0.10442 – 0.10837
SUI/USDT
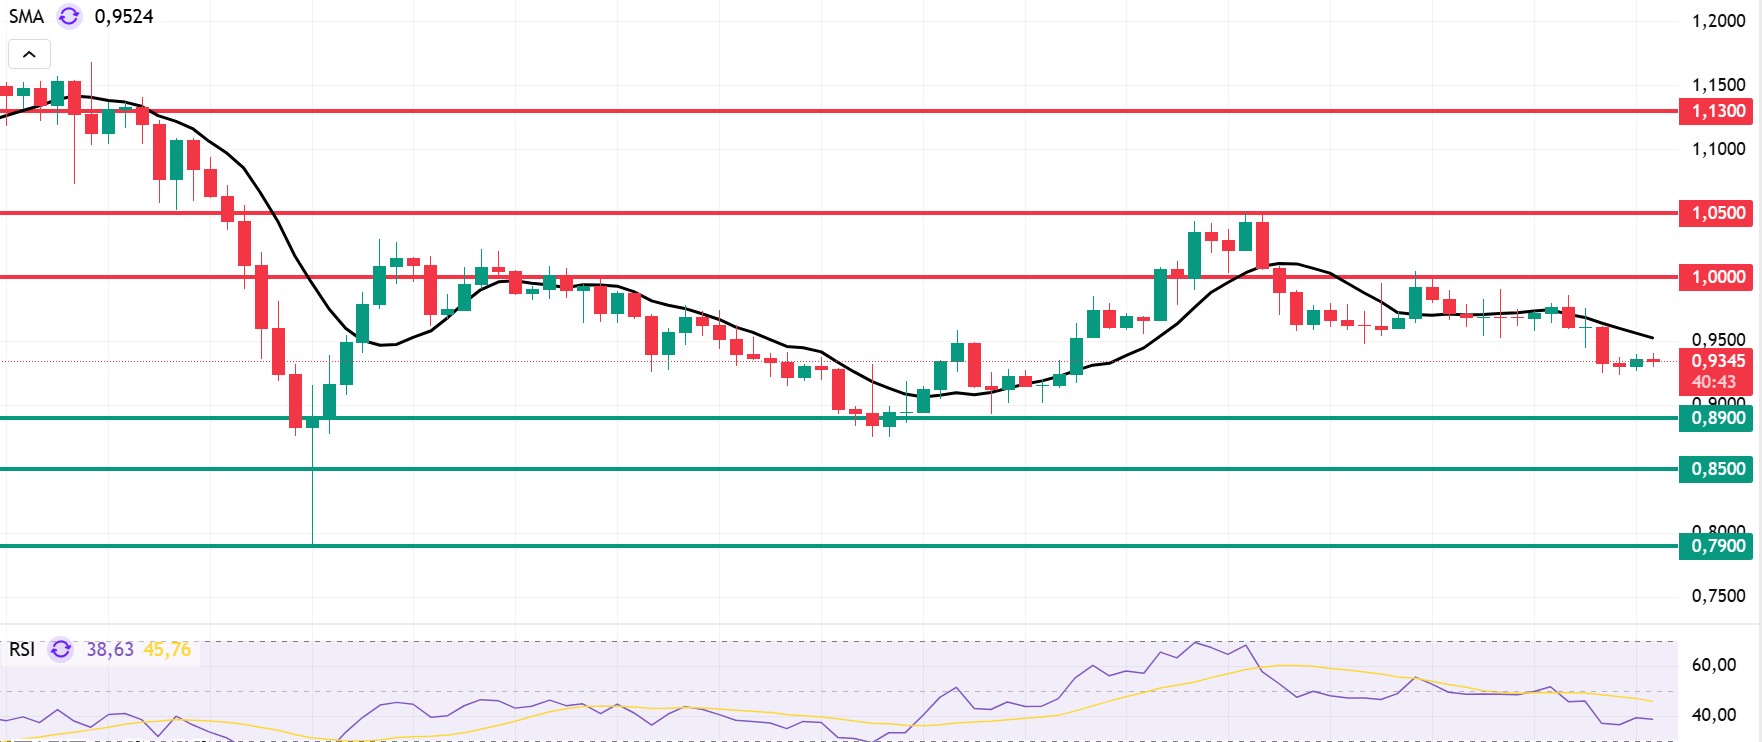
Looking at Sui’s technical outlook, we see that the price has fallen over the past 4 hours and is now moving sideways at around $0.93, influenced by fundamental developments. The Relative Strength Index (RSI) is currently in the range of 38.63 – 45.76. This range indicates that the market is trading at a point suitable for buying; however, if the RSI weakens and falls to the 40.00 – 45.00 range, it could signal a potential buying point. If the price moves upward, the resistance levels of $1.00, $1.05, and $1.13 can be monitored. However, if the price falls to new lows, it may indicate that selling pressure could deepen. In this case, the $0.89 and $0.85 levels stand out as strong support zones. Based on the trend line, a pullback to $0.79 appears technically possible. According to Simple Moving Averages (SMA) data, Sui’s average price is currently at $0.95. If the price remains below this level, it could signal that the current upward trend may not continue technically. The downward trend of the SMA also supports this scenario.
Support levels: $0.79 – $0.85 – $0.89
Resistances: 1.00 – 1.05 – 1.13
Legal Notice
The investment information, comments, and recommendations contained herein do not constitute investment advice. Investment advisory services are provided individually by authorized institutions taking into account the risk and return preferences of individuals. The comments and recommendations contained herein are of a general nature. These recommendations may not be suitable for your financial situation and risk and return preferences. Therefore, making an investment decision based solely on the information contained herein may not produce results in line with your expectations.

