MARKET SUMMARY
Latest Situation in Crypto Assets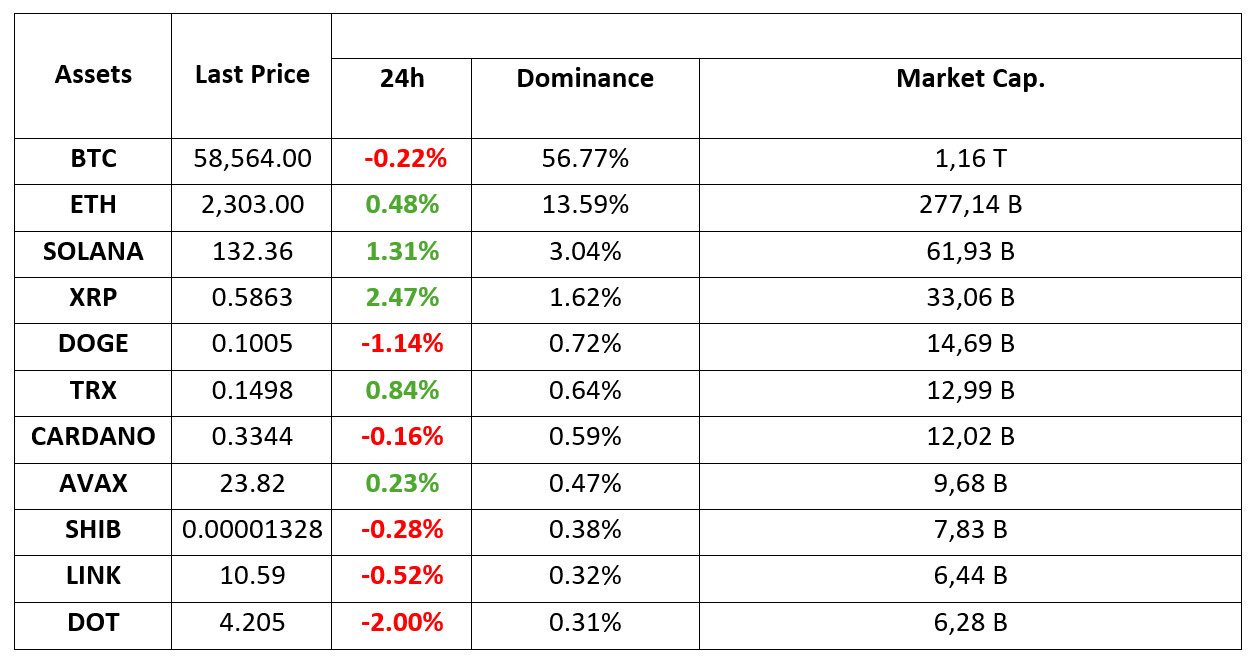
*Prepared on 17.09.2024 at 07:00 (UTC)
WHAT’S LEFT BEHIND
Donald Trump silent on World Liberty Financial
Former President Trump interviewed crypto influencer Farokh Sarmad on X Spaces on September 16, his first public appearance since his apparent assassination attempt on September 15. “We’re going to make our country bigger than ever; you’re going to be happy and you’re going to love your crypto,” he said. While Trump spoke for about 45 minutes, he did not share any information about World Liberty Financial, details of which are already sparse.
MicroStrategy
MicroStrategy announced its third debt offering of 2024, aiming to raise $700 million by issuing convertible senior notes maturing in 2028. The proceeds will be used to pay off $500 million of existing debt and buy more Bitcoin. MicroStrategy currently holds 244,800 BTC.
Interest in US Bitcoin ETFs Increases as Fed Meeting Approaches
Investors revived their interest in Bitcoin exchange-traded funds (ETFs) and other crypto investments last week, coinciding with a key meeting of the Federal Reserve. Jersey-based digital asset manager Coin Shares reported $436 million in inflows into funds with exposure to cryptocurrencies on Monday.
Ripple and SEC Case Ends
Ripple’s long legal battle with the SEC has finally come to an end, and it’s a big win for the cryptocurrency world. The case, which centred on whether XRP was a security, resulted in Ripple paying a reduced penalty of $25 million instead of the original $2 billion.
HIGHLIGHTS OF THE DAY

INFORMATION
*The calendar is based on UTC (Coordinated Universal Time) time zone. The economic calendar content on the relevant page is obtained from reliable news and data providers.
The news in the economic calendar content, the date and time of the announcement of the news, possible changes in the previous, expectations and announced figures are made by the data provider institutions. Darkex cannot be held responsible for possible changes that may arise from similar situations.
MARKET COMPASS
In Focus FED
Global markets are focused on the decisions to be taken by the Federal Open Market Committee (FOMC) at its meeting tomorrow. The meeting will start today and conclude tomorrow evening. While a rate cut is almost certain, expectations for a 50 basis point cut have gained weight.
Earlier; Asian markets are on the positive side except for Japan, while European and US futures are pointing to a flat to mixed opening. The dollar index remains at its levels after falling on the back of rumors of a 50 basis point rate cut from the US Federal Reserve (FED). Gold prices are just below record highs. Digital assets have a similar outlook, with upside reactions generally weak.
Ahead of such a critical development, the ongoing uncertainty about the FOMC’s rate cut decision is pushing investors to remain cautious. The behavior pattern of the markets, which refrain from taking new positions, has an impact on prices.
Important Data Flow Ahead of FOMC
While markets are wondering whether the FED will make a “jumbo” rate cut (larger than 25 basis points), retail sales data will be released today, which could provide insights into the health of the US economy. These figures, which may affect expectations about the dose of interest rate cuts, will be closely monitored as they have the potential to create significant changes in prices.
Retail sales in the US recorded a 1% increase in July compared to the previous month. Core retail sales, which are calculated by excluding automobile sales, pointed to an increase of 0.4% in the same period. In today’s data for August, retail sales are expected to have decreased by 0.2% while core retail sales are expected to have increased by 0.2%.
If the retail sales data comes in above expectations, the dollar may recover some of its recent losses. The reason for this could be that economic activity would indicate some more vitality and this would support expectations that the FED may want to avoid a large interest rate cut. Such a situation could lead to continued pressure on crypto assets. Retail activity that will be below forecasts may reinforce the idea that the FED will be more willing to take steps towards a large interest rate cut. This could lead to continued pressure on the dollar and a reaction in digital assets, albeit weak (as the first impact after the data release).
It would be useful to consider these possible price reactions under the assumption that markets are now fully focused on the size of the Fed’s rate move. On the other hand, data pointing to very poor economic activity has the potential to reignite concerns about a recession. Therefore, this could strengthen risk aversion and have a negative impact on digital assets. In addition, although we say that core retail sales figures may be more influential on prices within the relevant data set, it would be more logical to evaluate the upcoming report as a whole.
TECHNICAL ANALYSIS
BTC/USDT
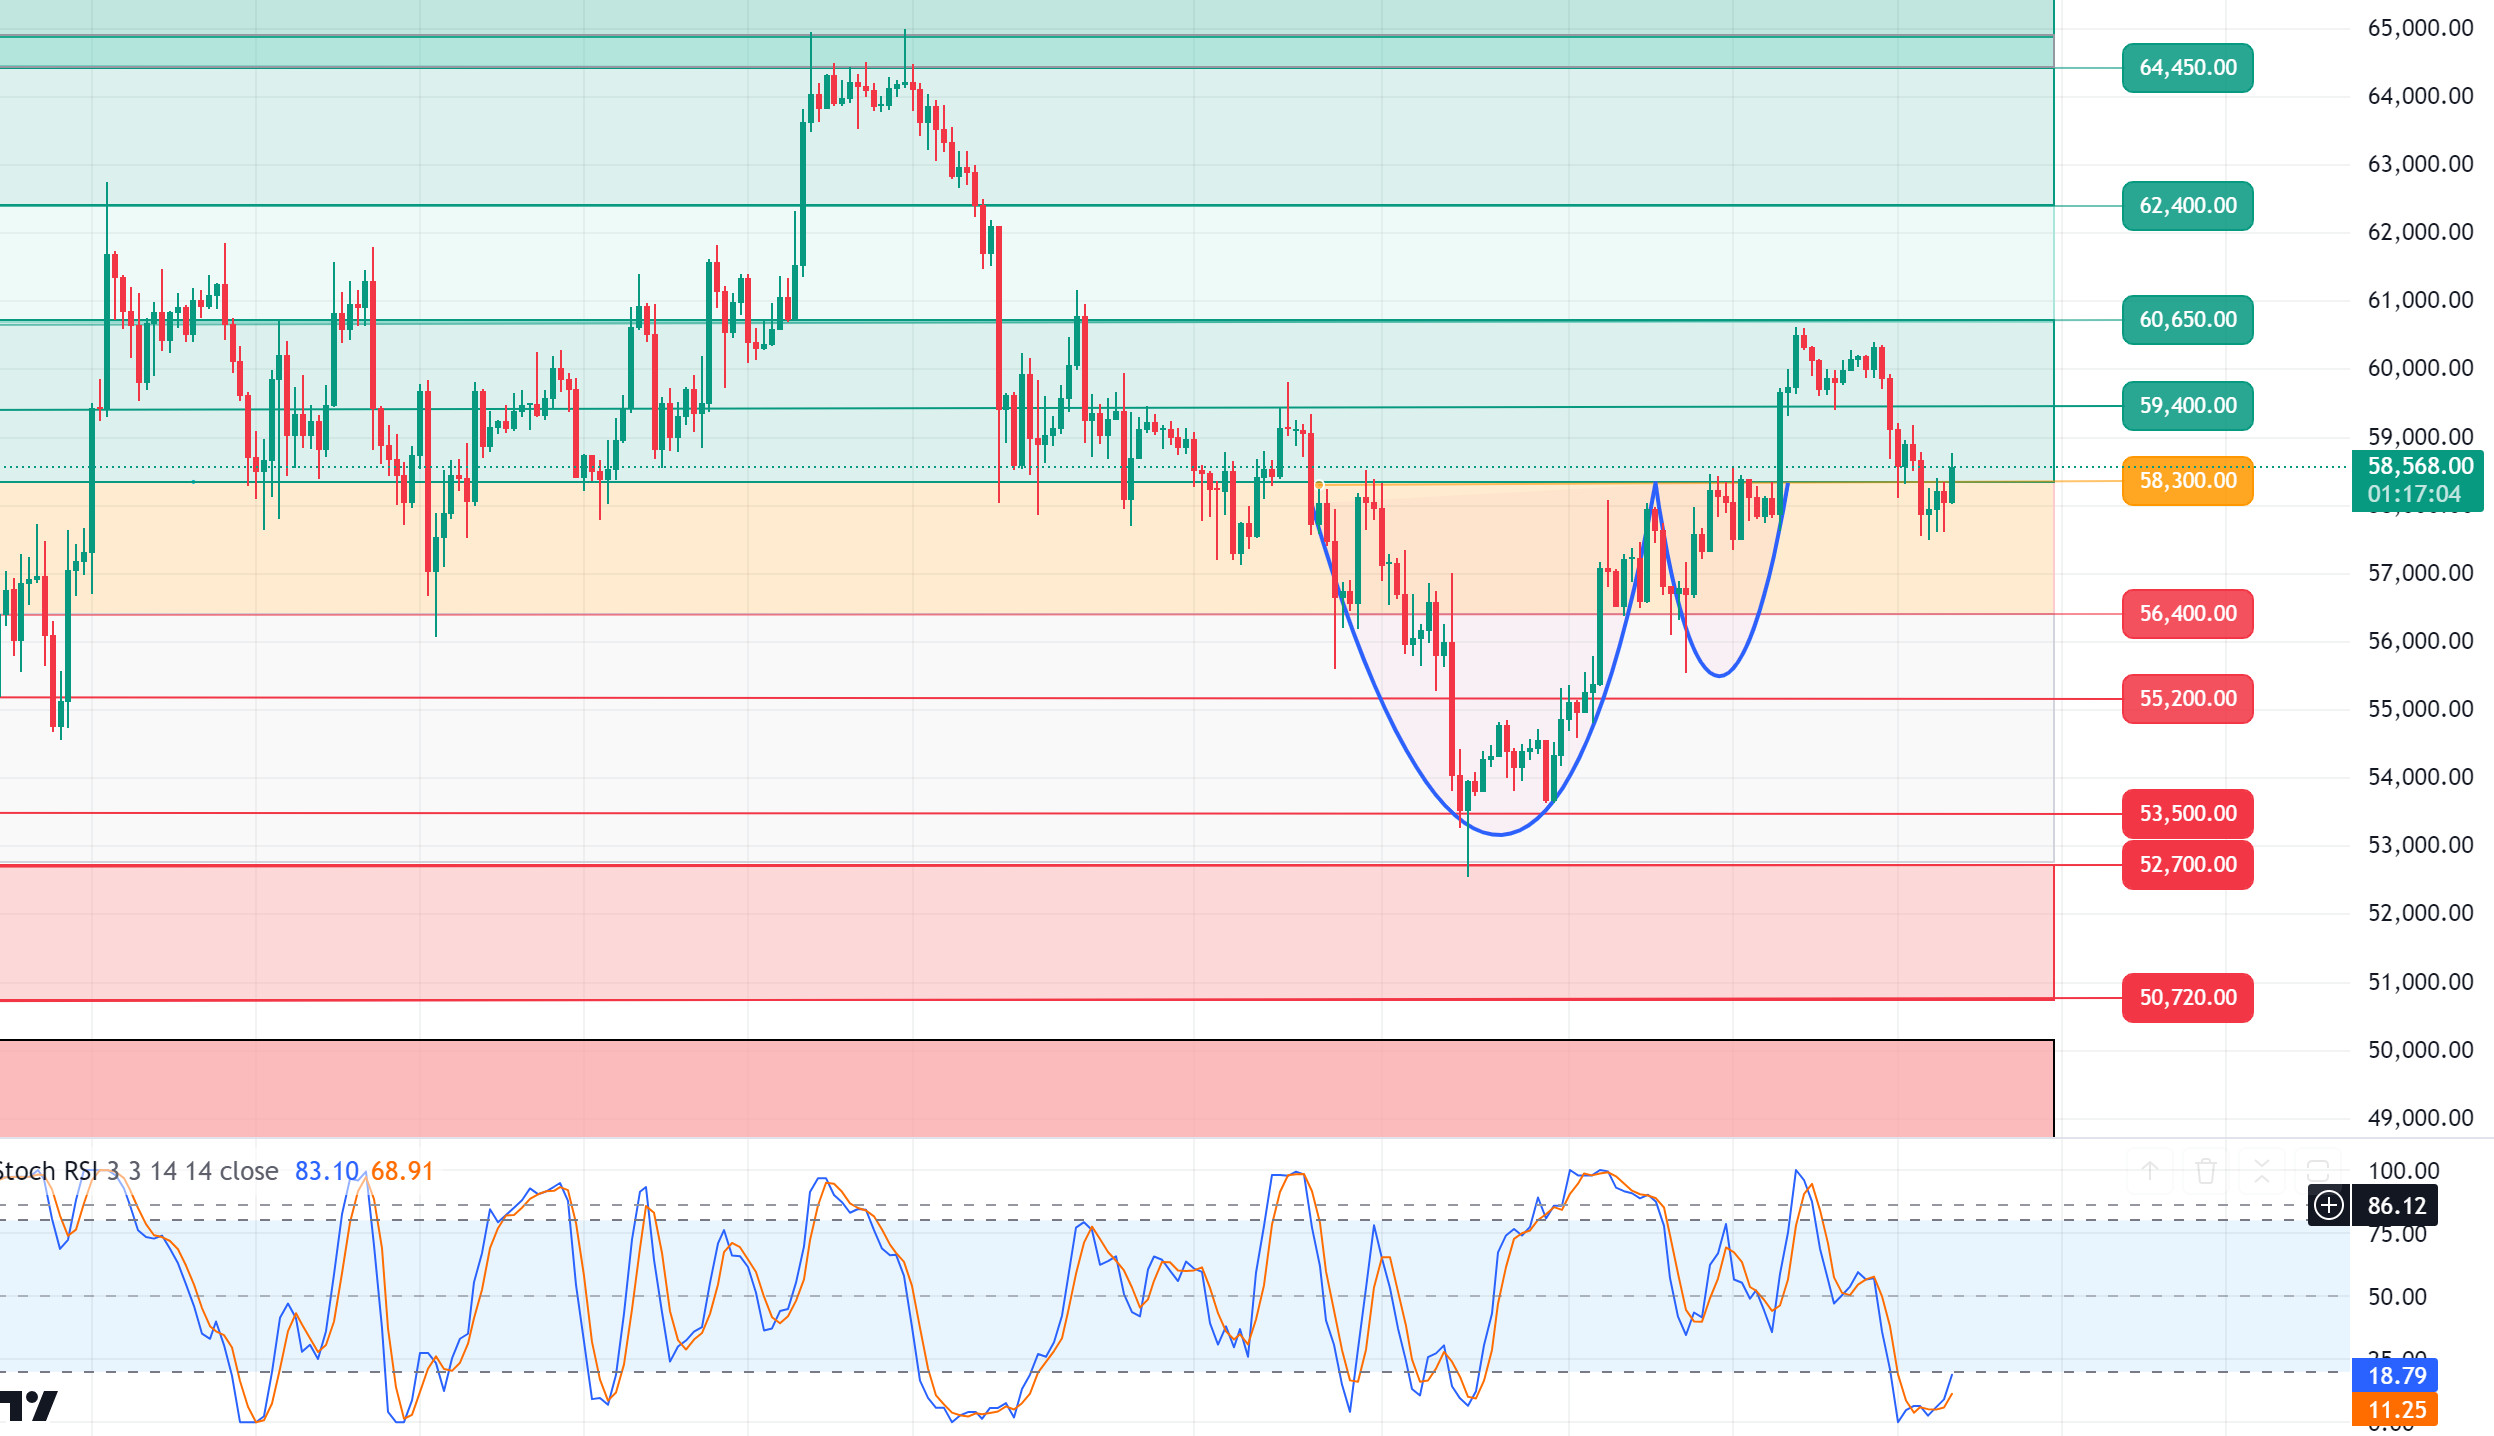
One day before the critical FED meeting! We can say that we have come to the end of the US central bank FED’s 2-year interest rate hike cycle and a period in which there has been no interest rate cut for about 4 years. When we look at the last day before the FED interest rate meeting, speculation continues to increase in the direction of the interest rate cut level. Finally, when we look at the CME group data, we see that the 50 basis point interest rate cut expectation has reached 67%. The Bitcoin price, which is suppressed amid market uncertainty, is fuelled by the uncertainty of slowing economic growth in China. The crisis in China’s housing sector may reach dimensions that will shake global economic balances. The US may mirror market expectations with a steep interest rate cut to support the economy in response to slowing global trade. It may be useful to be cautious against both scenarios before the meeting. As a matter of fact, if 50 basis points are priced in line with market expectations and 25 basis points come in, the negative scenario may materialize. With an interest rate cut within expectations, the upward momentum in the market may strengthen. In BTC 4-hour technical analysis, we see that the price, which exhibits volatile movements, has recovered after falling below the support level of 58,300. Persistence above this level may support the upward movement and the resistance level of 60,650 may be retested as it increases the risk appetite before the interest rate meeting. In case of a pullback, we can say that 4-hour closures below the 58,300 support level may increase selling pressure.
Supports 58,300- 57,200 – 56,400
Resistances 59,400 – 60,650 – 62,400
ETH/USDT
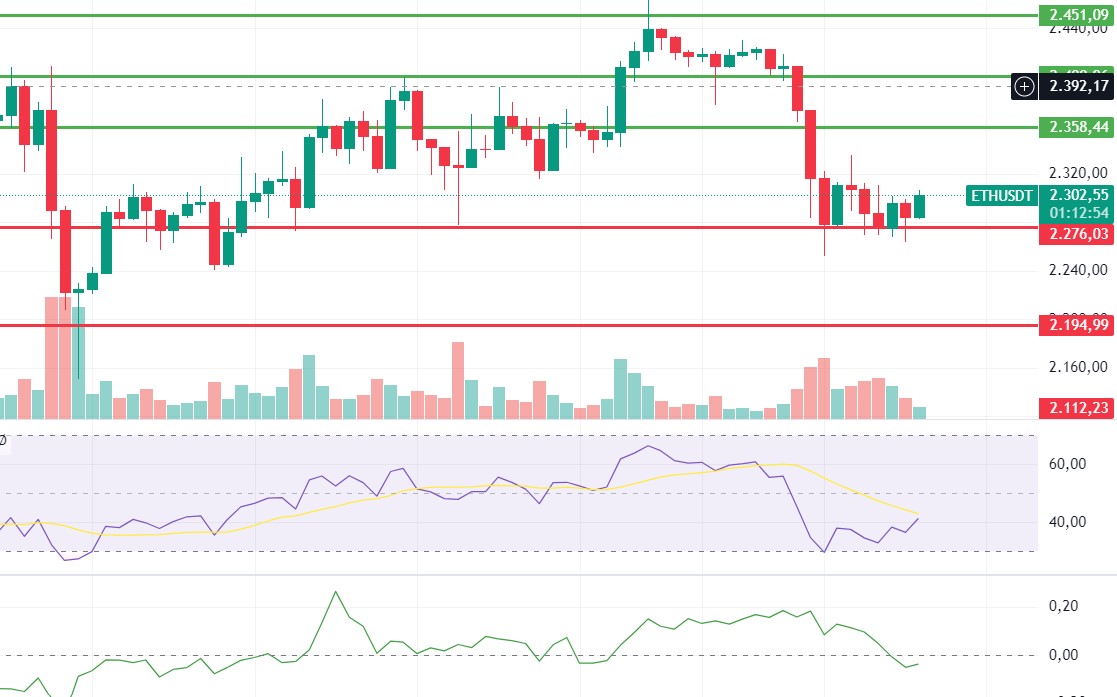
Holding on to the 2,276 support, Ethereum wants to regain the 2,300 level. After the accumulation, positive structures started to form on CMF, OBV and RSI. Looking at CVDs, it is seen that the last rise came from the spot side. In addition, the increase in volume in recent days is also noticeable. For all these reasons, it can be expected to test the 2,358 level again during the day. Exceeding the level may provide a rise up to 2,400. If the 2,276 main support is broken, a decline to 2,194 levels may come.
Supports 2,276 – 2,195 – 2,112
Resistances 2,358 – 2,400 – 2,451
LINK/USDT
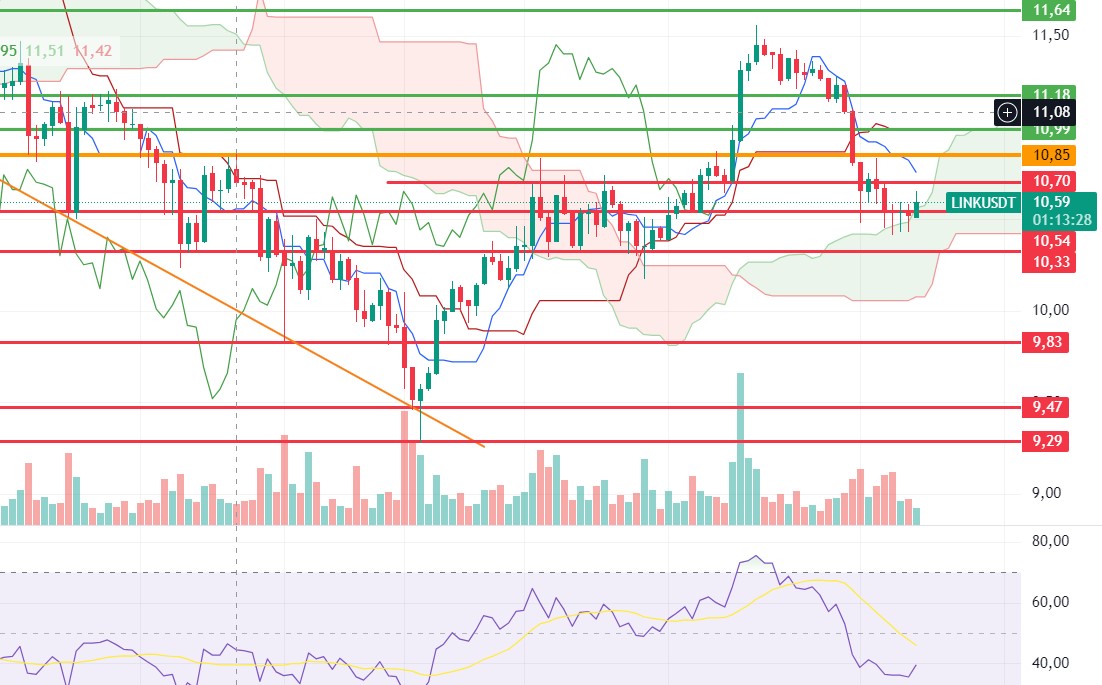
Even though LINK pins below the 10.54 support, it was able to hold the level and eventually rose as high as 10.65. RSI and CCI also have a positive outlook, while the fact that the kumo cloud resistance has been overcome makes it quite positive. A rise to 10.70 levels can be expected during the day. Breaking the 10.70 level may bring 10.85 levels again. Loss of 10.54 support may bring a decline to 10.33 levels.
Supports 10.54 – 10.33 – 9.83
Resistances 10.70 – 10.85 – 10.99
SOL/USDT
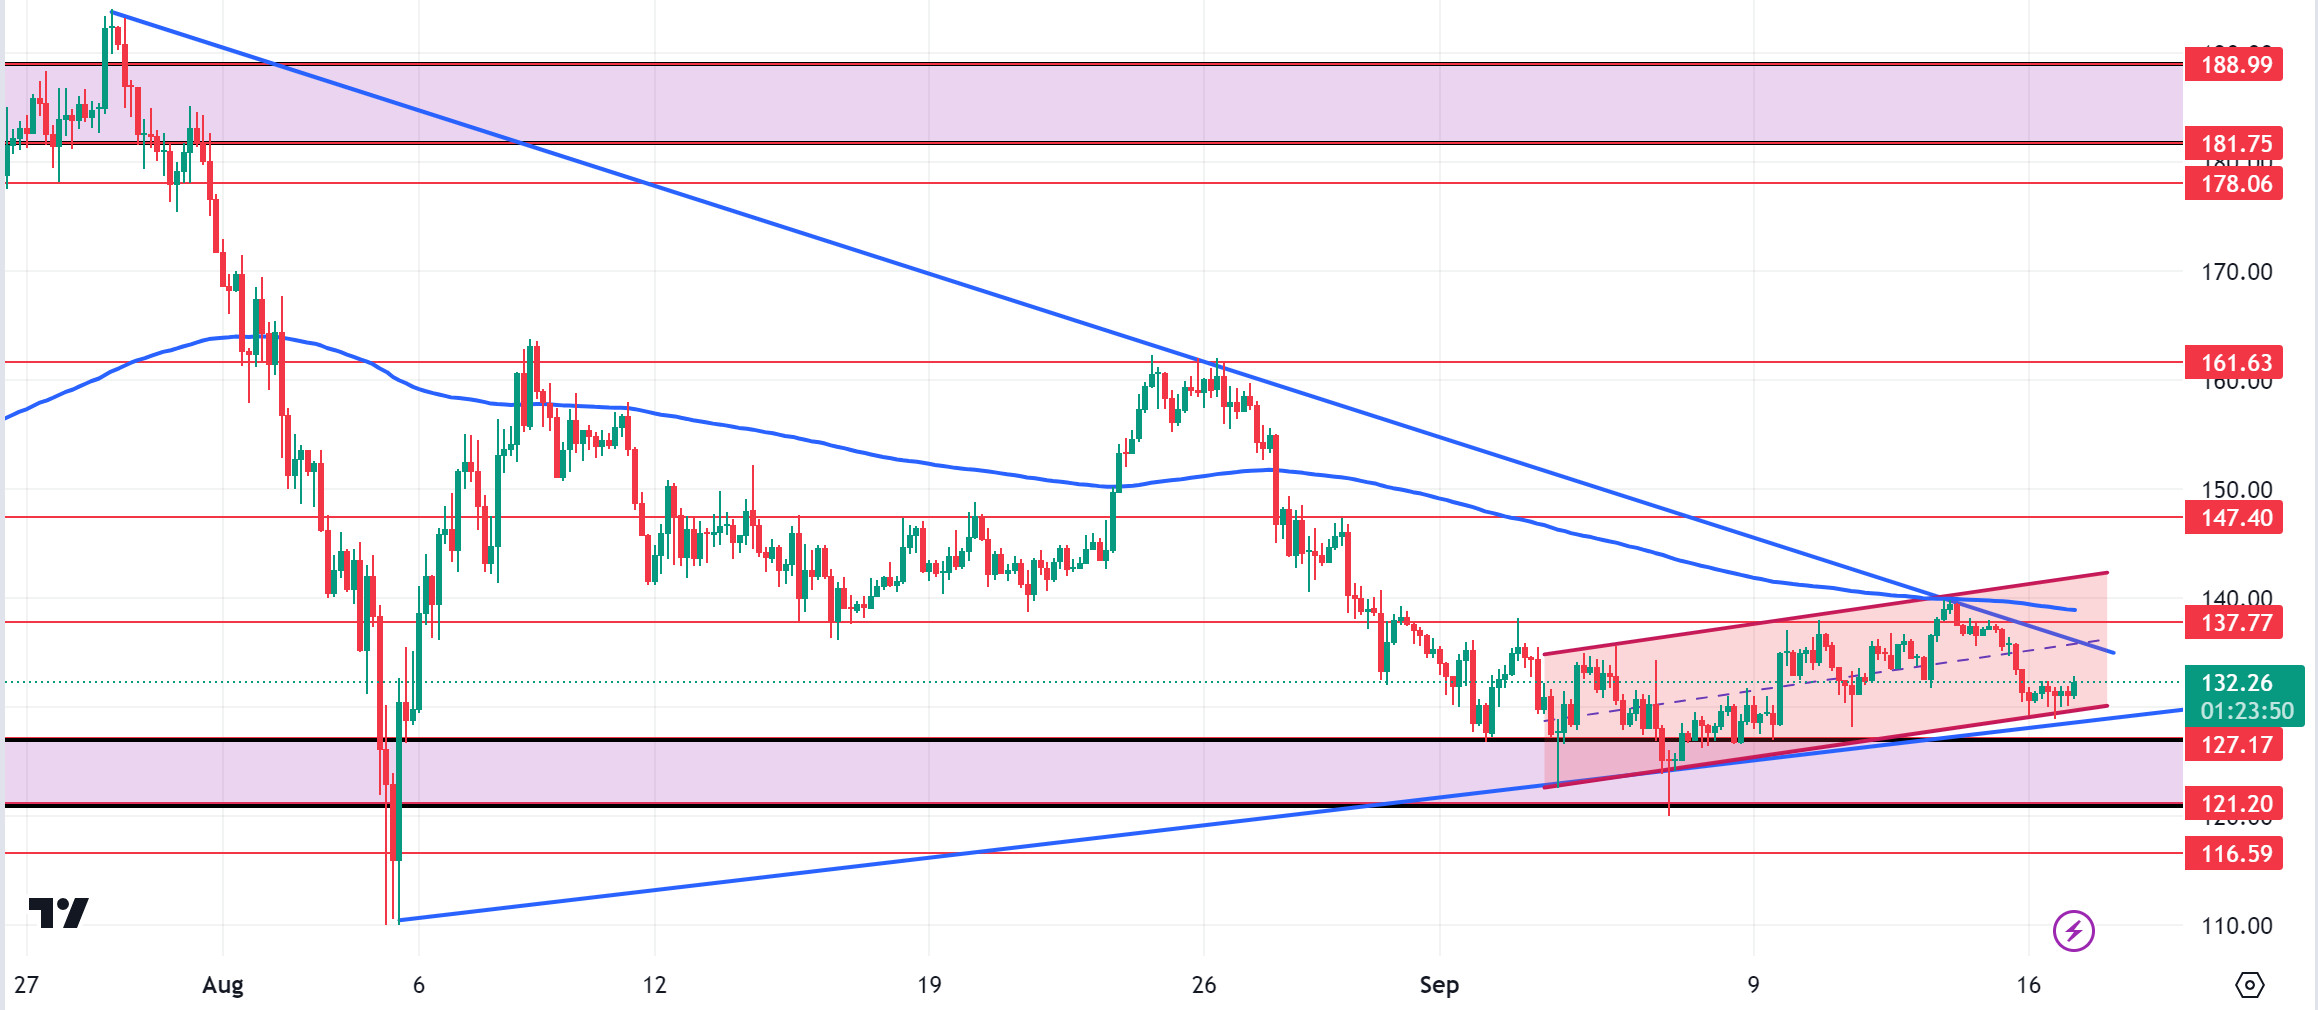
The global cryptocurrency market fell 3.2% to $2 trillion. According to data from the CME, the probability of a 50 basis point rate cut in the US increased to 67%. This could be a bullish harbinger for cryptocurrencies. Retail sales data from the US will be important. In the Solana ecosystem, Graph announced a series of updates. This means that developers on Solana can now index blockchain data at record speeds without writing a single line of Rust code. These upgrades are said to increase Solana’s speed in the growing Web3 ecosystem and reduce costs. On the other hand, as long as it stays above 127.17, upward movement can be followed. We are also coming to the end of the narrowing triangle pattern. At the same time, SOL, which has been rising by taking strength from the support zone of the channel it has formed since September 4, may prepare the ground for upward movement. Both macroeconomic conditions and innovations in the Solana ecosystem appear as resistance levels 137.77 – 142.02. If it rises above these levels, the rise may continue. It should be noted that the price has not yet broken above the 200 EMA. In the event that investors move in the opposite direction due to possible macroeconomic news and the rise in BTC dominance, a potential rise should be followed if it reaches the support levels of 127.17 – 121.20.
Supports 127.17 – 121.20 – 116.59
Resistances 137.77 – 147.40 – 161.63
ADA/USDT
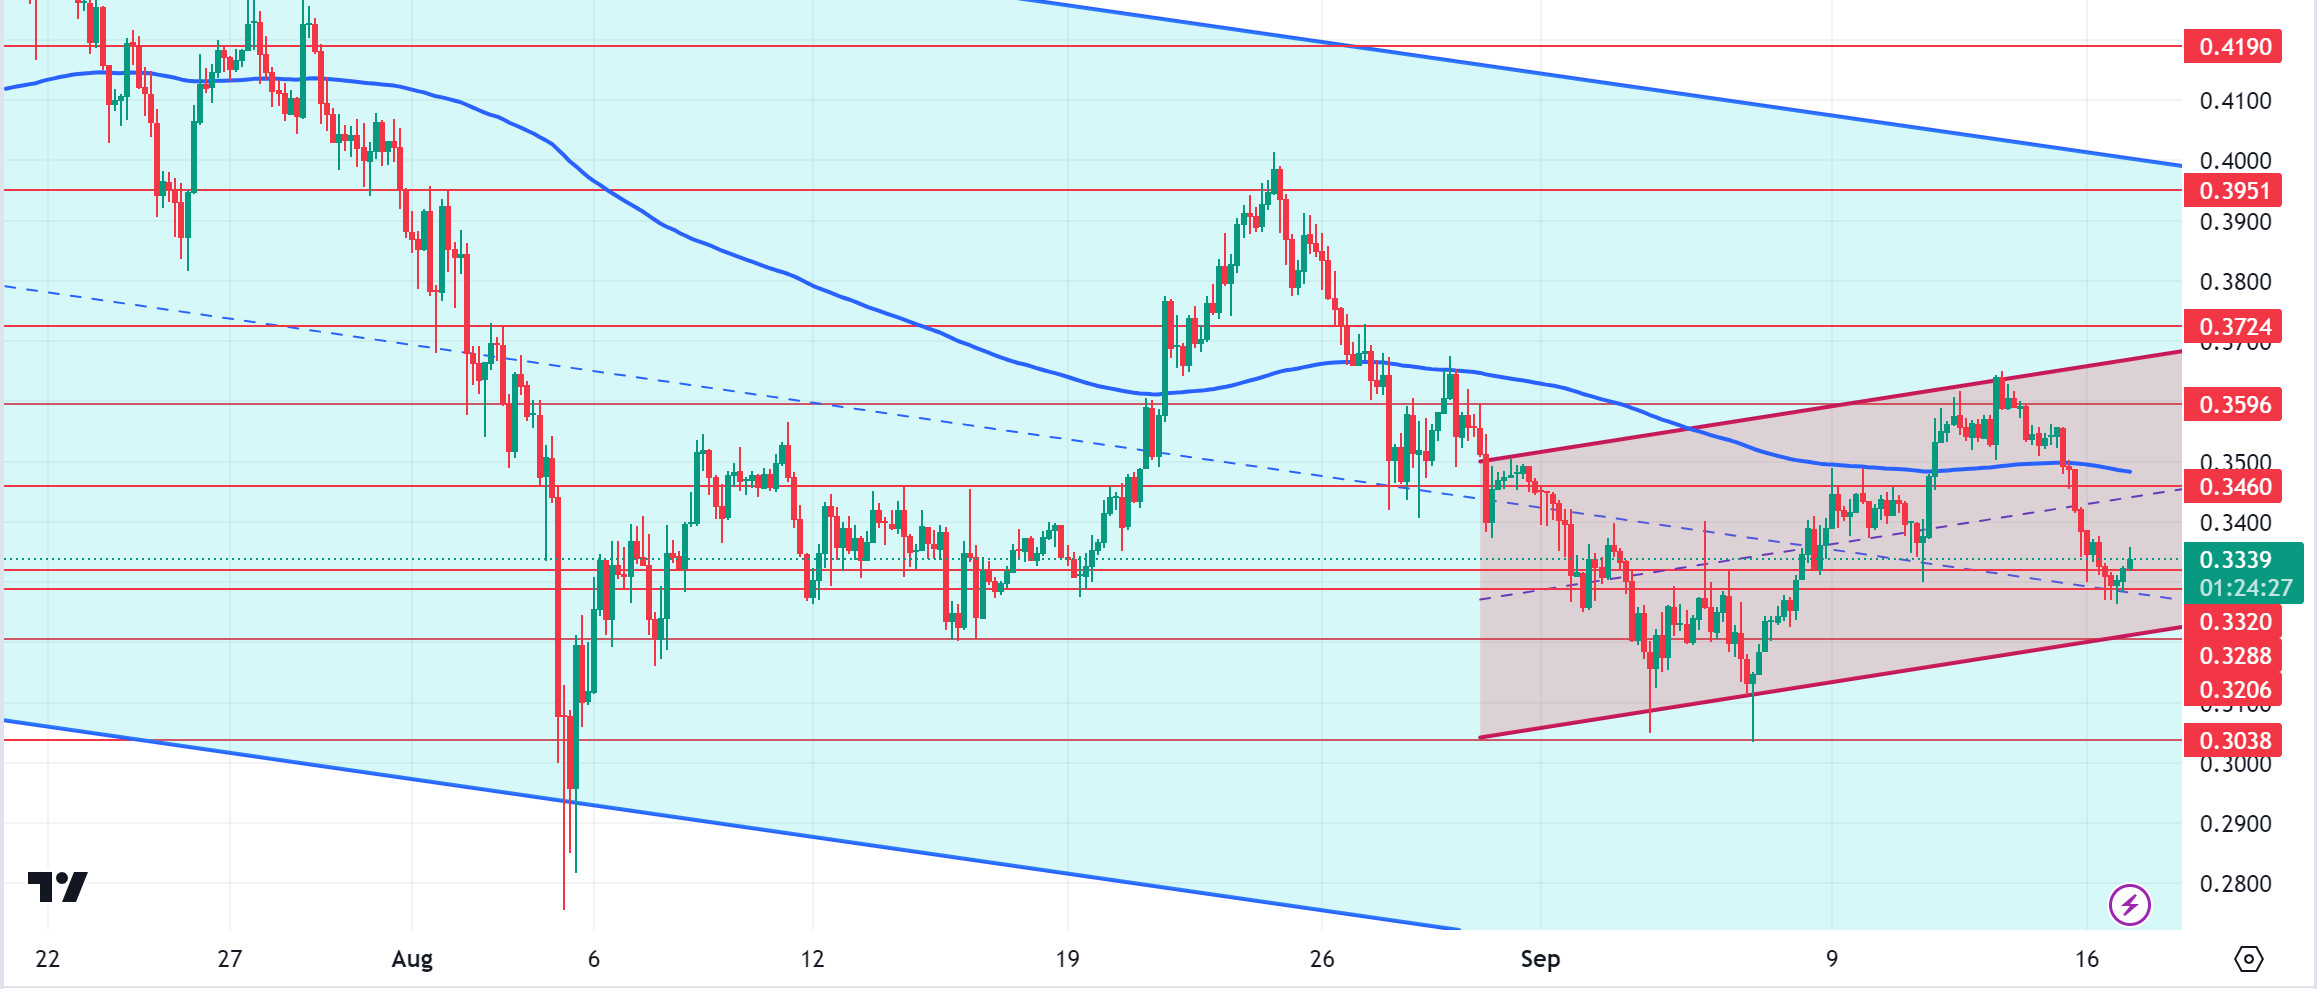
The global cryptocurrency market fell 3.2% to $2 trillion. According to data from CME, the probability of the US rate cut by 50 basis points increased to 67%. Retail sales data from the US will be important. In the Cardano ecosystem, Founder Charles Hoskinson expressed his belief in the benefits of the Leios upgrade to increase speeds in Cardano in his post on the X platform, saying, “This upgrade will be the second major upgrade since the implementation of the Chang hard fork in early September. Technically speaking, Cardano has been pricing in a falling channel for the last five months. It seems to have had difficulty in recovering the losses in July. For ADA, the 0.3288 level may be the bottom of the correction. If the predictions of a 50 basis point interest rate cut in the US start to be priced in, it may test the resistance point of the channel it has formed since September 1. Such a move could take ADA to a target of 0.3724. On the other hand, ADA remains below the EMA200 moving average. This shows that there is still bearish pressure. Despite this, its price is hovering above a critical resistance. 0.3320 is a strong support in case of a pullback due to general market movements. In the event that macroeconomic data raises BTC, 0.3460 – 0.3596 levels can be followed as resistance levels.
Supports 0.3320 – 0.3288 – 0.3206
Resistances 0.3460 – 0.3596 – 0.3724
AVAX/USDT
AVAX, which opened yesterday at 23.80, fell by about 1% during the day and closed the day at 23.52. Today, retail sales data will be released by the US and this data may be perceived negatively by the market as it may trigger fears of recession. Ahead of the FED interest rate decision to be announced tomorrow, we can observe a market without volume and in search of direction.
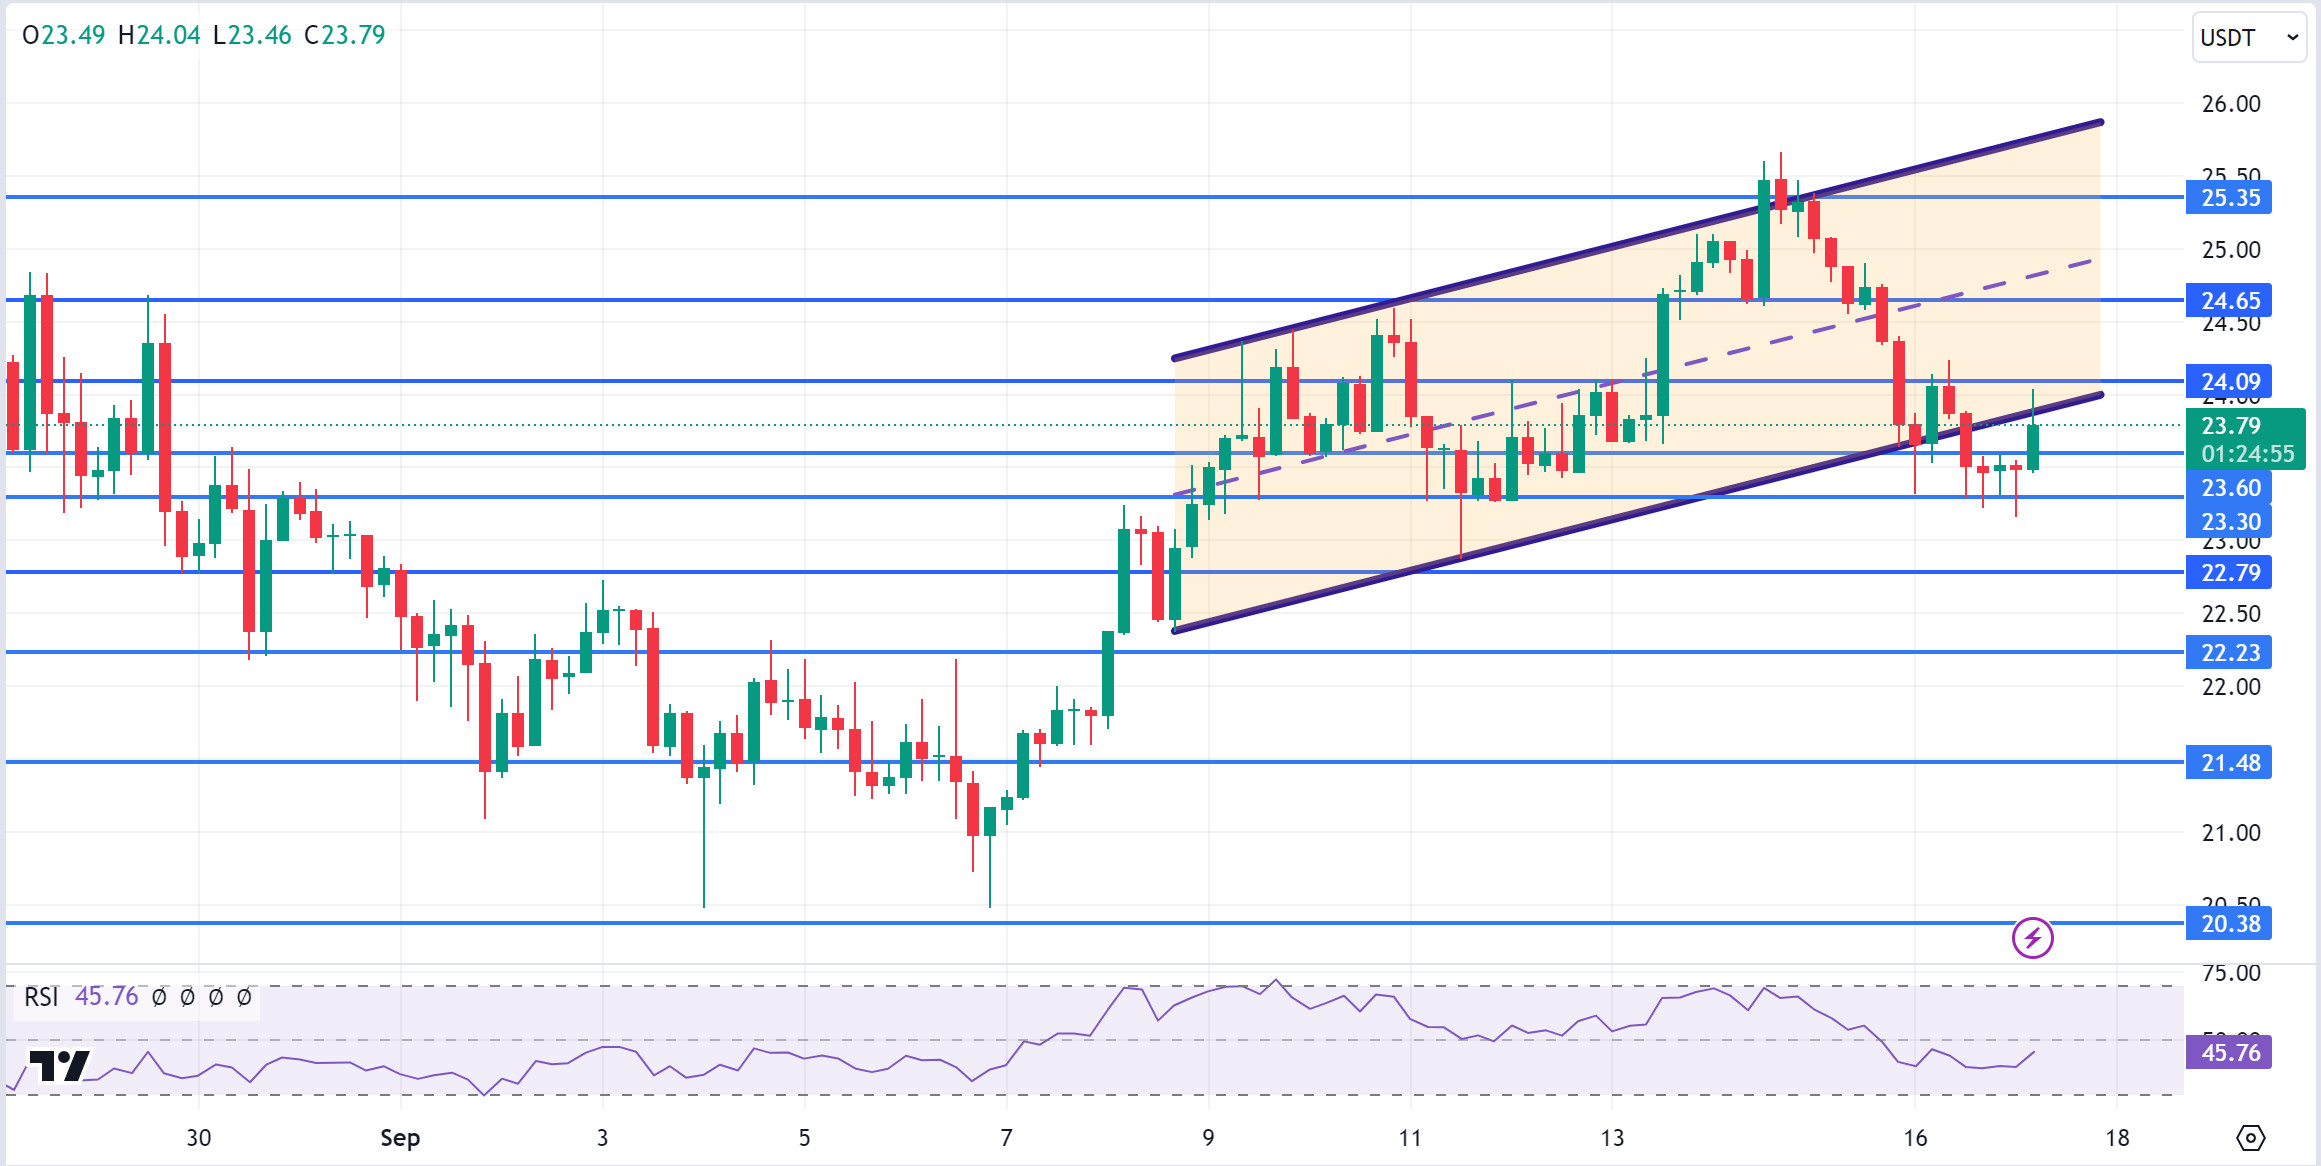
AVAX, which is currently trading at 23.79, has broken the lower band of the rising channel and is trying to return into the channel again. On the 4-hour chart, it tried to break the support of 23.30 but moved up with the buying reaction from here. Some more upside may come from the current level. Thus, it can test the 24.09 and 24.65 resistances by moving to the middle and upper band of the channel. As a result of the candle closing below 23.30 support, it may want to test 22.79 and 22.23 supports. As long as it stays above 20.38 support during the day, the desire to rise may continue. With the break of 20.38 support, selling pressure may increase.
Supports 23.30 – 22.79 – 22.23
Resistances 23.60 – 24.09 – 24.65
TRX/USDT
TRX, which started yesterday at 0.1489, closed the day at the opening price of 0.1489. The US retail sales data to be released today may create instant volatility, even if it does not affect the market much. Markets are waiting for the FED interest rate decision to be announced on Wednesday.
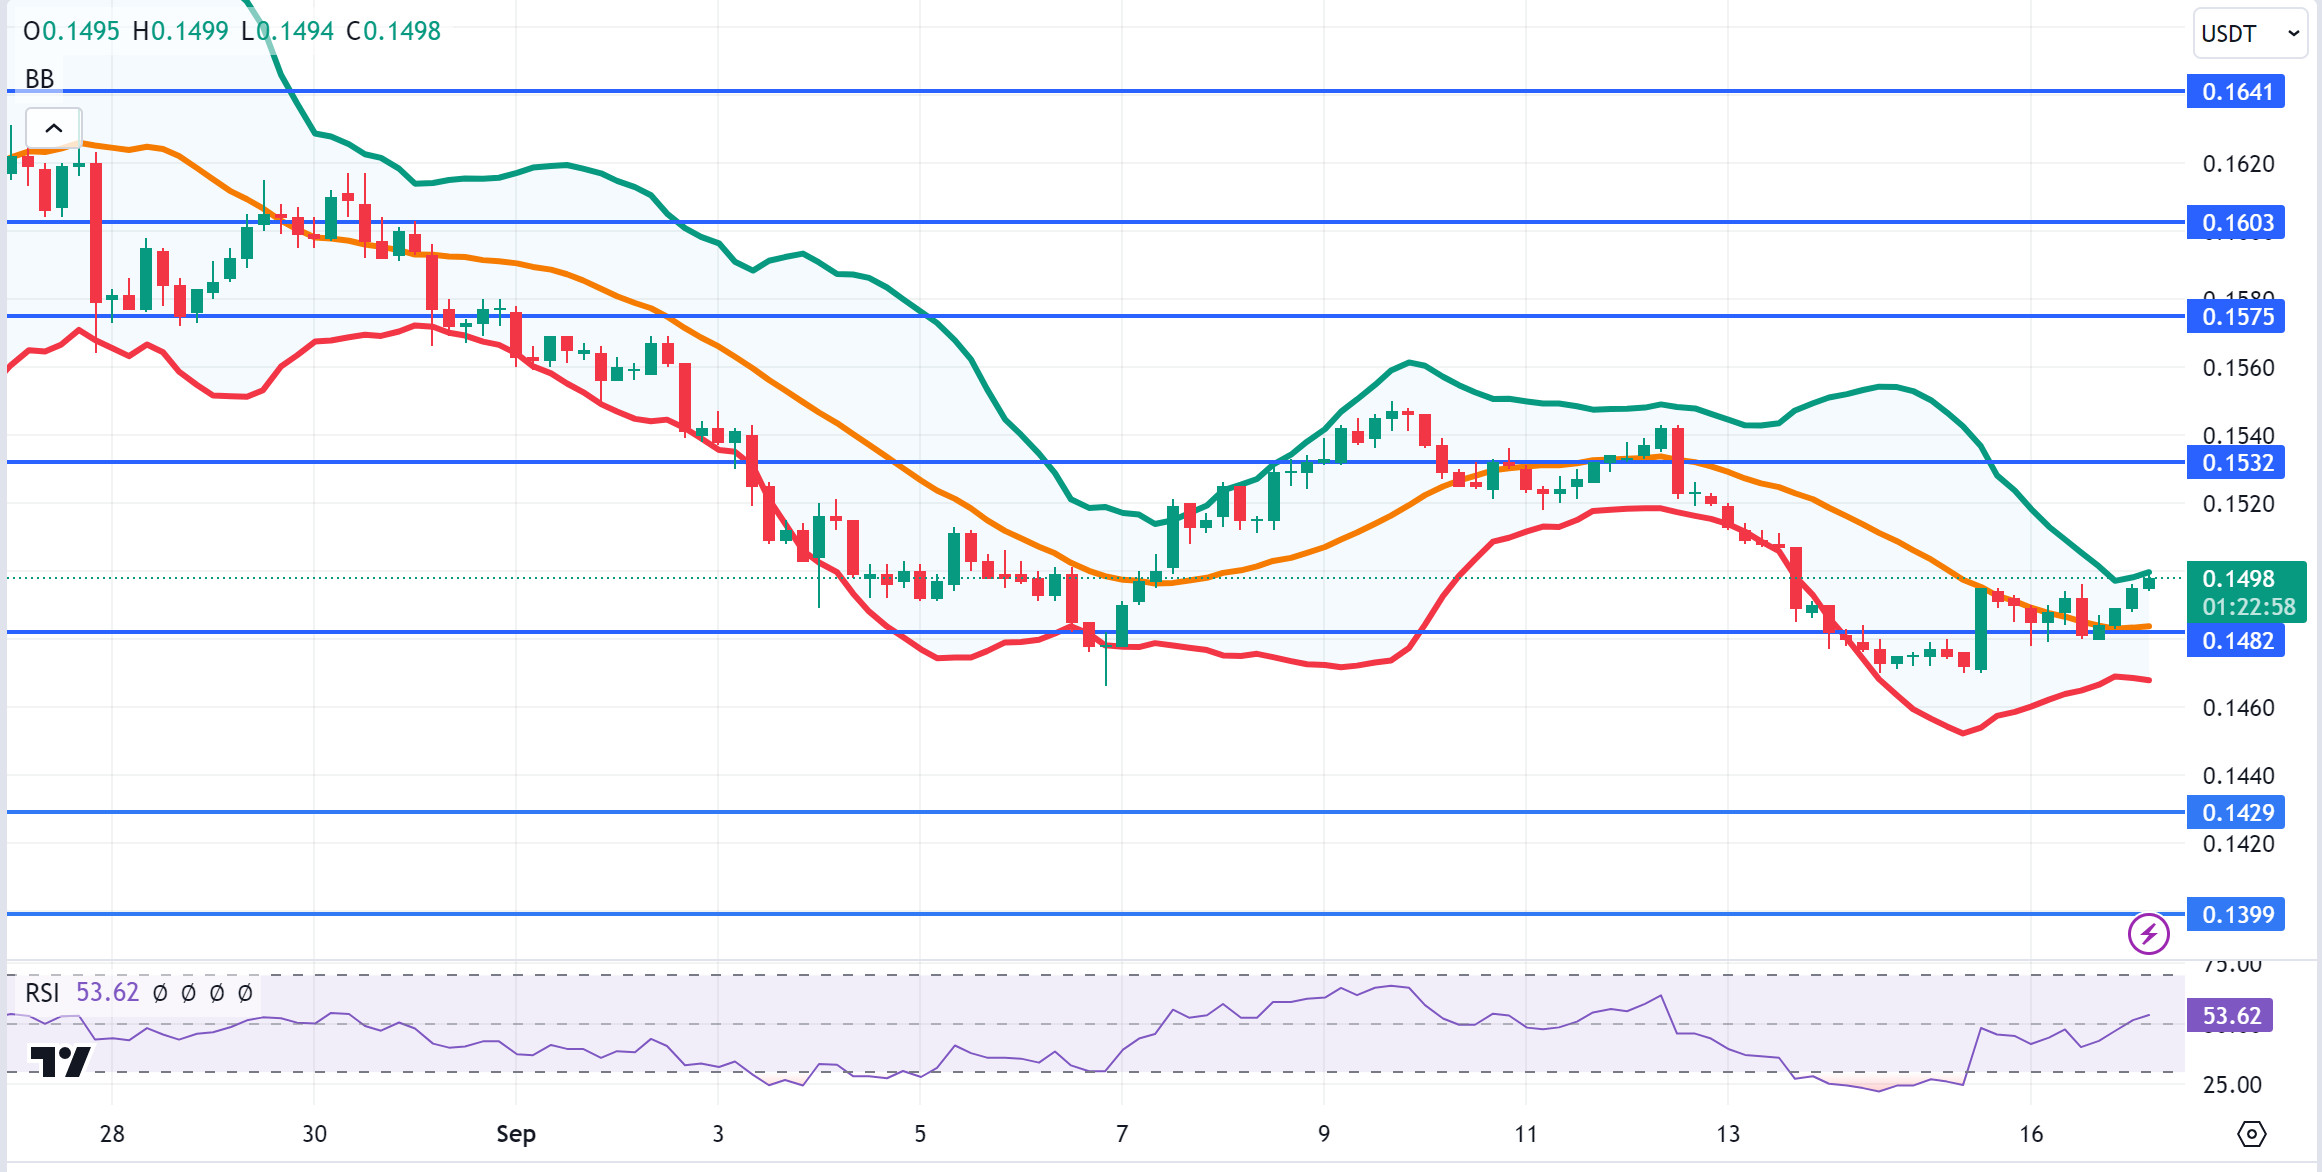
TRX, which is currently trading at 0.1498 and is in the upper Bollinger band on the 4-hour chart, can be expected to move to the middle band. In such a case, it may want to test the 0.1482 support. Since the RSI has not yet reached the overbought point with the 53 level, it may want to test the 0.1532 and 0.1575 resistances with continued purchases from these levels. TRX may continue to be bullish as long as it stays above 0.1482 support. If this support is broken downwards, sales can be expected to increase.
Supports 0.1482 – 0.1429 – 0.1399
Resistances 0.1532 – 0.1575 – 0.1603
XRP/USDT
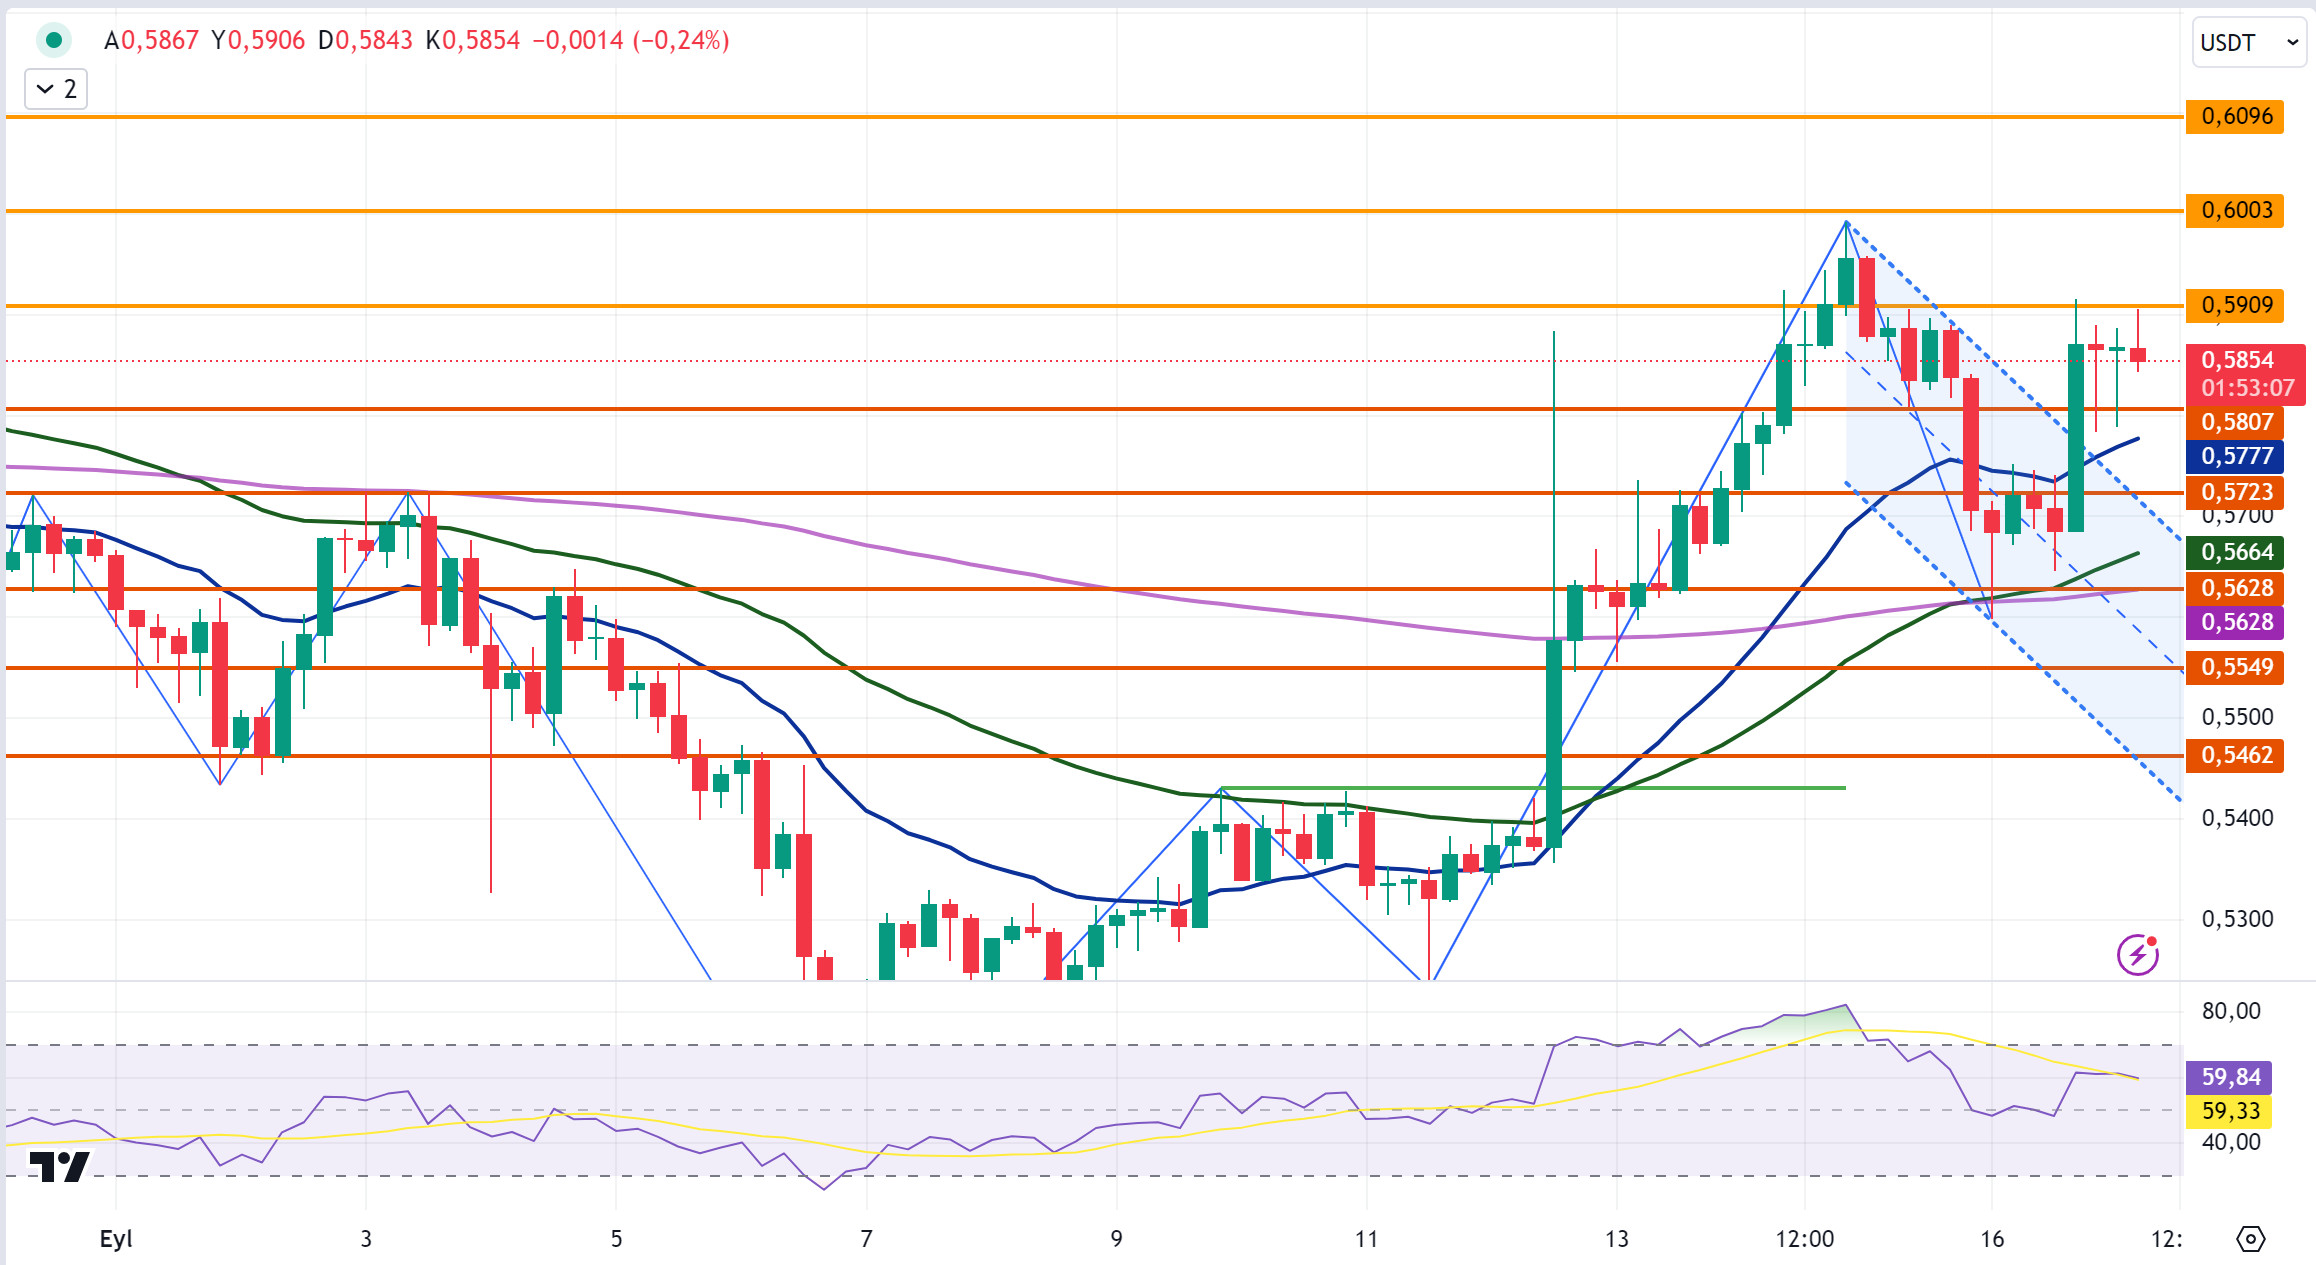
In the 4-hour analysis, XRP, which continued to rise after breaking the EMA20 level yesterday, continued to rise outside the falling channel and made the daily close at 0.5861 with reaction sales after testing the 0.5909 resistance level. With the decline it experienced after the reaction sales after the rise, it tested the support level of 0.5807 in yesterday’s closing and today’s opening candle, but could not break it and started to rise again. XRP, which retested the 0.5909 resistance level on the last candle today, could not break it and fell to 0.5854. Ahead of the important economic data to be released by the US today, XRP may continue to rise and may test the resistance levels of 0.6003-0.6096 if it continues to rise by breaking the resistance level in question after retesting the 0.5909 resistance level. In the event that it falls with possible reaction sales, it may test and break the 0.5807 and EMA20 support levels and test the 0.5723-0.5628 support levels if the decline deepens.
In case of a decline in the 4-hour analysis, the 0.5807 support level appears as a critical level and may rise with the reaction purchases that may come at this level and may offer a long trading opportunity. Otherwise, if the support levels of 0.5807 and EMA20 are broken, the decline may deepen and offer a short trading opportunity.
EMA20 (Blue Line) – EMA50 (Green Line) – EMA200 (Purple Line)
Supports 0.5807 – 0.5723 – 0. 5 628
Resistances 0.5909 – 0.6003 – 0. 6096
DOGE/USDT
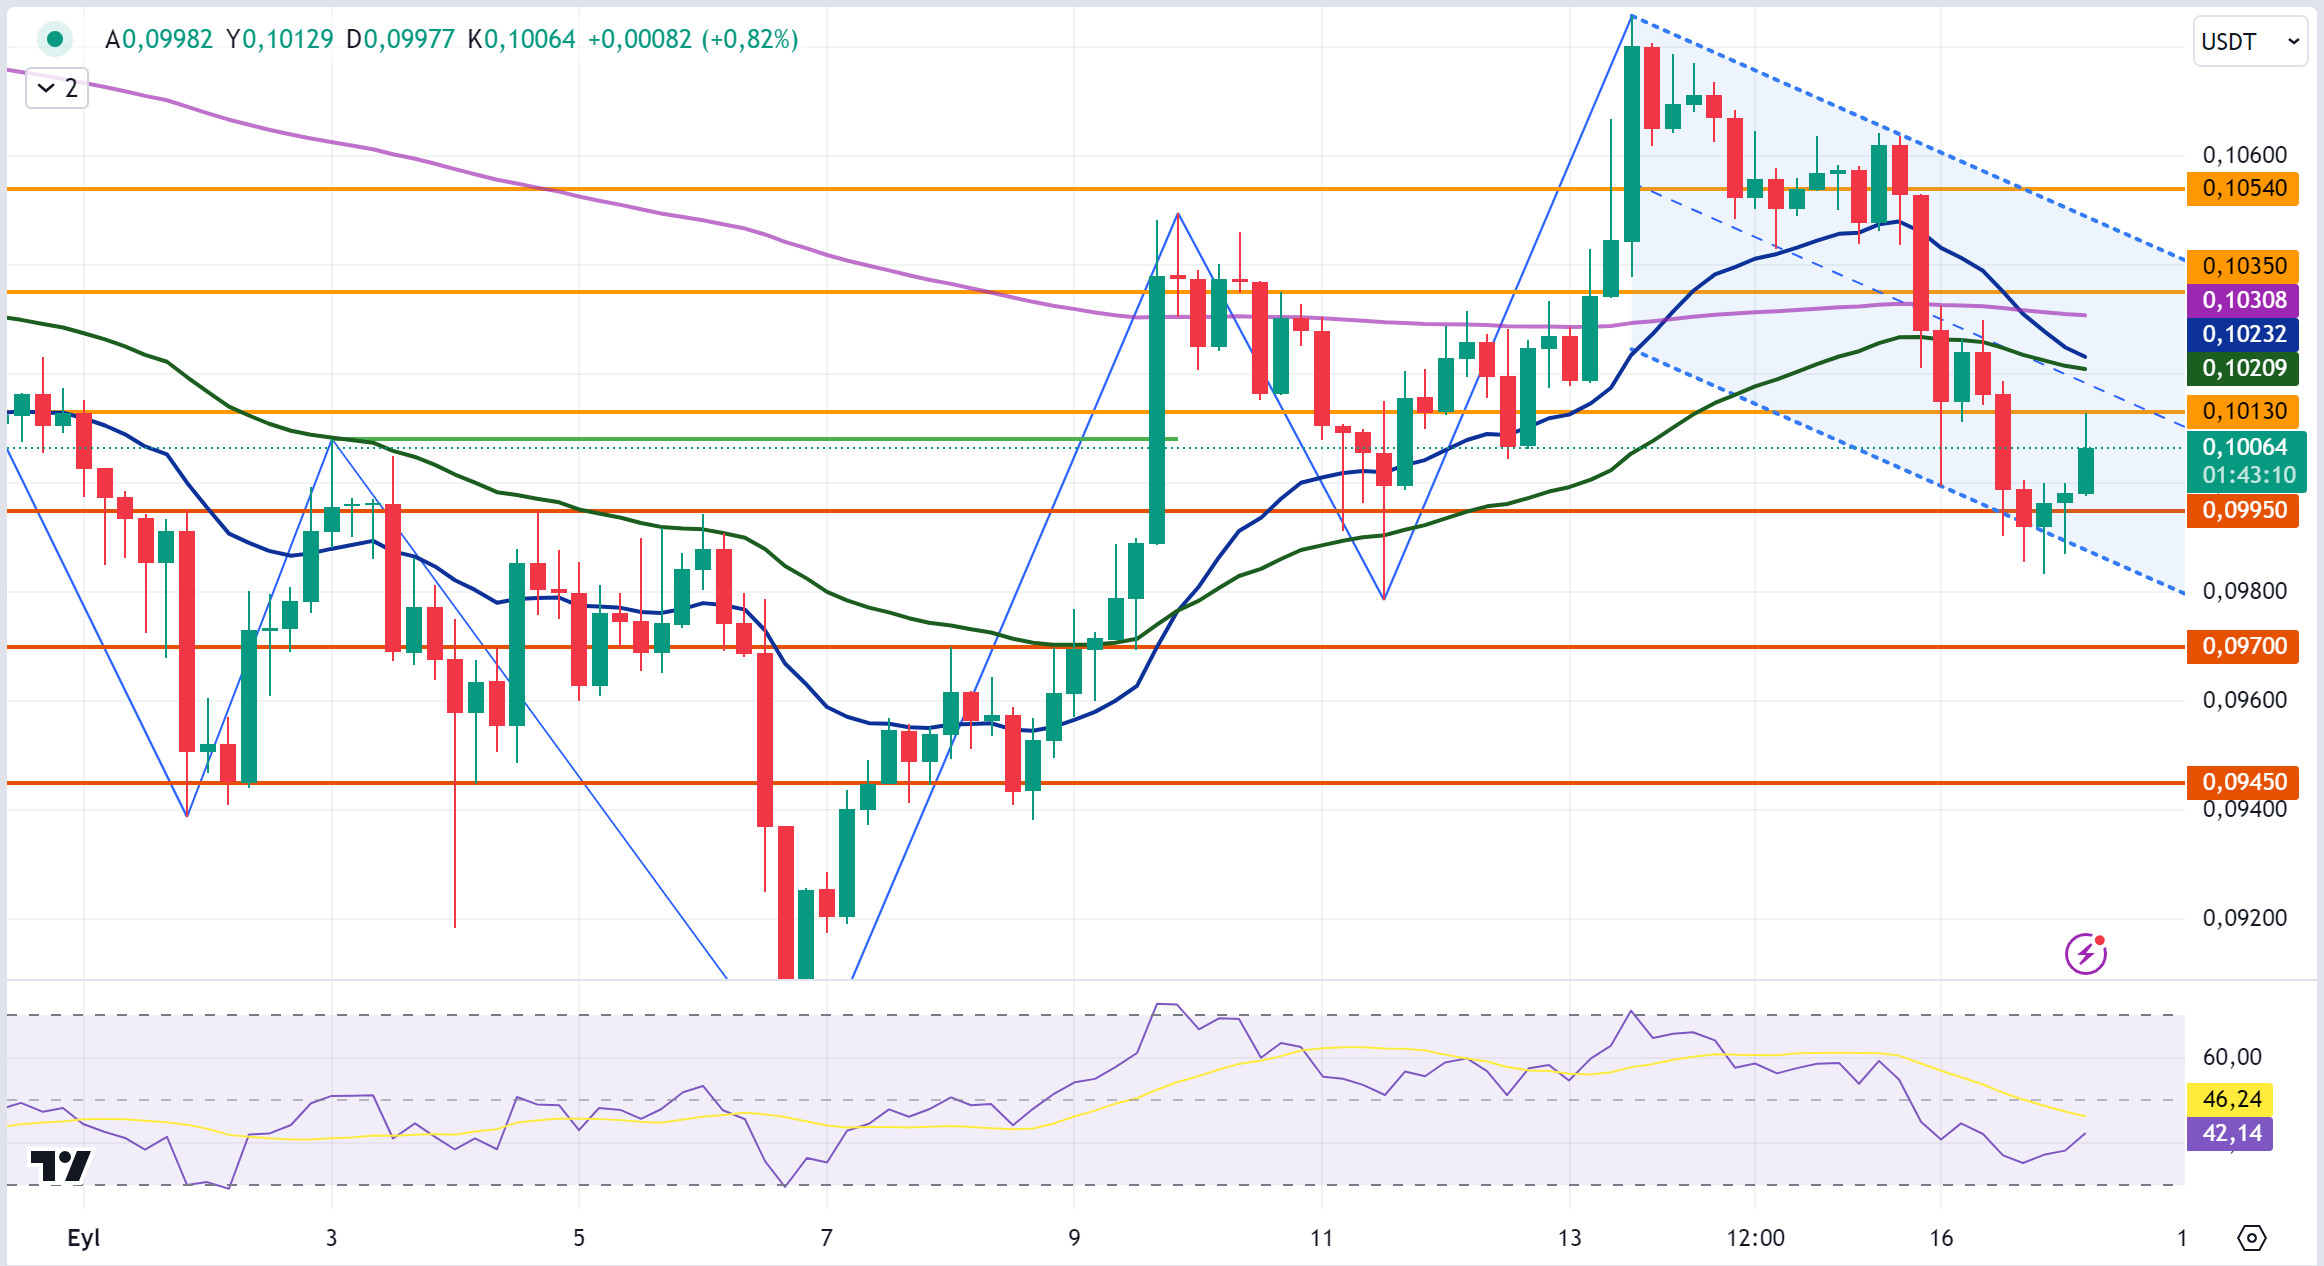
DOGE lost 3% of its value with the decline it experienced yesterday, and its daily close was realized at 0.0996. DOGE, which started today with a bullish start, is currently trading at 0.1006 with a 1% increase in value in the opening and last candle in the 4-hour analysis. If it continues to rise ahead of important economic data to be released by the US today, DOGE may test the 0.1035-0.1054 resistance levels by retesting and breaking the 0.1013 resistance level it tested in the last candle and continuing its rise. In the opposite scenario, it may test the support levels of 0.0995-0.0970-0.0945 if it declines.
In the 4-hour analysis, the 0.0970 support level appears as an important support point. If DOGE breaks the 0.0995 support level with the decline and continues its decline and tests the 0.0970 support level, it may rise with the reaction purchases that may come and may offer a long trading opportunity. Otherwise, the decline may deepen with the break of the 0.0970 support level and may offer a short trading opportunity.
EMA20 (Blue Line) – EMA50 (Green Line) – EMA200 (Purple Line)
Supports 0.0995 – 0.0970 – 0.0945
Resistances 0.1013 – 0.1 035 – 0.1054
DOT/USDT
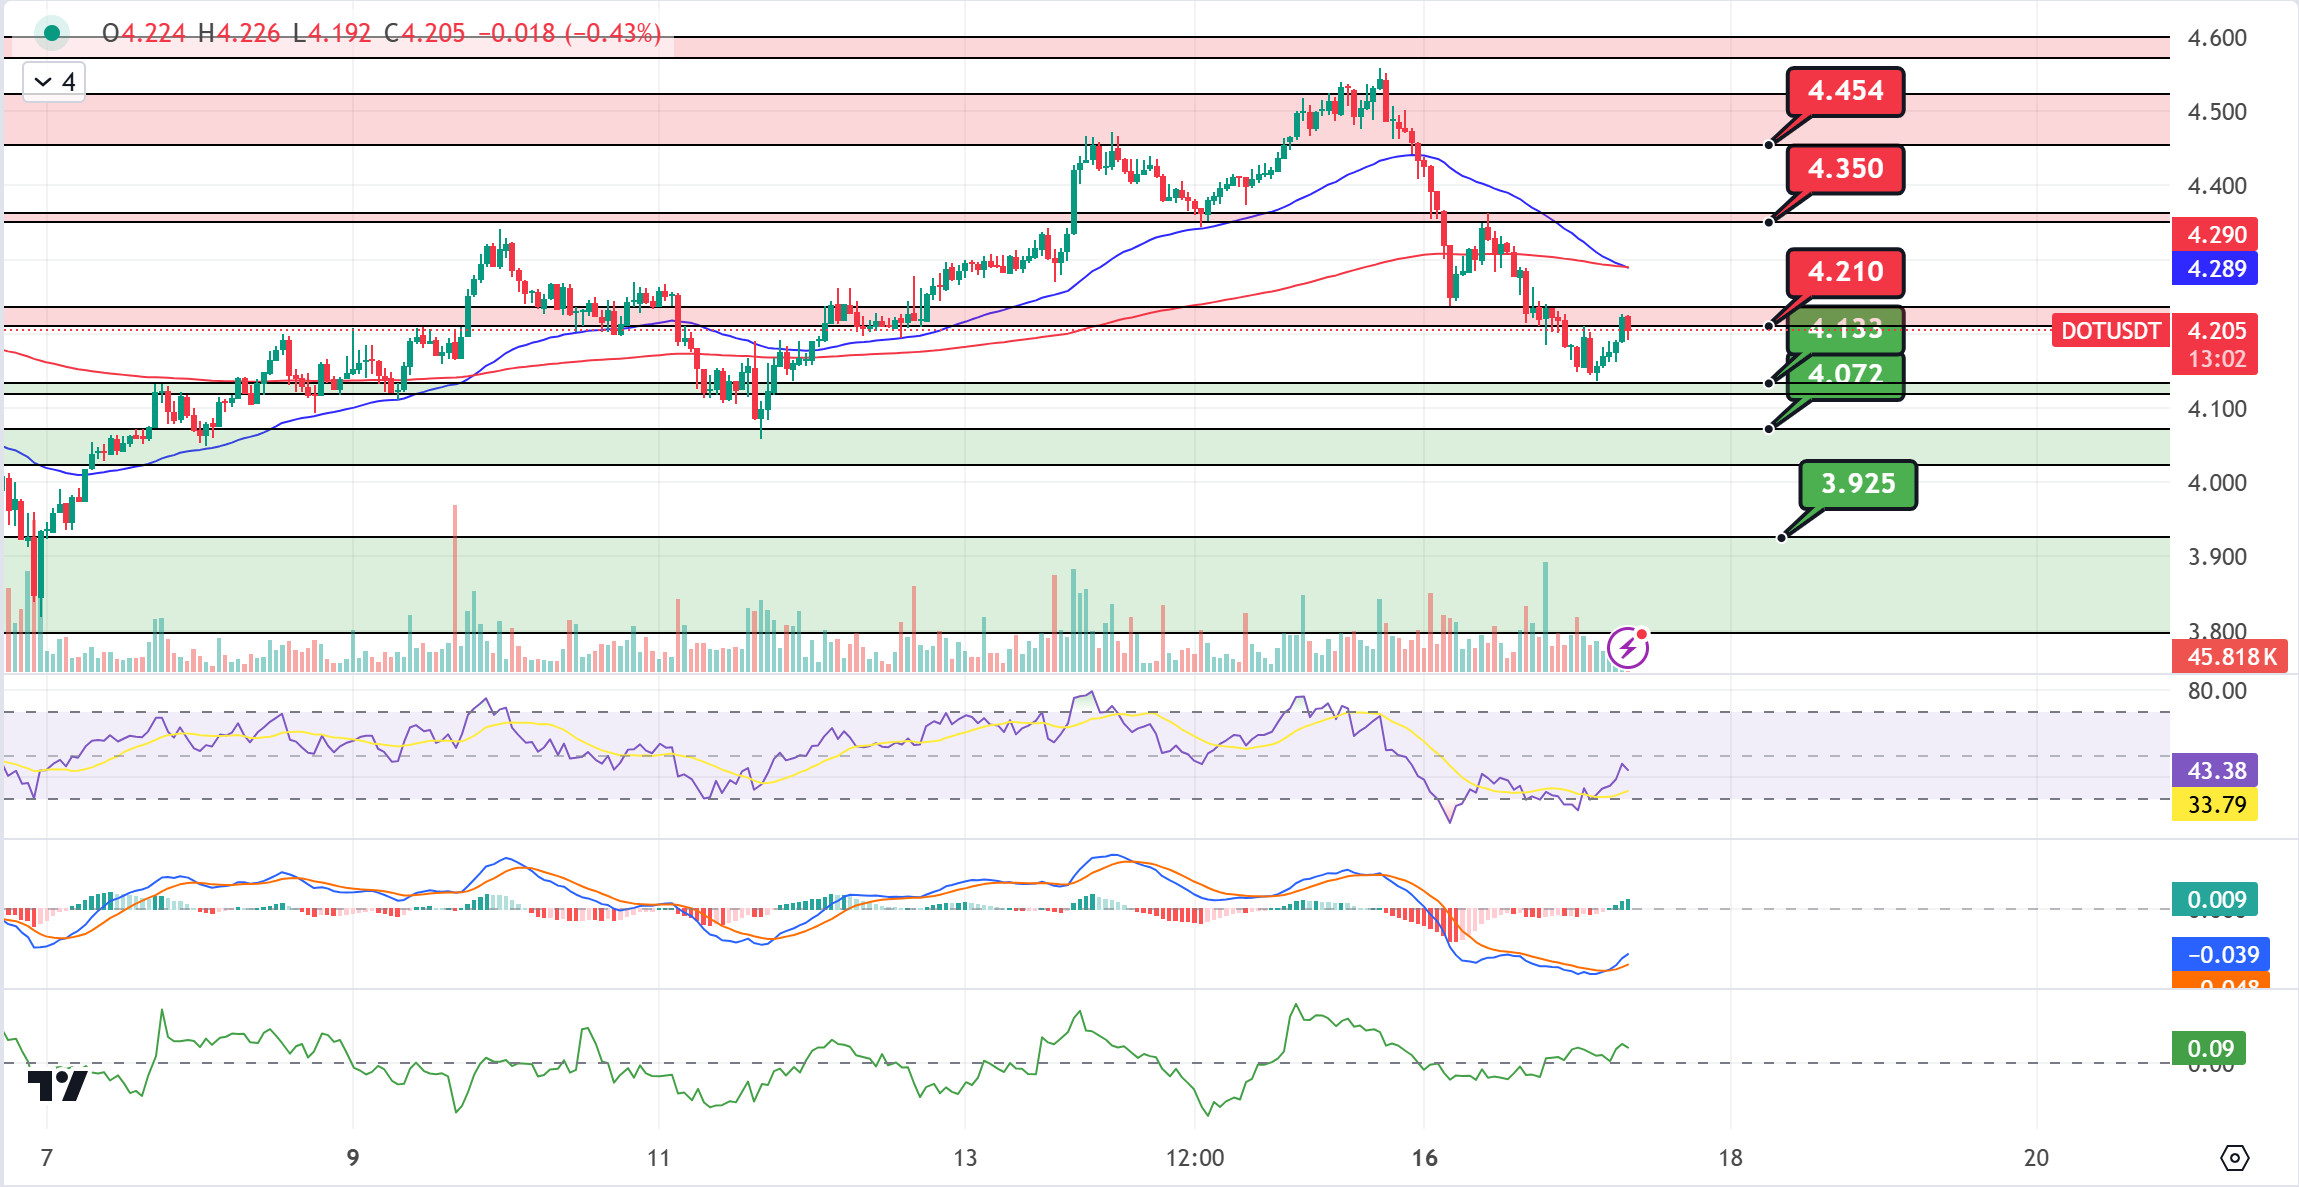
When we examine the Polkadot (DOT) chart, we see that the price broke down the 4.210 support band and reacted from the 4.133 support. The 4.210 level now seems to act as a resistance. When we examine the MACD and CMF oscillators, we can say that buyer pressure prevails. If the price breaks the 4.210 level upwards and maintains this level, the next target may be the 4.350 resistance band. In the negative scenario, we see that the EMA50 cuts the EMA200 (Death Cross). In this case, the selling pressure may increase further. If the price fails to break the selling pressure at 4,210, it may retest the 4,133 level.
(Blue line: EMA50, Red line: EMA200)
Supports 4,133 – 4,072 – 3,925
Resistances 4.210 – 4.350 – 4.454
SHIB/USDT
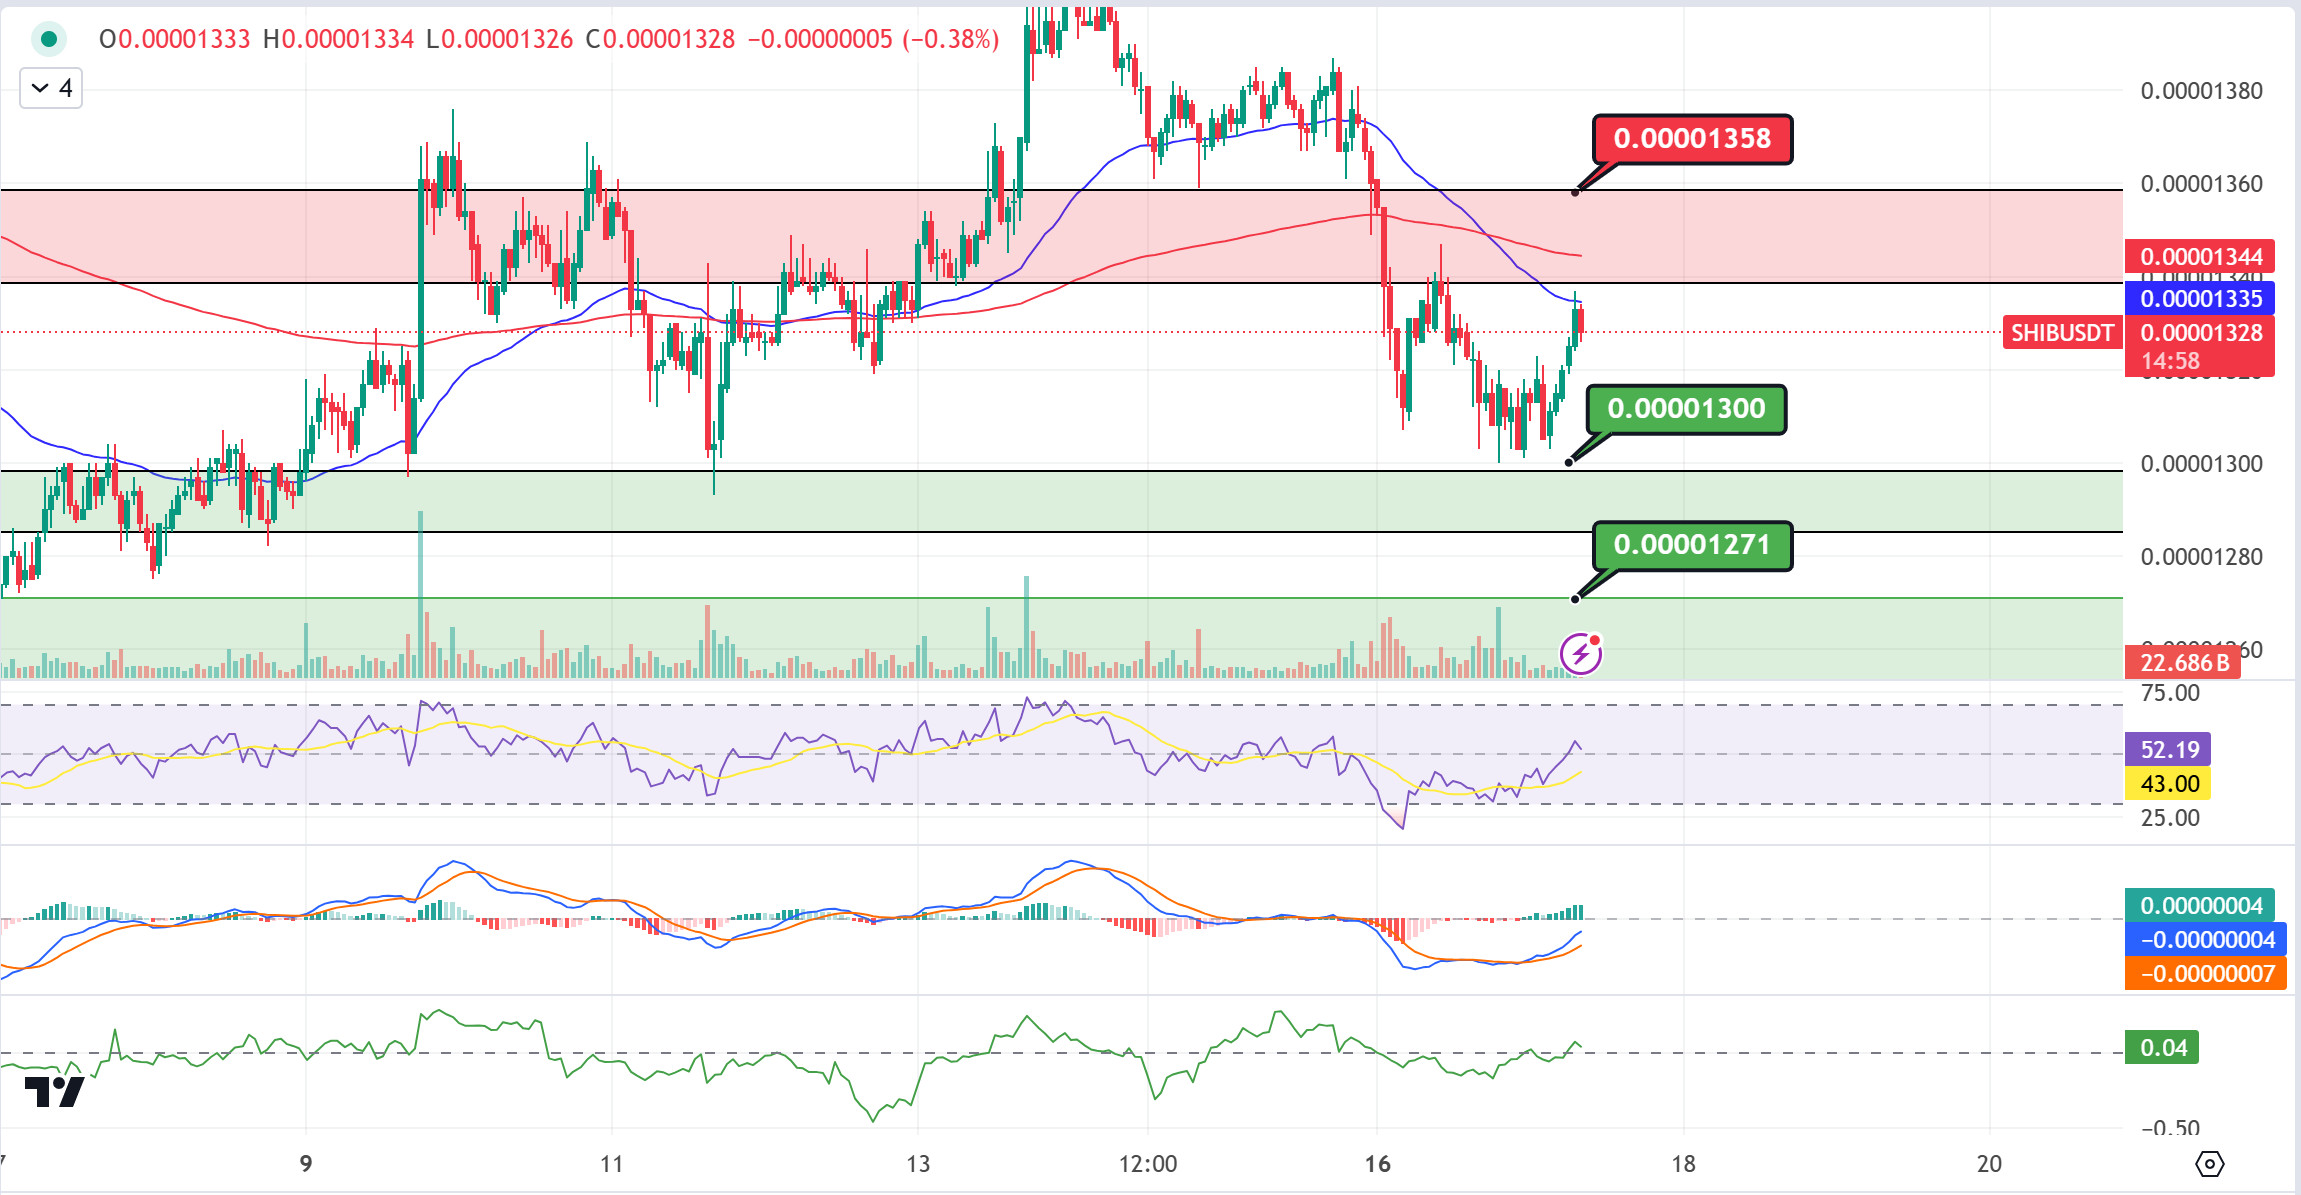
When we examine the chart of Shiba Inu (SHIB), we see that the price rose up to the EMA50 level with the reaction from the support of 0.00001300. According to MACD and CMF oscillators, we can say that the buyer pressure is more. In the positive scenario, if the price can break the selling pressure at the 0.00001358 resistance level, its next target could be 0.00001412. In the negative scenario, the price may want to test the 0.000013000 level again after the rejection from the EMA50 level.
(Blue line: EMA50, Red line: EMA200)
Supports 0.00001300 – 0.00001271 – 0.00001227
Resistances 0.00001358 – 0.00001412 – 0.00001443
 LEGAL NOTICE
The investment information, comments and recommendations contained herein do not constitute investment advice. Investment advisory services are provided individually by authorized institutions taking into account the risk and return preferences of individuals. The comments and recommendations contained herein are of a general nature. These recommendations may not be suitable for your financial situation and risk and return preferences. Therefore, making an investment decision based solely on the information contained herein may not produce results in line with your expectations.


