
MARKET SUMMARY
Latest Situation in Crypto Assets
*Prepared on 16.09.2024 at 14:00 (UTC)
WHAT’S LEFT BEHIND
The expected Fed week has arrived: 50 basis point rate hike
The US Federal Reserve (Fed) starts its two-day FOMC meeting tomorrow. On Wednesday, the new interest rate decision will be announced. While the Fed is expected to cut interest rates for the first time in 4 years, markets have started to price a 50 basis point move.
Crypto funds bounce back with $436 million after big outflows
Crypto funds, which have seen serious outflows of up to 1.2 billion dollars recently, completed last week with a net inflow of 436 million dollars. “Short-Bitcoin” funds also turned negative after 3 weeks.
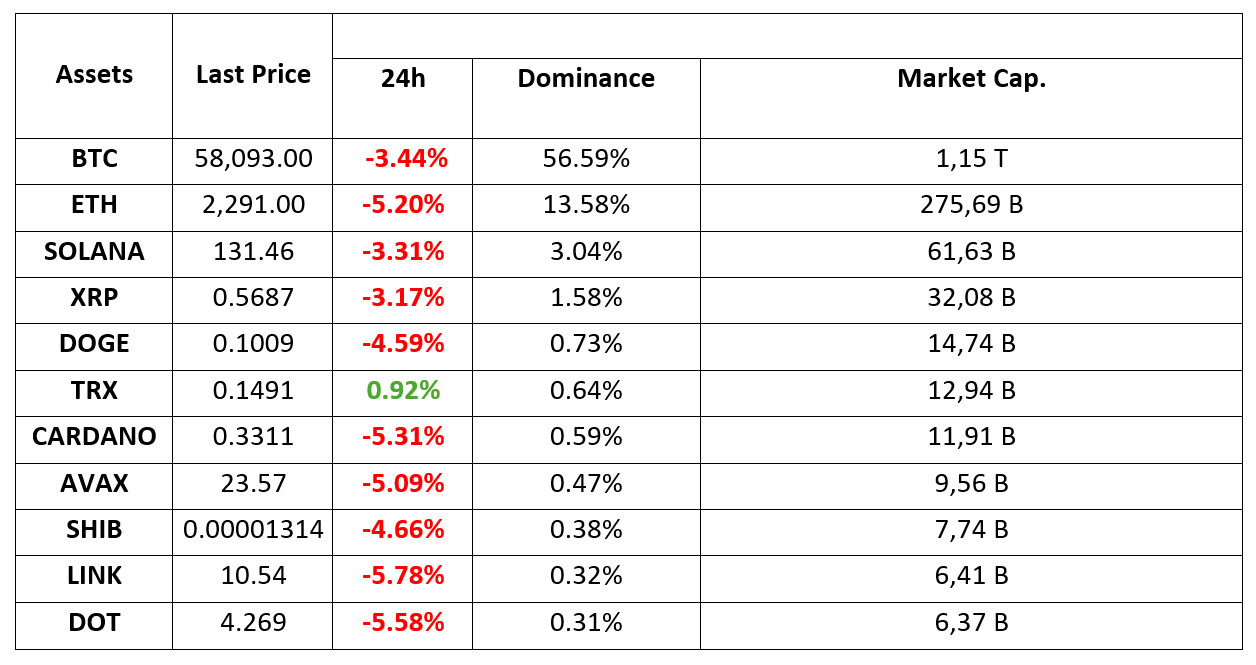
Bitcoin dominance is 58 percent after 3.5 years
Bitcoin dominance, which shows the share of Bitcoin in the total market capitalization of cryptocurrencies, reached its highest level since April 2021. Dominance, which has been in the range of 56.8 percent to 57.7 percent for weeks, reached 58 percent today for the first time in 3.5 years.
Bitcoin warning from Robert Kiyosaki
Robert Kiyosaki, whose financial analysis is followed with great interest and who has been advising to buy Bitcoin, gold and silver for years, once again said similar words. In a tweet yesterday, Kiyosaki also opposed the Bitcoin and gold debates. Stating that such discussions are unnecessary, Kiyosaki said, “Those who hold Bitcoin, gold and silver will get rich.
HIGHLIGHTS OF THE DAY
INFORMATION:
*The calendar is based on UTC (Coordinated Universal Time) time zone. The economic calendar content on the relevant page is obtained from reliable news and data providers. The news in the economic calendar content, the date and time of the announcement of the news, possible changes in the previous, expectations and announced figures are made by the data provider institutions. Darkex cannot be held responsible for possible changes that may arise from similar situations.
MARKET COMPASS
Although volatile, the halt in the losses of the dollar index during the European session can be considered as a sign that investors are in a waiting mode ahead of the critical Federal Open Market Committee (FOMC) meeting. Meanwhile, the fact that gold prices are holding at record highs can be taken as a sign of a cautious stance. It would not be wrong to state that such an equation is not a surprise ahead of highly important and expected news flows.
With so little time left, it is not uncommon for markets to be so indecisive about the US Federal Reserve’s next move on interest rate changes. Although the probability of a 50 bps cut is 63% according to the CME FedWatch Tool, last week it was split between 50-50% (between a 25 and 50 bps cut). This is causing the markets to seek safer ground. It also indicates that volatility may be high at the moment the decision is announced.
Stock market indices globally are showing a mixed (generally slightly negative) trend. On the other hand, digital assets are struggling to recover their losses and the pressure continues. Moreover, there is currently no reason for this trend to deteriorate. Therefore, we can expect technical market movements and continued declines amid weak rallies to continue.
TECHNICAL ANALYSIS
BTC/USDT
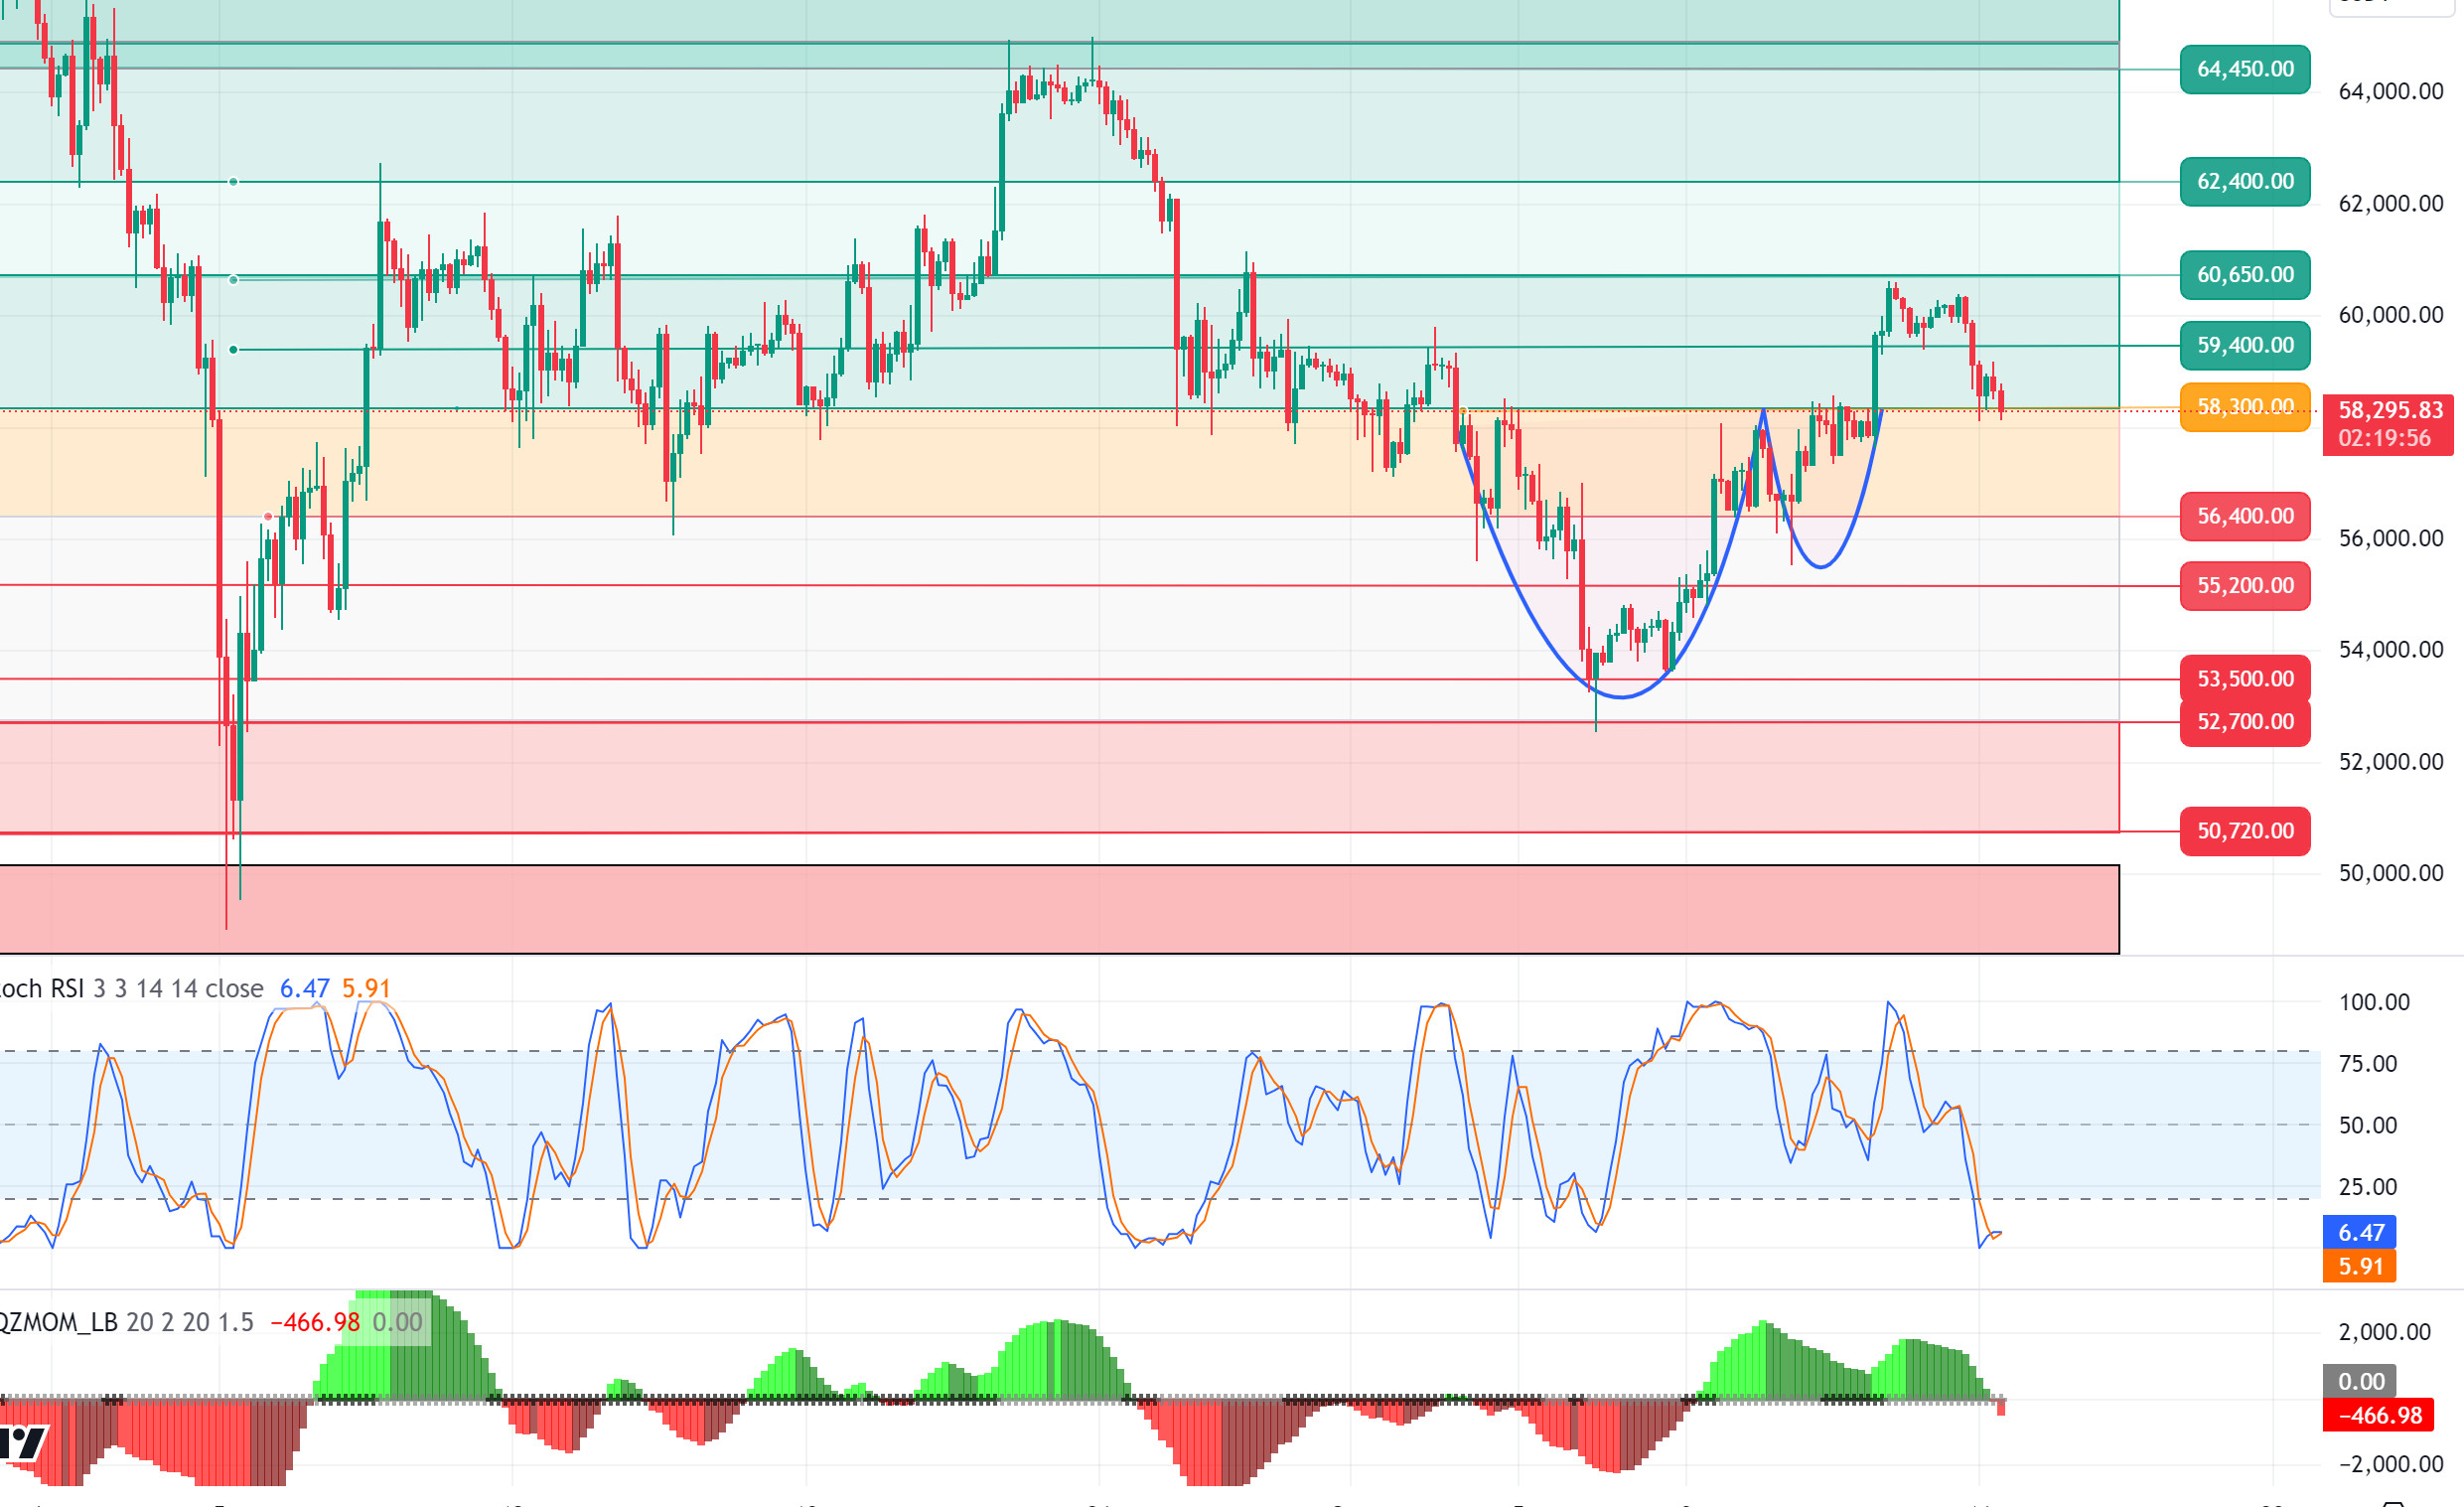
Eyes on the FED decision in Bitcoin! Bitcoin, which retreated from 60,000 levels due to the second D. Trump assassination attempt yesterday, is now focused on the FED interest rate decision. Shortly before the FED interest rate meeting, the expectation of a 50 basis point interest rate cut in the market increased again, reaching 65%. In the coming days, the FED’s step towards a flexible monetary policy will have a serious impact on the Bitcoin price. In particular, positions taken in the direction of a 50 basis point interest rate cut may cause a pullback in the market in case of a 25 basis point cut. In the opposite case, we may witness a short-term bullish movement. In both scenarios, trading in line with technical analysis may indicate healthier investment decisions. In the BTC 4-hour technical analysis, the support level of 58,300 is an important level. Persistence above it can be effective in gaining upward momentum and 60,650 levels can be targeted. Today, despite the 50 basis points interest rate cut rate of the US market, it may be reflected in the BTC price if the opening sessions are positive. Otherwise, there may be a pullback towards the 56,400 level in the downward breakdown of the support level.
Supports 58,300- 57,200 – 56,400
Resistances 59,400 – 60,650 – 62,400
ETH/USDT
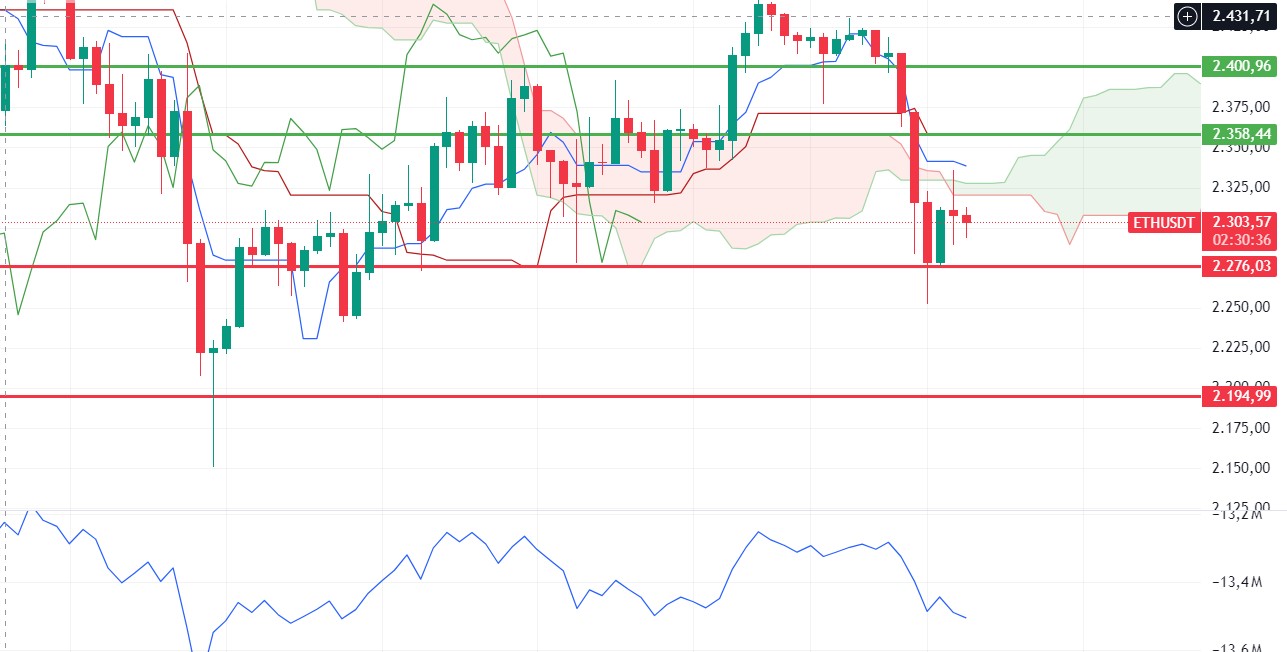
Ethereum, which realized some rise in the morning hours, as expected, is currently trying to hold on to the 2,300 levels. With the positive mismatch in OBV disappearing and staying under the kumo cloud, it seems likely that the decline will continue for some more time. The 2,276 level seems important as the main support. Closures below this level may bring declines down to 2,195 levels. In order to talk about a positive structure, the 2,358 level needs to be regained.
Supports 2,276 – 2,195 – 2,112
Resistances 2,358 – 2,400 – 2,451
LINK/USDT
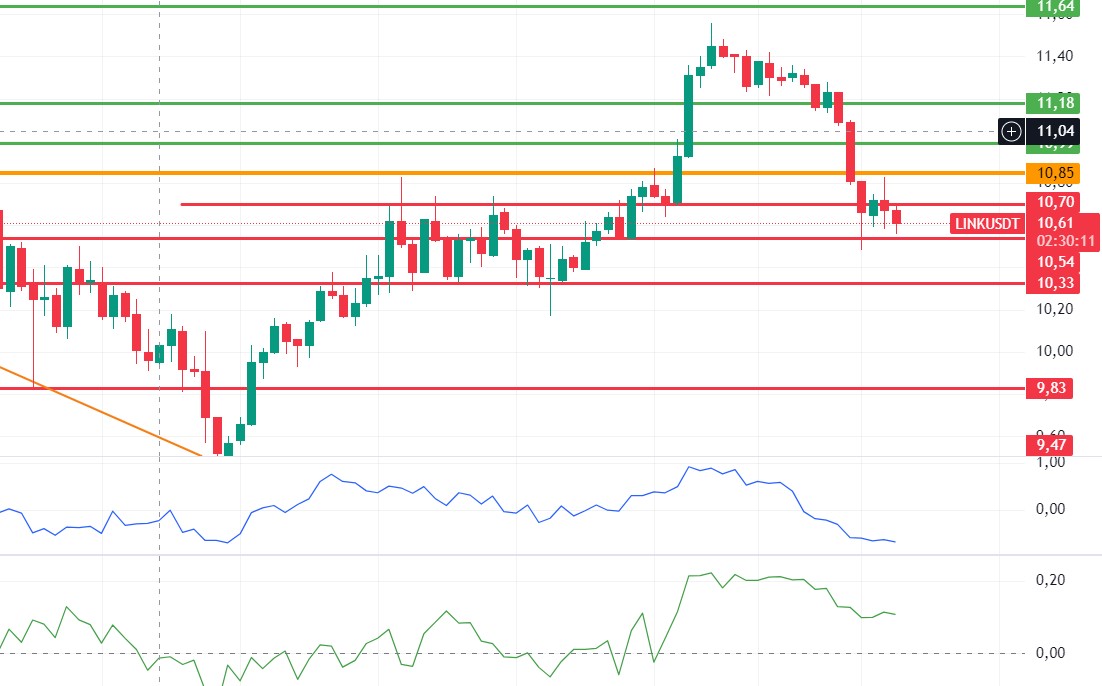
LINK suffered a further retracement with a decline in momentum. The positive structure formed in CMF stands out. Looking at the open interest, we see that some of the open exposures have been closed. For these reasons, a reaction can be expected at 10.54. However, if the 10.54 level is broken with the volatility of the market, a sudden drop to 10.33 – 9.83 levels may occur.
Supports 10.54 – 10.33 – 9.83
Resistances 10.70 – 10.85 – 10.99
SOL/USDT
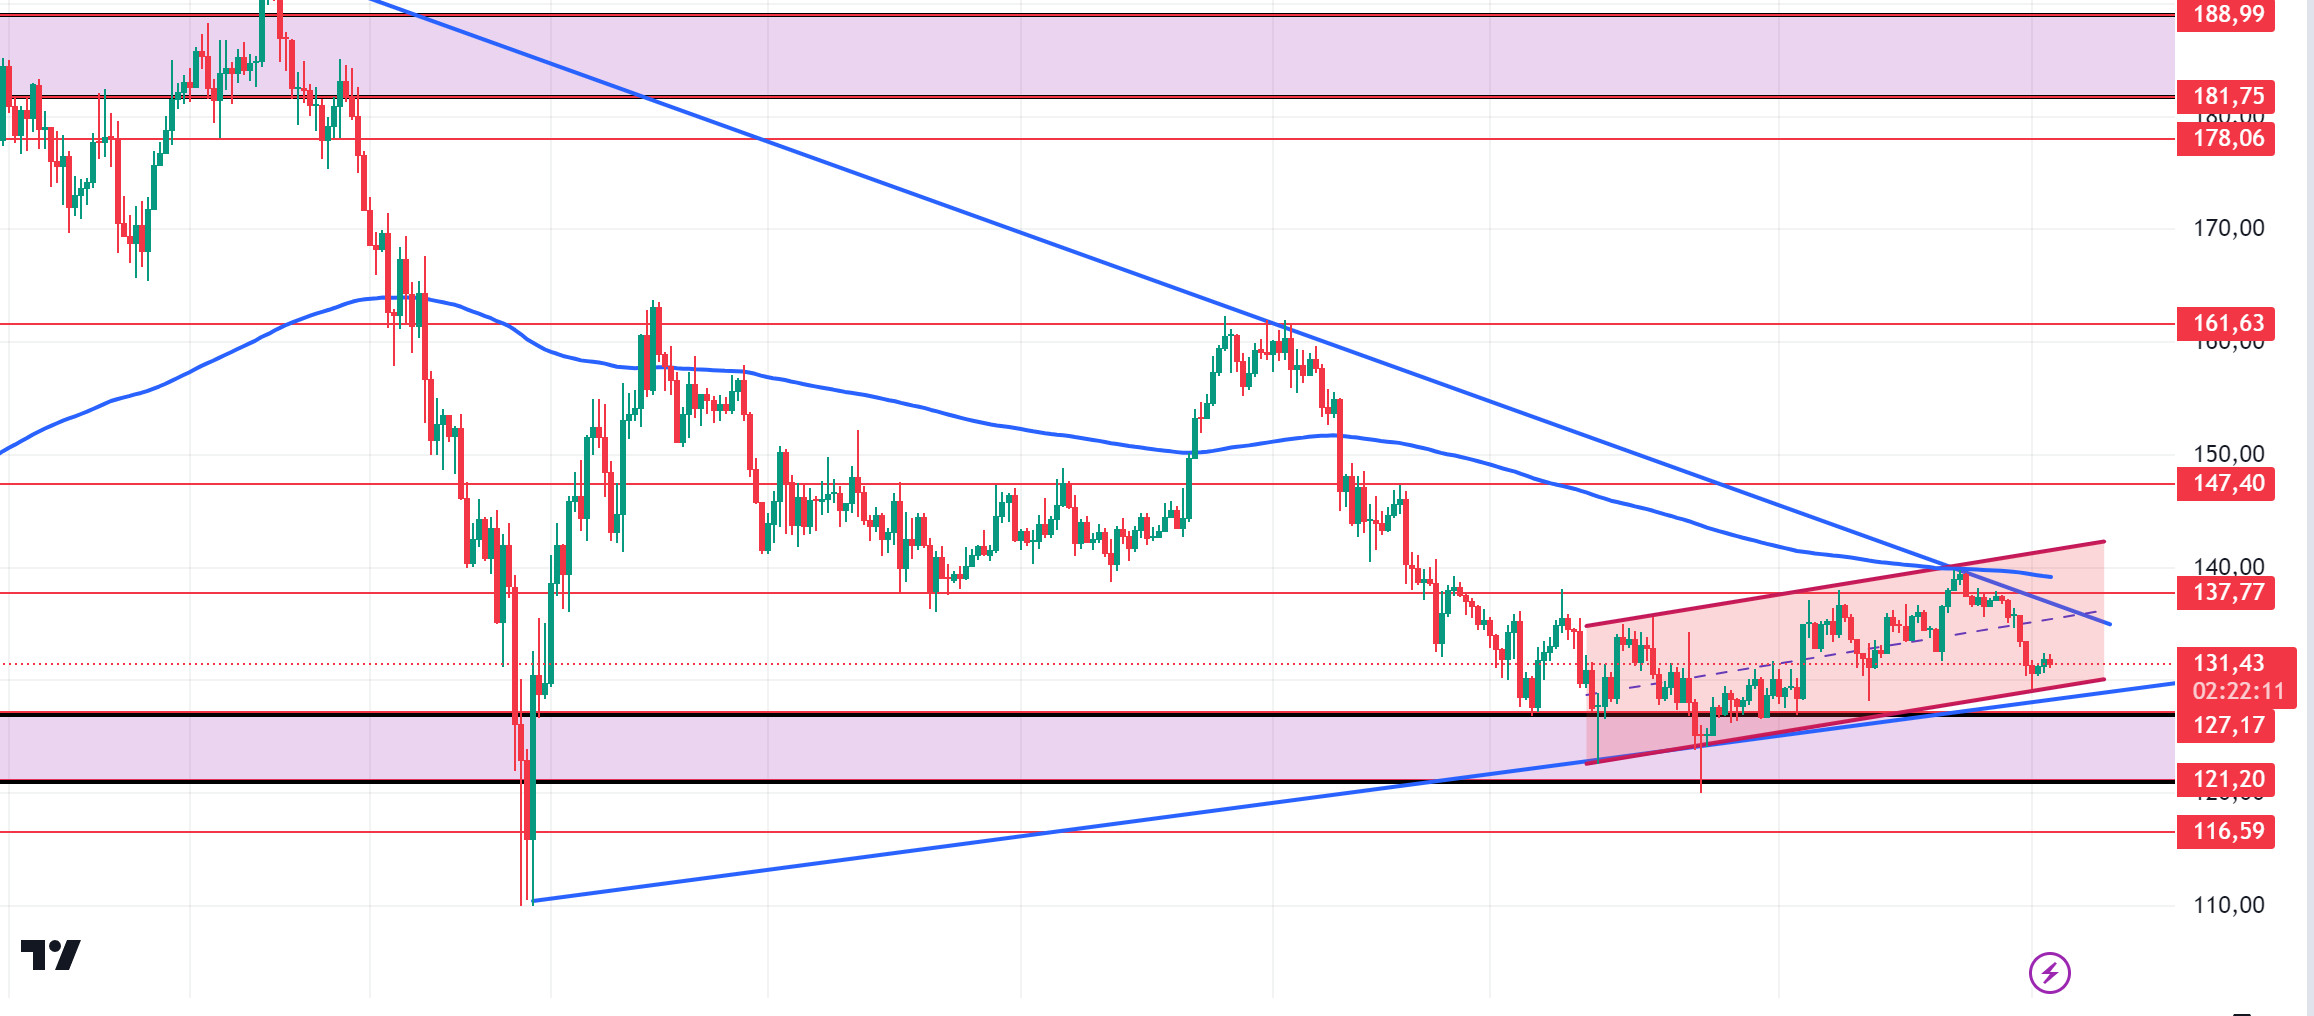
According to data from the CME, the probability of the US cutting interest rates by 50 basis points is 63%. This could be bullish news for cryptocurrencies. Solana price has risen slightly since our morning analysis. As long as it stays above 127.17, the upward movement can be followed. We are also coming to the end of the narrowing triangle pattern. At the same time, SOL, which has been rising from the support zone of the channel it has formed since September 4, may prepare the ground for upward movement. Both macroeconomic conditions and innovations in the Solana ecosystem appear as resistance levels 137.77 – 142.02. If it rises above these levels, the rise may continue. In case investors move in the opposite direction due to possible macroeconomic news and the rise in BTC dominance, a potential rise should be followed if it reaches the support levels of 127.17 – 121.20.
Supports 127.17 – 121.20 – 116.59
Resistances 137.77 – 147.40 – 161.63
ADA/USDT
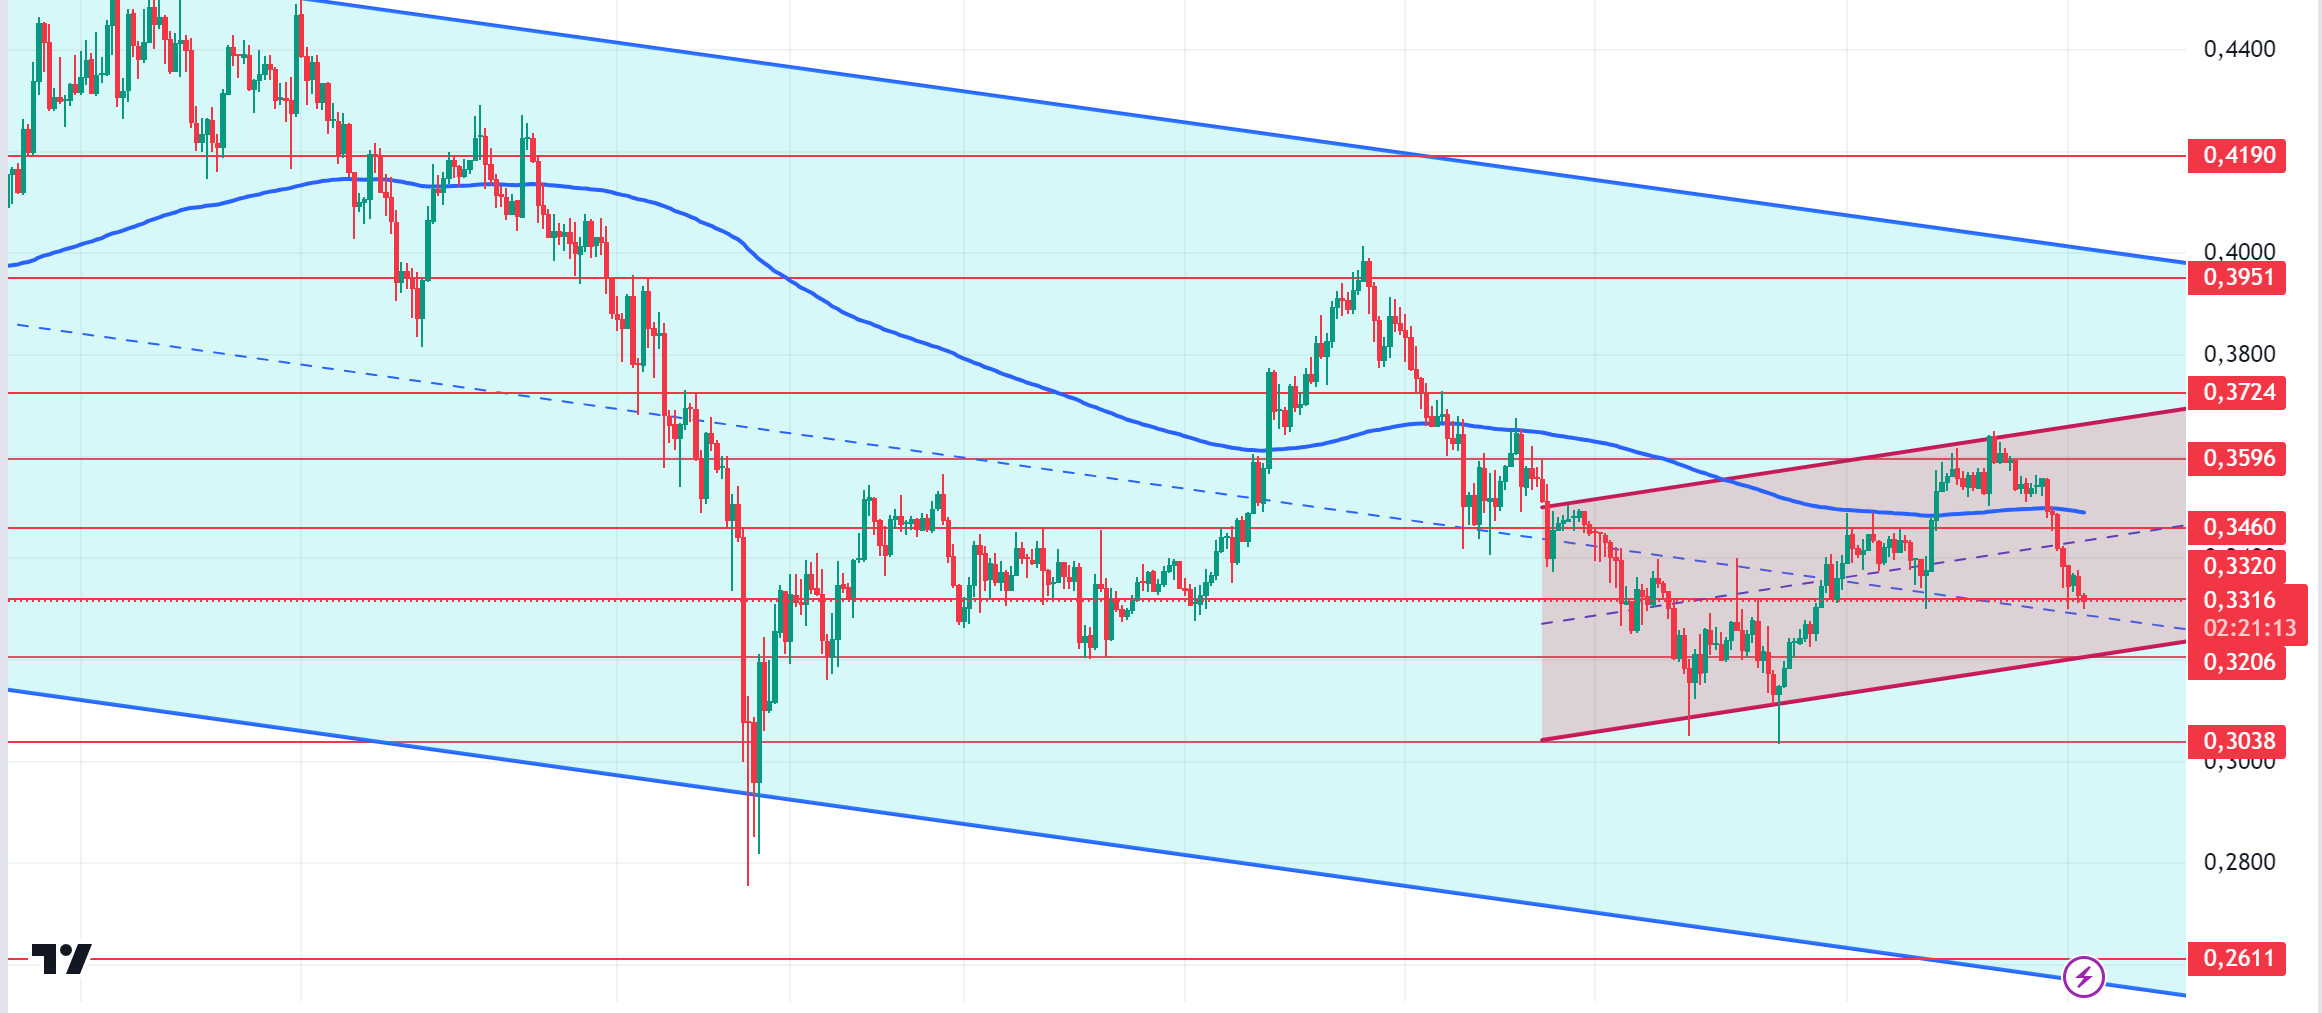
Charles Hoskinson breaks his silence on whether Cardano is superior to the Solana blockchain. Is Cardano better than Solana? Cardano’s founder started a new debate by saying that he thinks the protocol is superior to Solana because of the Leios protocol. We will see if this will cause tension between Cardano and Solana in the coming days. Technically, Cardano has been pricing in the falling channel for the last five months. For ADA, the 0.3320 level may be the bottom of the correction. If the forecasts of a 50 basis point interest rate cut in the US start to be priced in, it may test the resistance point of the channel it has formed since September 1. Such a move could take ADA to a target of 0.3724. On the other hand, ADA remains below the EMA200 moving average. This shows that there is still bearish pressure. Despite this, its price is hovering above a critical resistance. 0.3320 is a strong support in case of a pullback due to general market movements. In the event that macroeconomic data raises BTC, 0.3460 – 0.3596 levels can be followed as resistance levels.
Supports 0.3320 – 0.3206 – 0.3038
Resistances 0.3460 – 0.3596 – 0.3724
AVAX/USDT
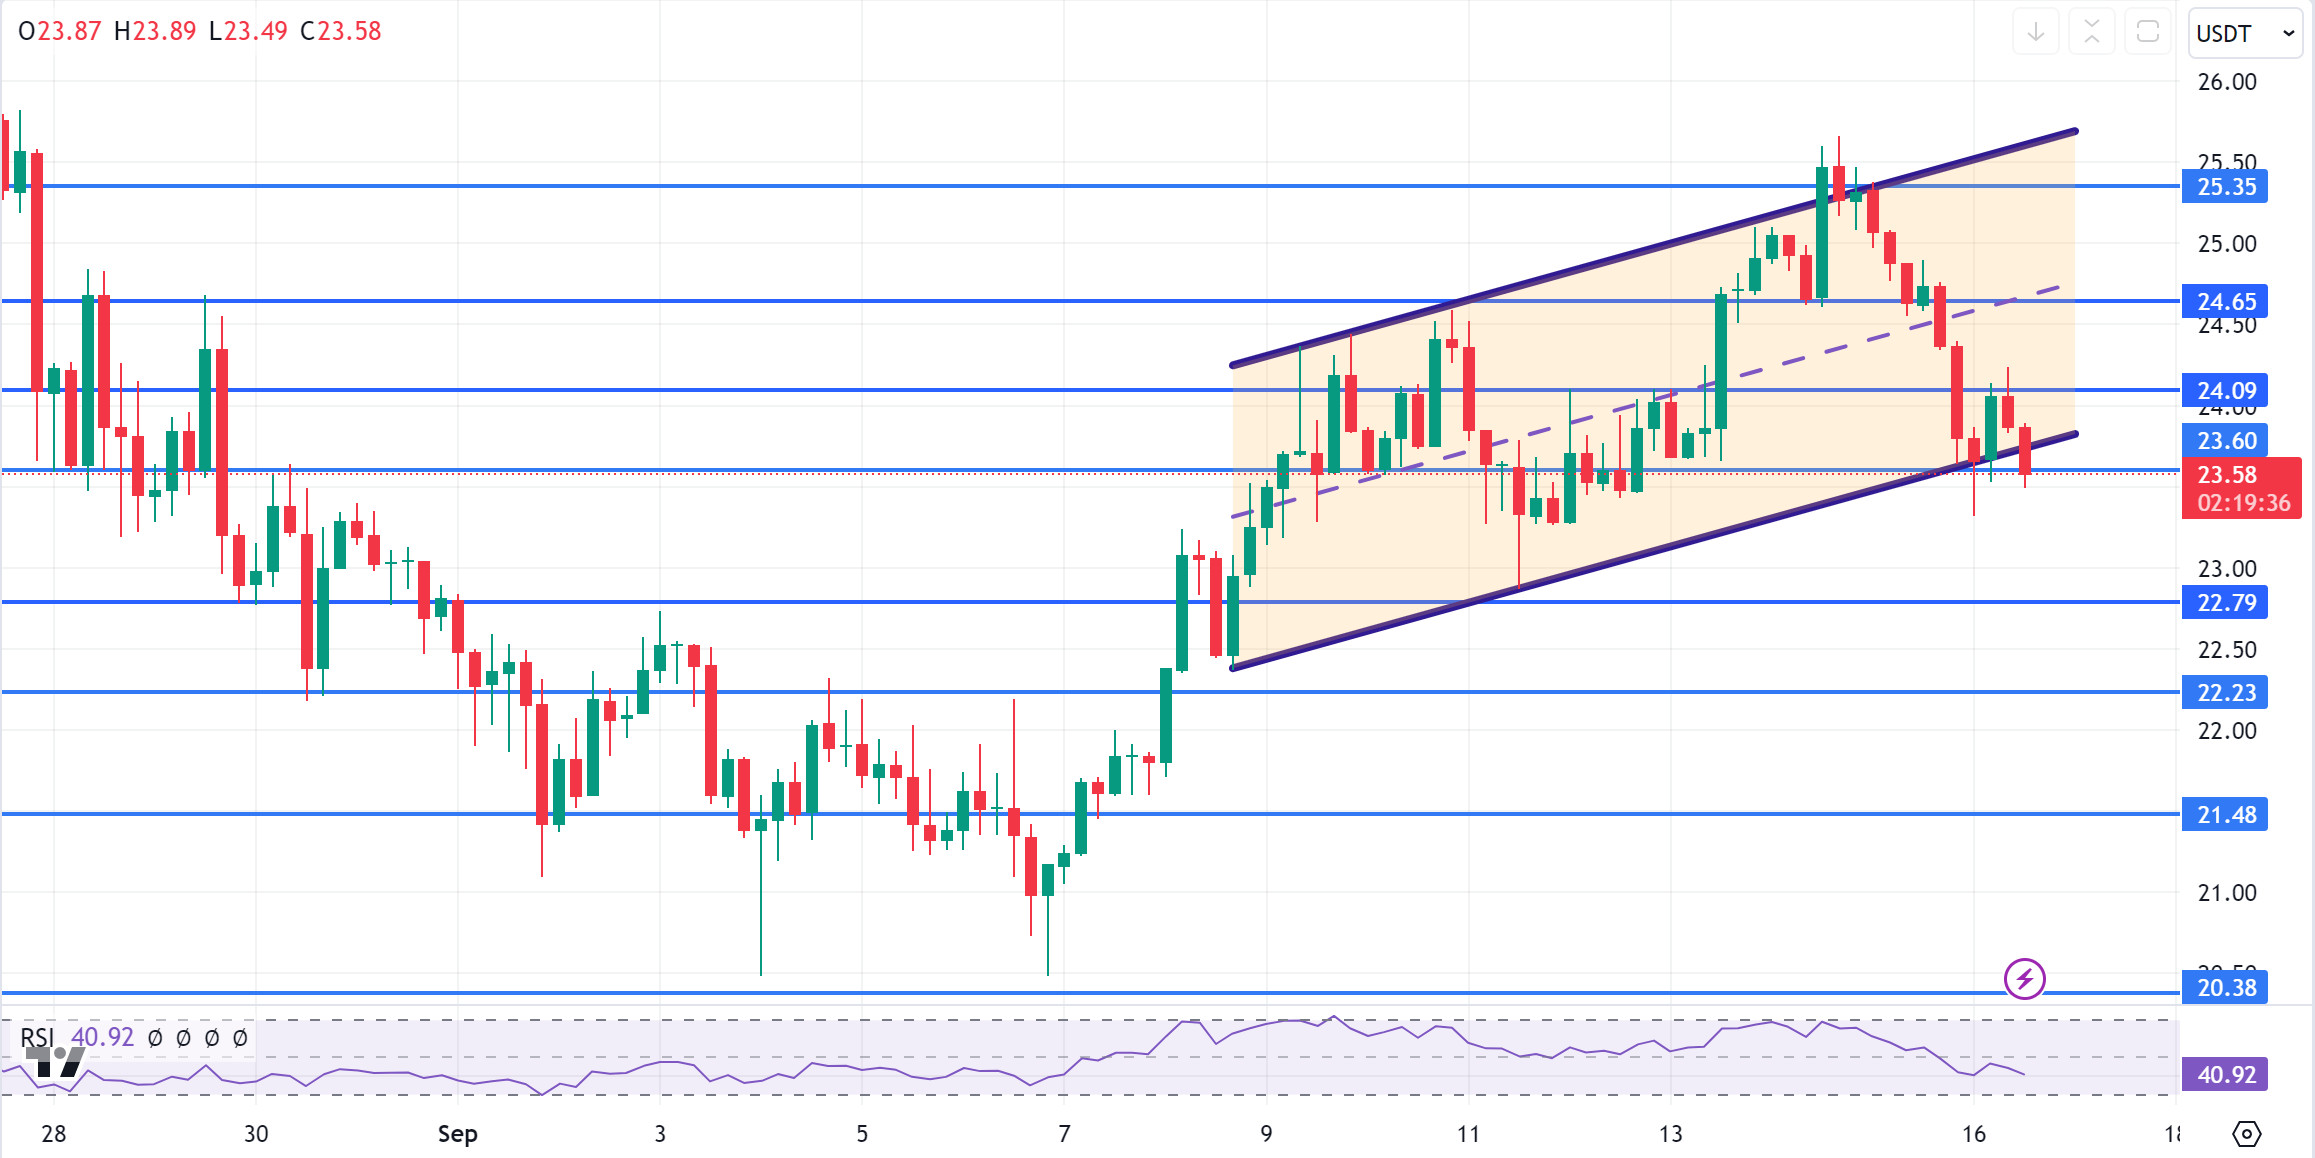
AVAX, which opened today at 23.80, is trading at 23.58 after the US stock market S&P 500 and Nasdaq indices started the week negatively.
On the 4-hour chart, it continues its movement within the rising channel. It is in the lower band of the channel and can be expected to move to the upper band of the channel with the reaction it will receive from here. In such a case, it may test the 24.65 resistance. On the other hand, it continues to test the 23.60 support and as a result of the candle closing below this support, it will break the channel downwards and then it may want to test the 22.79 support. As long as it stays above 20.38 support during the day, the desire to rise may continue. With the break of 20.38 support, selling pressure may increase.
Supports 23.60 – 22.79 – 22.23
Resistances 24.09 – 24.65 – 25.35
TRX/USDT
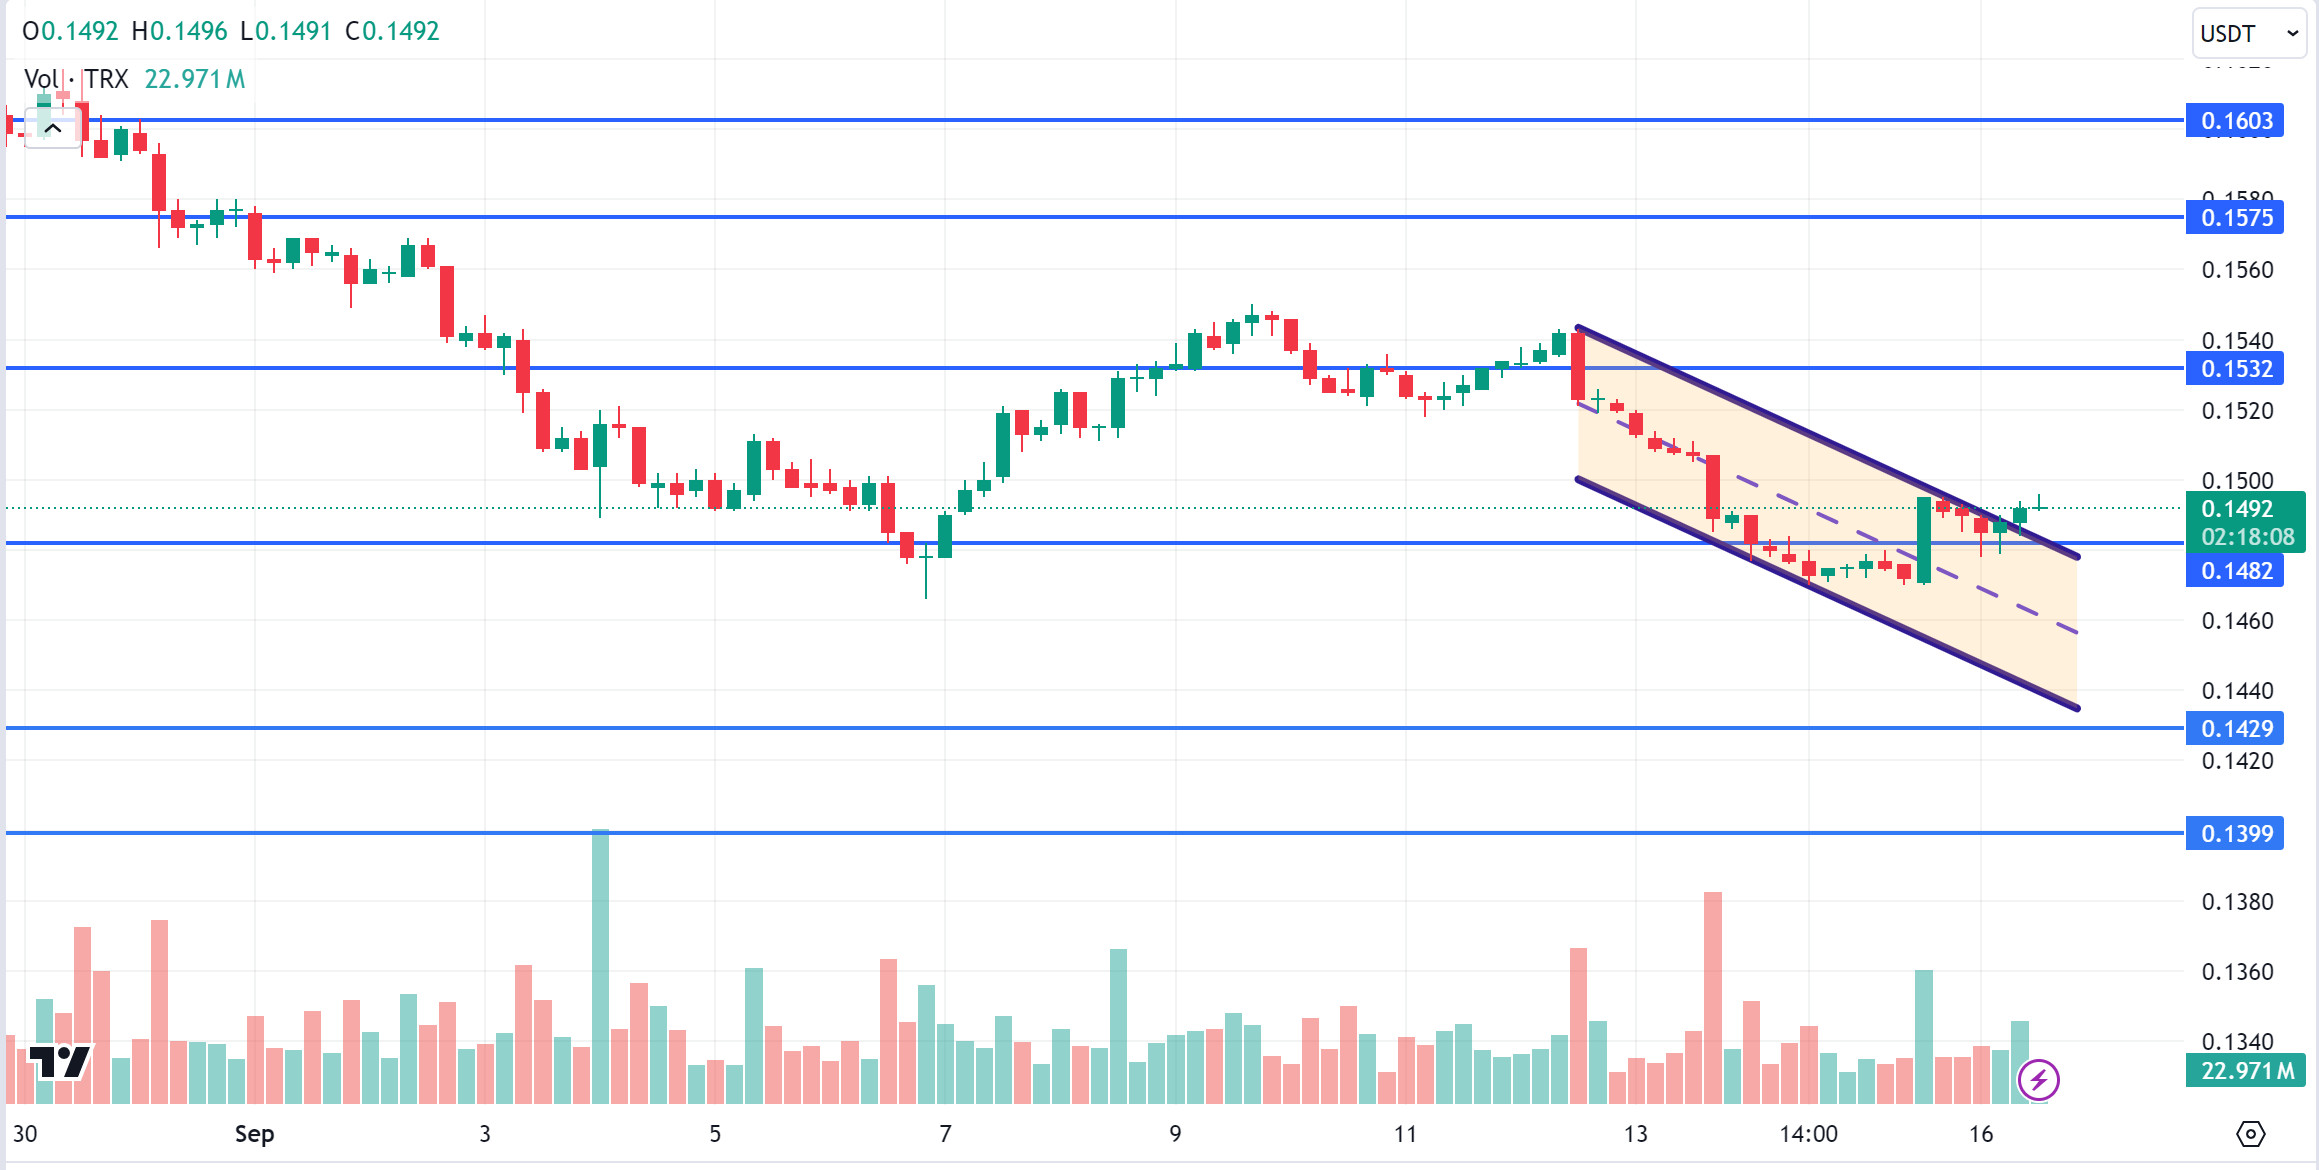
TRX, which started the day at 0.1489, increased slightly during the day and is trading at 0.1492.
TRX, which is currently trying to break the falling channel upwards on the 4-hour chart, may accelerate its rise with the candle closure above the 0.1532 resistance. In such a case, it may want to test the 0.1575 resistance. If it cannot break the 0.1532 resistance and sales pressure comes, it may move back to the middle and lower band of the channel. In this case, it may test 0.1482 support. As long as TRX stays above 0.1482 support, the desire to rise may continue. If this support is broken downwards, sales can be expected to increase.
Supports 0.1482 – 0.1429 – 0.1399
Resistances 0.1532 – 0.1575 – 0.1603
XRP/USDT
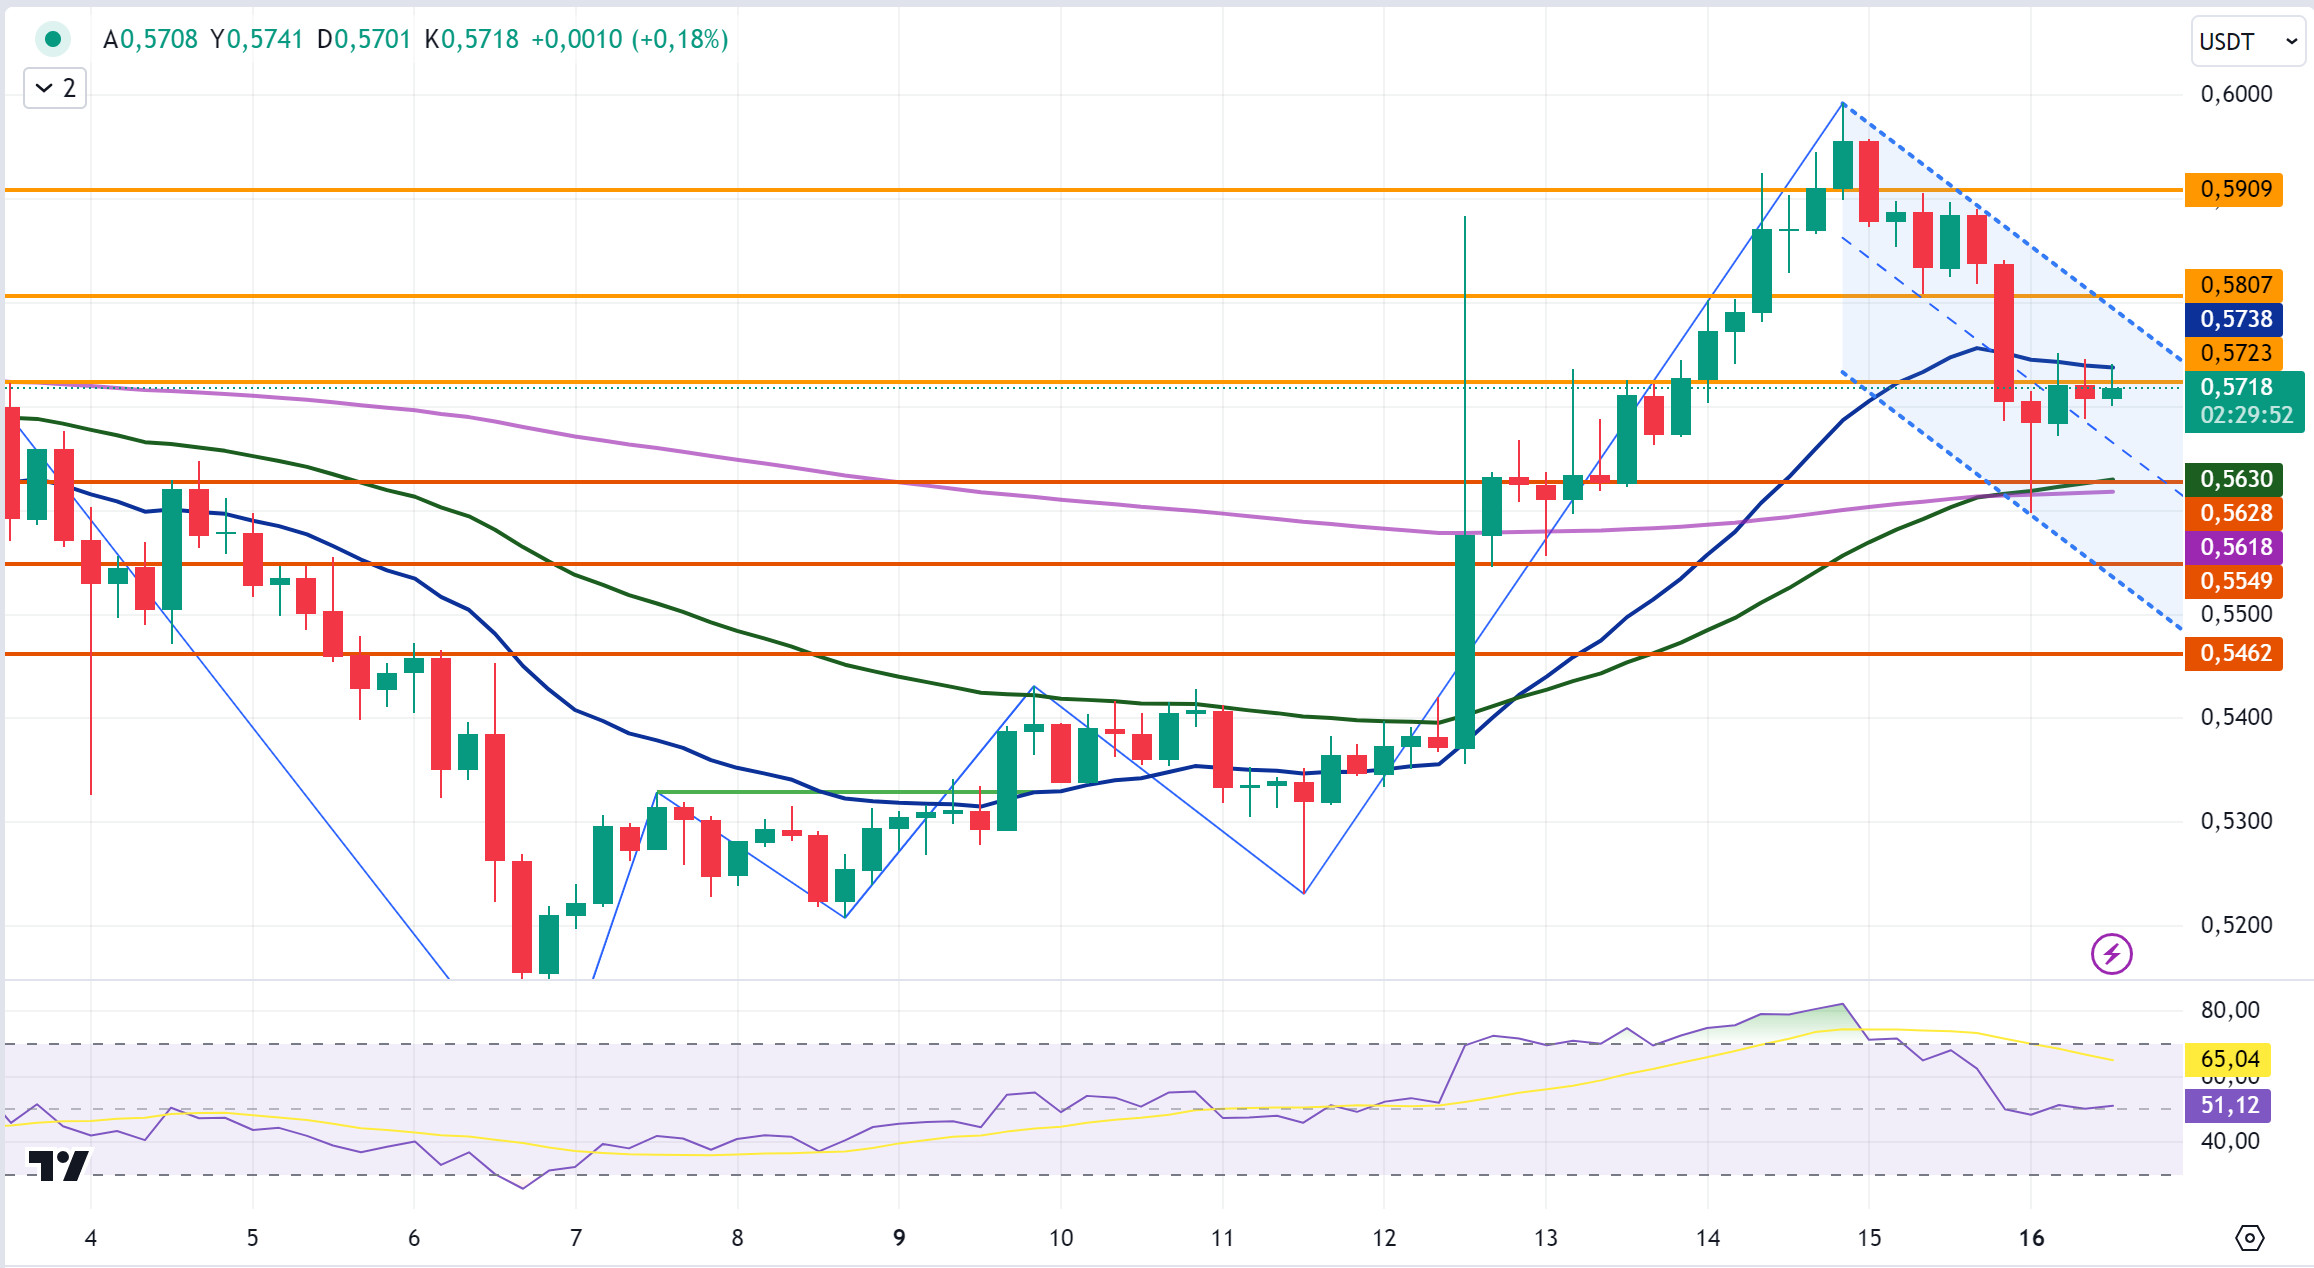
XRP, which started today at 0.5703, fell with the reaction sales at the EMA20 level in the 4-hour analysis and is currently trading at 0.5718. In the 4-hour analysis, on both candles before the last candle, XRP fell again below the 0.5723 resistance level with a decline after testing the EMA20 level and the candle closed. Today, in the 4-hour analysis, XRP continues to move in a horizontal band at 0.57. XRP may retest the EMA20 resistance level with the 0.5723 resistance level with its rise and may test the 0.5807-0.5909 resistance levels if it continues its rise by breaking it. On the contrary, it may test the 0.5628-0.5549-0.5462 support levels if it declines.
In the 4-hour analysis, it may offer a short trading opportunity with possible reaction sales at the EMA20 resistance level and a long trading opportunity with possible reaction purchases at the support levels of 0.5628, EMA50 and EMA200.
EMA20 (Blue Line) – EMA50 (Green Line) – EMA200 (Purple Line)
Supports 0.5628 – 0.5549 – 0. 5 462
Resistances 0.5723 – 0.5807 – 0.5 909
DOGE/USDT
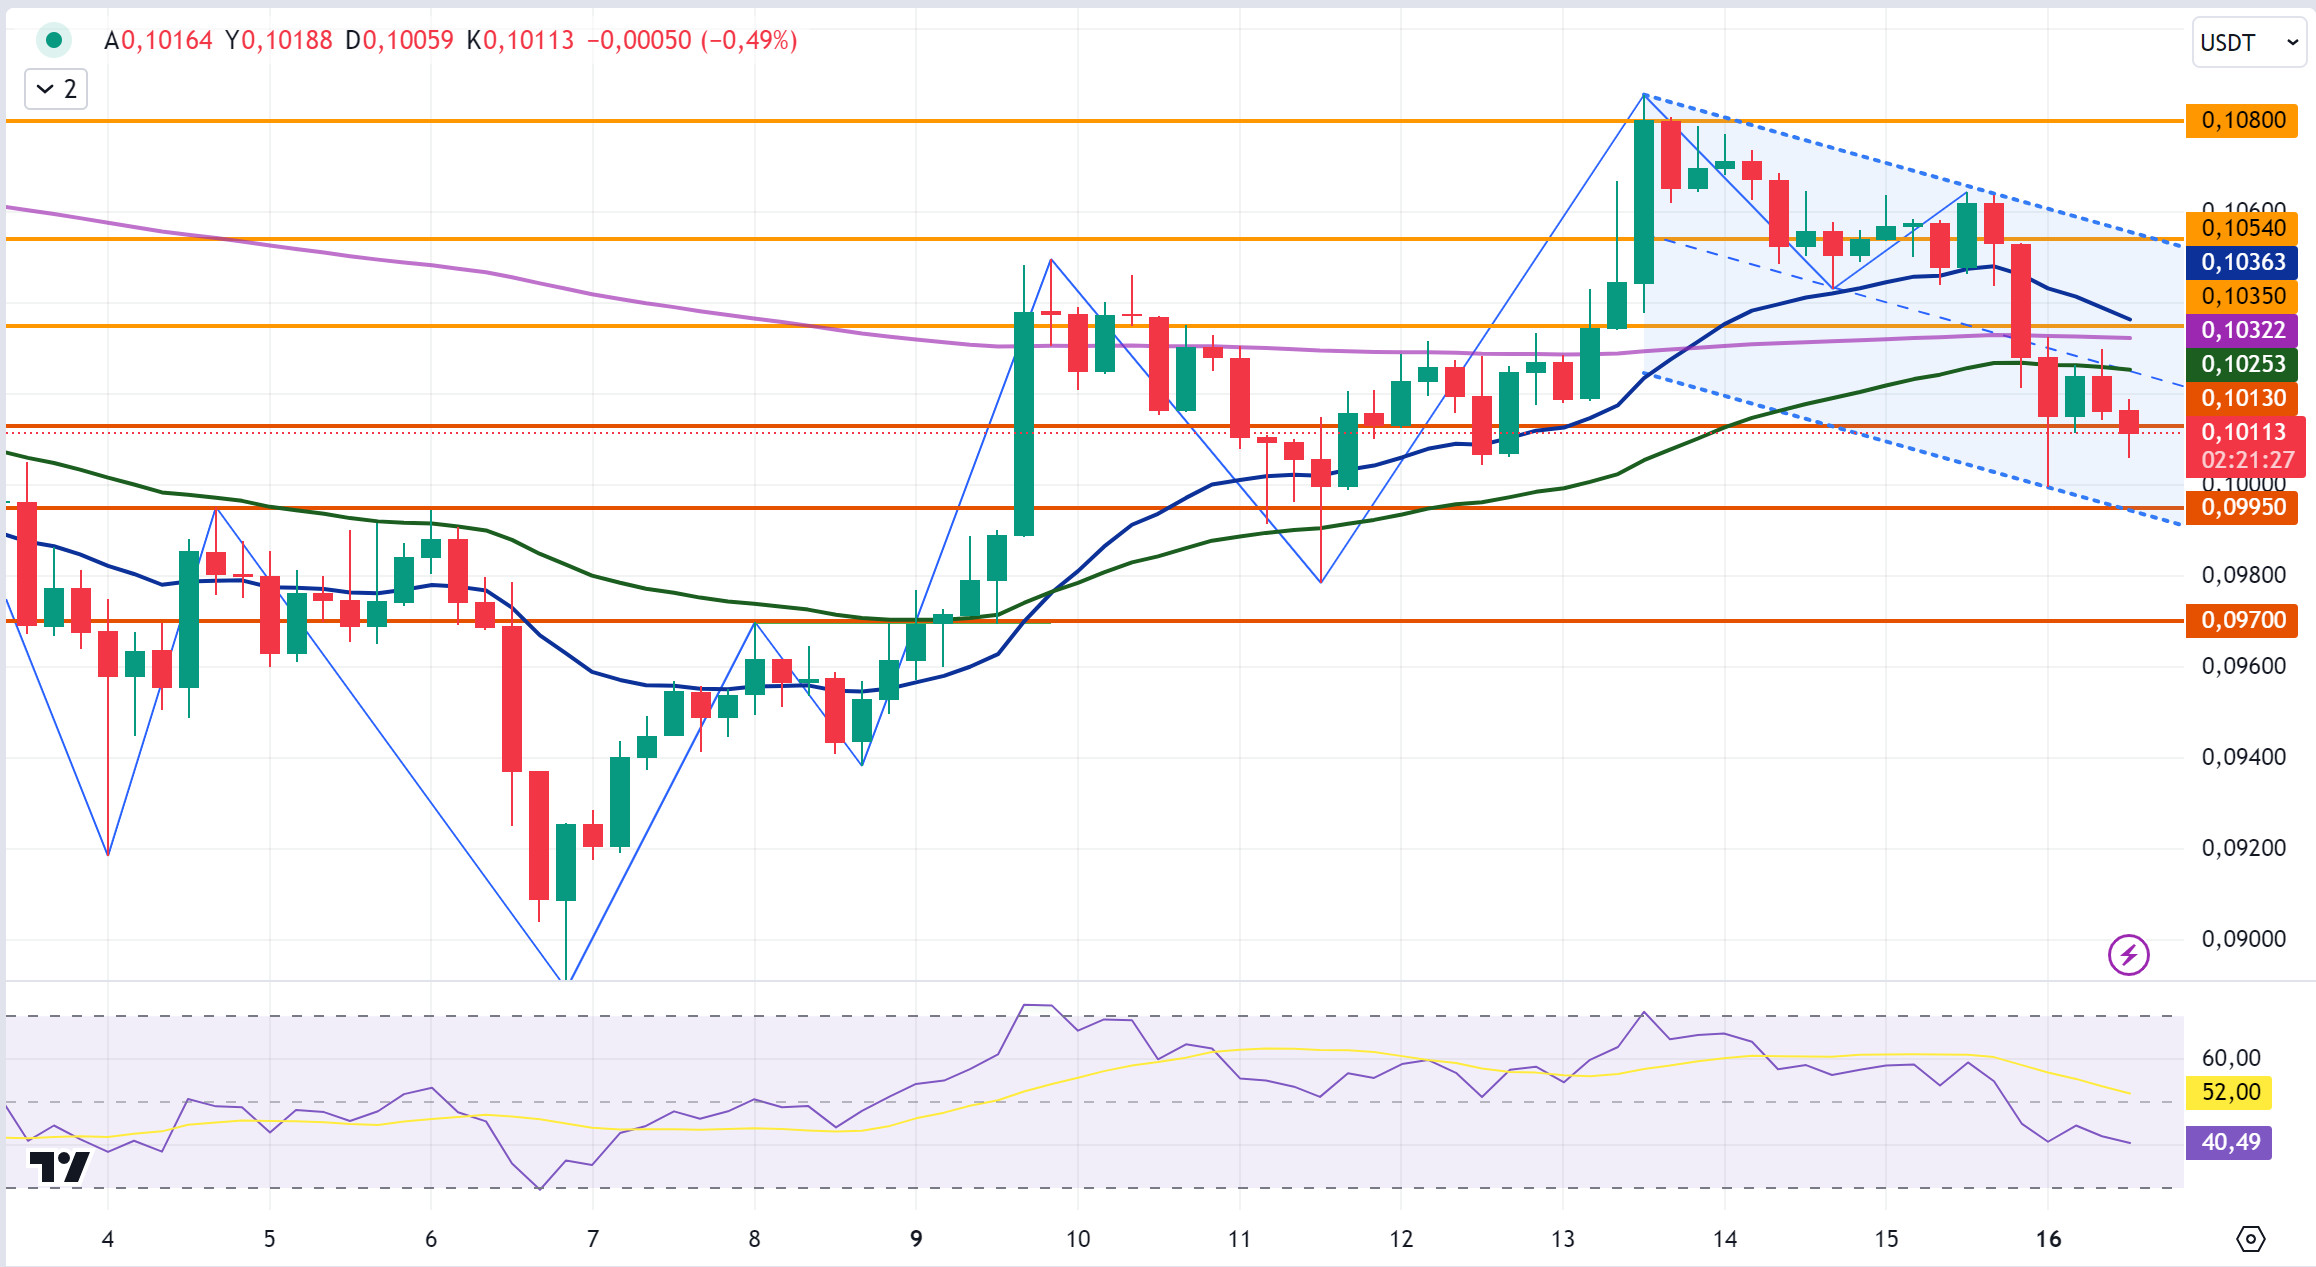
After starting today at 0.1027 after yesterday’s decline, DOGE continued its decline today and is currently trading at 0.1011. In the 4-hour analysis, DOGE, which rose with the recovery after falling in the opening candle today, fell again with the reaction sales at the EMA50 resistance level and continues to be traded below the 0.1013 support level after the decline in the last 2 candles. In the 4-hour analysis, with the candle closure below the 0.1013 support level and the DOGE in the falling channel, the support levels of 0.0995-0.0970 may test with the continued decline. If the candle closure is above the 0.1013 support level, DOGE may retest the EMA50 level and if it breaks, it may test the 0.1035-0.1054-0.1080 resistance levels in the continuation of the rise.
EMA20 (Blue Line) – EMA50 (Green Line) – EMA200 (Purple Line)
Supports 0.1013 – 0.0995 – 0.0970
Resistances 0.1035 – 0.1 054 – 0.1080
DOT/USDT
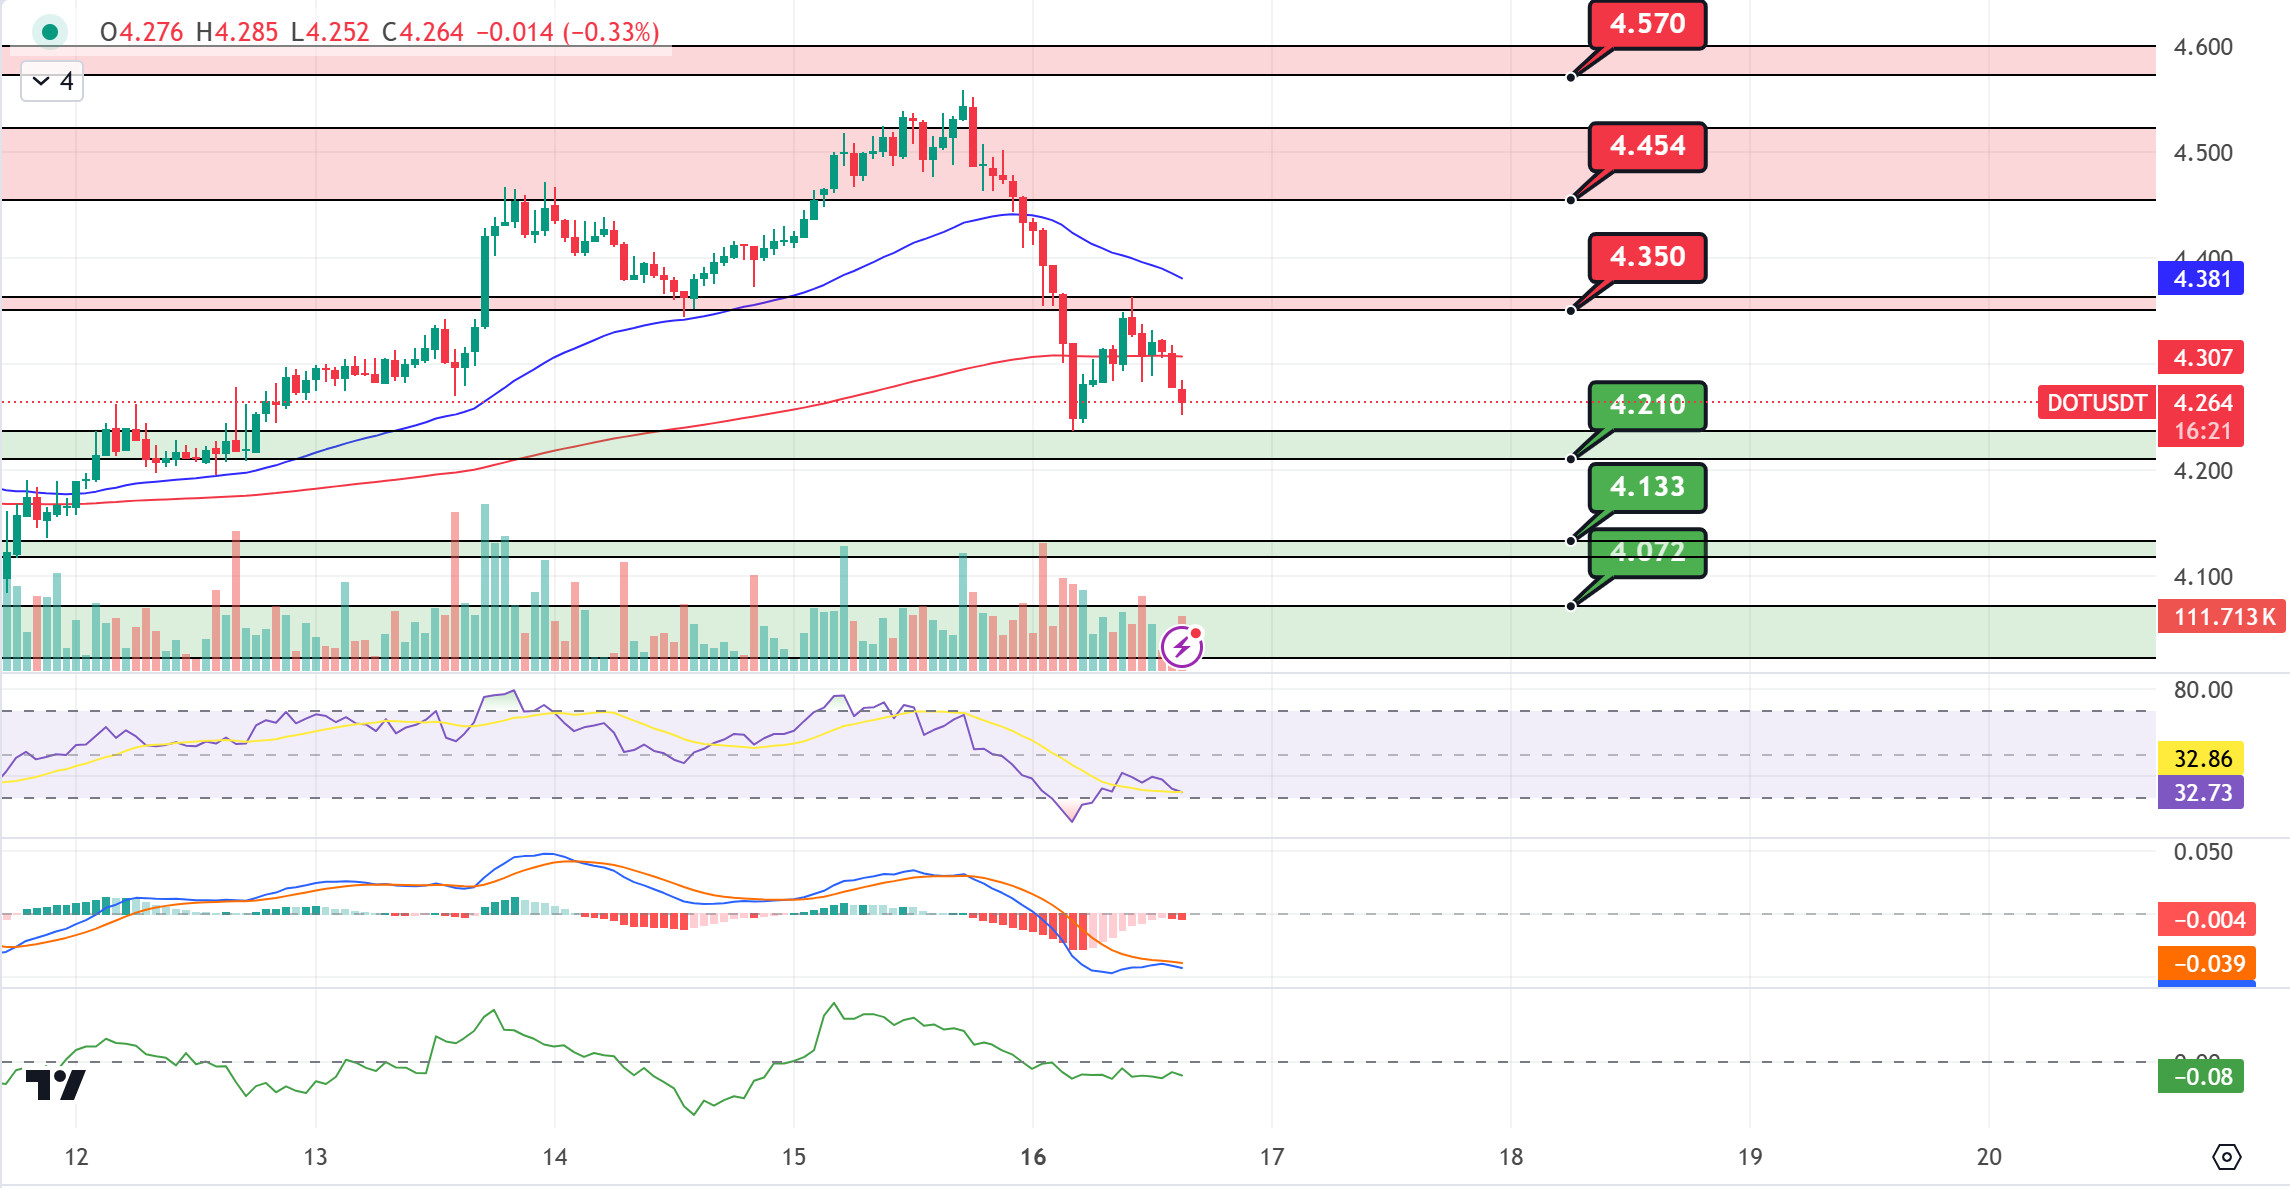
When we examine the Polkadot (DOT) chart, we see that the price reacted from the 4,210 level and rejected the 4,350 resistance. When we examine the MACD oscillator, we can say that the selling pressure has decreased compared to the previous hour. In the positive scenario, if the price maintains above the EMA200 level, it may want to break the selling pressure at the 4,350 resistance level. In the negative scenario, according to the CMF oscillator, selling pressure seems to be more dominant than buying pressure. A break below the 4,210 support level may bring a move towards the next support level of 4,133.
(Blue line: EMA50, Red line: EMA200)
Supports 4,210 – -4,133 – 4,072
Resistances 4.350 – 4.454 – 4.570
SHIB/USDT
The Shiba Inu community is expressing disappointment that the BONE token is still not listed by Binance. Although BONE has an important role as ShibaSwap’s governance token, Binance has prioritized other projects. Lucie, Shiba Inu’s marketing lead, stated that Binance prioritized short-term gains due to lack of liquidity and competition. The community remains hopeful about BONE’s future listing as it continues to focus on organic growth.
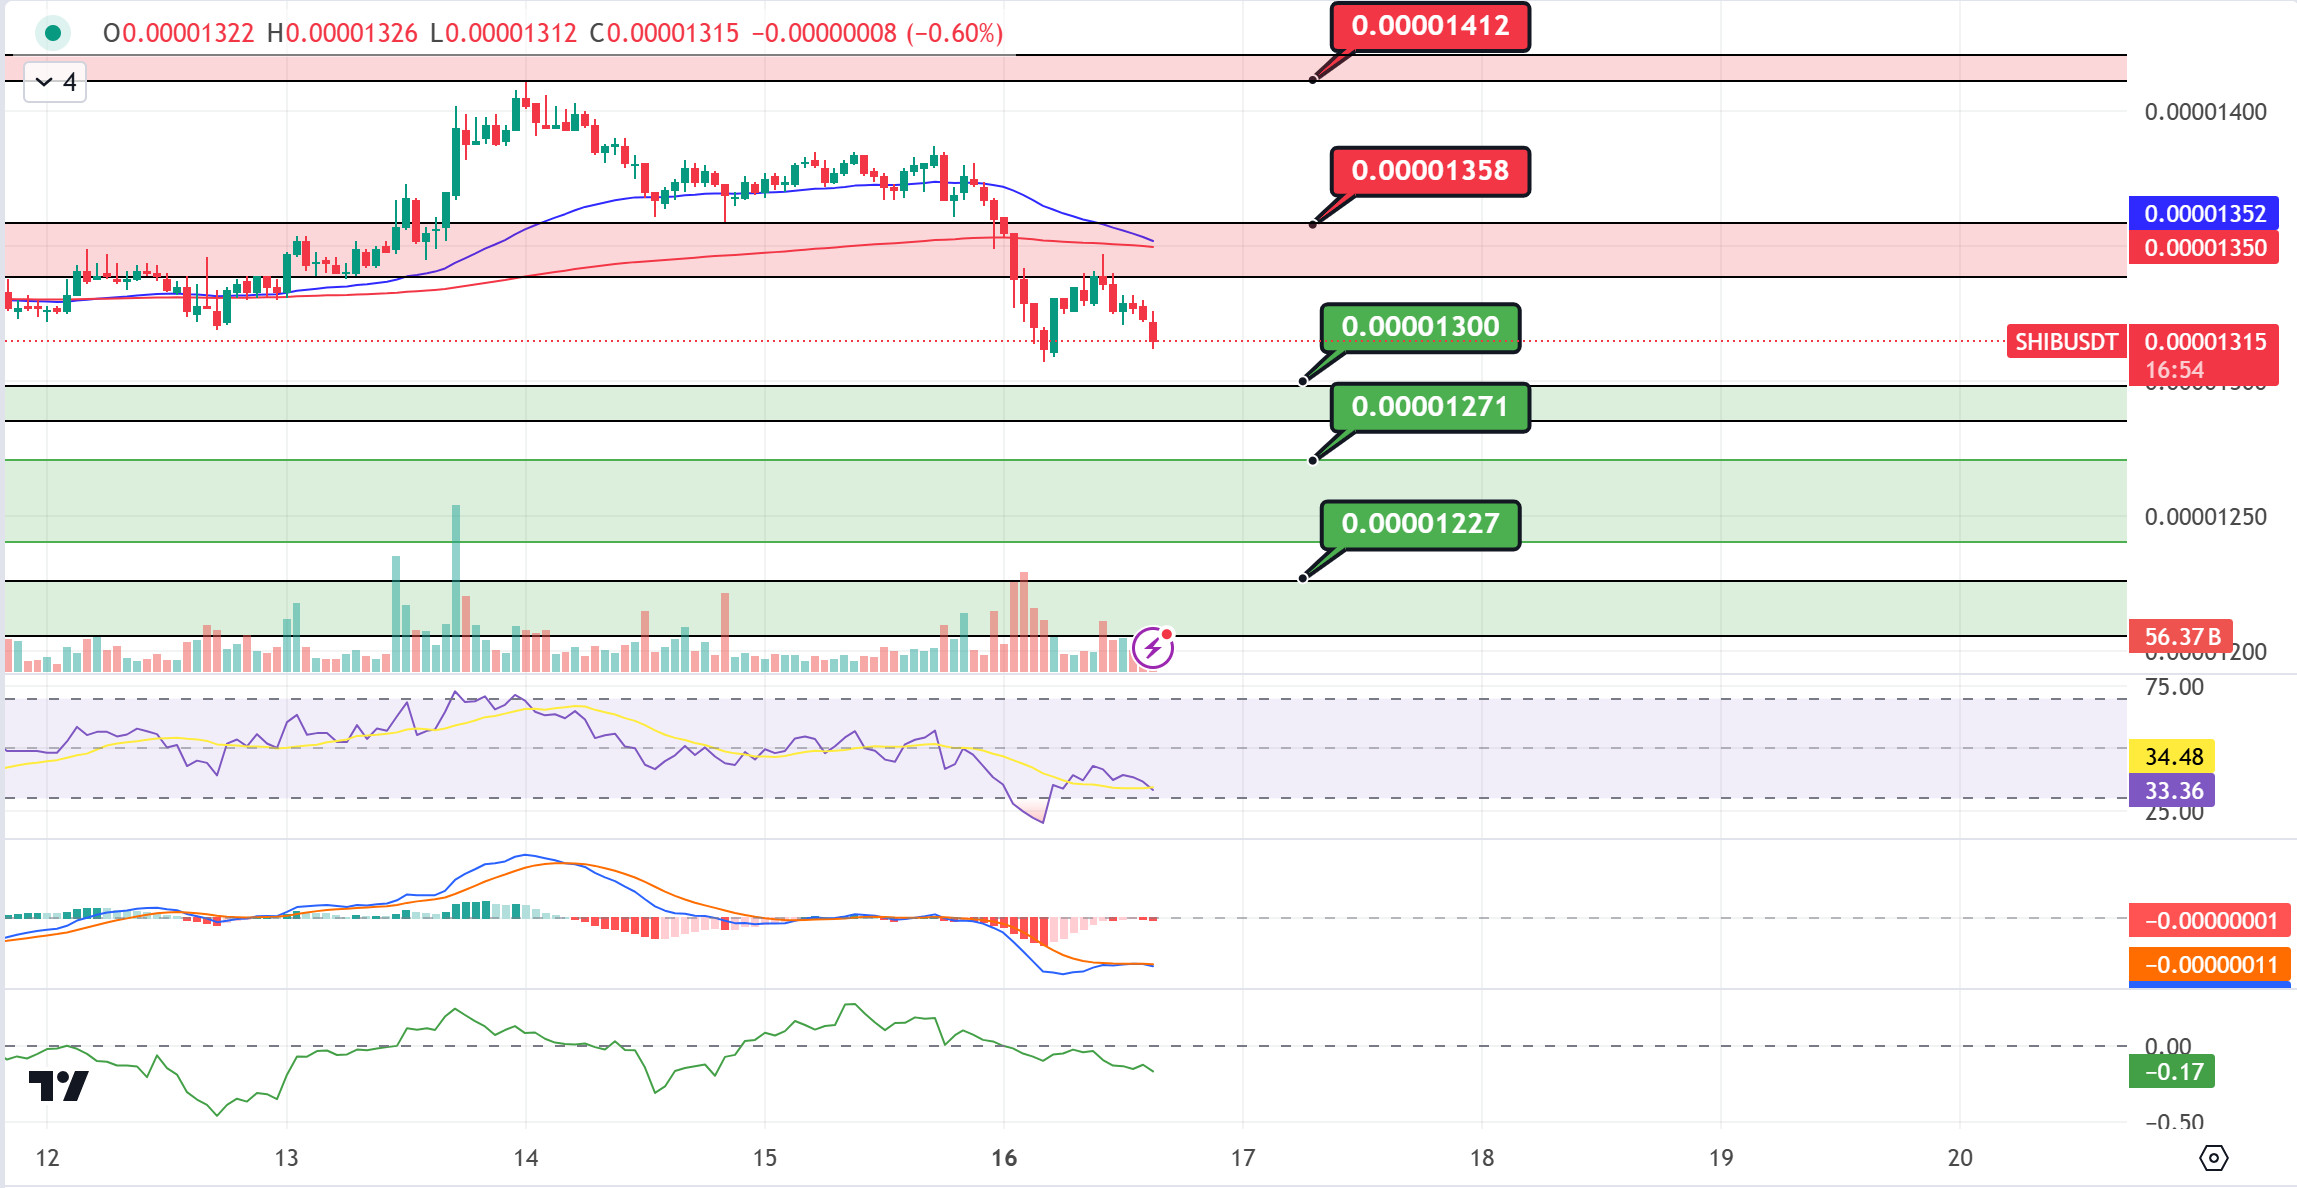
When we examine the SHIB chart, the price seems to be rejected from the 0.00001358 resistance band. In case the EMA50 breaks below the EMA200 (Death Cross), the selling pressure may deepen. When we analyze the CMF oscillator, the selling pressure seems to be more than the buying pressure. If the price retreats to the 0.00001300 support and fails to hold here, the decline towards the next support level of 0.00001271 may deepen. On the other hand, we see that the selling pressure on MACD has decreased compared to the previous hour. If the price can break the selling pressure at the 0.00001358 resistance band from these levels and maintain above the 0.00001358 level, the next target may be the 0.00001412 resistance level.
(Blue line: EMA50, Red line: EMA200)
Supports 0.00001300 – 0.00001271 – 0.00001227
Resistances 0.00001358 – 0.00001412 – 0.00001443
LEGAL NOTICE
The investment information, comments and recommendations contained herein do not constitute investment advice. Investment advisory services are provided individually by authorized institutions taking into account the risk and return preferences of individuals. The comments and recommendations contained herein are of a general nature. These recommendations may not be suitable for your financial situation and risk and return preferences. Therefore, making an investment decision based solely on the information contained herein may not produce results in line with your expectations.
