MARKET SUMMARY
Latest Situation in Crypto Assets
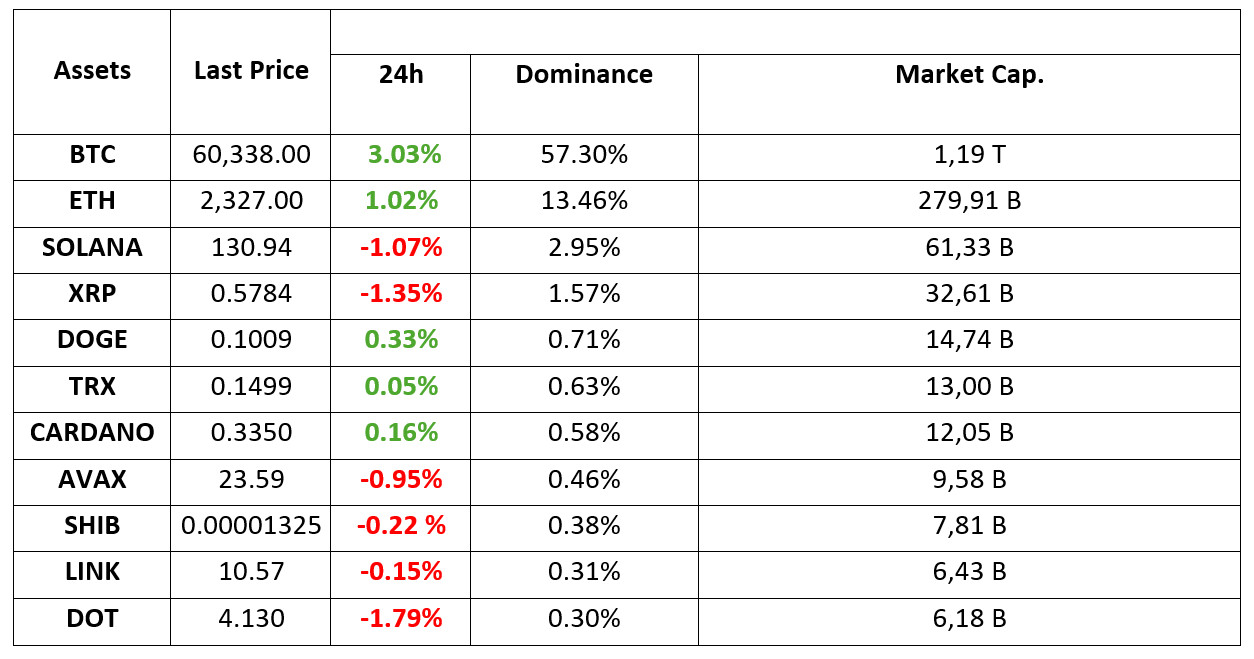
*Prepared on 18.09.2024 at 07:00 (UTC)
https://academy.darkex.com/market-pulse/the-expected-week-has-arrived-fed-rate-cut
TECHNICAL ANALYSIS
BTC/USDT
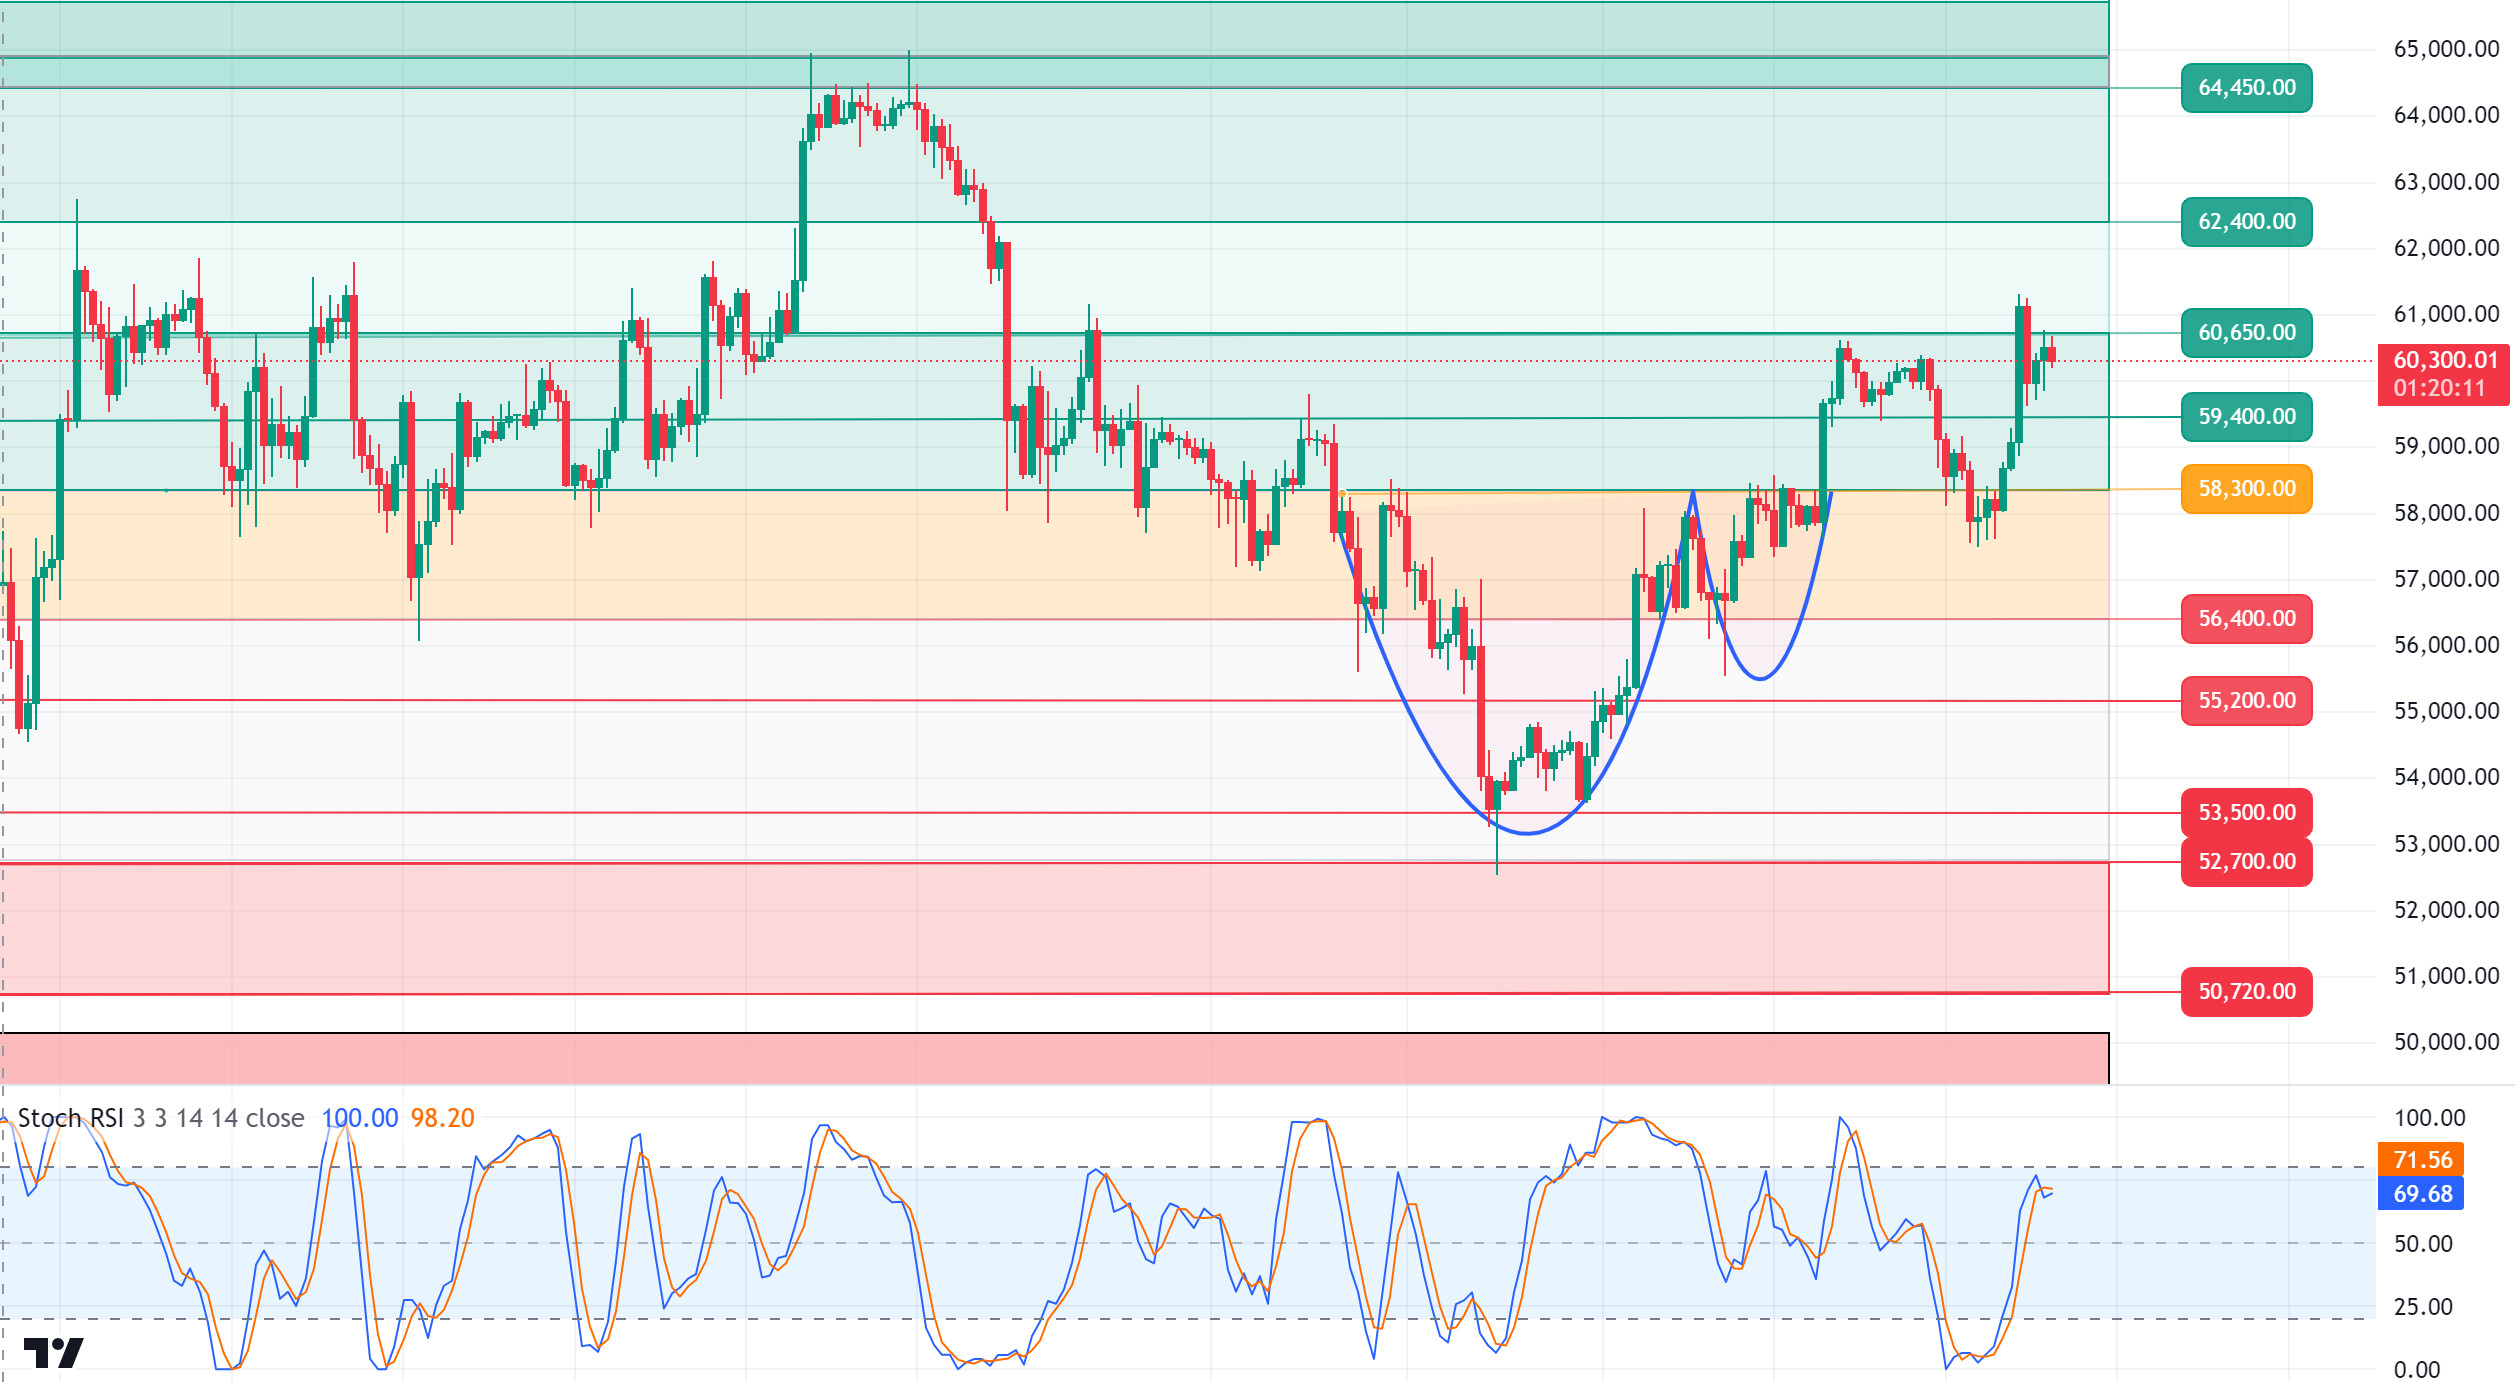
The day the markets have been eagerly waiting for has arrived! The meeting, where the FED is expected to cut interest rates after four years, is of great importance for the markets. If we recapitulate some of the data that will push the FED, which last cut interest rates twice in March 2020, to this decision; recession concerns were felt again after the lower-than-expected Non-Farm Payrolls data, but inflation, which fell from 2.9% to 2.5% on an annual basis within expectations, also strengthened the possibility of a rate cut by the FED. Afterwards, FED Chairman Powell stated that the timing of interest rate cuts was critical and that high interest rates were hurting the labor market and economic growth, pointing out that they would start rate cuts at the September meeting. With the arrival of the expected day, 61% of the latest FedWatch interest rate cut expectations stand out with a 50 basis point cut expectation. We can say that the discount level to be made is critical for the markets and volatility may increase. In the BTC 4-hour technical analysis, we saw that yesterday, with the SEC filing criminal complaints against two cryptocurrency platforms, the price retreated from the resistance level of 60,650 to 59,600. Then, with significant inflows into spot Bitcoin ETFs, an important factor that triggered BTC’s rise again, the price is currently trading at 60,300. On this day, when we are getting closer to the interest rate decision with each passing minute, we think that the level at which BTC will meet the interest rate decision is important in terms of breakout in determining the direction. In the event that it is priced between 60,650 and 60,850, which we have long stated as psychological resistance, it may break sharply upwards with the expected interest rate cut. Otherwise, the downward loss of these levels may bring a deep retracement and may create a reverse trading opportunity for short-term investors.
Supports 59,400 – 58,300- 57,200
Resistances 60,650 – 62,400 – 64,450
ETH/USDT
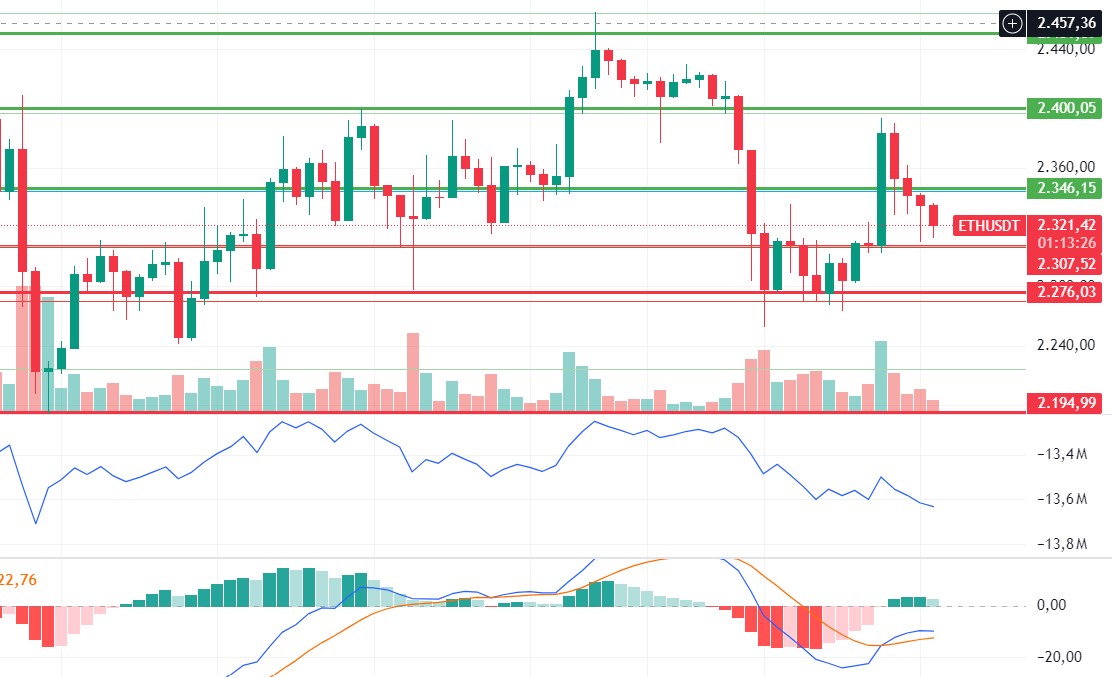
Ethereum, which fell back to 2,300 levels after yesterday’s rise, is currently pricing above the 2,325 level. The biggest weakness in Ethereum is the gradual decline in the buying appetite on the spot side. Looking at CVD spot and futures, the uptrend appears to be supported by futures. In the light of this data, it seems important to closely monitor spot buying volumes in order to predict the resumption of a positive trend. Technically, the positive mismatch in OBV and the MACD turning positive again stand out. Exceeding 2,346, which is the Kijun level and also the 0.618 fib level, may bring a rise up to 2,400 again. Closes below 2,307 may bring declines to 2,276 and then to 2,195.
Supports 2,276 – 2,195 – 2,112
Resistances 2,346 – 2,400 – 2,451
LINK/USDT
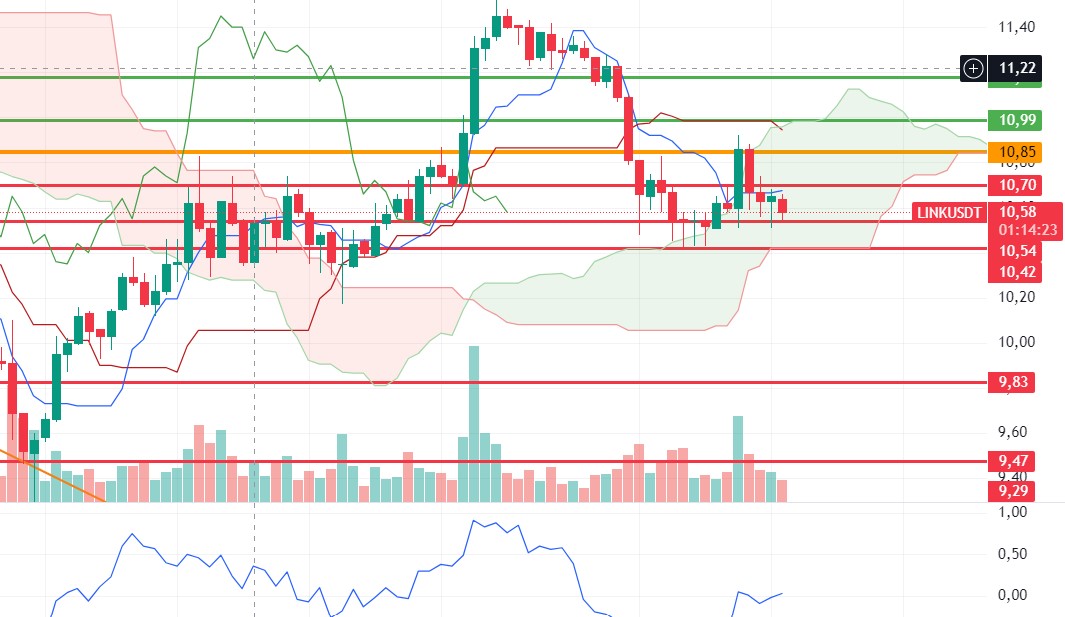
LINK rallied yesterday, reaching the main resistance level of 10.85 before being rejected at 10.54 support. Although the price retraced again, the positive momentum suggests that LINK could experience very rapid rises if Ethereum allows it. In this context, a break of the most important resistance level of 10.85 could start an uptrend. The Kumo cloud support at 10.42 is the main support level, which, if broken, could lead to deep declines.
Supports 10.54 – 10.42 – 9.83
Resistances 10.70 – 10.85 – 10.99
SOL/USDT
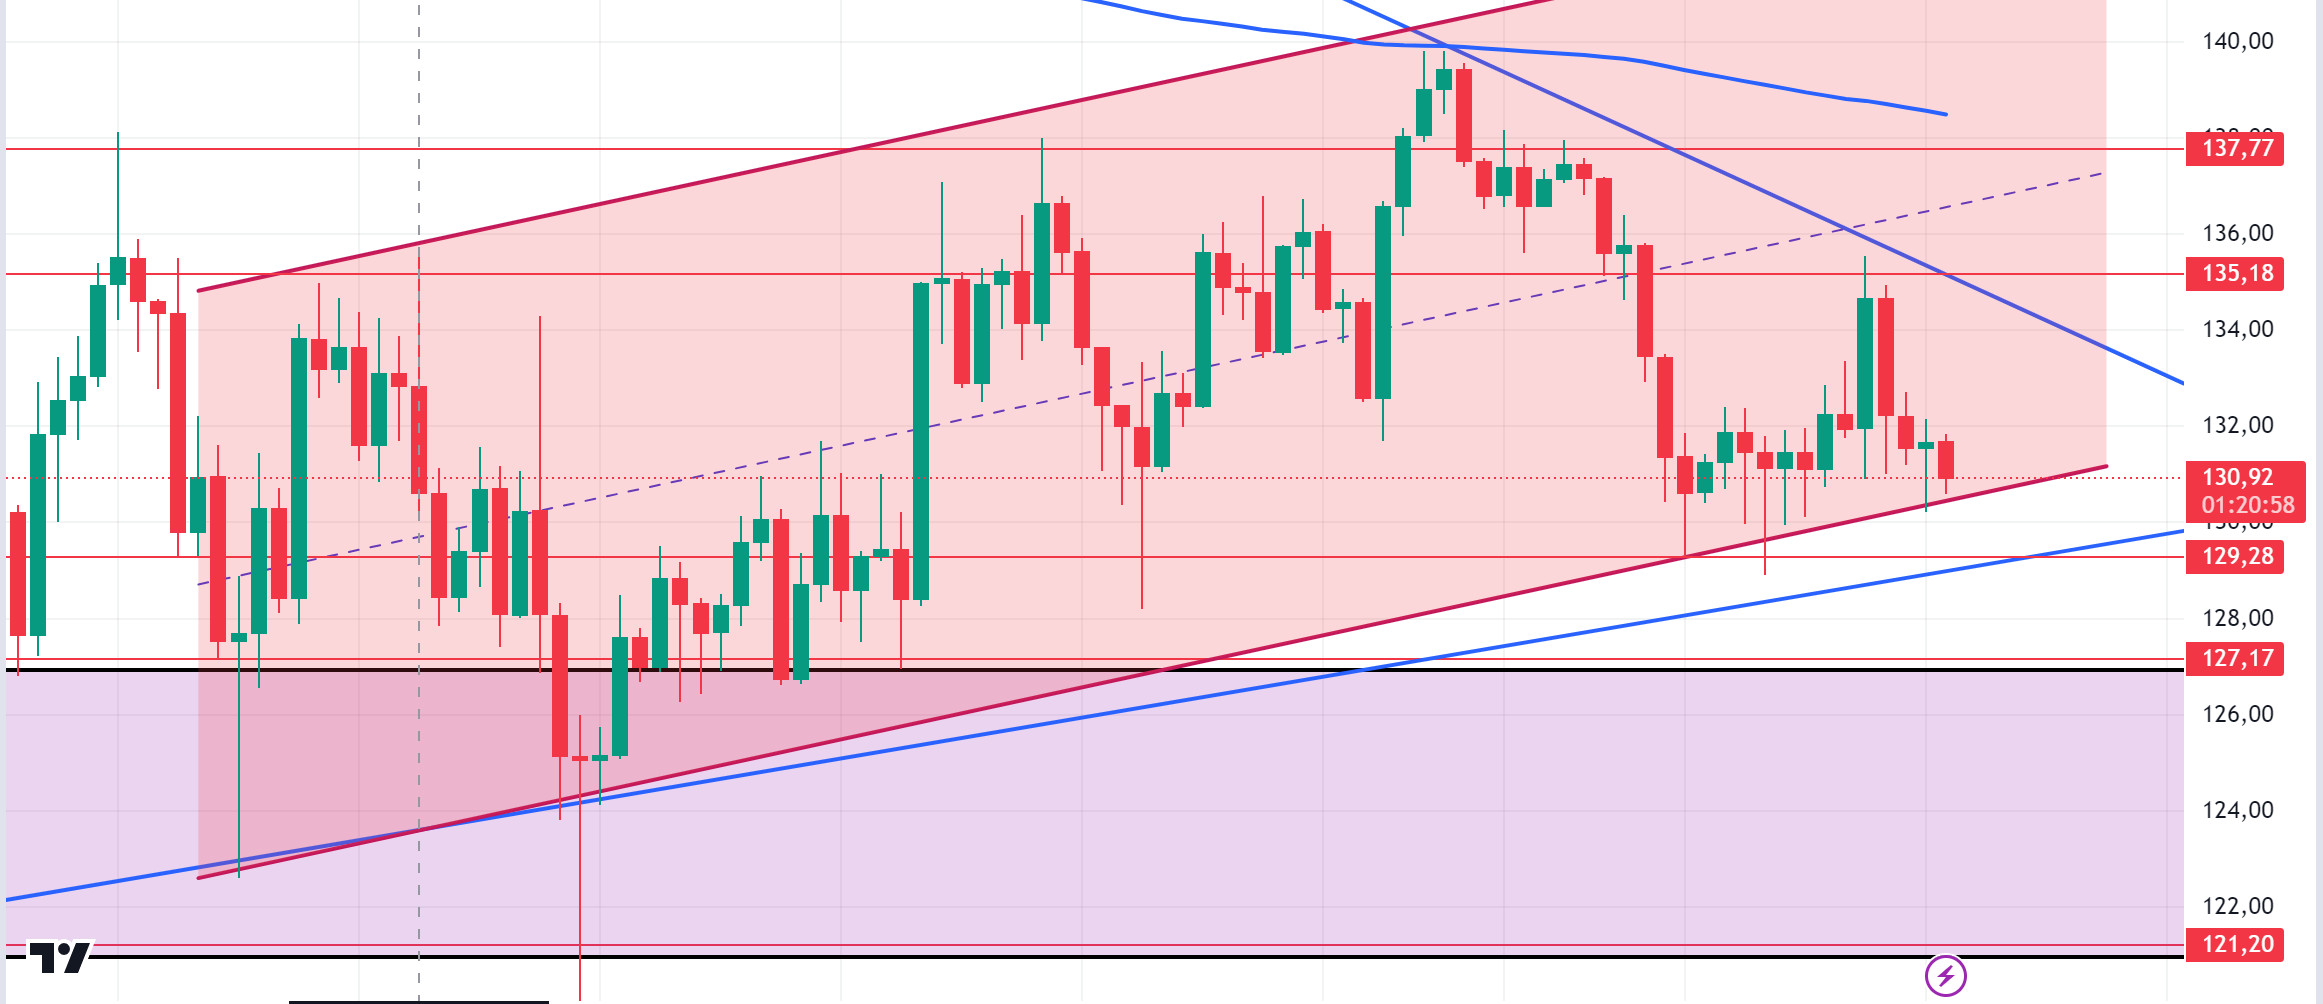
The critical day has arrived. The FED interest rate decision from the US is a very important data. According to the data from CME, the forecast for a 50 basis point rate cut is 65%. The upcoming data may create a long-term trend as it will affect future interest rates in the future. Solana price has managed to hold above the support level by pricing horizontally since our analysis in the morning. This could lead to a bullish rally ahead. On the other hand, as long as it stays above 129.28, the upward movement can be followed. However, according to information from Coinglass, Solana’s open interest data showed a gradual increase. Yesterday, open interest data was at 2.12 billion dollars, the highest level this month. At the same time, another metric, active addresses, is increasing. Data from Artemis shows that Solana’s monthly active addresses reached an all-time high. This is usually a bullish indicator. Solana traded in a narrowing triangle pattern for a long period of time. An increase in open interest and fund flows may support the bullish trend. At the same time, SOL, which has been rising from the support zone of the channel it has formed since September 4, may prepare the ground for an upward movement. Both macroeconomic conditions and innovations in the Solana ecosystem appear as resistance levels 135.18 – 137.77. If it rises above these levels, the rise may continue. It should be noted that the price has not yet broken above the 200 EMA. In the event that investors move in the opposite direction due to possible macroeconomic news and the rise in BTC dominance, a potential rise should be followed if it reaches the support levels of 129.28 – 127.17.
Supports 129.28 – 127.17 – 121.20
Resistances 135.18 – 137.77 – 147.40
ADA/USDT
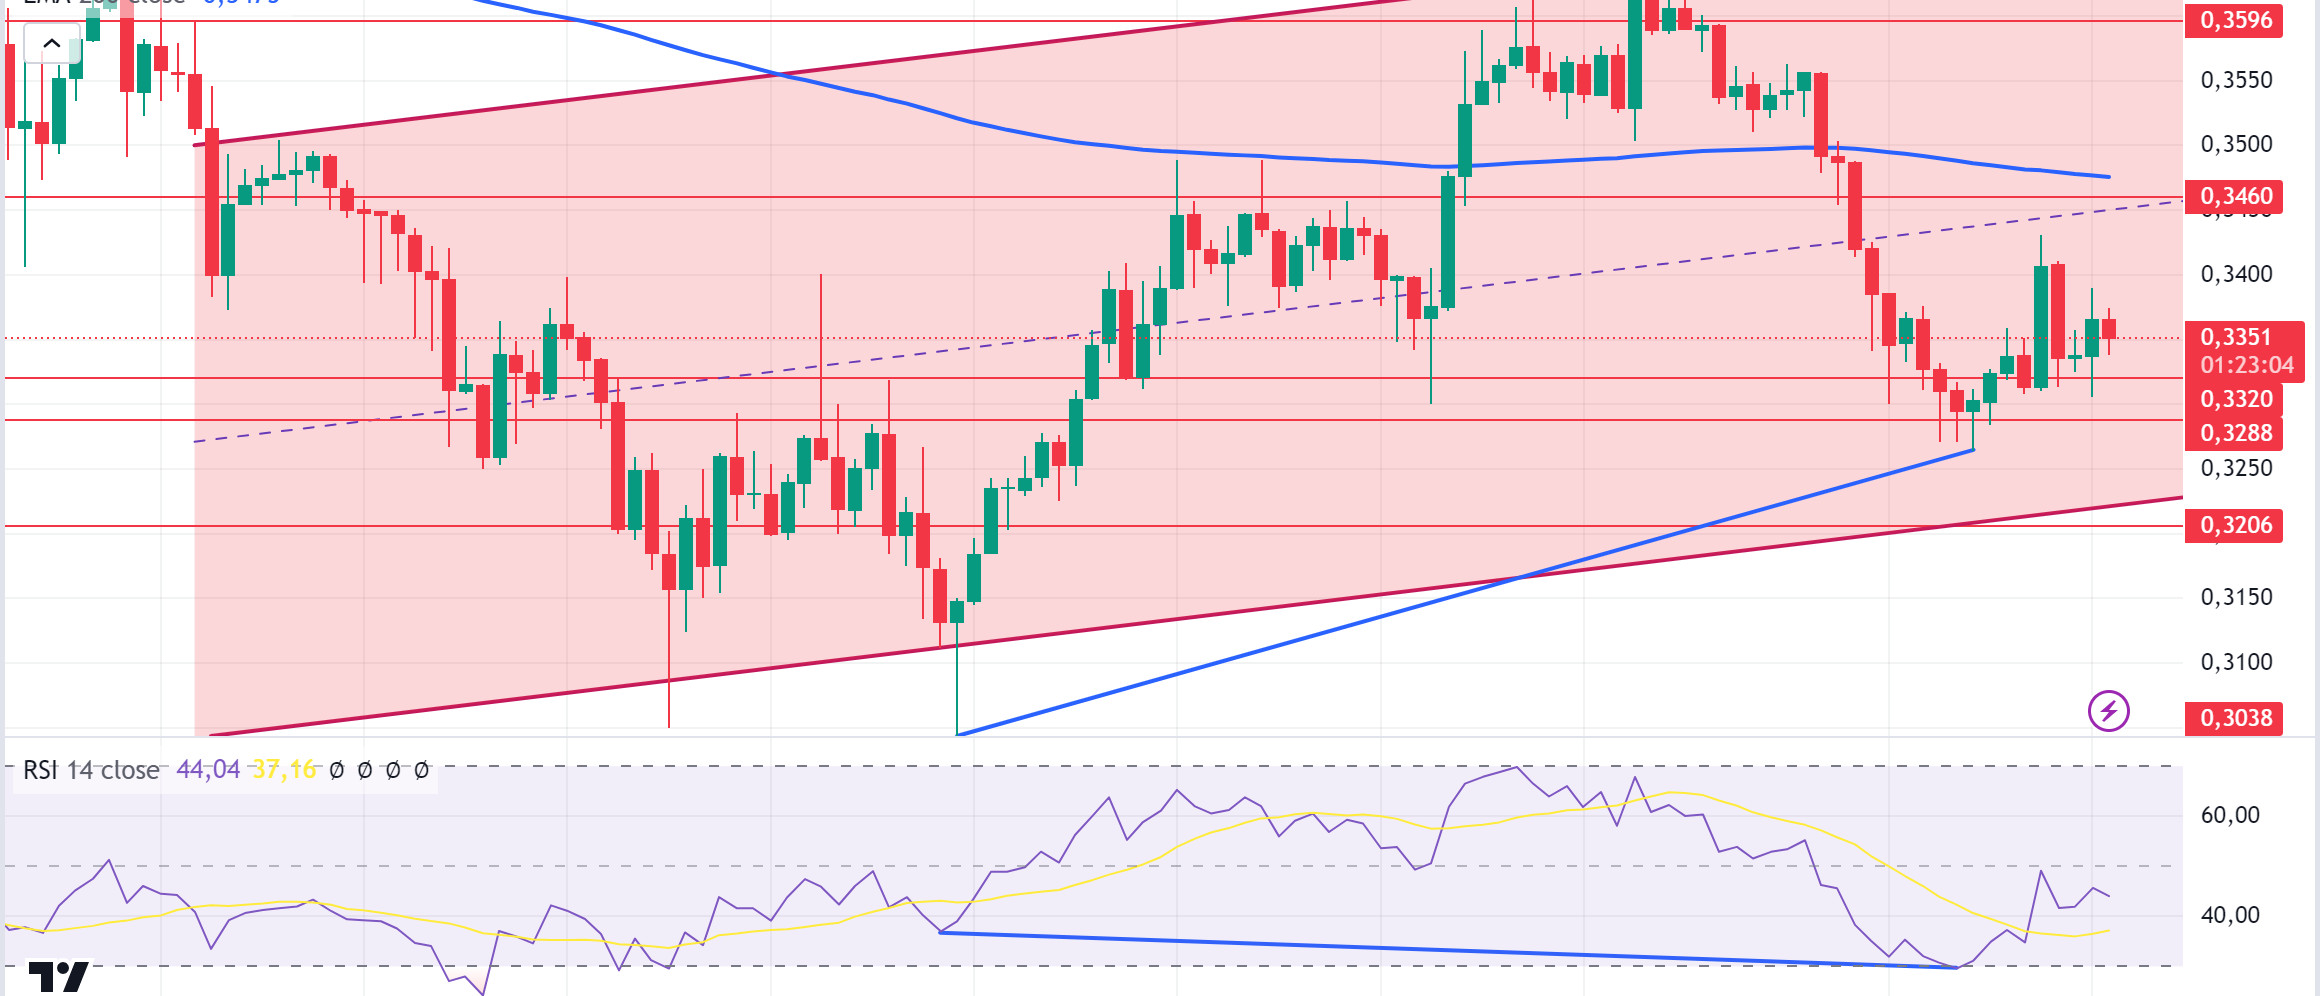
The critical day has arrived. The FED interest rate decision coming from the US is a very important data. According to the data from CME, the forecast for a 50 basis point rate cut is 65%. The upcoming data may create a long-term trend as it will affect future interest rates in the future. According to data from IntoTheBlock, Cardano Whales bought 19.5 billion ADA tokens worth $6.48 billion the other day. At the same time, whale purchases have increased. Technically speaking, Cardano has been pricing in the falling channel for the last five months. For ADA, the 0.3288 level may be the bottom of the correction. When we look at the RSI indicator, there is a mismatch on the 4-hour chart. This could be a bullish harbinger. On the other hand, ADA continues to stay below the EMA200 moving average. This shows us that there is still bearish pressure. Despite this, its price is hovering above a critical resistance. 0.3320 is a strong support in case of a pullback due to general market movements. In the event that macroeconomic data raises BTC, 0.3460 – 0.3596 levels can be followed as resistance levels.
Supports 0.3320 – 0.3288 – 0.3206
Resistances 0.3460 – 0.3596 – 0.3724
AVAX/USDT
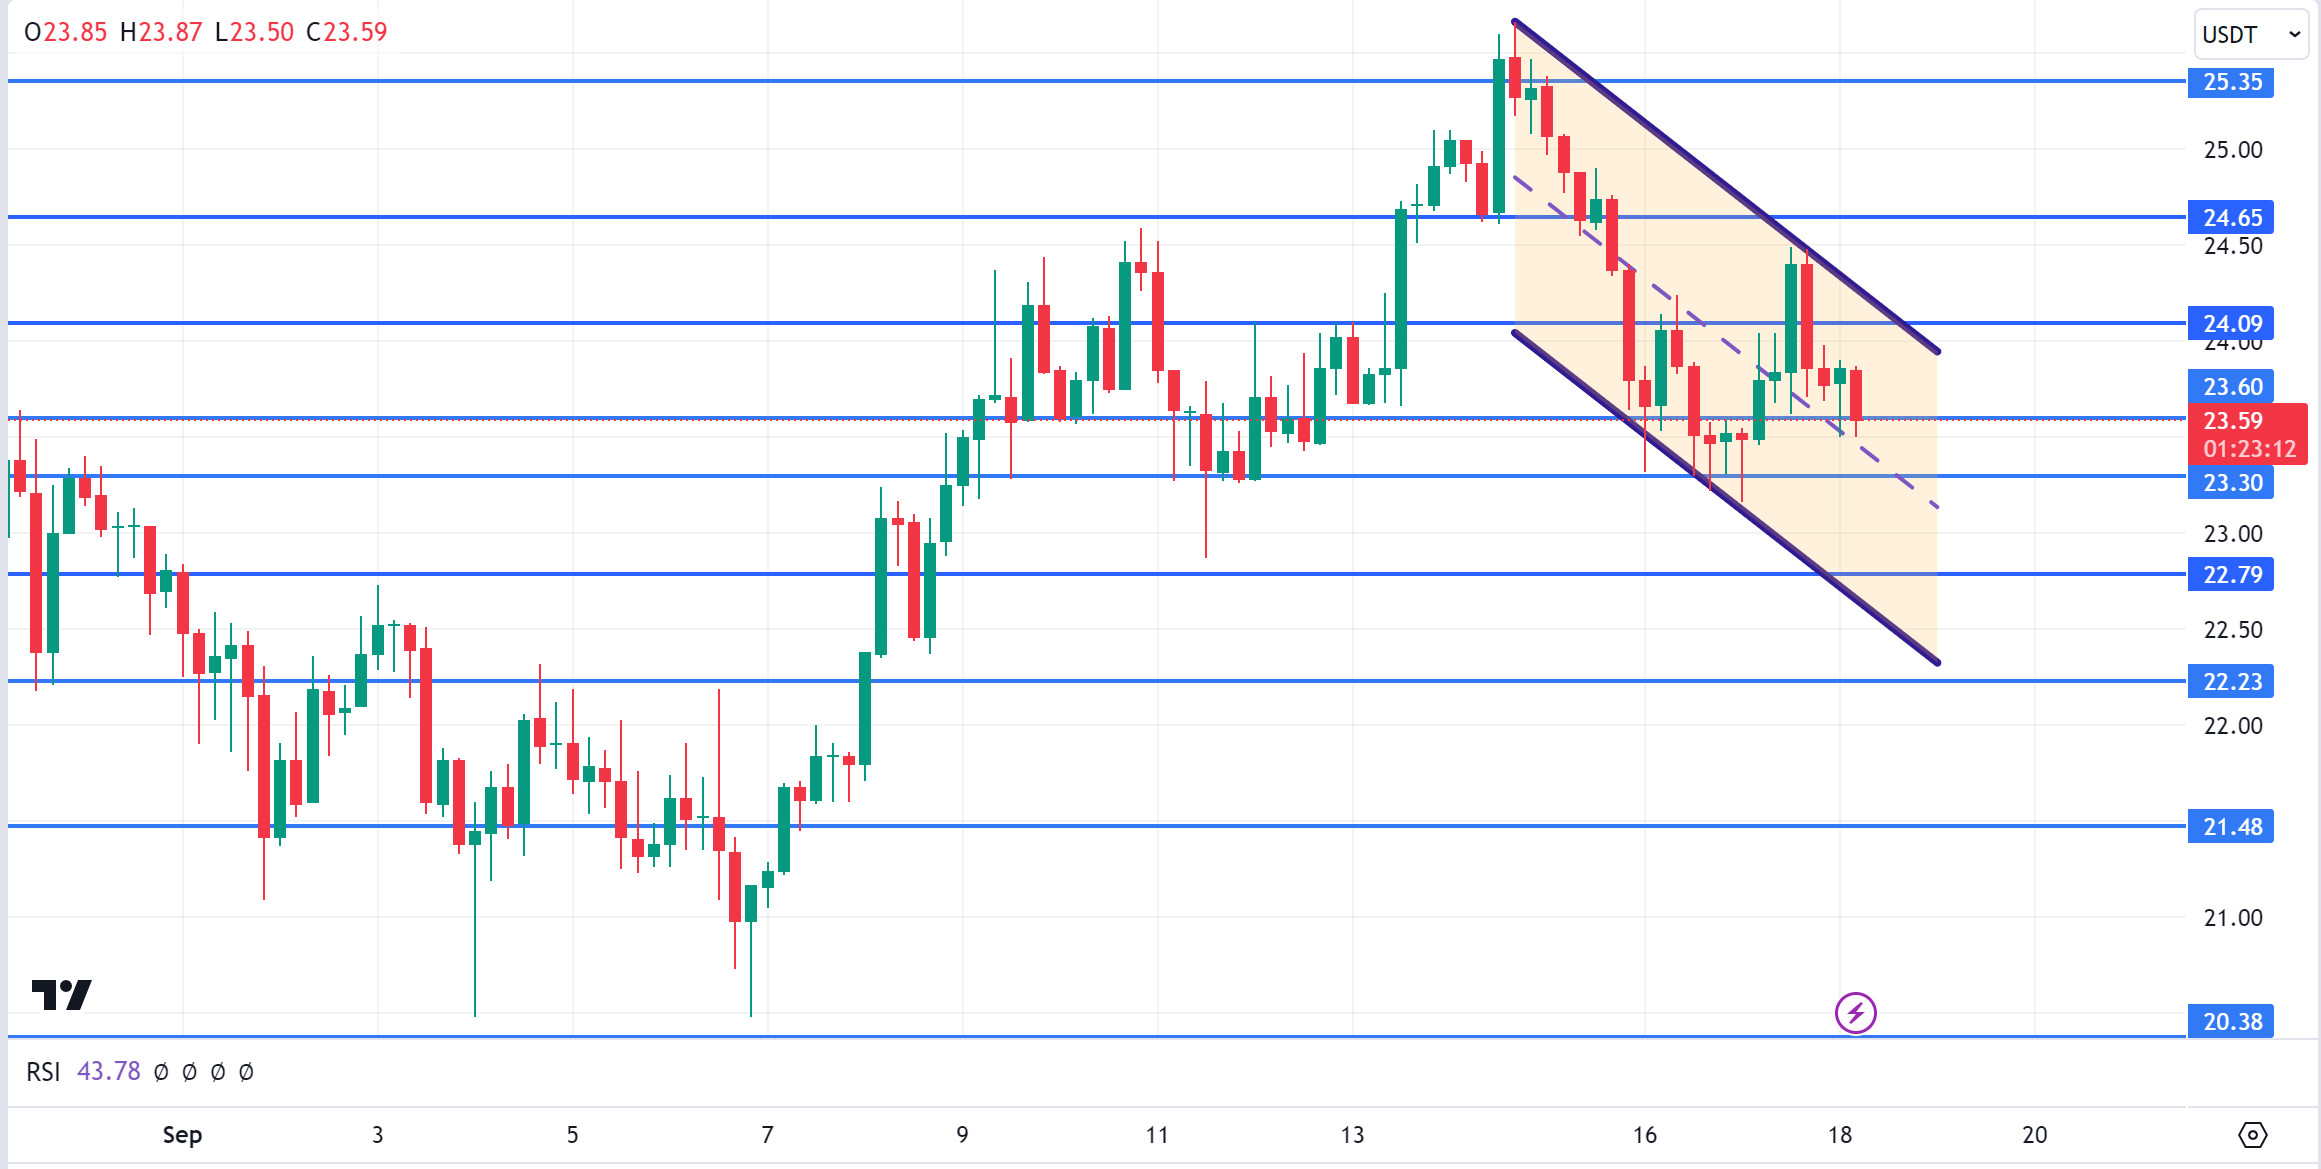
AVAX, which opened yesterday at 23.52, rose by about 1% during the day and closed the day at 23.77. Today, the FED interest rate decision will be announced in the evening and FED chair Powell’s speech will take place afterwards. The market is expecting a 25 basis point rate cut and may seek direction according to Powell’s speech as a result of a decision in line with expectations. A rate cut above expectations will have a positive impact.
AVAX, currently trading at 23.59, continues its movement within the falling channel on the 4-hour chart. It is in the middle band of the channel and tries to break the 23.60 support. After the candle closure below this support, it may want to move to the lower band of the channel. In this case, it may test 23.30 and 22.79 supports. It may fail to break 23.60 support and may want to test 24.09 resistance with a buying reaction. As long as it stays above 20.38 support during the day, the desire to rise may continue. With the break of 20.38 support, selling pressure may increase.
Supports 23.60 – 23.30 – 22.79
Resistances 24.09 – 24.65 – 25.35
TRX/USDT
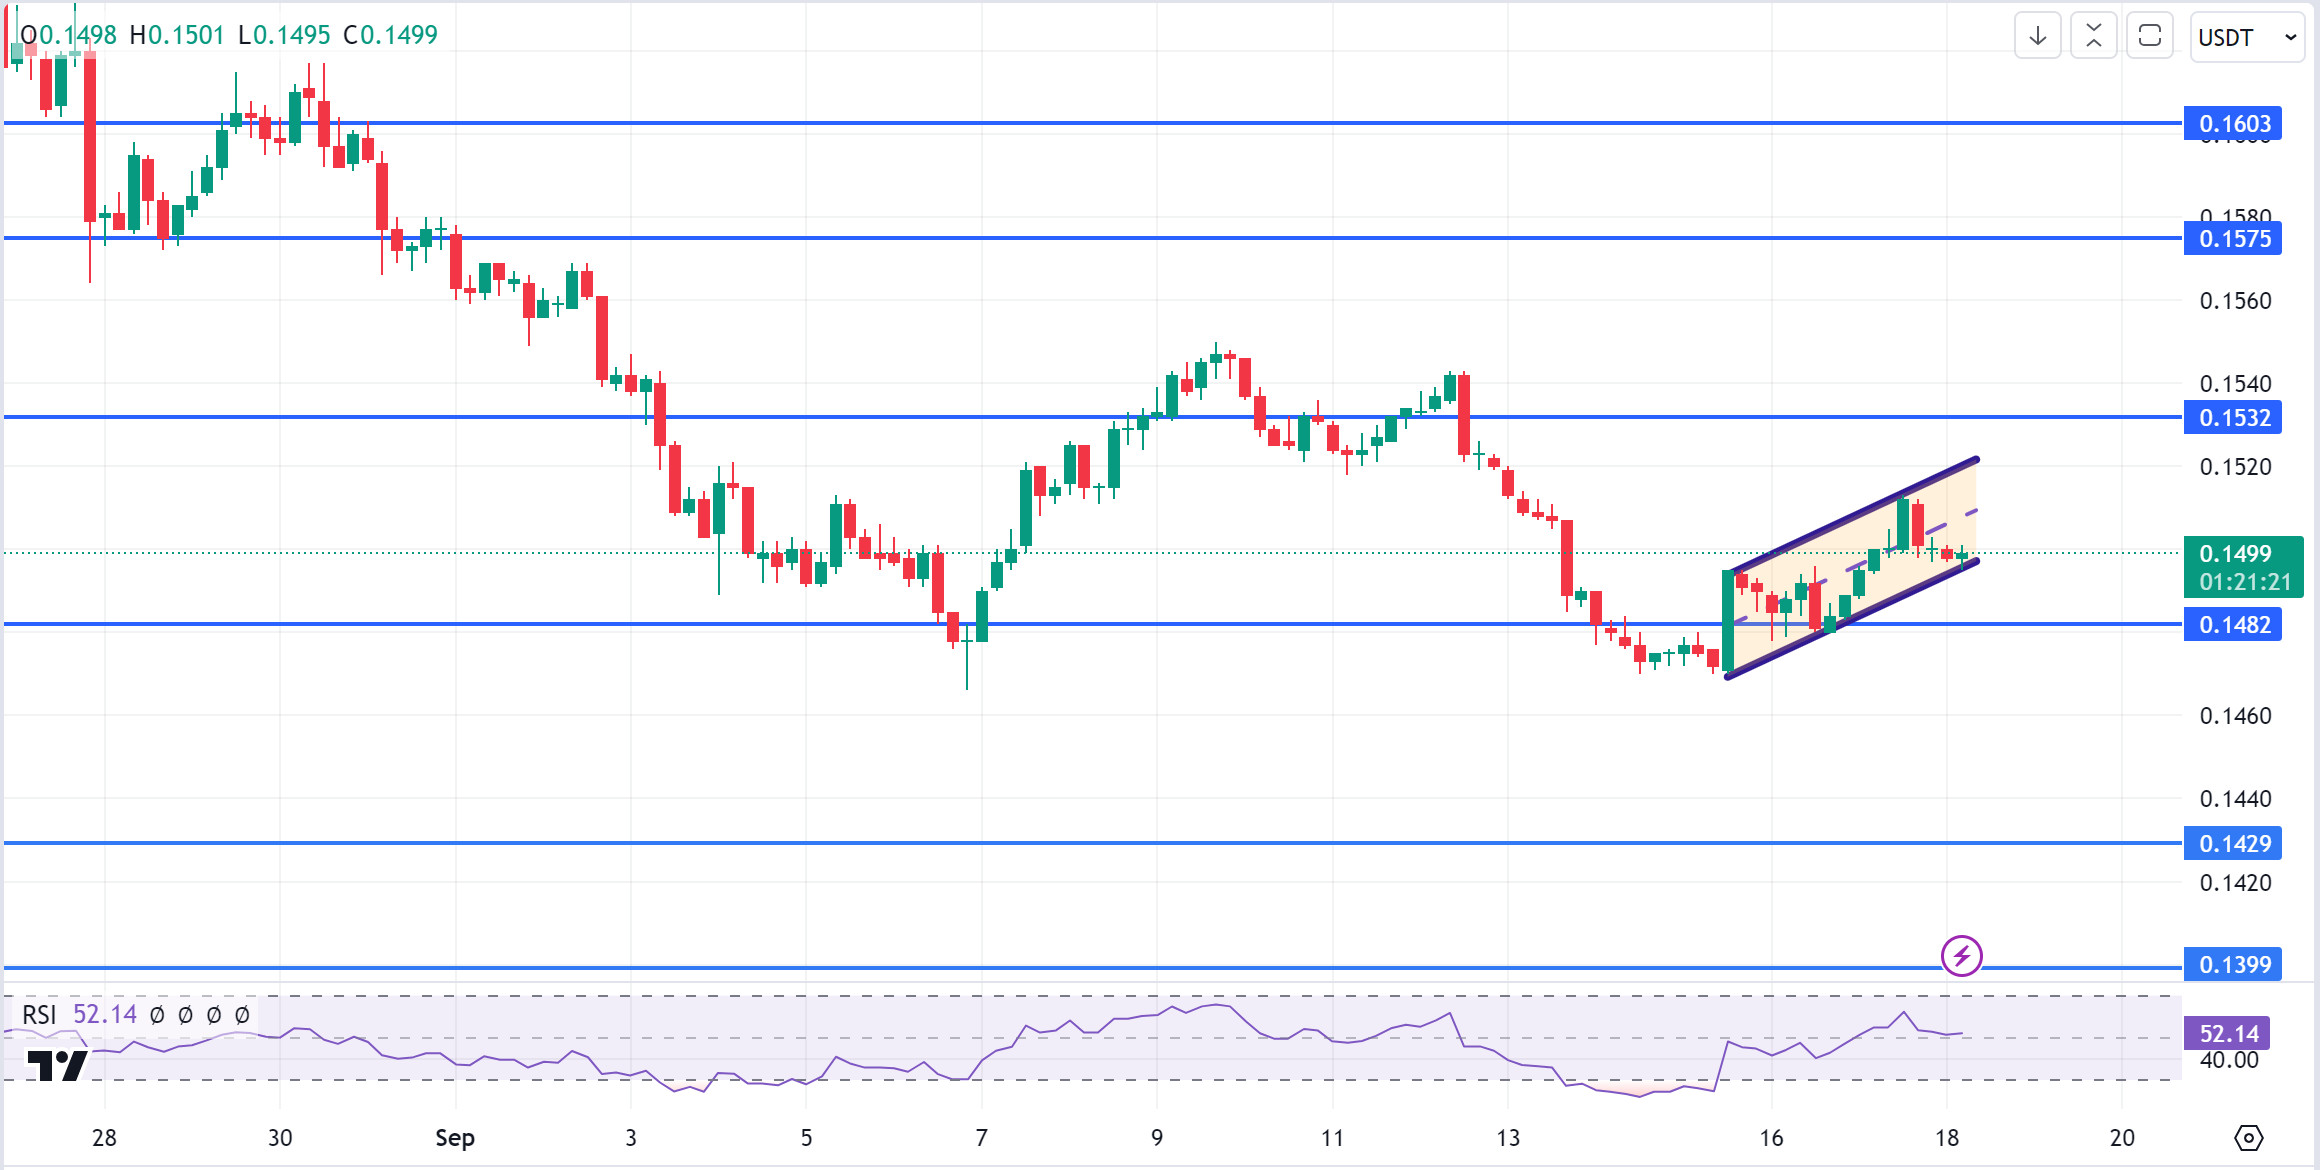
TRX, which started yesterday at 0.1489, closed the day at 0.1500. Depending on the FED interest rate decision to be announced today, the market will determine the direction. FED chair Powell’s speech will be important in terms of reflecting the FED’s course of action in future meetings.
On the 4-hour chart, TRX, which is in an ascending channel, is trading at 0.1499. It is currently in the lower band of the rising channel and a buying reaction can be expected from here. In such a case, it can move to the middle and upper band of the channel and test the 0.1532 resistance. With no reaction from the lower band of the channel and breaking the lower band downwards, it may want to test 0.1482 support. As long as TRX stays above 0.1482 support, the desire to rise may continue. If this support is broken downwards, sales can be expected to increase.
Supports 0.1482 – 0.1429 – 0.1399
Resistances 0.1532 – 0.1575 – 0.1603
XRP/USDT
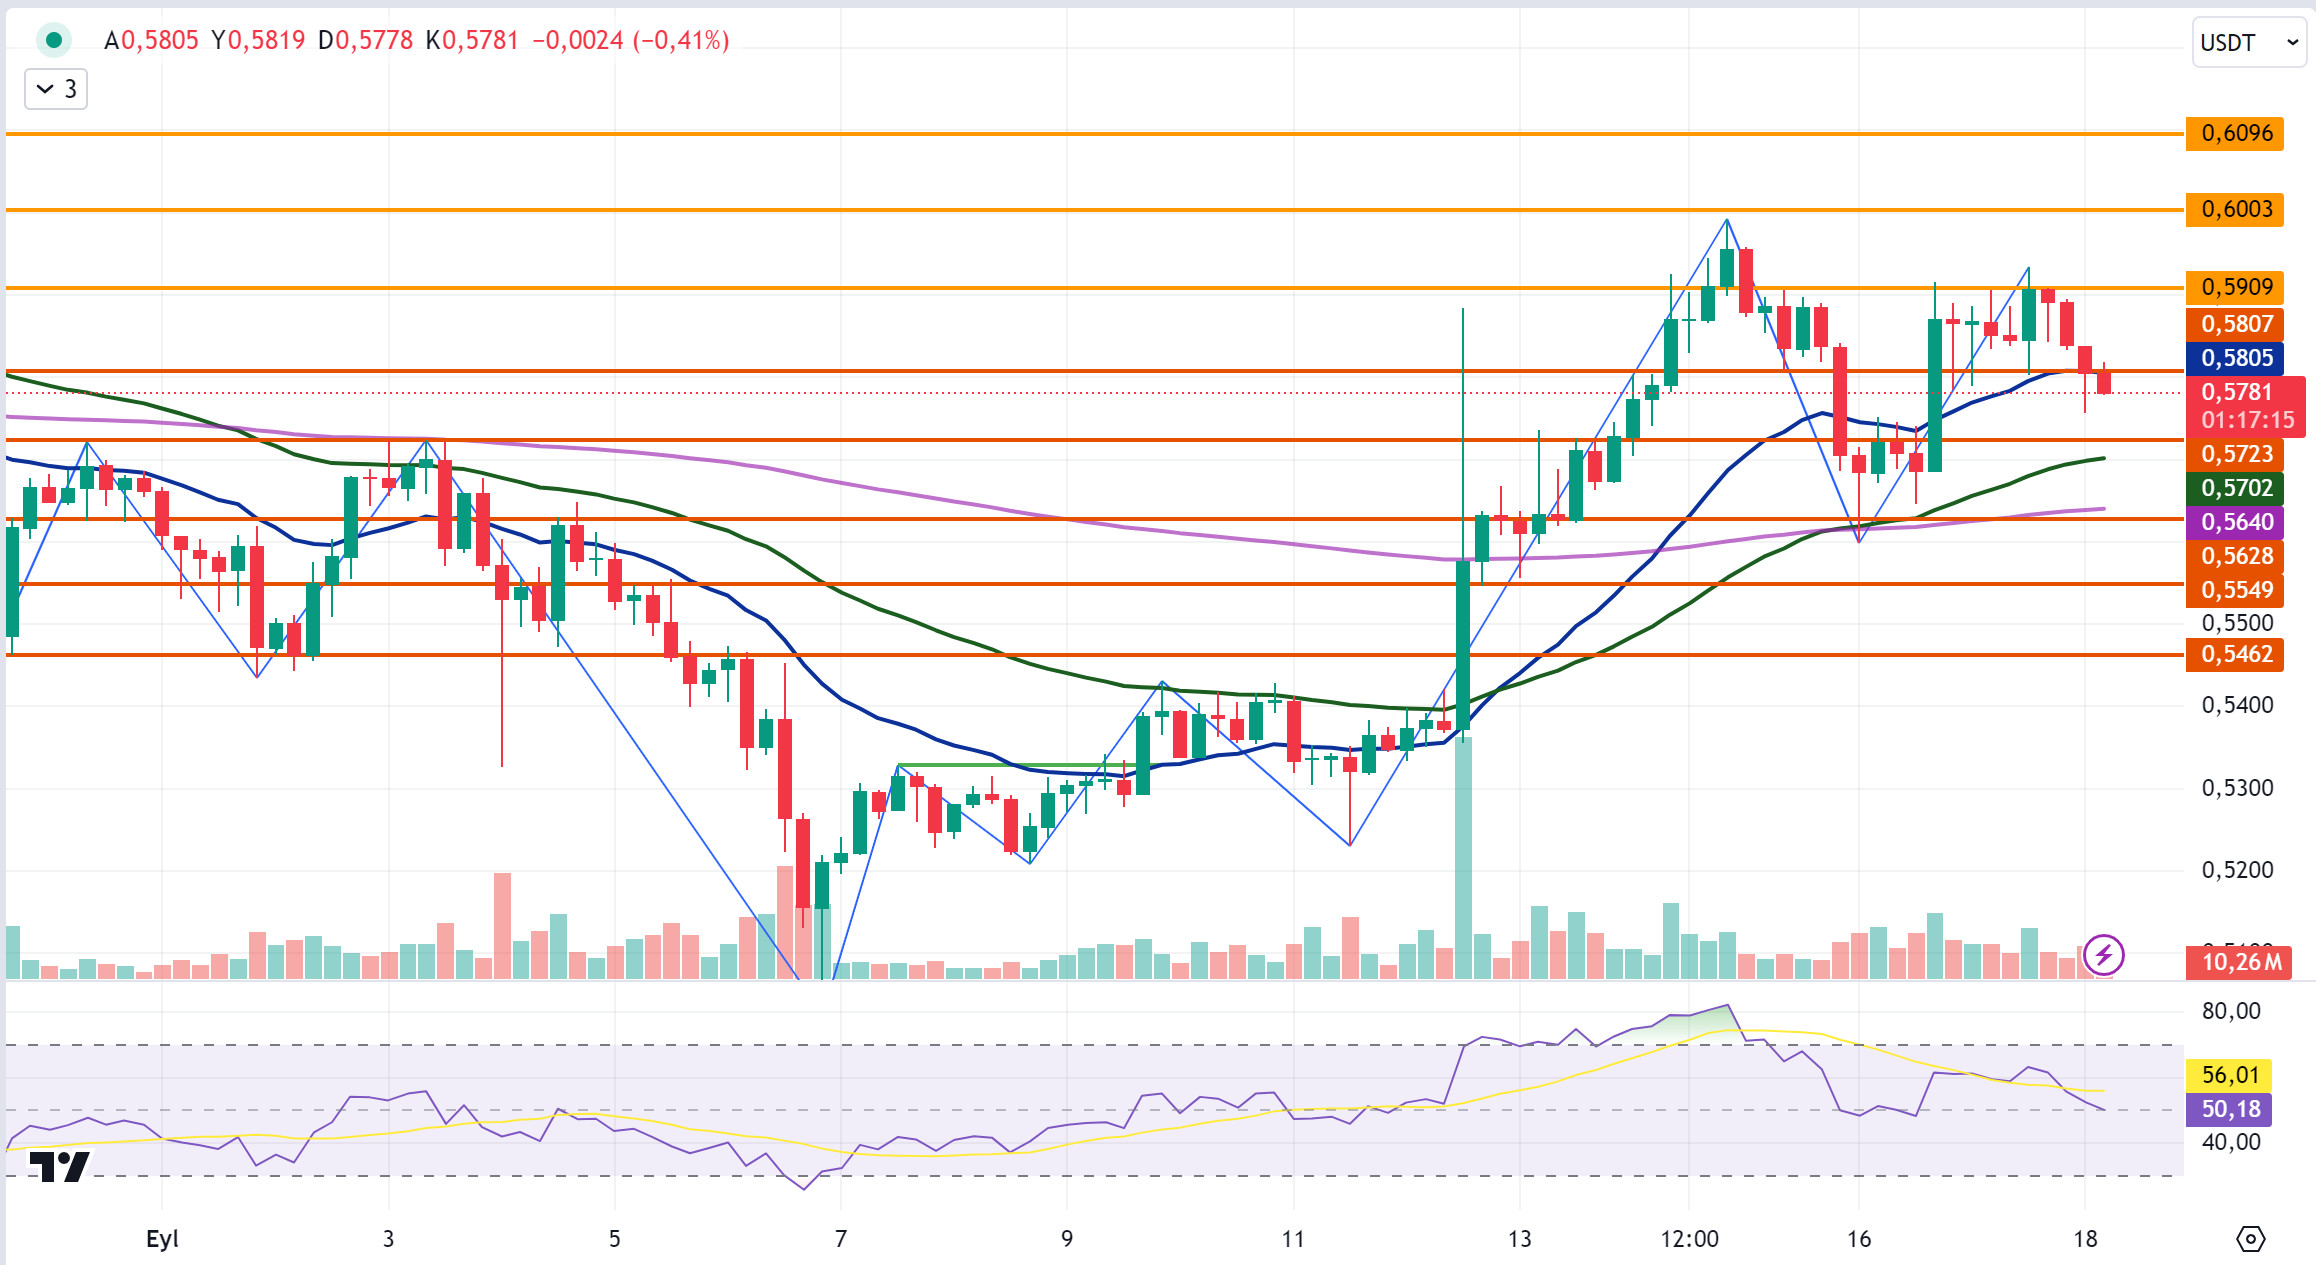
After testing the resistance level of 0.5909 in its rise in the 4-hour analysis yesterday, XRP fell with the reaction sales and closed at 0.5836 with a daily loss of 0.5% on a daily basis. Continuing its decline today, XRP tested the EMA20 level on the opening candle, but could not break it and opened the last candle at the EMA20 level and is currently trading below the EMA20 level at 0.5781. The crypto market is waiting for the FED interest rate decision to be announced today. The expectation is for an interest rate cut of 50 basis points and in this context, the market may experience activity before the announcement. XRP, which started today with a decline, may test the support levels of 0.5723-0.5628-0.5549 if it continues to decline. Otherwise, it may test the resistance levels of 0.5909-0.6003-0.6096 in the continuation of the decline and the continuation of the rise.
In the 4-hour analysis, XRP, which moves in a horizontal band today, may offer a short trading opportunity with possible reaction sales at the 0.5909 resistance level. And during its decline, it may rise with purchases at 0.5723 and EMA50 and may offer a long trading opportunity.
EMA20 (Blue Line) – EMA50 (Green Line) – EMA200 (Purple Line)
Supports 0.5723 – 0. 5 628 – 0.5549
Resistances 0.5909 – 0.6003 – 0. 6096
DOGE/USDT
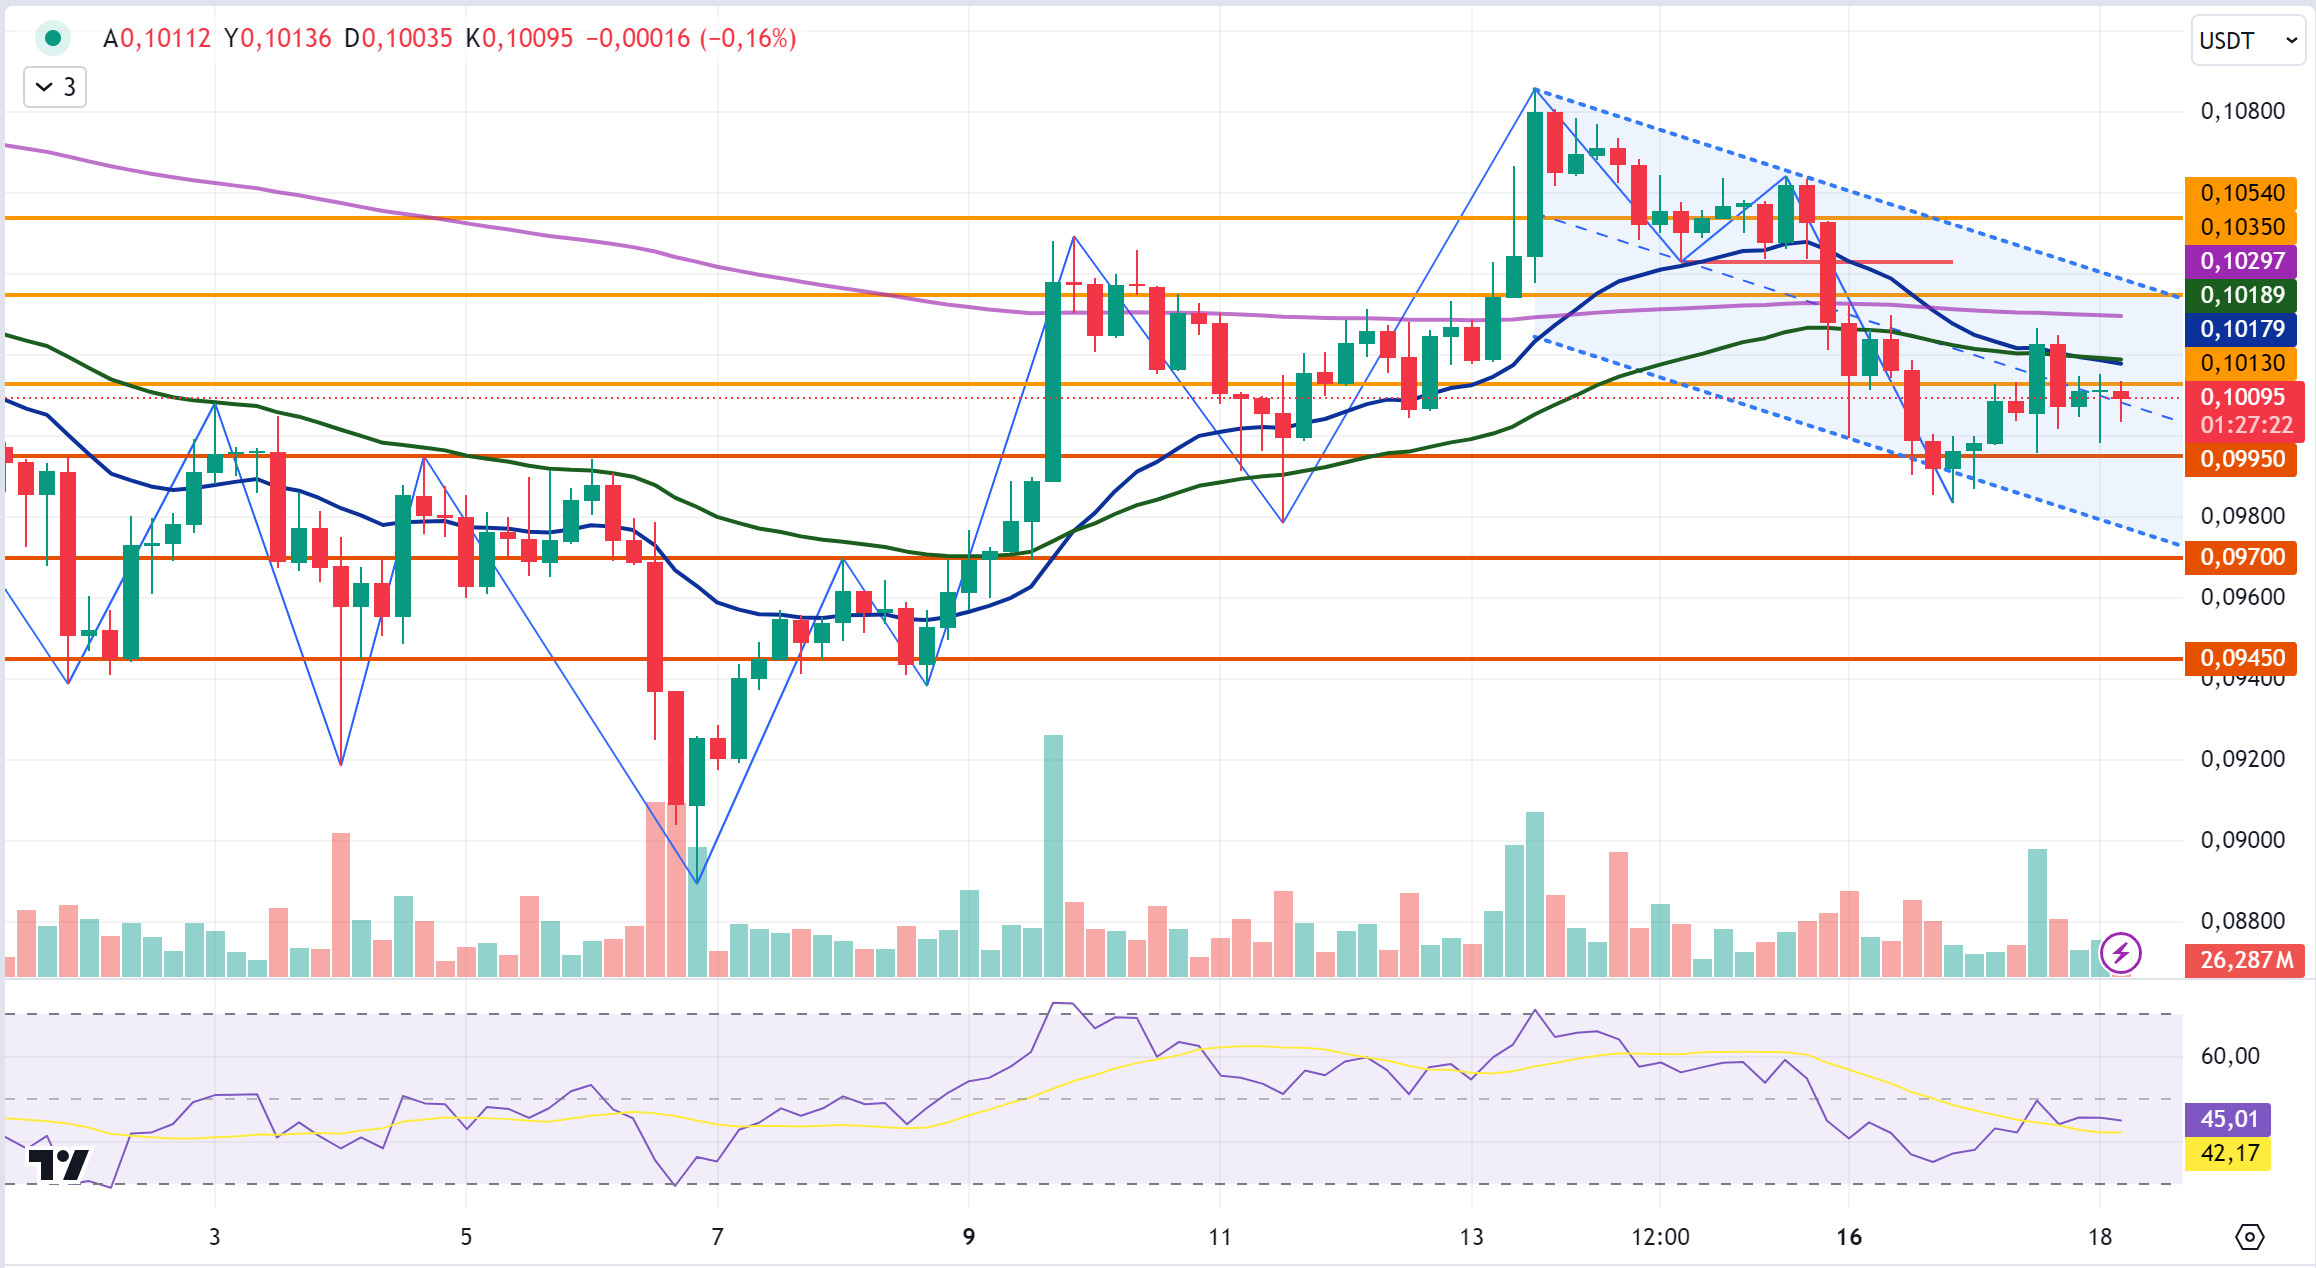
With a 1.5% increase in DOGE yesterday, the daily close was realized at 0.1010. Yesterday, in the 4-hour analysis, it declined with reaction sales at the EMA20 and EMA50 levels. Today, after testing the 0.1013 resistance level on the opening candle and the last candle, it fell with the reaction sales and is currently trading at 0.1009. The crypto market is focused on the FED interest rate decision to be announced today. The expectation is 50 basis points and within this expectation, mobility can be observed in the market before the announcement. In this process, if DOGE is bullish, it may test the resistance level of 0.1013 again and test the resistance levels of 0.1035-0.1054 if it continues to rise by breaking it. In case of a decline, it may test the support levels of 0.0995-0.0970-0.0945.
In the 4-hour analysis, if DOGE breaks the resistance level of 0.1013 in its rise, it may decline with the reaction sales that may come at the EMA20 and EMA50 level when it continues to rise. In case of a decline, it may rise with the purchases that may come at the level of 0.0970.
EMA20 (Blue Line) – EMA50 (Green Line) – EMA200 (Purple Line)
Supports 0.0995 – 0.0970 – 0.0945
Resistances 0.1013 – 0.1 035 – 0.1054
DOT/USDT
Sovereign Nature Initiative (SNI), in partnership with Polkadot and Wallet Connect, introduced the Dolphin NFT project in Singapore at the Token 2049 event. Participants can join the project by collecting DOTphins, digital avatars that contribute to marine conservation efforts and evolve with ecological data. DOTphins are avatars inspired by Japanese anime style, which are shaped according to the user’s interaction. This project can contribute to the increase of environmentally-oriented and user-interactive NFT projects in the Polkadot ecosystem and to the platform’s attracting more attention in the field of sustainability and innovation.
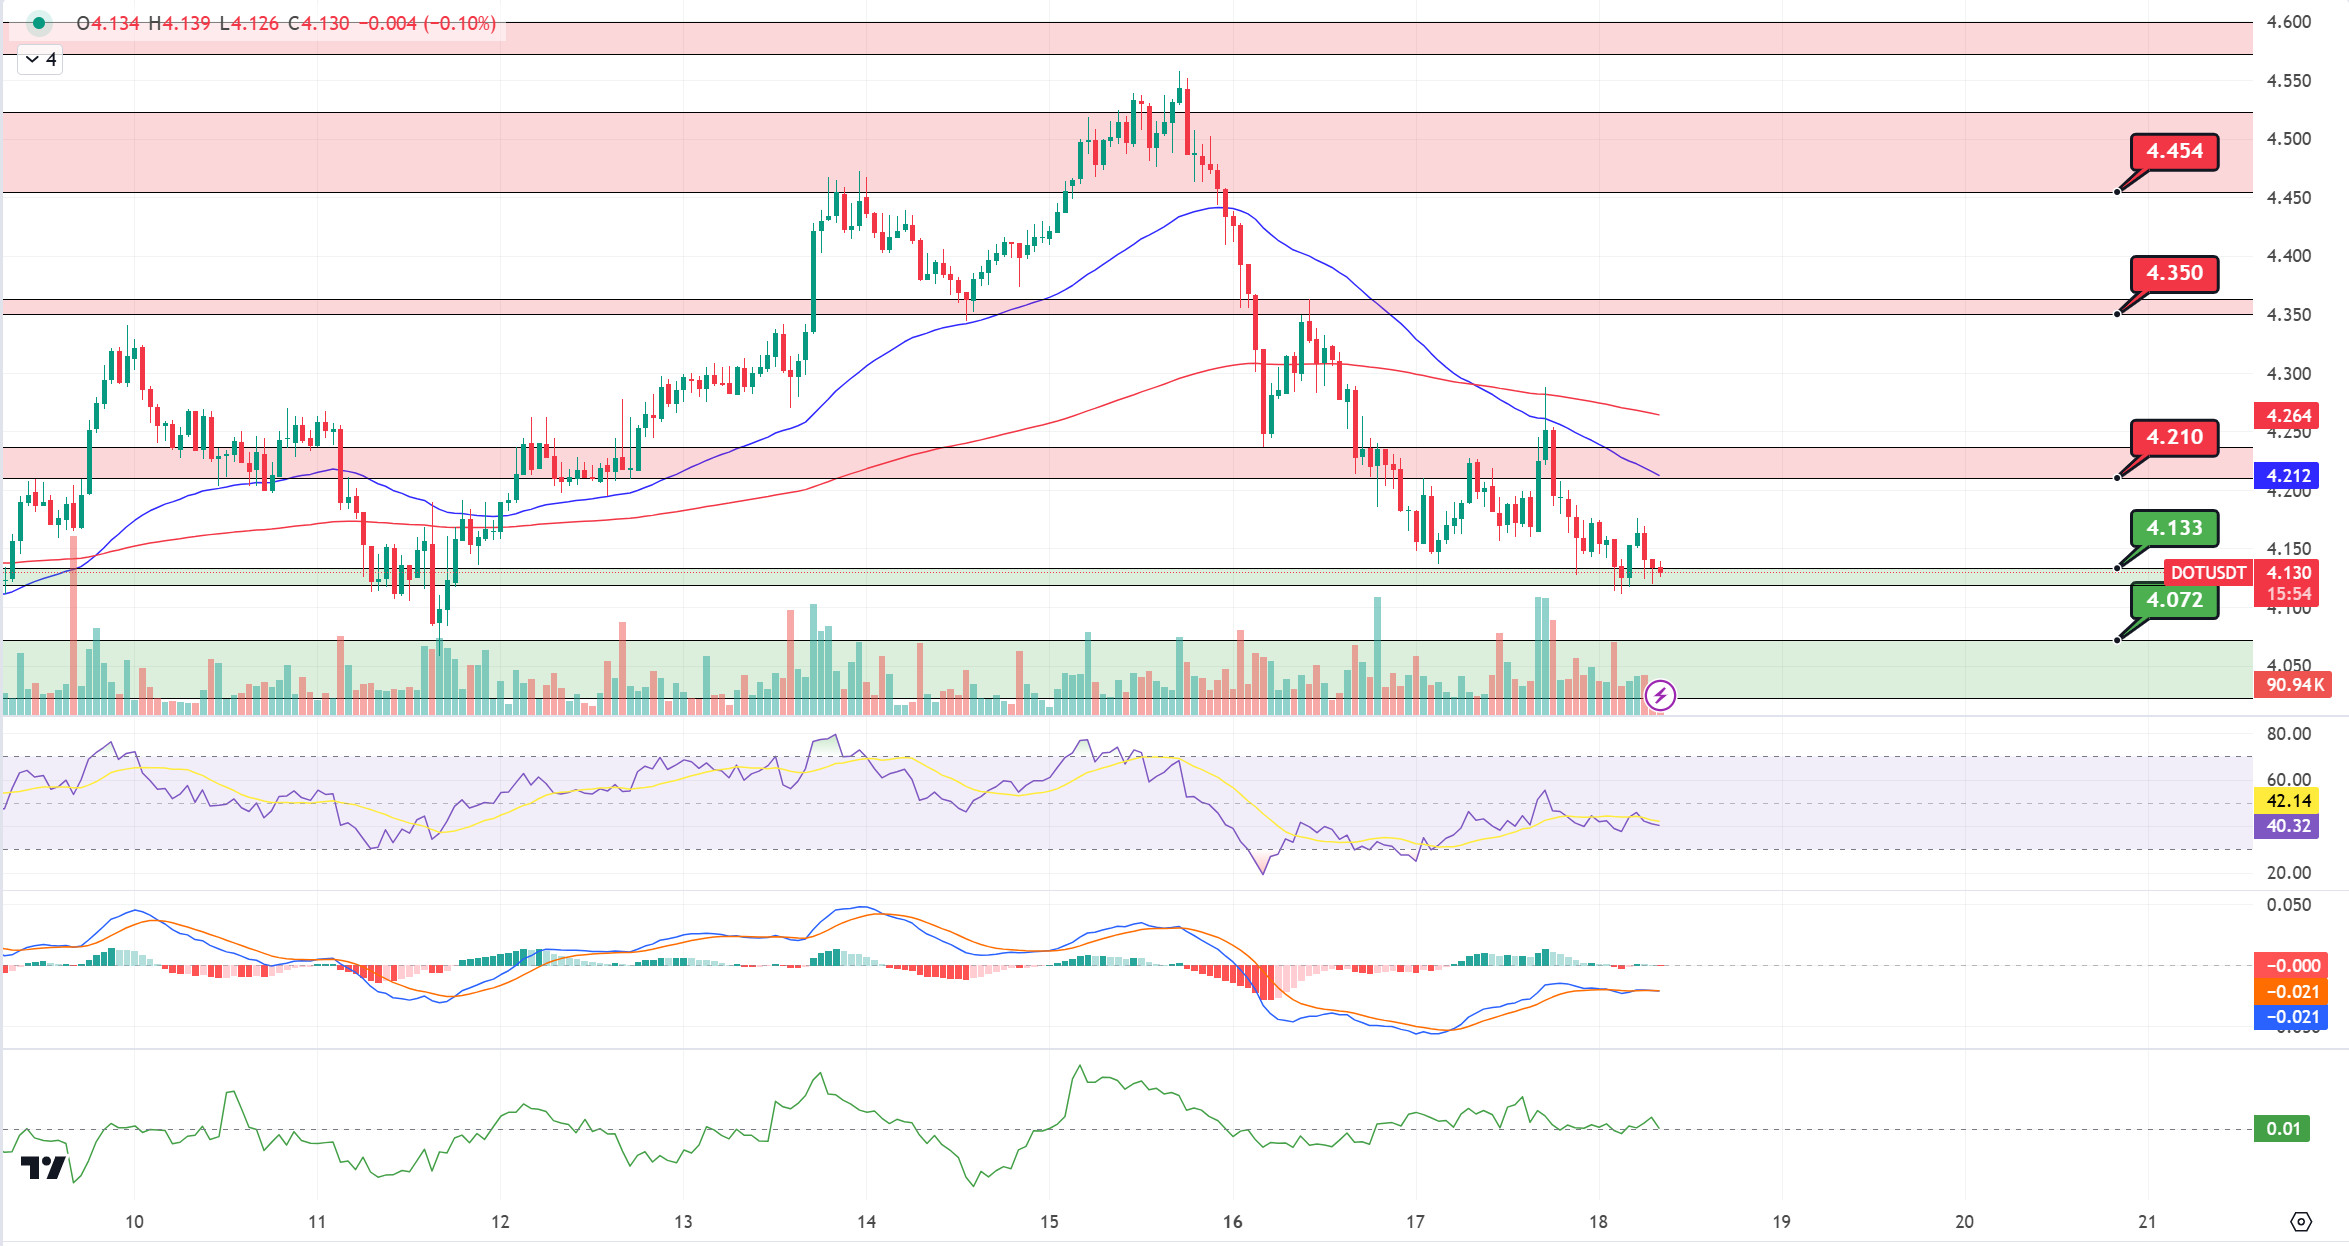
When we examine the DOT chart, the price seems to have pinned the EMA200 level and pulled back to the support level of 4.133. In case the price fails to hold at the 4.133 support band, the price may retreat to the next support level of 4.072 bands. In the positive scenario, if the price maintains above the 4,210 level, its next target could be the 4,350 band.
(Blue line: EMA50, Red line: EMA200)
Supports 4,133 – 4,072 – 3,925
Resistances 4.210 – 4.350 – 4.454
SHIB/USDT
The Shiba Inu ecosystem has made a significant donation to the Seungil Hope Foundation in Korea, providing support for ALS patients. The donation is part of a global charity tour called “Treat Yourself”, which aims to build stronger ties with the Shiba Inu community. It was also announced that the ecosystem’s new token, TREAT, will play a critical role in the upcoming Shiba metaverse.
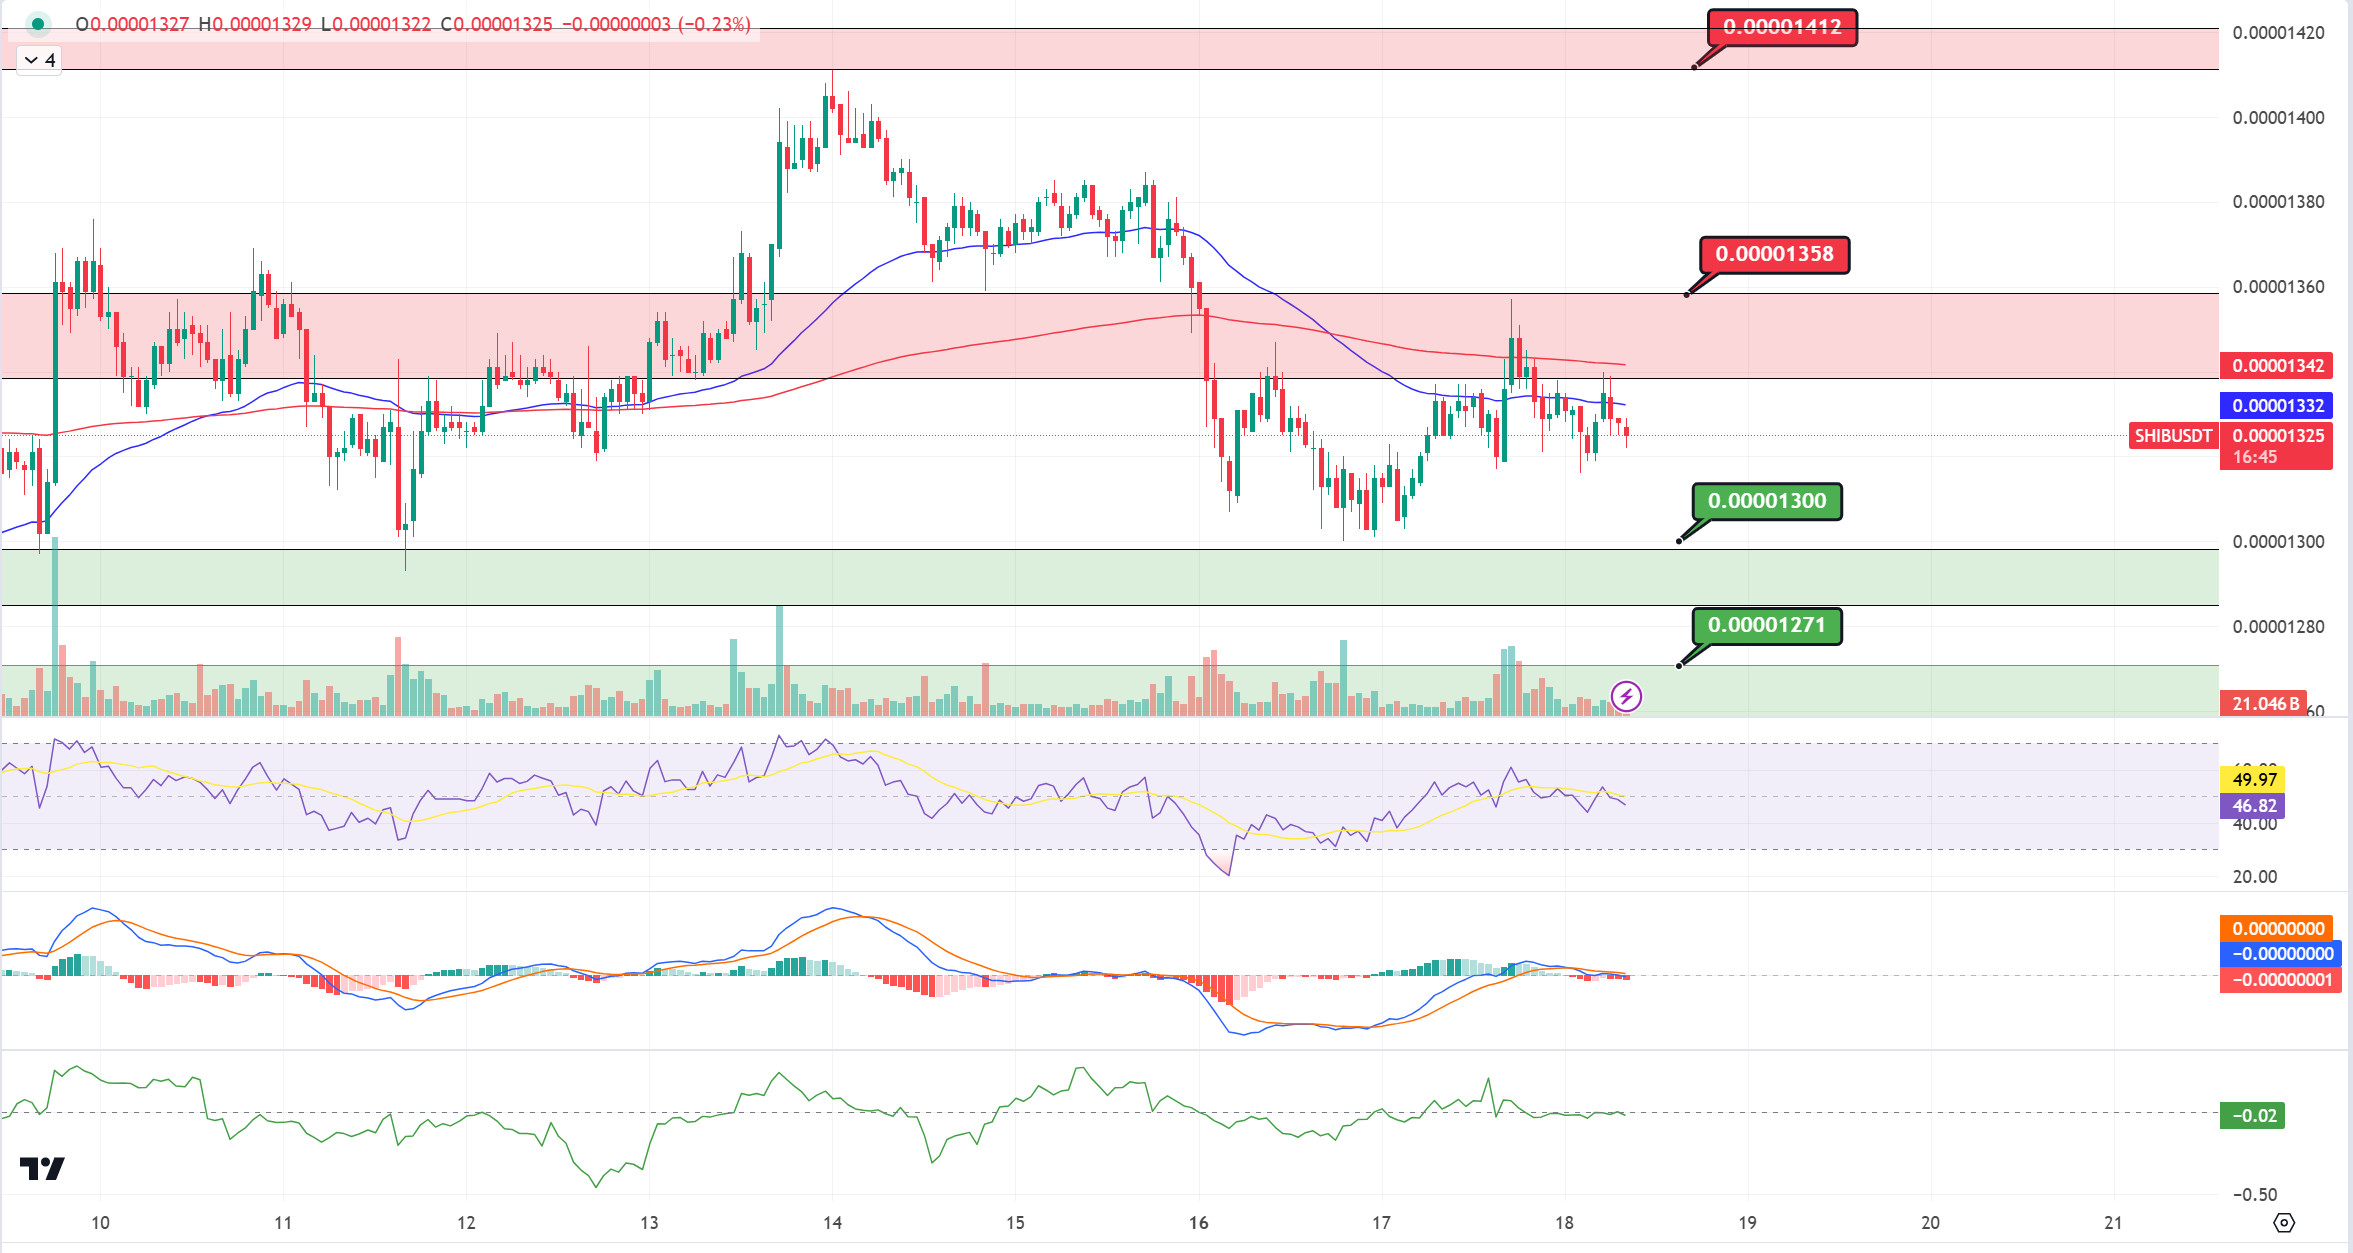
When we examine the SHIB chart, the price rose to the 0.00001358 resistance level but failed to break the selling pressure. When we analyze the MACD and CMF oscillators, we can say that the selling pressure increased compared to the previous hour. In the negative scenario, the price may retreat to 0.00001300 levels. On the other hand, if the selling pressure at the 0.00001358 resistance band is broken, the next target may be 0.00001412 resistance levels.
(Blue line: EMA50, Red line: EMA200)
Supports 0.00001300 – 0.00001271 – 0.00001227
Resistances 0.00001358 – 0.00001412 – 0.00001443
LEGAL NOTICE
The investment information, comments, and recommendations presented here do not qualify as investment advice. Authorized institutions provide individual investment advisory services, tailoring them to the specific risk and return preferences of each individual. Keep in mind that the comments and recommendations in this document are general in nature and may not align with your financial situation or risk tolerance. Consequently, making an investment decision based solely on this information may not yield the results you expect. Always consider your unique circumstances before proceeding with any investment.


