MARKET SUMMARY
Latest Situation in Crypto Assets
| Assets | Last Price | 24h Change | Dominance | Market Cap. |
|---|---|---|---|---|
| BTC | 97,373.15 | -1.89% | 55.56% | 1,93 T |
| ETH | 3,739.93 | -4.63% | 12.98% | 450,27 B |
| XRP | 2.219 | -9.56% | 3.65% | 126,81 B |
| SOLANA | 218.37 | -5.40% | 3.00% | 103,92 B |
| DOGE | 0.4115 | -7.70% | 1.75% | 60,64 B |
| CARDANO | 1.0161 | -12.41% | 1.03% | 35,67 B |
| TRX | 0.2626 | -13.87% | 0.65% | 22,65 B |
| AVAX | 45.59 | -11.64% | 0.54% | 18,67 B |
| SHIB | 0.00002696 | -12.82% | 0.46% | 15,88 B |
| LINK | 23.18 | -11.86% | 0.42% | 14,52 B |
| DOT | 8.621 | -13.25% | 0.38% | 13,16 B |
*Prepared on 12.10.2024 at 07:00 (UTC)
WHAT’S LEFT BEHIND
Massive Liquidations in the Crypto Market
According to Coinglass data, a total of $1.712 billion worth of liquidations took place in the last 24 hours. Of these liquidations, $1.551 billion were long positions and $162 million were short positions. BTC liquidations were reported at $183 million and ETH liquidations at $240 million.
Bitcoin Reserve Proposal from Russia
Russian State Duma member Anton Tkachev has proposed the creation of a national Bitcoin reserve to hedge against geopolitical risks, similar to national fiat currency reserves.
Anti-Monopoly Investigation Against Nvidia
China’s State Administration for Market Regulation has launched an investigation into Nvidia for violating China’s Anti-Monopoly Law. It is investigating the company’s possible restrictive behavior following its acquisition of Milestones Technology Co.
Magic Eden Launches NFT Trading with ME Token
Magic Eden has announced that it will allow
users to buy and sell Solana NFTs with the
ME token
starting tomorrow. Sellers who list NFTs with the ME token will be rewarded with tokens after the sale.
Floki and Mastercard Partnership: Crypto-Backed Debit Card
Floki and Mastercard have launched a debit card supporting 13 cryptocurrencies, available in physical and virtual formats in Europe. These cards can be used wherever Visa and Mastercard are accepted.
Jupiter to Airdrop 1.4 Billion JUP Tokens
The Jupiter community has approved the
“Jupuary Airdrop” offer
with 87% support. Under the proposal, a total of 1.4 billion JUP tokens will be distributed in two installments over two years.
Tether: 109 Million Wallets Hold USDT
According to Tether’s insight report, 109 million on-chain wallets hold USDT as of Q4 2024. This is considered an important milestone in stablecoin adoption.
HIGHLIGHTS OF THE DAY
Important Economic Calender Data
| Time | News | Expectation | Previous |
|---|---|---|---|
| – | Microsoft: Shareholder meeting regarding BTC | – | – |
| – | OVR: Staking Launch | – | – |
| – | Magic Eden: TGE (Token Generation Event) | – | – |
| – | Bitget Token: 5.38MM Token Unlock | – | – |
INFORMATION:
*The calendar is based on UTC (Coordinated Universal Time) time zone.
The economic calendar content on the relevant page is obtained from reliable news and data providers. The news in the economic calendar content, the date and time of the announcement of the news, possible changes in the previous, expectations and announced figures are made by the data provider institutions. Darkex cannot be held responsible for possible changes that may arise from similar situations.
MARKET COMPASS
Global markets are awaiting critical US inflation indicators this week ahead of the Federal Open Market Committee (FOMC) meeting on December 18th and the Bank is widely expected to cut interest rates by 25 basis points. We see increased volatility in digital assets ahead of the macro indicators that will shape these expectations. Major cryptocurrencies, which saw a sharp sell-off similar to the one on December 5 yesterday, recovered somewhat afterwards.
In yesterday’s evening analysis (published at 14:30 UTC), we wrote: “Despite the news flows that support digital assets for the continuation of the rise, we can consider the limited gains as a sign for a new retreat. We think that market interest should have been more pronounced in order for the effect of the statements that institutional purchases were and would continue. In this parallel, if the recent reaction rises remain limited, retracements may become more pronounced.” After last night’s declines in line with our prediction, we think that the recovery trend will continue today, albeit weak. Although the data calendar is weak today, the result of the board vote on whether Microsoft will buy Bitcoin as a reserve and the expectations regarding this may be effective on digital asset prices. Click here to review our monthly report on this topic.
From the short term to the big picture.
The victory of former President Trump on November 5, which was one of the main pillars of our bullish expectation for the long-term outlook in digital assets, produced a result in line with our predictions. Afterwards, the appointments made by the president-elect and the expectations of increased regulation of the crypto ecosystem in the US continued to take place in our equation as a positive variable. Although Powell gave cautious messages in his last speech, the continuation of the FED’s interest rate cut cycle and the volume in BTC ETFs indicating an increase in institutional investor interest (in addition to MicroStrategy’s BTC purchases, Microsoft’s start to evaluate the purchase issue, BlackRock’s BTC ETF options started trading…) support our upward forecast for the big picture for now.
In the short term, given the nature of the market and pricing behavior, we think it would not be surprising to see occasional pauses or pullbacks in digital assets. However, at this point, it is worth emphasizing again that the fundamental dynamics continue to be bullish. We continue to evaluate the recent declines in major crypto assets within this framework.
TECHNICAL ANALYSIS
BTC/USDT
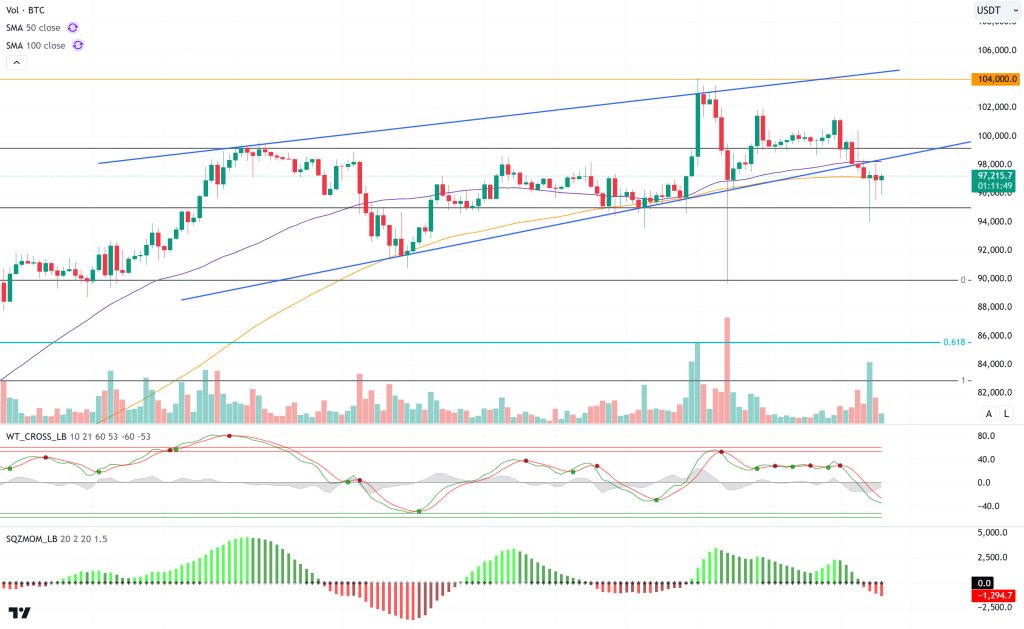
According to CoinShares’ weekly report, there were a total of $3.85 billion in inflows into digital asset investment products last week. This brings total inflows to date to $41 billion, with Bitcoin accounting for the largest share at $2.5 billion. With the high risk appetite, such inflows also bring high liquidation risks. As a matter of fact, a total of 1.712 billion dollars worth of liquidations took place in the last 24 hours. With the volatility in Bitcoin, it caused $ 183 million in liquidations.
When we look at the technical outlook with fund flow and liquidation rates, we observed that after the last technical analysis, the price once again tested above the 100,000 level and could not be permanent. The price, which touched the bottom of the trend and also the 50-day SMA line, broke down and came to the 94,000 level and liquidated a high rate of long transactions. The fact that these sharp declines were a liquidation hunt brought about a rapid recovery again. The price, which is currently moving at the resistance level of 97,200 on the 100-day SMA line, is trying to turn its direction up again. With technical oscillators giving a buy signal from the oversold zone during the day, BTC may test the trend channel again. Today, if the eyes are on the Microsoft meeting and the decision to buy Bitcoin, the momentum indicator can be expected to move back into the positive zone. Otherwise, we will follow the 95,000 level with increasing selling pressure.
Supports 95,000 – 92,750 – 90,000
Resistances 97,200 – 99,140 – 100,000
ETH/USDT
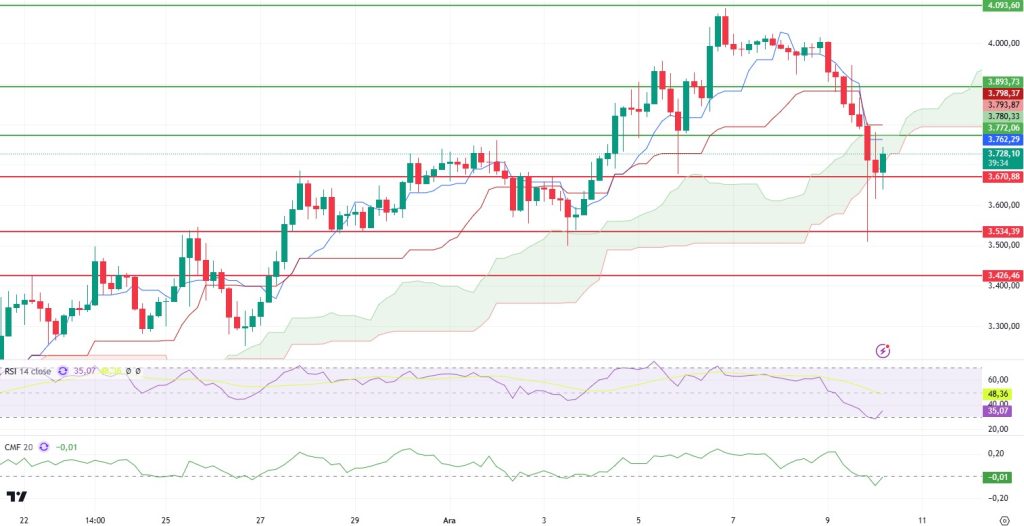
With the sudden drop in the crypto market yesterday, Ethereum (ETH) fell to the main support level of 3,534. ETH, which recovered with purchases from this level, is trying to rise above the 3,744 level. Especially during periods of high funding fees, upward price movements can often be witnessed after such sudden drops.
Looking at the technical indicators; RSI (Relative Strength Index), which has fallen to the oversold zone, is heading up again, signaling a recovery in the market. CMF (Chaikin Money Flow), on the other hand, rises from the negative area towards the zero line, indicating that buying pressure is increasing. Looking at the Ichimoku Indicator, ETH, which fell sharply below the kumo cloud, is back in the cloud. However, a sell signal seems to have formed as the Tenkan level cuts Kijun downwards.
On a break of the 3,770 resistance, this sell signal may become invalid and the price may be expected to move up to the 3,893 resistance. Otherwise, the loss of the 3,670 level could cause the price to retrace back down to the 3,534 support. The movements of the ETH price at these critical levels will be decisive for the short-term direction of the market.
Supports 3,670 – 3,534 – 3,426
Resistances 3,772 – 3,893 – 4,093
XRP/USDT
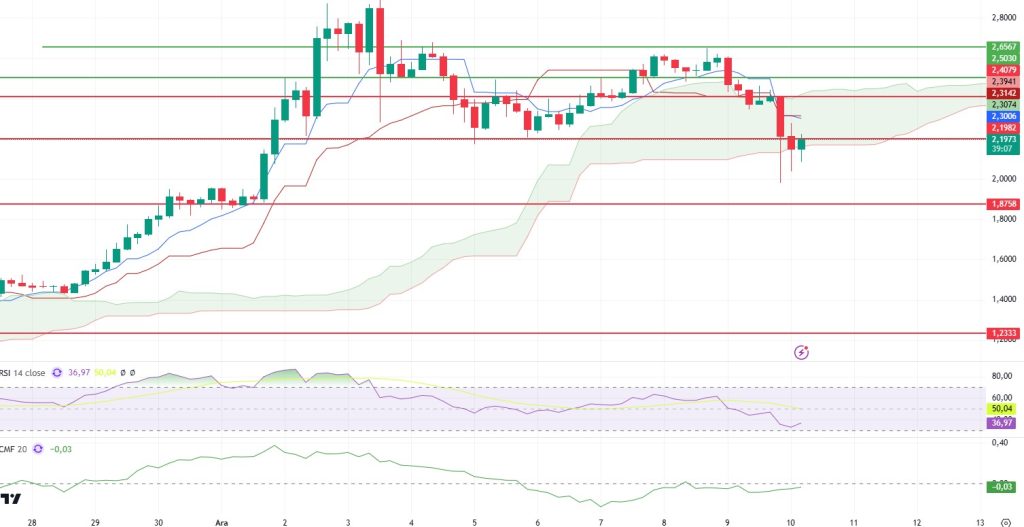
XRP, which was heavily affected by yesterday’s sharp decline, lost the upper support of the sand cloud and quickly fell to 1.98. However, XRP, which recovered with the purchases from this level, managed to re-enter the borders of the sand cloud.
Technical indicators signal that the price is on a recovery trend. RSI (Relative Strength Index) signals a bullish structure after the correction. Momentum has regained upward momentum. CMF (Chaikin Money Flow) shows positive divergence, indicating that buyers are increasing their strength and heading upwards. A break of 2.19 resistance may push the price up to the 2.41 region.
However, a rejection from the 2.19 level could pull the price back to the 1.87 support. XRP’s movements will depend on whether these critical levels are broken or maintained.
Supports 2.1982 – 1. 8758- 1. 6160
Resistances 2.4079 – 2.5030 – 2.6567
SOL/USDT
According to Coinglass’ data, the asset’s open interest-weighted funding rate fell from 0.0191% to 0.0089% in the last 8 hours. At the same time, the TVL fell to $8.860 billion from $9.483 billion.
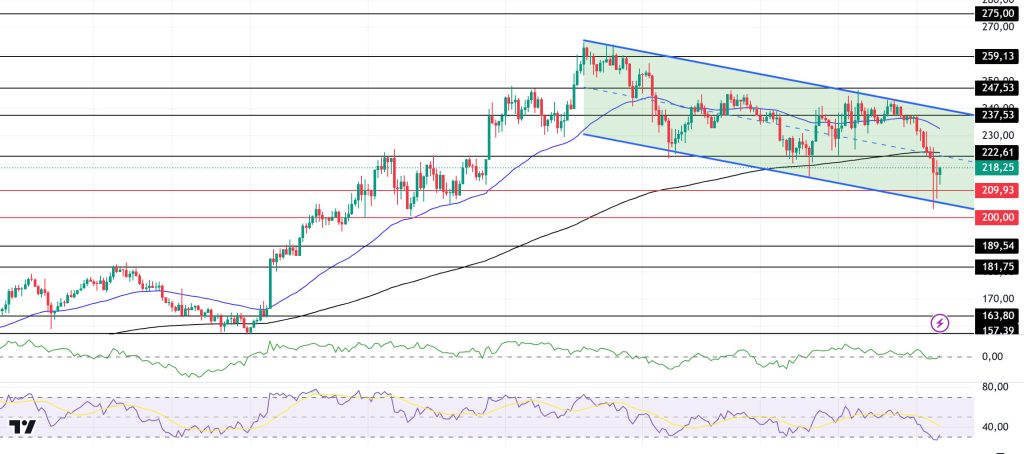
On the 4-hour timeframe, the 50 EMA (Blue Line) is above the 200 EMA (Black Line). Since November 22, the asset has been in a downtrend, losing about 6.37% in the last 24 hours, keeping pace with the depreciation in the market. This movement caused the price to hit the support level of the channel. Although there was an upward acceleration from the support level, momentum started to fall again. When we examine the Chaikin Money Flow (CMF)20 indicator, we see that there is also a decline in money inflows. This can be shown as a downward signal. However, Relative Strength Index (RSI)14 has accelerated towards the overbought zone. On the other hand, the gap between the 50 EMA and the 200 EMA has closed. This may push the value of the asset lower. The 237.53 level stands out as a very strong resistance point in the rises driven by both the inflation data from the US and the news in the Solana ecosystem. If it breaks here, the rise may continue. In case of retracements for the opposite reasons or due to profit sales, the support levels of 189.54 and 181.75 can be triggered again. If the price hits these support levels, a potential bullish opportunity may arise if momentum increases.
Supports 209.93 – 200.00 – 189.54
Resistances 222.61 – 237.53 – 247.53
DOGE/USDT
In an important update for the Dogecoin community, an important reminder was issued to Dogecoin node operators. Dogecoin node operators were urged to take immediate action to upgrade their systems following the release of Dogecoin Core 1.14.9. On the other hand, looking at Onchain, according to data from Coinglass, DOGE’s open interest-weighted funding rate decreased from 0.0371% to 0.0024% in the last 8 hours.
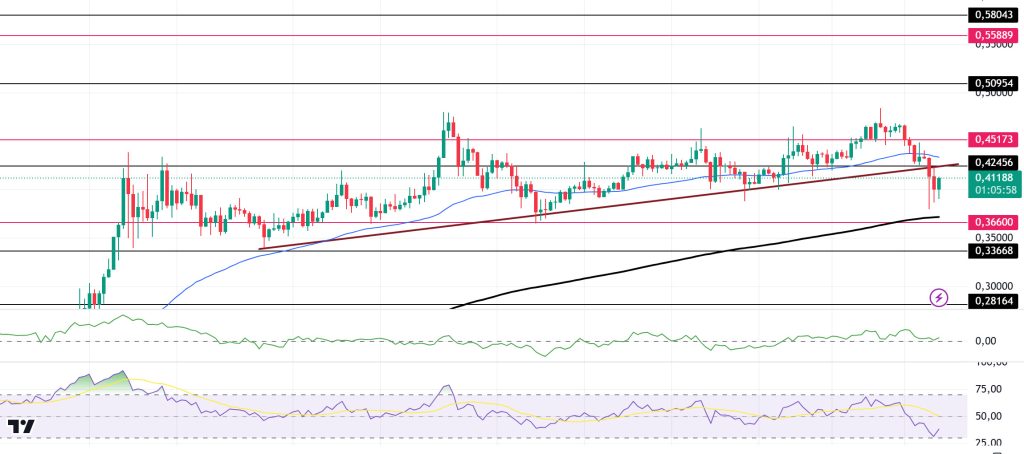
When we look at the chart, the asset, which has been in an uptrend since November 11, has broken the downward trend due to the usual pullback in the market yesterday. It has started to accelerate downwards. If this movement is strong, the 0.36600 level may be triggered. On the 4-hour timeframe, the 50 EMA (Blue Line) is above the 200 EMA (Black Line). On the other hand, when we look at the RSI 14 indicator, we see that it is moving from overbought to neutral. However, when we examine the Chaikin Money Flow (CMF)20 indicator, it is seen that there is a small amount of money inflows. The 0.50954 level appears to be a very strong resistance level in the rises due to inflation data from the US or innovations in the Doge coin. If DOGE maintains its momentum and rises above this level, the rise may continue strongly. In case of retracements due to possible macroeconomic reasons, the 0.36600 support level can be triggered. If the price reaches these support levels, a potential bullish opportunity may arise if momentum increases.
Supports 0.36600 – 0.33668 – 0.28164
Resistances 0.42456 – 0.45173 – 0.50954
LEGAL NOTICE
The investment information, comments and recommendations contained herein do not constitute investment advice. Investment advisory services are provided individually by authorized institutions taking into account the risk and return preferences of individuals. The comments and recommendations contained herein are of a general nature. These recommendations may not be suitable for your financial situation and risk and return preferences. Therefore, making an investment decision based solely on the information contained herein may not produce results in line with your expectations.


