
Active Addresses
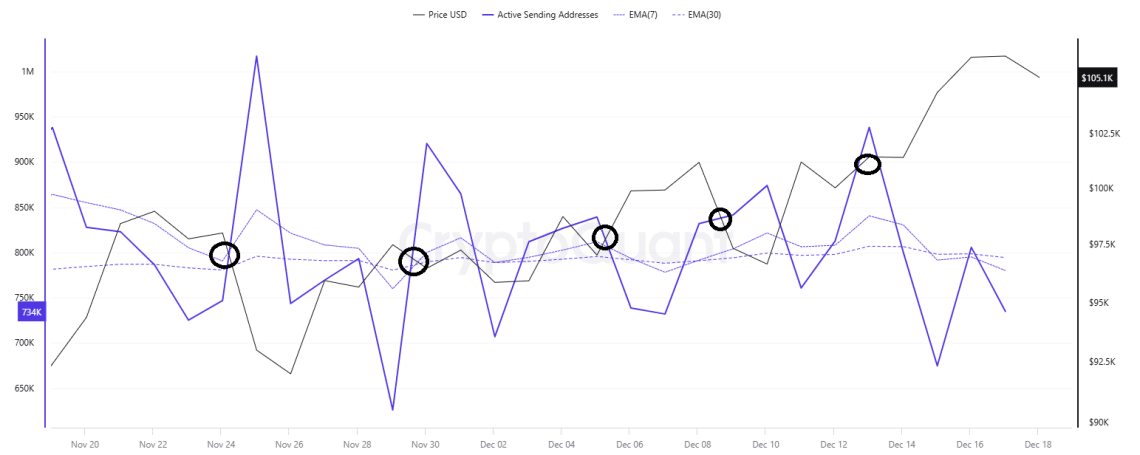 This week, $1,212,000 in active addresses entered the exchanges between December 9 and December 15, 2024. In the said date range, Bitcoin rose from $ 100,000 to $ 107,000. With the increase in active addresses, it supported Bitcoin purchases of trading and ready-to-trade addresses. After December 11, the price has generally followed an upward trend. This may indicate that the market is strengthening and investors are showing more interest. Tracking the 14-day simple moving average, it also appears to be trending upwards. The correlation with the Bitcoin active address EMA (7) reached 1,111,102 as of December 13. This triggered the rise of the Bitcoin price to the $107,000 levels. At the intersection of the 7-day EMA and the price of the number of active addresses on the chart, inflows are accelerating, indicating continued interest from long-term investors and a positive overall trend.
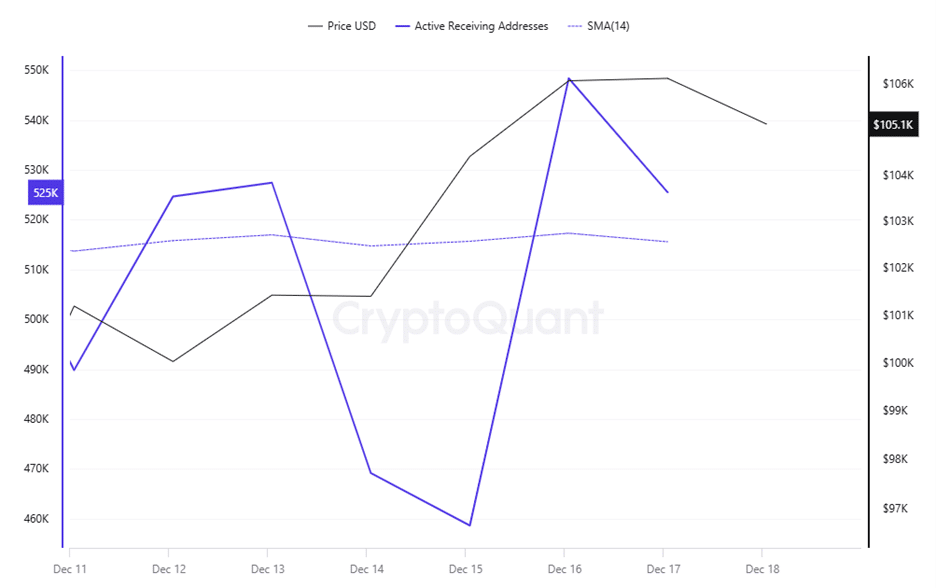
On the exits, there was a significant increase towards December 15, with the Black Line (price line) and then a decline. On the day of the price high, active shipping addresses rose as high as 548,380, suggesting that buyers may have sold their long positions out of fear and outflows may have occurred. The rise in active shipping addresses suggests that the Bitcoin price has started to fall from $107,000 to $103,000. If there is a decrease in the number of active addresses, this could trigger further price declines.
Looking at the metrics of this part of the Onchain analysis, a rising price could create a positive psychology in the market, leading to more investors joining Bitcoin. In the short term, it reveals that the market is fragile and requires careful monitoring.
Breakdowns
MRVR
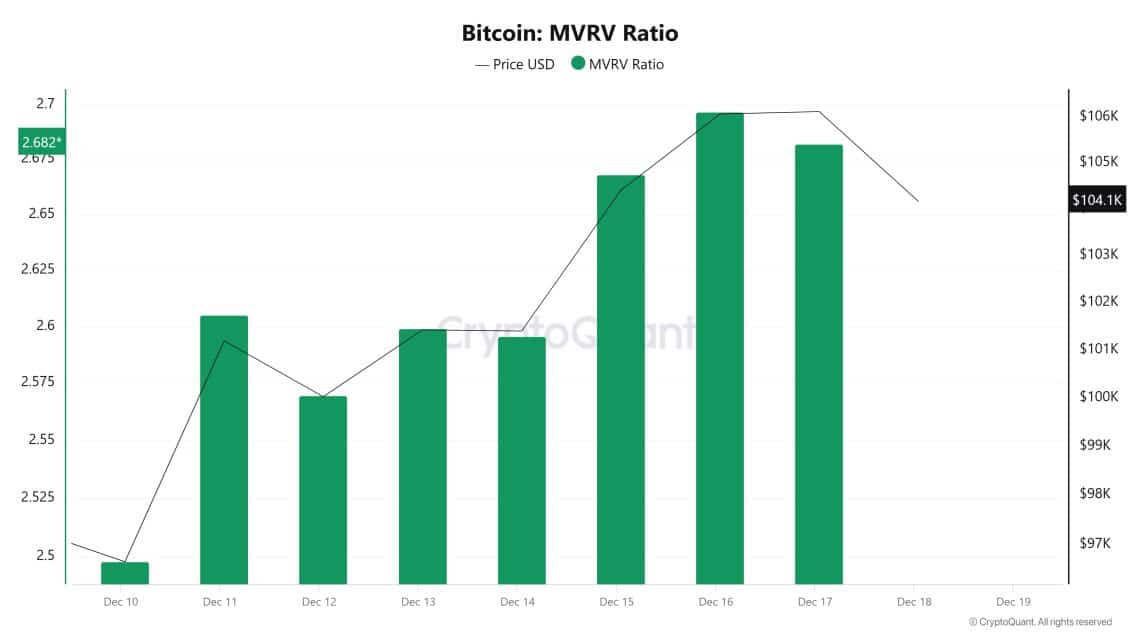
As of December 17, the Bitcoin price rose to 106,128 while the MVRV Ratio increased to 2.68. During this period, the Bitcoin price increased by 9.80% compared to December 10, while the MVRV Ratio increased by 7.63%. The increase in the MVRV Ratio along with this increase in the Bitcoin price may indicate that market participants’ confidence in valuation has increased and the price has continued its upward movement despite profit-taking pressure. A rise in the MVRV Ratio to 268 may indicate that the market is more overvalued compared to the previous week. However, the fact that the MVRV did not reach the overvaluation limits may suggest that selling pressure is still limited and investors support the market’s current move.
Realized Price
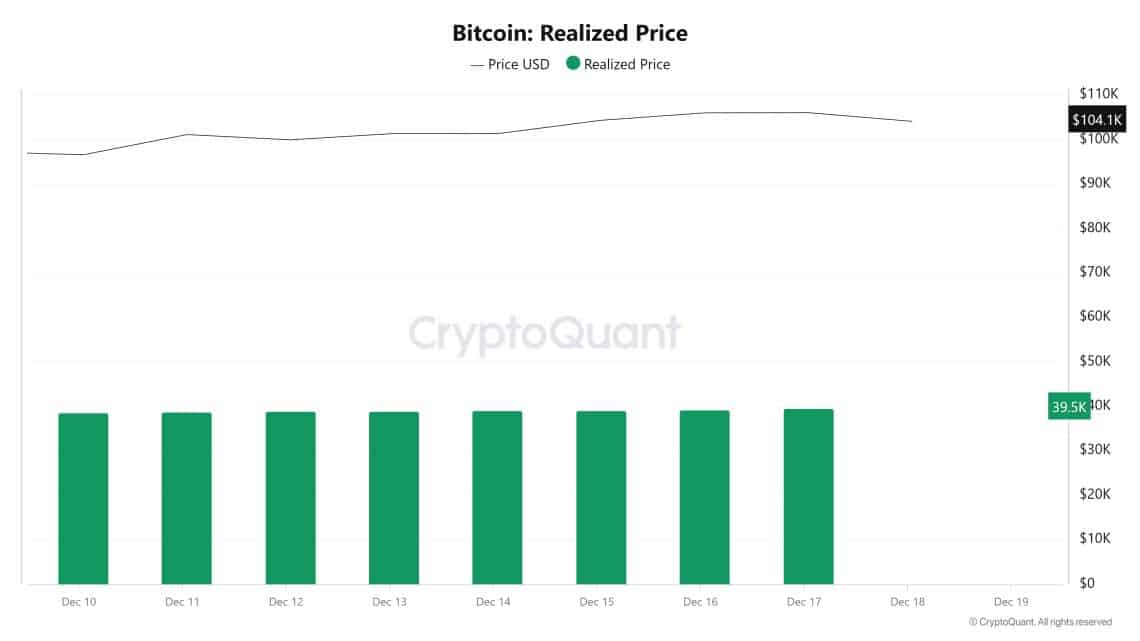
As of December 17, the Bitcoin price increased to 106,128 while the Realized Price increased to 39,568. During this period, the Bitcoin price increased by 9.80% compared to December 10, while the Realized Price increased by 2.26%. The fact that the price increase was higher than the Realized Price increase may indicate that speculative demand in the Bitcoin market has increased, and the price has risen faster compared to the cost of purchase for existing investors. The more limited increase in the Realized Price may suggest that long-term traders have largely held their positions and that the increase in demand in the market is mostly driven by new participants. This may suggest that the market is attracting short-term buyers as the price rises and that long-term confidence remains.
Spent Output Profit Ratio (SOPR)
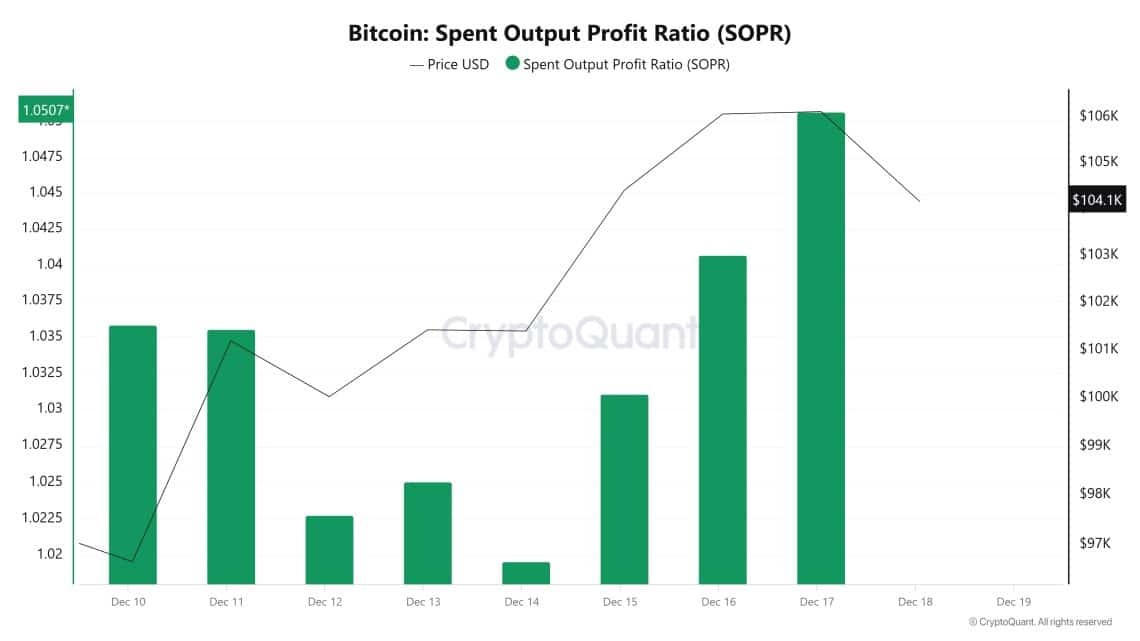
As of December 17, the Bitcoin price rose to 106,128, while the SOPR (Spent Output Profit Ratio) metric increased to 1.05. During this period, the Bitcoin price increased by 9.80% compared to December 10, while the SOPR metric increased by 1.94%. The increase in the SOPR value may indicate that market participants continue to make profitable sales. However, if the SOPR level remains above 1, it indicates that the overall profitability in the market continues, and investor sentiment remains positive. An increase in the SOPR value in parallel with the price increase may suggest that the price movement is supported by a healthy profit realization and that the market continues to grow without reaching overbought or oversold conditions.
Derivatives
Open Interest
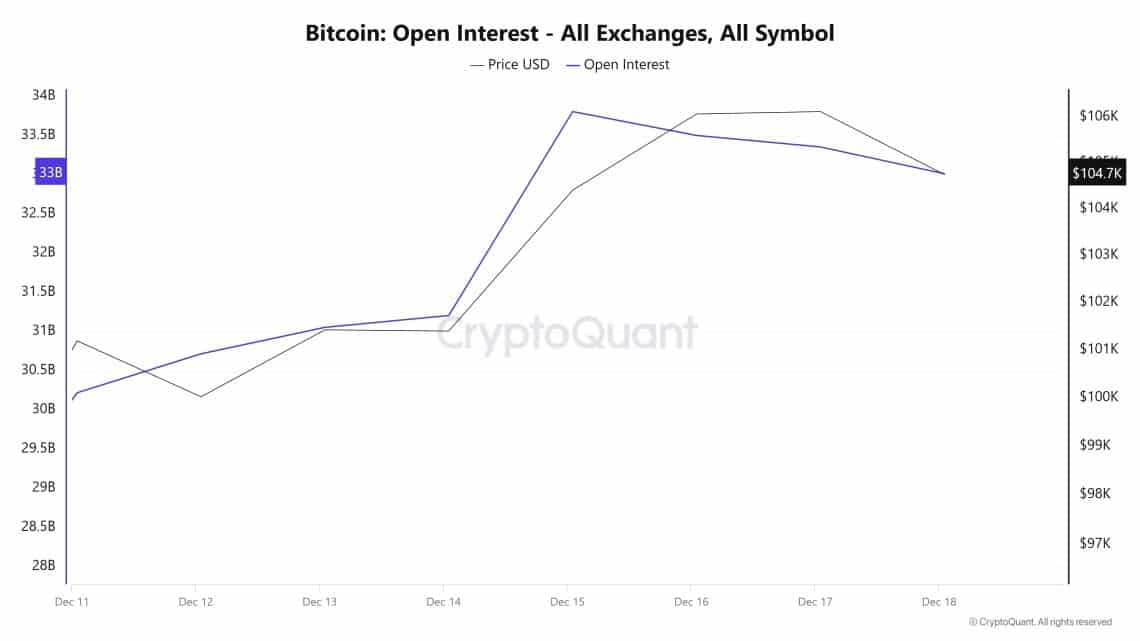
The chart shows a striking correlation between Bitcoin’s Open Interest and price action. Between December 11th and 13th, Open Interest rose slightly from 30.5B to 31B, while the BTC price saw a brief dip and then a recovery. The market was indecisive during this period, but traders tended to open new positions.
On December 14-15, there was a significant jump in open positions, with a sharp rise from 31B to 33B. At the same time, a strong increase in the BTC price was noted. This movement indicates that there was an intense opening of long positions in the market and an increased appetite for bullish risk. It is clear that investors supported the upward movement of the market in this process. As of December 16, there was a slight pullback in Open Interest, falling from 33B to 32.5B. The BTC price similarly declined to 104.7K. At this point, it is possible to say that profit-taking was activated, or some positions were closed. This pullback following the rise suggests that the market is in a short-term breathing process.
Overall, the fact that Open Interest is still hovering around 32B suggests that the market is attracting strong interest, and it is important to maintain this level. If open interest starts to increase again, the market could continue to rally. However, sudden pullbacks may trigger the liquidation of leveraged positions and cause volatile movements.
Funding Rate
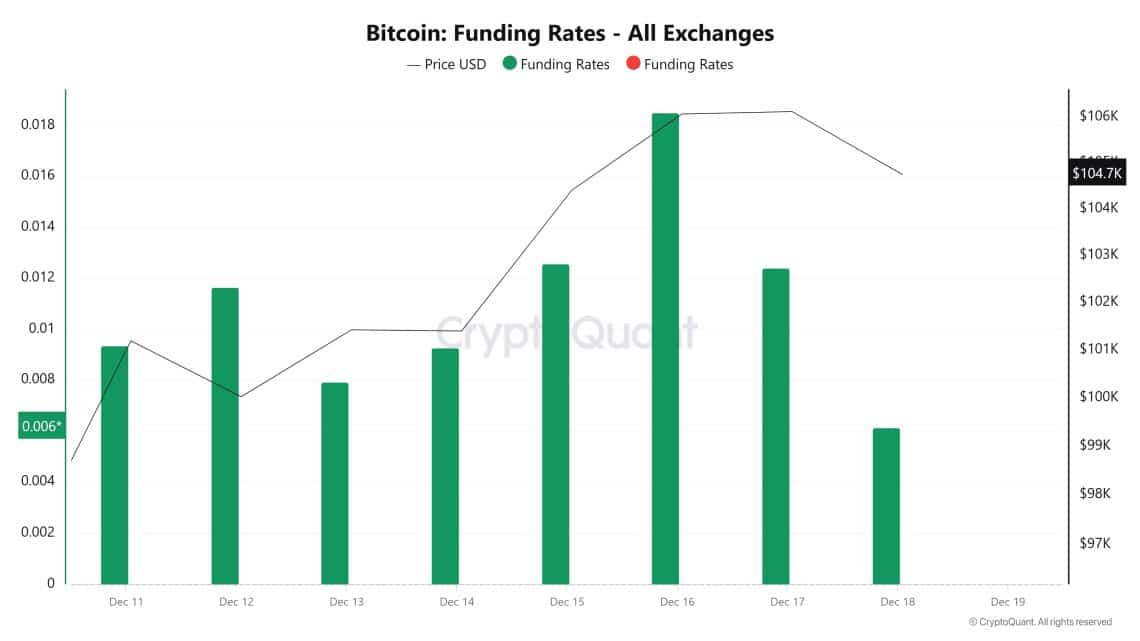
After Bitcoin hit an all-time high (ATH), the funding rate rose to 0.0185, indicating a heavy long position opening in the market. This was a clear indication of strong upside risk appetite, especially with leveraged trading. However, as the positions were closed, the funding rate fell to 0.006. With this retracement, the BTC price also entered a correction, falling as low as $105,000.
It is noteworthy that the Cumulative Volume Delta (CVD) data highlights the increase in demand in the futures market. This shows that the price action is mainly supported by futures. The decline in the funding rate with the closing of positions reveals that there is a short-term breathing process in the market and that the overheating has been somewhat smoothed.
The decline in the funding rate to these levels supports the expectation of a new uptrend by reducing the cost of long positions. If new long position openings are seen in the market and CVD data points to an upward momentum again, the potential for the price to continue its uptrend after the short-term correction may strengthen. At this point, keeping the funding rate at positive but sustainable levels should be monitored as a critical signal for a healthy uptrend.
Long & Short Liquidations
When we examine the Liquidation Map data, the $103,000 – $98,000 band stands out as the region where the most intense liquidation accumulation occurs across the market. Such regions play a critical role as liquidity attraction points, as price movements often target liquidity at these levels, leading to liquidation of positions. The recent volatility has significantly increased the liquidation amounts of both long and short positions. Especially with the upward movement of the price, liquidations in short positions reached remarkable levels. In this process, the liquidation of shorts reached $113.88 million, which was an important catalyst supporting the short-term rise in the price. These intense liquidation zones have a decisive impact on the direction of price movements. The fact that the price tends to retreat towards these levels, especially where large liquidation clusters are located, reveals the market’s motivation to collect liquidity. If the price moves towards the 103,000 – 98,000 band in the coming period, short-term volatility may increase, triggered by the liquidations concentrated here. Likewise, in upward movements, the price has the potential to gain more momentum as short positions are forced to close. In this period of volatility, liquidation zones stand out as critical monitoring areas, while the market’s tendency to act liquidity-oriented should not be ignored.
| History | Long Amount (Million $) | Short Amount (Million $) |
|---|---|---|
| December 12 | 16.44 | 11.46 |
| December 13th | 6.26 | 6.77 |
| December 14th | 5.15 | 3.99 |
| December 15 | 3.16 | 22 |
| December 16th | 29.73 | 61.26 |
| December 17th | 10.52 | 8.4 |
| Total | 71.26 | 113.88 |
Supply Distribution

Total Supply: It reached 19,797,105 units, up about 0.0143% from last week.
New Supply: The amount of BTC produced this week was 2,825.
Velocity: There was a small decline in the data compared to last week.
| Wallet Category | 10.12.2024 | 16.12.2024 | Change (%) | Analysis |
|---|---|---|---|---|
| < 0.1 BTC | 1.609% | 1.606% | -0.187% | There is a slight decline among small investors, micro investor interest may have fallen. |
| 0.1 – 1 BTC | 5.437% | 5.421% | -0.294% | Individual investors showed sensitivity to market volatility and partially reduced their positions. |
| 1 – 100 BTC | 32.318% | 32.307% | -0.034% | There is a very small decline among medium-sized investors. |
| 100 – 1k BTC | 22.02% | 22.128% | +0.49% | The increase in the number of large investors may indicate increased confidence in the market among this group. |
| 1k – 100k BTC | 35.341% | 35.259% | -0.23% | Whales may have partially reduced their positions or realized profits in their portfolios. |
| > 100k BTC | 3.274% | 3.277% | +0.09% | Institutions and large funds increased their positions. |
General Evaluation
Changes in wallet distributions compared to last week reveal differences in investor strategies. While there was a slight decrease among small and individual investors, the increase in large investors and institutional funds shows that the market is gaining long-term confidence. In particular, the increase in the 100-1k BTC range supports the continued adoption of Bitcoin as a store of value. The increase in ETFs and MicroStrategy’s purchase of 15,350 BTC this week stand out as a development in line with the rates in wallet distribution. The fact that large and institutional investors continue to increase positions even at high price levels shows that market expectations are shaping positively and confidence that Bitcoin will maintain its value is growing.
Exchange Reserve
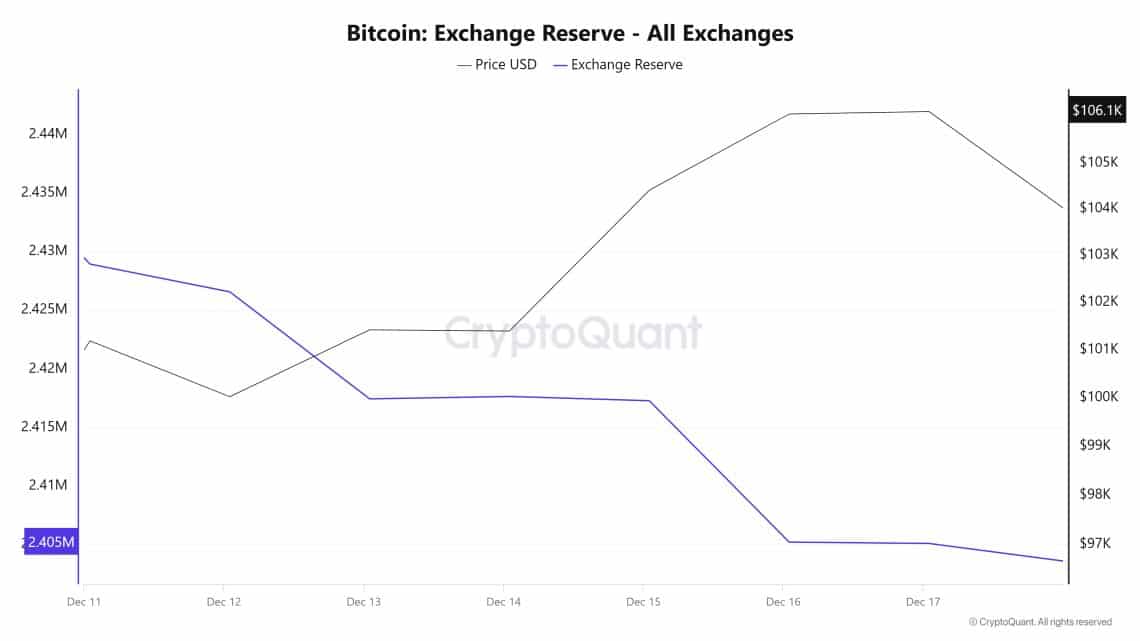
Between December 11 and December 17, 2024, there were 36,885 Bitcoin outflows from exchanges. During this period, the Bitcoin reserves of the exchanges decreased by approximately 1.5%. On December 11, 2024, Bitcoin experienced a daily close above $100,000 and did not fall below $100,000 until the close of December 17, 2024. On December 17, 2024, Bitcoin rose above $108,000 and after renewing the ATH, the daily close was at $106,000 on December 17, 2024.
| Date | Exchange Inflow | Exchange Outflow | Exchange Netflow | Exchange Reserve | BTC Price |
|---|---|---|---|---|---|
| 11-Dec | 79,769 | 92,788 | -13,019 | 2,428,965 | 101,194 |
| 12-Dec | 48,981 | 51,357 | -2,376 | 2,426,589 | 100,026 |
| 13-Dec | 60,401 | 69,539 | -9,138 | 2,417,451 | 101,425 |
| 14-Dec | 13,331 | 13,126 | 206 | 2,417,657 | 101,400 |
| 15-Dec | 12,485 | 12,851 | -365 | 2,417,291 | 104,409 |
| 16-Dec | 55,780 | 67,854 | -12,075 | 2,405,216 | 106,075 |
| 17-Dec | 47,712 | 47,828 | -117 | 2,405,100 | 106,129 |
While the Bitcoin reserves of the exchanges continued to decrease, the Bitcoin price increased. In particular, on December 11, 2024, 13,019 Bitcoins were released from exchanges, while the Bitcoin price increased by approximately 4.7%. Similarly, on December 16, 2024, there were 12,075 Bitcoin outflows from exchanges while Bitcoin saw ATH replenishments. While the decrease in exchanges’ Bitcoin reserves has led to high volatility in the short term, large investors continuing to move their Bitcoins to cold wallets may strengthen the upside potential of the Bitcoin price in the long term.
Fees and Revenues
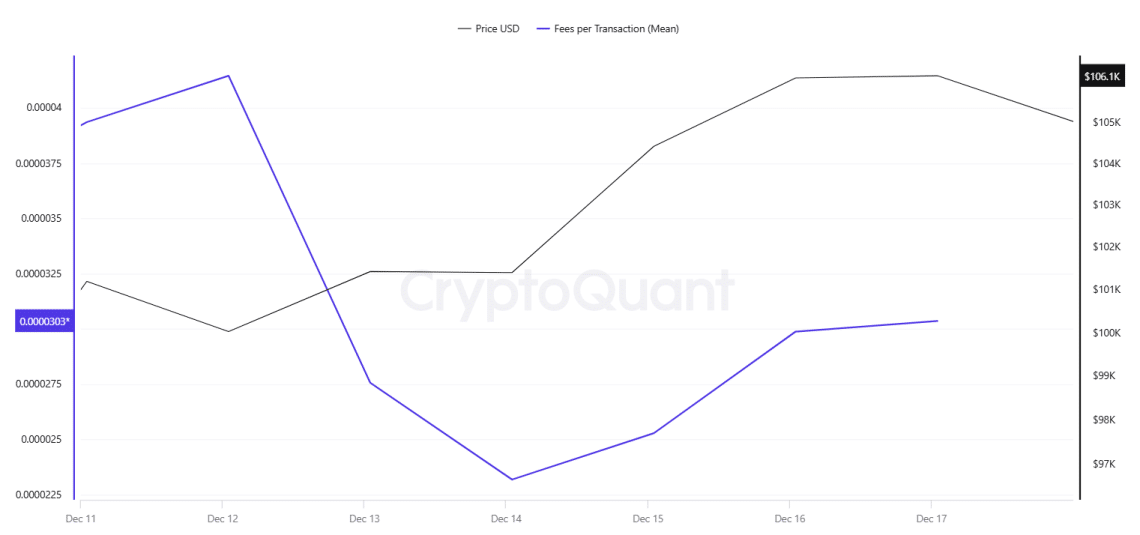
An analysis of Bitcoin Fees per Transaction (Mean) data between December 11-17 reveals that the average transaction fee, which was 0.00003594 on December 11, retreated to 0.00002318 on December 14, the lowest level of the week, following the positive acceleration in the Bitcoin price on December 12. In the following days, Fees per Transaction (Mean) rose in line with the price movement as the Bitcoin price moved towards new all-time highs (ATH) levels, reaching 0.00003036 on December 17, the last day of the week.
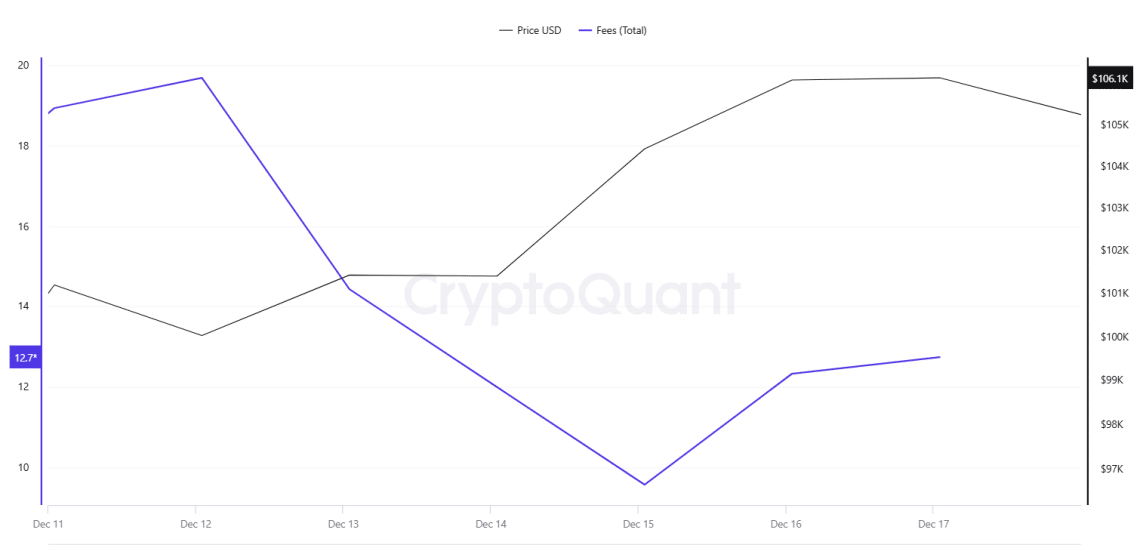
Similarly, an analysis of Bitcoin Fees (Total) data between December 11-17 reveals that total transaction fees, which declined on December 12 following the positive momentum in the Bitcoin price, fell to 9.56601823 on December 15, hitting the lowest value of the week. Fees (Total), which rose in correlation with the Bitcoin price movement in the following days, reached 12.73761816 on December 17, the last day of the week.
Miner Flows
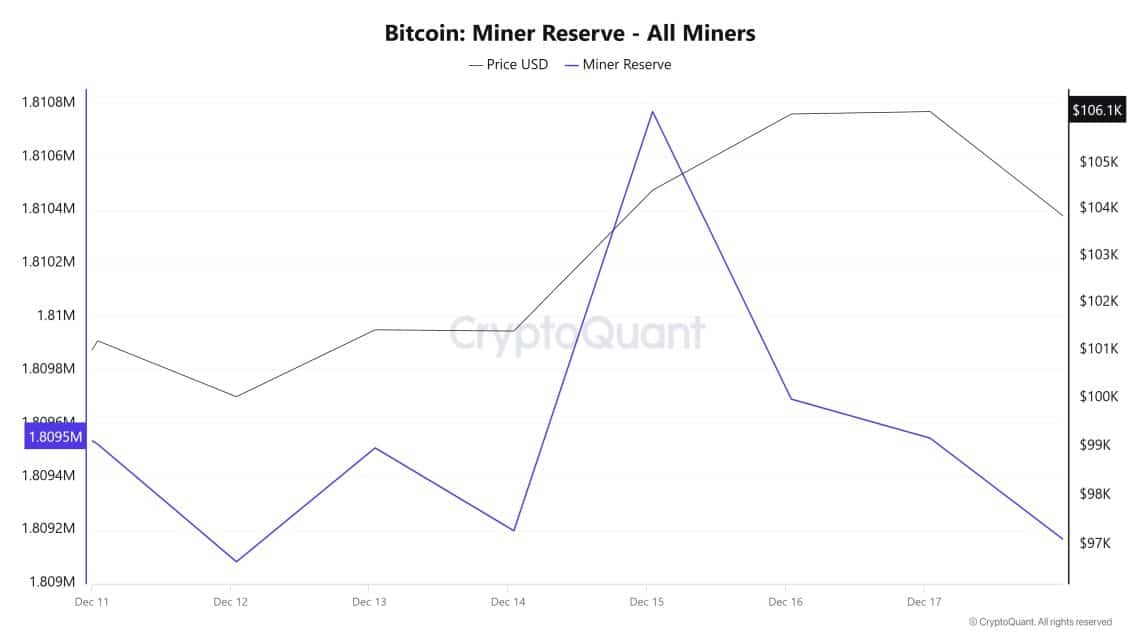
As can be seen in the Miner Reserve table, the number of Bitcoins in miners’ wallets decreased at the beginning of the week and then increased. During the week, miner reserve and Bitcoin price had a positive correlation.
Miner Inflow, Outflow and Netflow
Between December 11th and 17th, 47,768 Bitcoins were outflowed from miners’ wallets and 47,461 Bitcoins were inflowed into miners’ wallets between the same dates. Miner netflow for this week was – 306 Bitcoin. On December 11, the Bitcoin price was $101,190, while on December 17 it was $106,128.
During the week, Bitcoin inflow into miner wallets (Miner Inflow) was less than Bitcoin outflow from miner wallets (Miner Outflow), resulting in an overall negative net flow (Miner Netflow).
If the recent positive correlation between miner reserve and Bitcoin price continues in the coming week, increased outflows from miner wallets may create selling pressure in the market, and possible declines in miner netflow may cause Bitcoin price to fall.
| Date | Miner Inflow | Miner Outflow | Miner Netflow |
|---|---|---|---|
| 11 Dec | 7,670.4 | 8,000.0 | -329.57 |
| 12 Dec | 6,507.21 | 6,948.53 | -441.32 |
| 13 Dec | 5,128.73 | 4,701.47 | 427.26 |
| 14 Dec | 4,064.75 | 4,375.85 | -311.10 |
| 15 Dec | 6,339.02 | 4,765.93 | 1,573.09 |
| 16 Dec | 10,225 | 11,304.10 | -1,079.11 |
| 17 Dec | 7,526.51 | 7,672.62 | -146.10 |
Transaction
Transaction Count
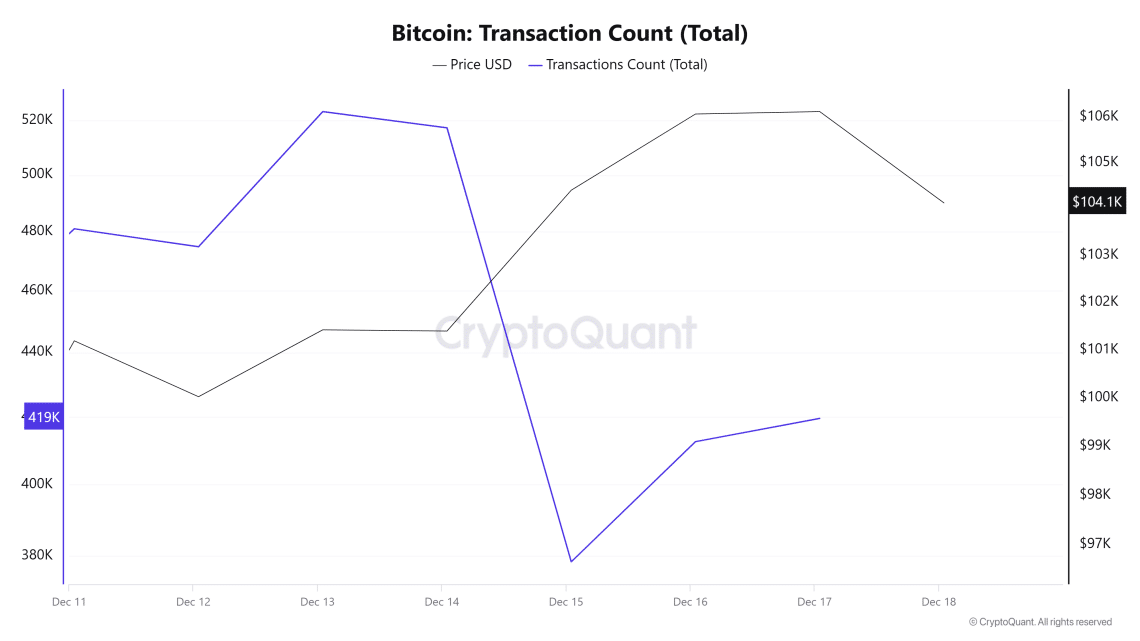
An analysis of Bitcoin transfers between December 11-17 reveals a significant decrease in the number of transfers on the Bitcoin network in the days after December 13. Since this decrease coincided with the weekend, it can be assumed that the changes in the amount of transfers may be due to the transactions carried out by institutional investors on weekdays, indicating a usage trend that disappears during the holidays. Excluding weekend days, there is a directly proportional relationship between the number of transfers and the price.
In addition to the number of transfers, we also analyzed the total amount of Bitcoin moved during the transfers. There was a significant decrease in the amount of Bitcoin transferred on December 14-15 compared to other days. Especially on these dates, the “Number of Bitcoins Transferred/Number of Transactions” ratio dropped significantly and reached a low level. This confirms the impact of institutional investors by showing that transfers carrying large amounts of Bitcoin decreased on weekends.
Tokens Transferred Mean
The average amount of Bitcoin per transfer between December 11-17 ranged between 0.83 and 2.28. Compared to the previous week, this average was down. While the average amount of Bitcoin transferred on December 14-15 was at the lowest levels of the week, the average number of transfers during the week was about 2.5 times higher than at the end of the week.
Whale Activities
If we look at Bitcoin’s price performance in 2024, it went down in the history books by breaking the $100,000 mark for the first time. However, reaching this milestone opened the door to another conversation. When will the market peak? As a result, various predictions regarding the Bitcoin price peak have emerged from the crypto crowd over the past few weeks. The latest on-chain observation suggests that the market may not have peaked yet, or may not be close to it. Bitcoin whales have bought $7.28 billion worth of BTC in the last 48 hours, taking nearly 70,000 BTC off the market. Moreover, only 450 BTC are mined per day. Therefore, the total Bitcoin mined in 48 hours is only 900 BTC. While there are always willing buyers and sellers in the crypto market, market dynamics suggest that they may be reluctant to sell if they expect a supply crunch. Such a supply shortage scenario, mixed with ever-increasing demand, could push prices higher.
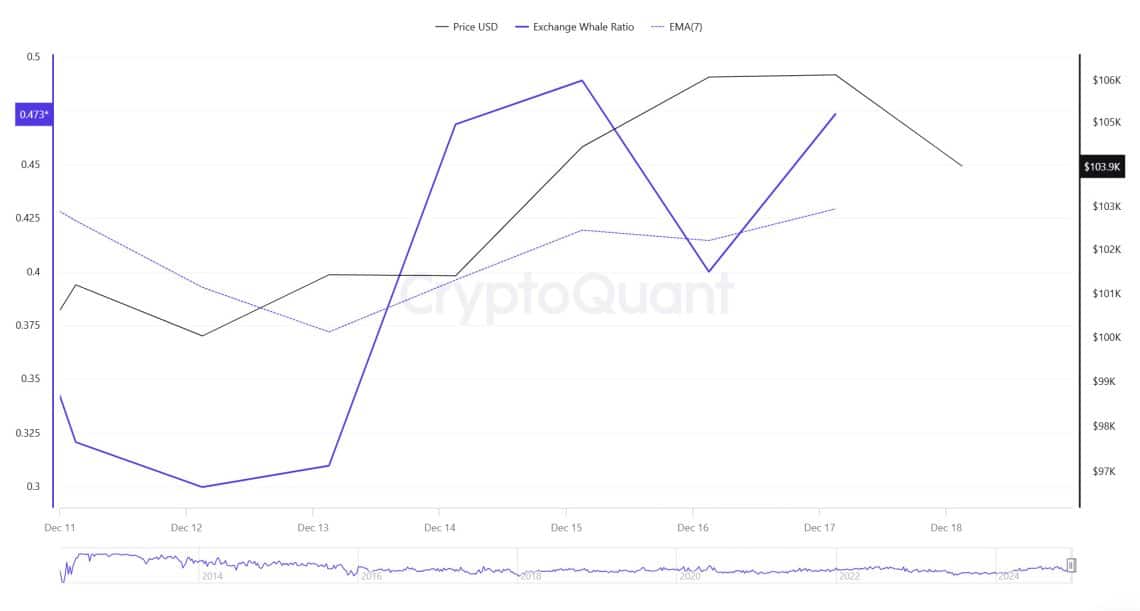
Cryptoquant Data
When we look at the weekly whale movements, it shows that central exchanges are used by whales in a high way. When we look at this ratio, it is seen at a rate of 0.473. When this ratio is above 0.350, it usually means that whales often use central exchanges. Although this means that there may be selling pressure at any time, it is seen that centralized exchanges are used more for BTC purchases this week. At the same time, when we look at the total BTC transfer, it has decreased compared to last week and it is seen that 5,038,392 BTC has moved.
LEGAL NOTICE
The investment information, comments and recommendations contained in this document do not constitute investment advisory services. Investment advisory services are provided by authorized institutions on a personal basis, taking into account the risk and return preferences of individuals. The comments and recommendations contained in this document are of a general type. These recommendations may not be suitable for your financial situation and risk and return preferences. Therefore, making an investment decision based solely on the information contained in this document may not result in results that are in line with your expectations.
NOTE: All data used in Bitcoin onchain analysis is based on Cryptoquant.
