MARKET SUMMARY
Latest Situation in Crypto Assets
| Assets | Last Price | 24h Change | Dominance | Market Cap |
|---|---|---|---|---|
| BTC | 95,377.47 | 0.46% | 56.20% | 1,88 T |
| ETH | 3,441.78 | 3.98% | 12.36% | 414,17 B |
| XRP | 2.295 | 5.43% | 3.92% | 131,27 B |
| SOLANA | 194.61 | 6.90% | 2.78% | 93,24 B |
| DOGE | 0.3277 | 5.66% | 1.44% | 48,29 B |
| CARDANO | 0.9210 | 5.26% | 0.97% | 32,35 B |
| TRX | 0.2551 | 2.80% | 0.66% | 21,98 B |
| AVAX | 40.19 | 10.75% | 0.49% | 16,46 B |
| LINK | 24.68 | 9.00% | 0.47% | 15,72 B |
| SHIB | 0.00002309 | 7.39% | 0.40% | 13,57 B |
| DOT | 7.496 | 8.43% | 0.34% | 11,45 B |
*Prepared on 12.24.2024 at 14:00 (UTC)
WHAT’S LEFT BEHIND
Bitcoin Spot ETFs See Exits, Ethereum ETFs See Inflows
Bitcoin spot ETFs saw net outflows of $227 million yesterday, continuing the downtrend for three consecutive days. The total net asset value of Bitcoin spot ETFs fell to $105.084 billion. Ethereum spot ETFs recorded a net inflow of $131 million in the same period. There were net inflows of $89.5129 million into BlackRock ETF ETHA and $46.37 million into Fidelity ETF FETH. The total net asset value of Ethereum spot ETFs reached $12.05 billion.
Cryptocurrency Donates Big to Trump’s Presidential Inauguration: Companies Lined Up
Donald Trump’s presidential election win has caused a stir in the crypto world. Leading companies such as Coinbase, Kraken, Moonpay and Ripple have been donating heavily to support Trump’s presidential inauguration and competing to take part in the ceremony.
6-Year Crypto Ban from Russia in 10 Regions
Russia has completely banned cryptocurrency mining in 10 regions for 6 years on the grounds of energy saving. In addition, restrictions were imposed on mining activities in 3 regions. These decisions are a continuation of the mining laws enacted in August and October.
New Bitcoin Plan from MicroStrategy: Shareholders to be Asked
MicroStrategy, which attracts attention with its Bitcoin investments, plans to increase the number of shares in order to buy more Bitcoin. The company is seeking broader support for its investment decisions by putting this plan to a shareholder vote.
Less Than 1.2 Million Bitcoins Left to Mine
According to CloverPool data, Bitcoin circulation has reached 19,800,490.63 BTC and the amount of minable Bitcoin is only 1,199,509.375 BTC. With an average of 450 BTC mined daily, the current block reward stands at 3,125 BTC.
HIGHLIGHTS OF THE DAY
Important Economic Calender Data
*There are no important calendar developments for the rest of the day.
INFORMATION
*The calendar is based on UTC (Coordinated Universal Time) time zone.
The economic calendar content on the relevant page is obtained from reliable news and data providers. The news in the economic calendar content, the date and time of the announcement of the news, possible changes in the previous, expectations and announced figures are made by the data provider institutions. Darkex cannot be held responsible for possible changes that may arise from similar situations
MARKET COMPASS
Volumes are down in global markets on Christmas Eve and US stock markets will trade for half a day today. Dow Jones will close at 1 p.m. local time. The flat outlook in European stock markets also dominated Wall Street futures contracts. Yesterday, there were strong rises led by technology stocks.
While the US Federal Reserve’s (FED) possible 2025 course in interest rate cuts continues to be the most talked about topic, the steps that the Chinese government will take to support the country’s economy continue to be on the agenda. After the FED’s meeting last week, where the Fed signaled that it would cut interest rates at a slower pace than previously anticipated, we saw a decline in risk appetite and then we watched a period in which the markets started to digest this change. This situation continues for now
The outlook following the FED’s announcements, which also had an impact on digital assets, seems to be gradually giving way to more balanced price changes. This is also due to the low trading volumes brought by Christmas. Ahead of the short trading session in the US, we saw that the rise in major cryptocurrencies started to gain ground. We think that this movement may remain limited unless there is a new dynamic. Nevertheless, we think that the short-term pressured outlook we mentioned in our previous analysis has softened and we may see price changes closer to flat. For the long term, we do not see a big reason to change the picture mentioned below for now.
From the short term to the big picture.
The victory of former President Trump on November 5, which was one of the main pillars of our bullish expectation for the long-term outlook in digital assets, produced a result in line with our predictions. Afterwards, the appointments made by the president-elect and the expectations of increased regulation of the crypto ecosystem in the US continued to be a positive variable in our equation. Although it is expected to continue at a slower pace, the FED’s signal that it will continue its interest rate cut cycle and the volume in crypto asset ETFs indicating an increase in institutional investor interest (in addition to MicroStrategy’s BTC purchases, BlackRock’s BTC ETF options start trading…) support our upward forecast for the big picture for now.
In the short term, given the nature of the market and pricing behavior, we think it would not be surprising to see occasional pauses or pullbacks in digital assets. However, at this point, it is worth emphasizing again that the fundamental dynamics continue to be bullish.
TECHNICAL ANALYSIS
BTC/USDT
MicroStrategy, which attracts attention with its Bitcoin investments, plans to increase the number of shares in order to buy more Bitcoin. The company is seeking broader support for its investment decisions by submitting this plan to a shareholder vote. On the other hand, as we approach the end of the year, volatility in the market may continue to decline in the medium term due to low trading volumes and reduced expectations of corporate activity, in line with the expectations we stated in our monthly strategy report last month
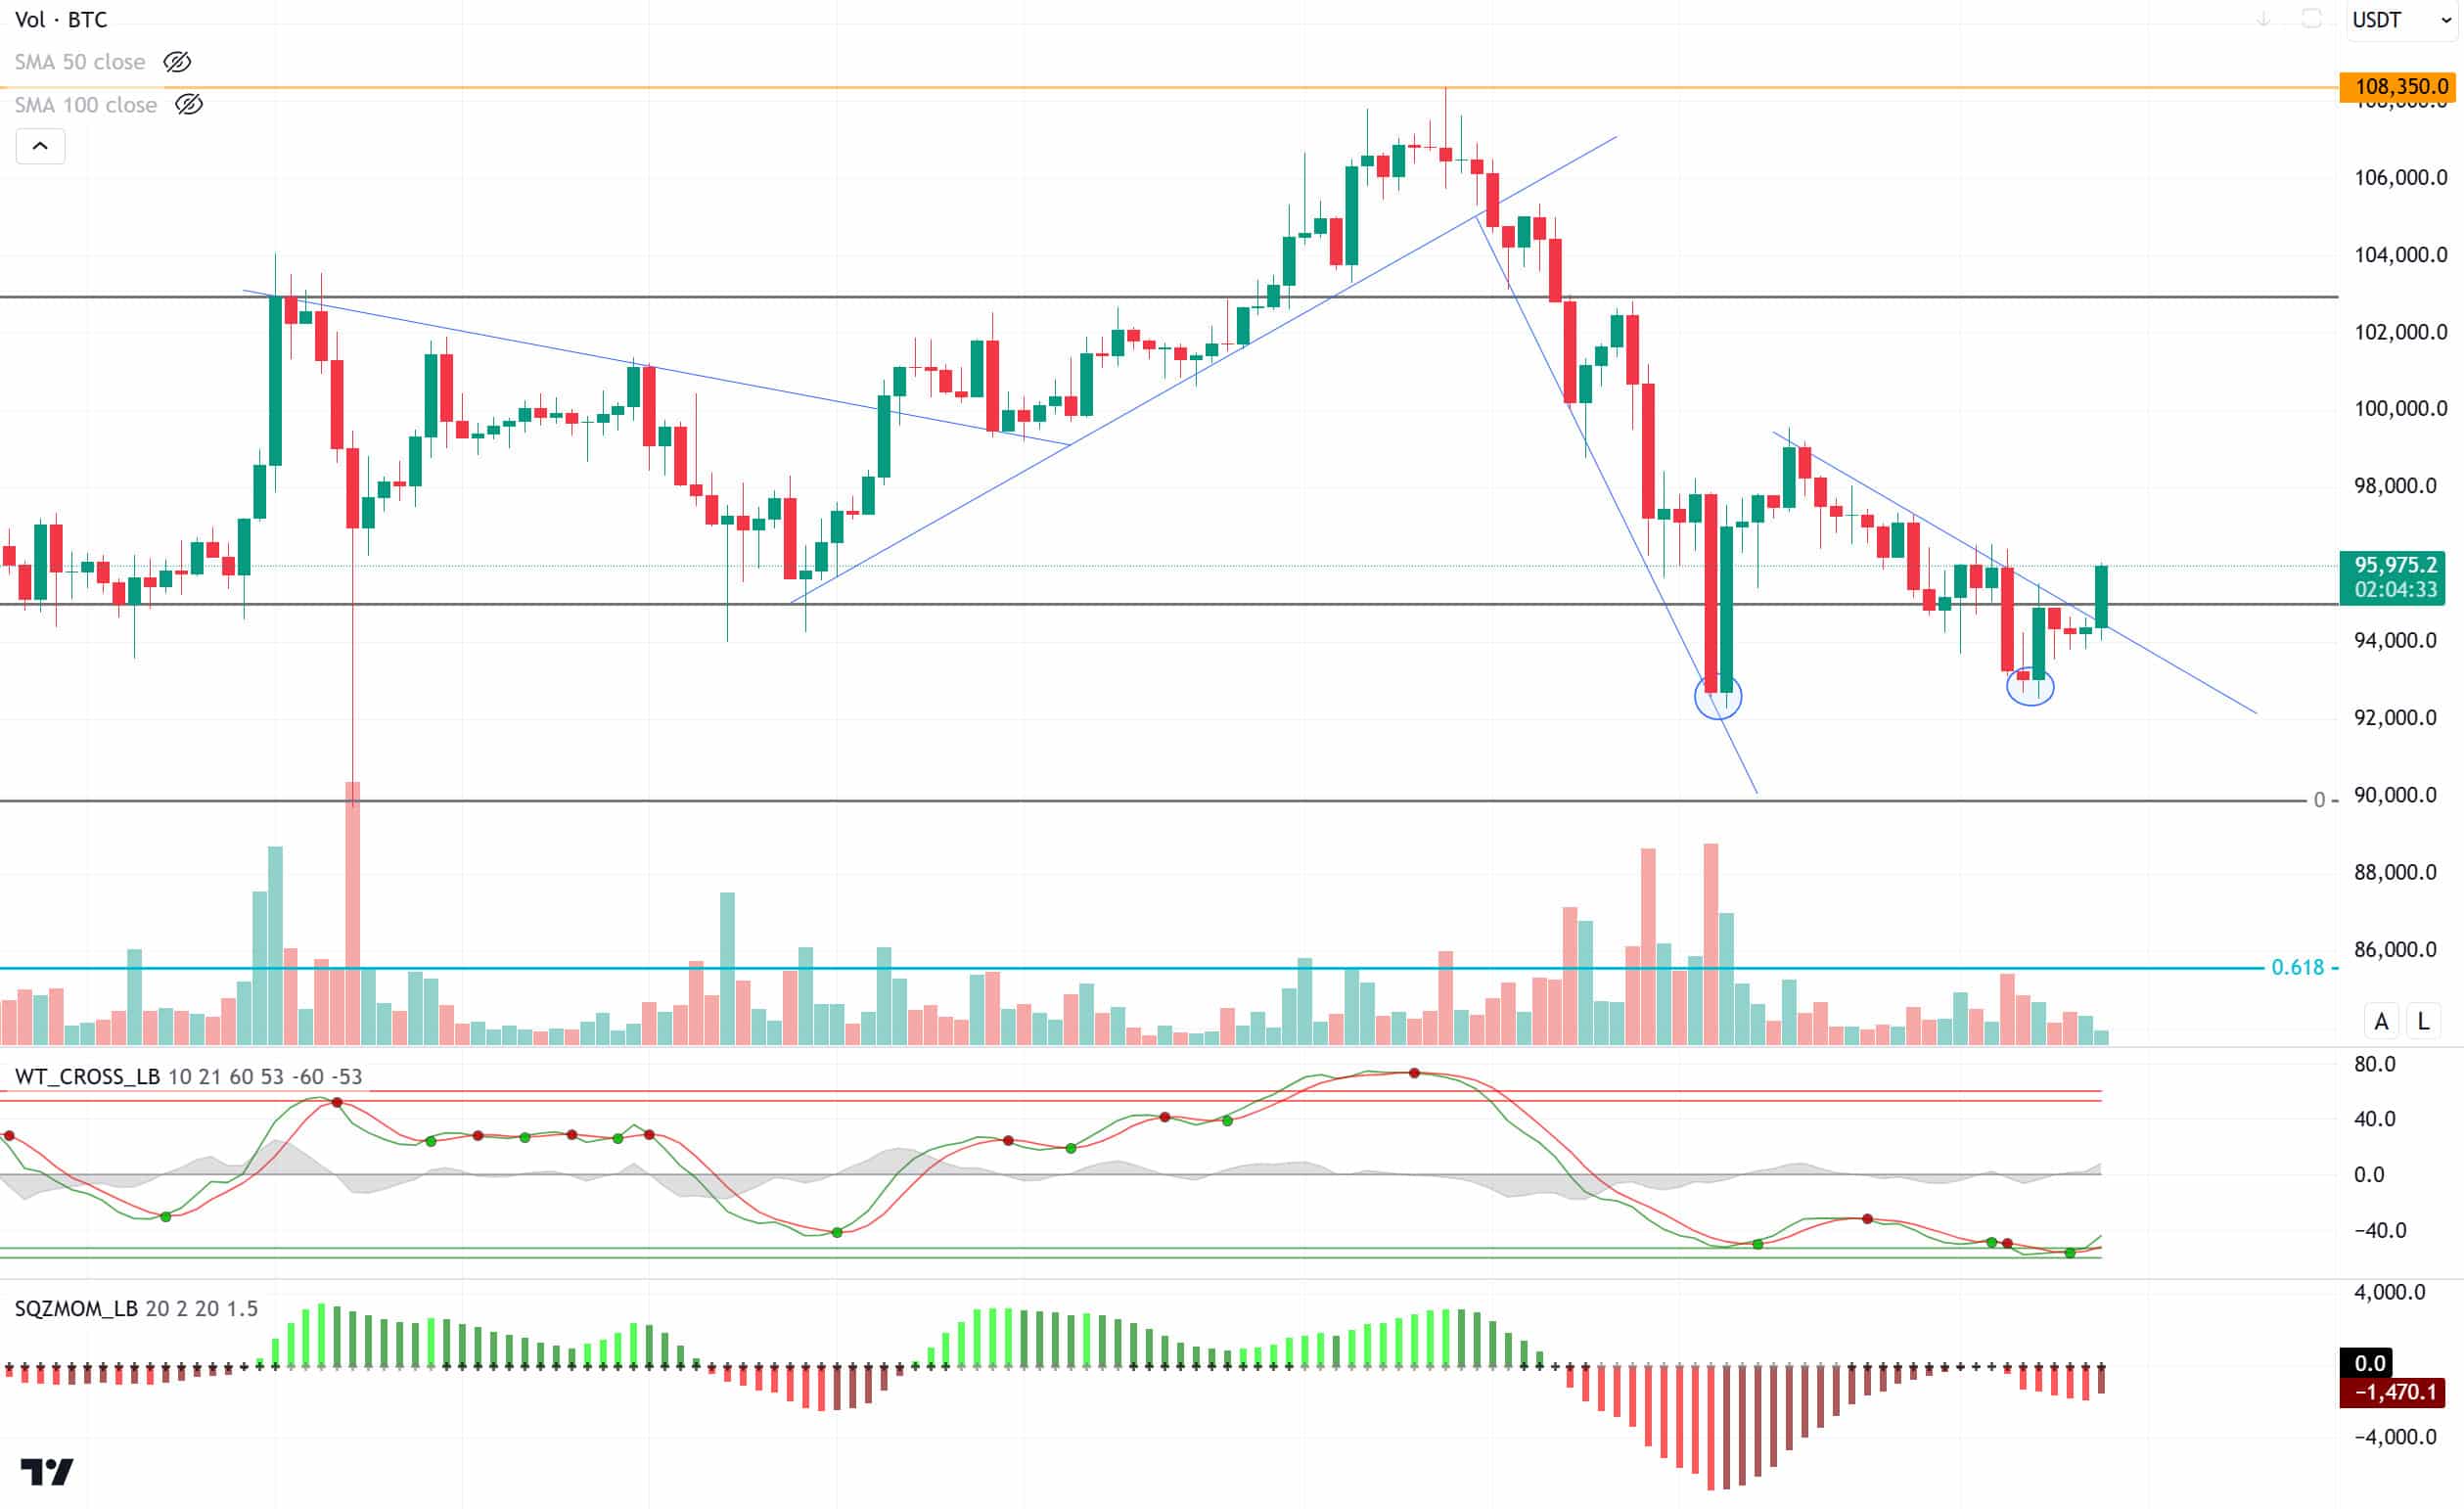
When we look at the technical outlook, the price formation that forms the double bottom formation we emphasized in the previous analysis has turned its direction upwards in line with the formation expectations. BTC, which was priced at 94,000 in the morning hours, is currently trading above the 95,000-resistance point, reaching 95,900. With technical oscillators giving a buy signal in the oversold zone, the momentum indicator is weakening in the negative zone. In the continuation of the rise, closures above the resistance level of 95,000 will be monitored, the 97,200 level can be tested, and in a possible retreat, we will follow the 92,550-support level.
Supports 92,550 – 91,450 – 90,000
Resistances 95,000 – 97,200 – 98,000
ETH/USDT
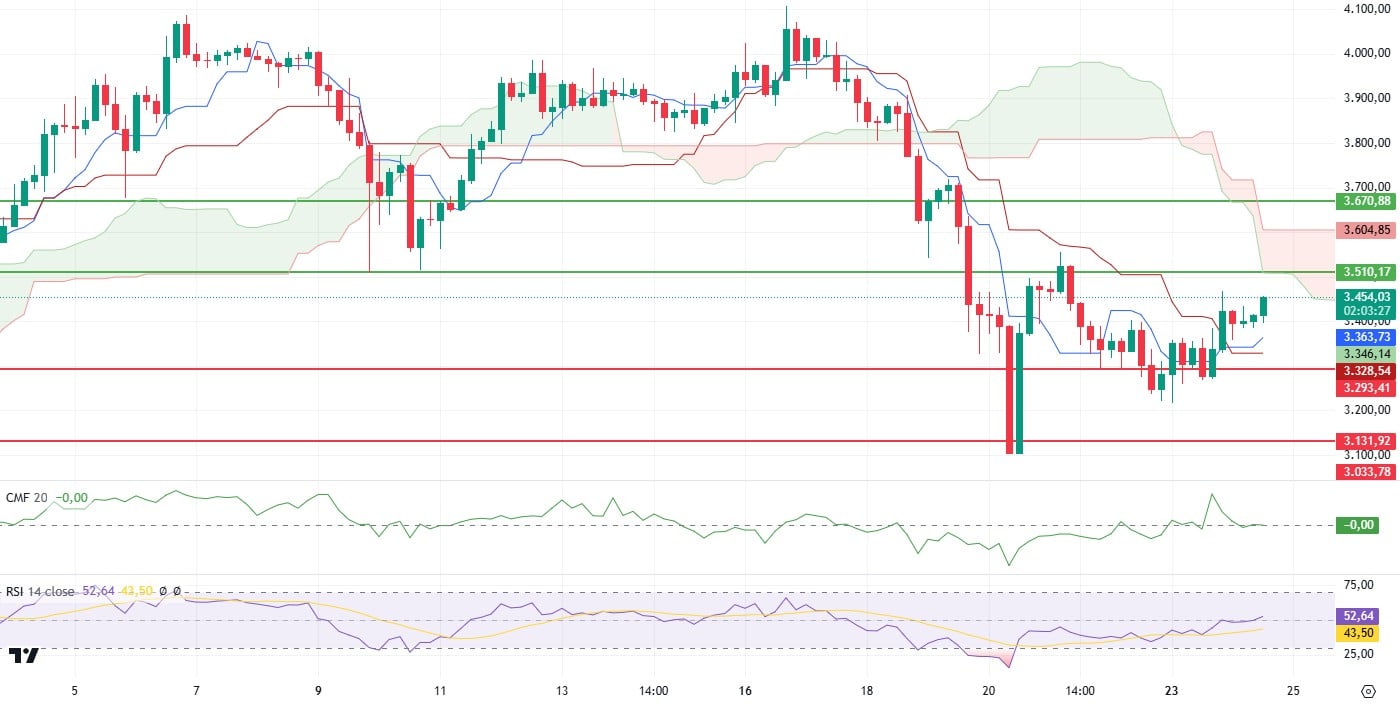
Ethereum has recovered from last week’s decline and regained the 3,293 level, showing a relatively positive outlook in the market. In this process, the increase in on-chain activity stands out as another positive factor supporting the recovery.
The Relative Strength Index (RSI) indicator regained an upward momentum, shaking off the previous negative outlook. However, when we analyze the short-term price movements, we see that the negative divergence still persists in the 4-hour timeframe. This indicates that the buying momentum has not fully strengthened. Chaikin Money Flow (CMF) is flat after retreating to zero. This suggests that capital flows are neutral and there is a balance between buyers and sellers. On the Ichimoku indicator, a strong buy signal was formed as the tenkan sen line crossed the kijun sen line upwards . However, for this signal to be effective, it is critical for the price to exceed the kumo cloud lower band of 3,510. Closes above this level will be a fundamental confirmation for the continuation of the uptrend. 3,400 intermediate support is the first line of defense in short-term declines. If the 3,400 level is lost, there is a risk that the price will fall back to 3,293. Breaching the 3,510 level could turn the market perception in a more positive direction and ensure the continuation of the uptrend.
Although Ethereum’s current outlook signals a recovery, critical levels need to be breached for the upside to strengthen. Technical indicators such as RSI and Ichimoku suggest that buyers may increase their control over the price, while the horizontal course of CMF should be carefully monitored. Breaking the 3,510 level is expected to strengthen the upward movement, while 3,400 and 3,293 support levels will be at the forefront in possible pullbacks.
Supports 3,293 – 3,131- 3,033
Resistances 3,510 – 3,670 – 3,798
XRP/USDT
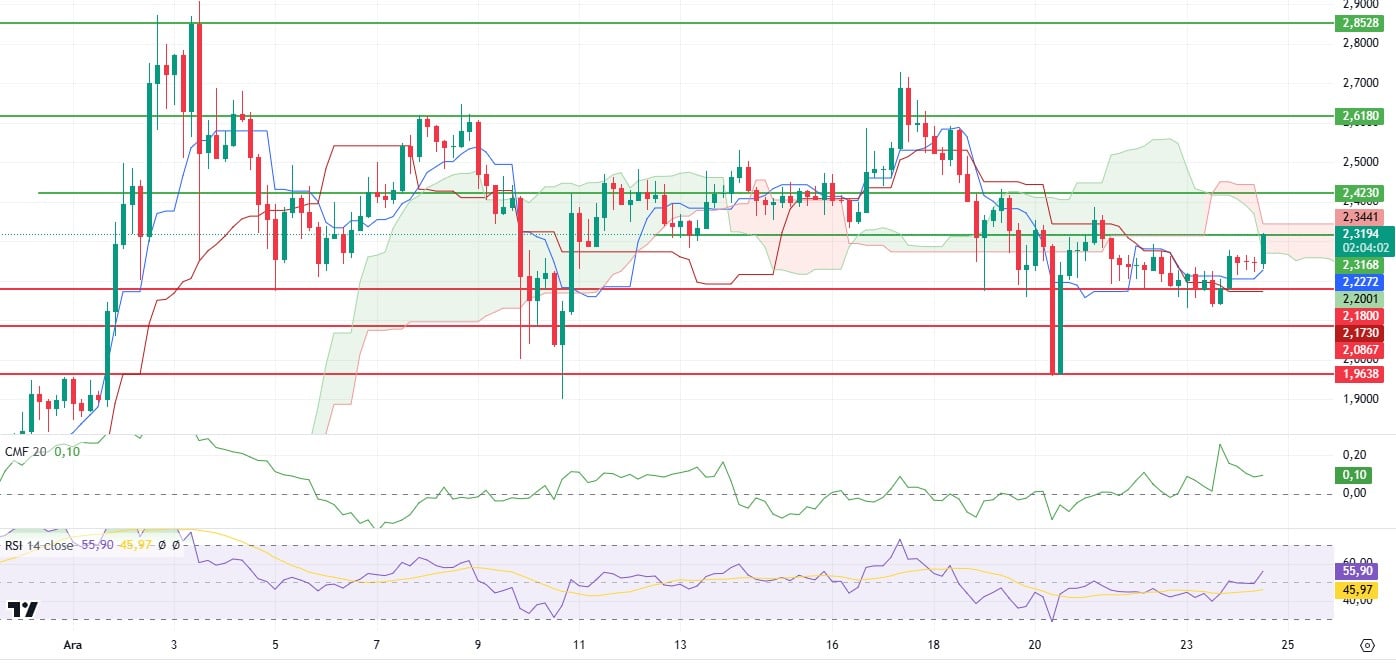
XRP attracted attention by rising above the 2.30 level today as the market followed a slightly positive course. The fact that it managed to stay above the 2.18 level by taking a strong stance after the recent decline reveals a positive outlook. Technical indicators also support this optimism.
The slowdown of the sharp decline in the Chaikin Money Flow (CMF) indicator indicates that the balance in capital flows is recovering. However, the upward movement of the RSI (Relative Strength Index) indicator suggests that buying momentum is starting to strengthen. This paints a positive picture for XRP. When we look at the Ichimoku indicator, the price entering the Kumo cloud boundaries with the buy signal indicates that the trend may gain positive momentum. However, for this outlook to strengthen, it is important for the price to permanently exceed the 2.32 level . Movements above this level may trigger a stronger rise, especially in the evening hours. On the support side, the 2.18 level plays a key role. However, closes below this level may increase the risk of price exposure to deeper declines.
Supports 2.1800 – 2.0867- 1.9638
Resistances 2.3268 – 2.4230 – 2.6173
SOL/USDT
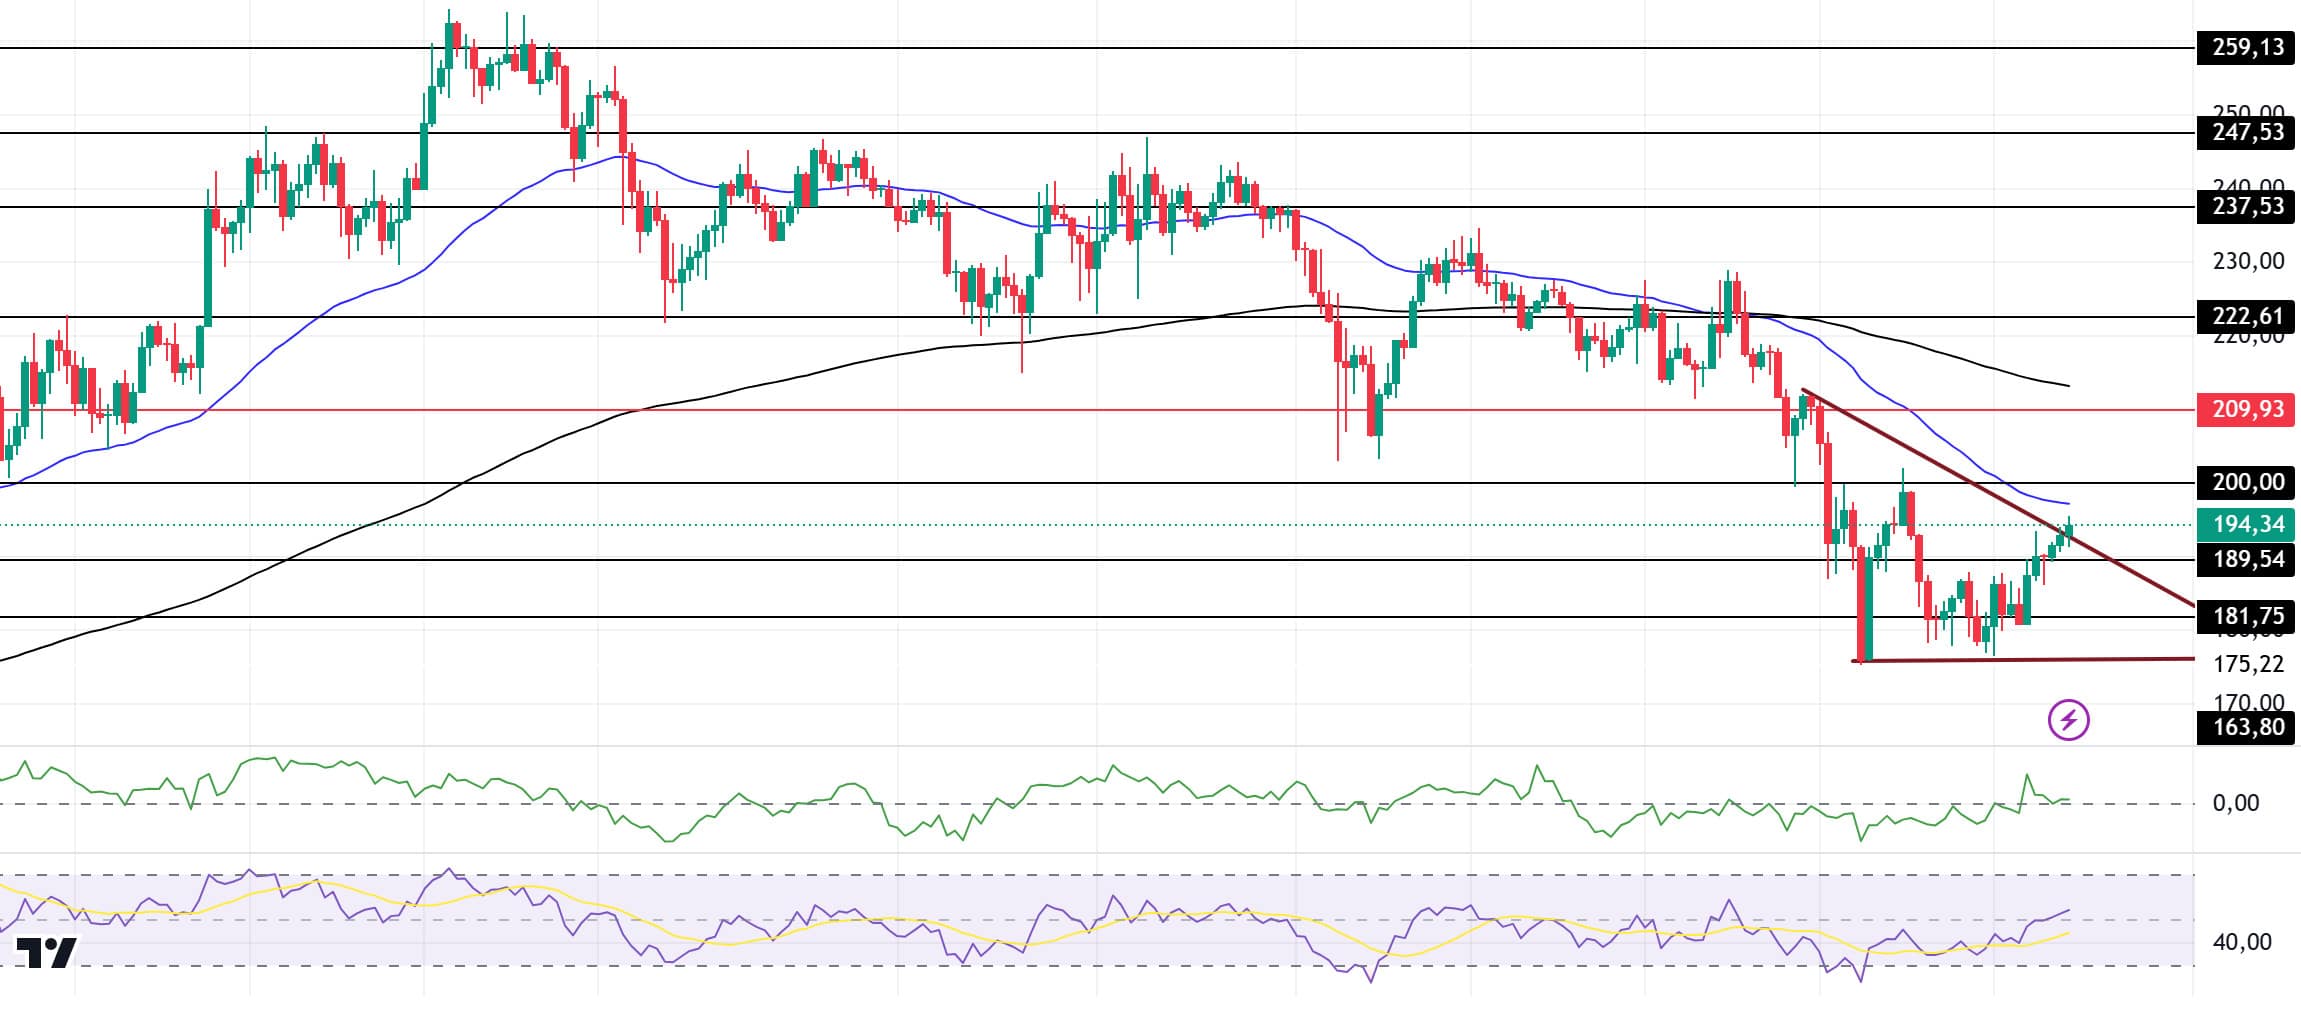
On the 4-hour timeframe, the 50 EMA (Blue Line) is below the 200 EMA (Black Line). Although there is a rise, the momentum required to break the 200.00 level, which is a strong resistance, does not seem to have formed at the moment. When we analyze the Chaikin Money Flow (CMF)20 indicator, money inflows are decreasing and accelerating towards the neutral level. This seems to create selling pressure. On the other hand, the descending triangle pattern should be taken into consideration. If it breaks this pattern in the opposite direction, the rise may continue. However, Relative Strength Index (RSI)14 has accelerated slightly from the neutral zone to the positive zone. The 200.00 level stands out as a very strong resistance point in the rises driven by both the upcoming macroeconomic data and the news in the Solana ecosystem. If it breaks here, the rise may continue. In case of retracements for the opposite reasons or due to profit sales, the 163.80 support level can be triggered. If the price comes to these support levels, a potential bullish opportunity may arise if momentum increases.
Supports 189.54 – 181.75 – 163.80
Resistances 200.00 – 209.93 – 222.61
DOGE/USDT
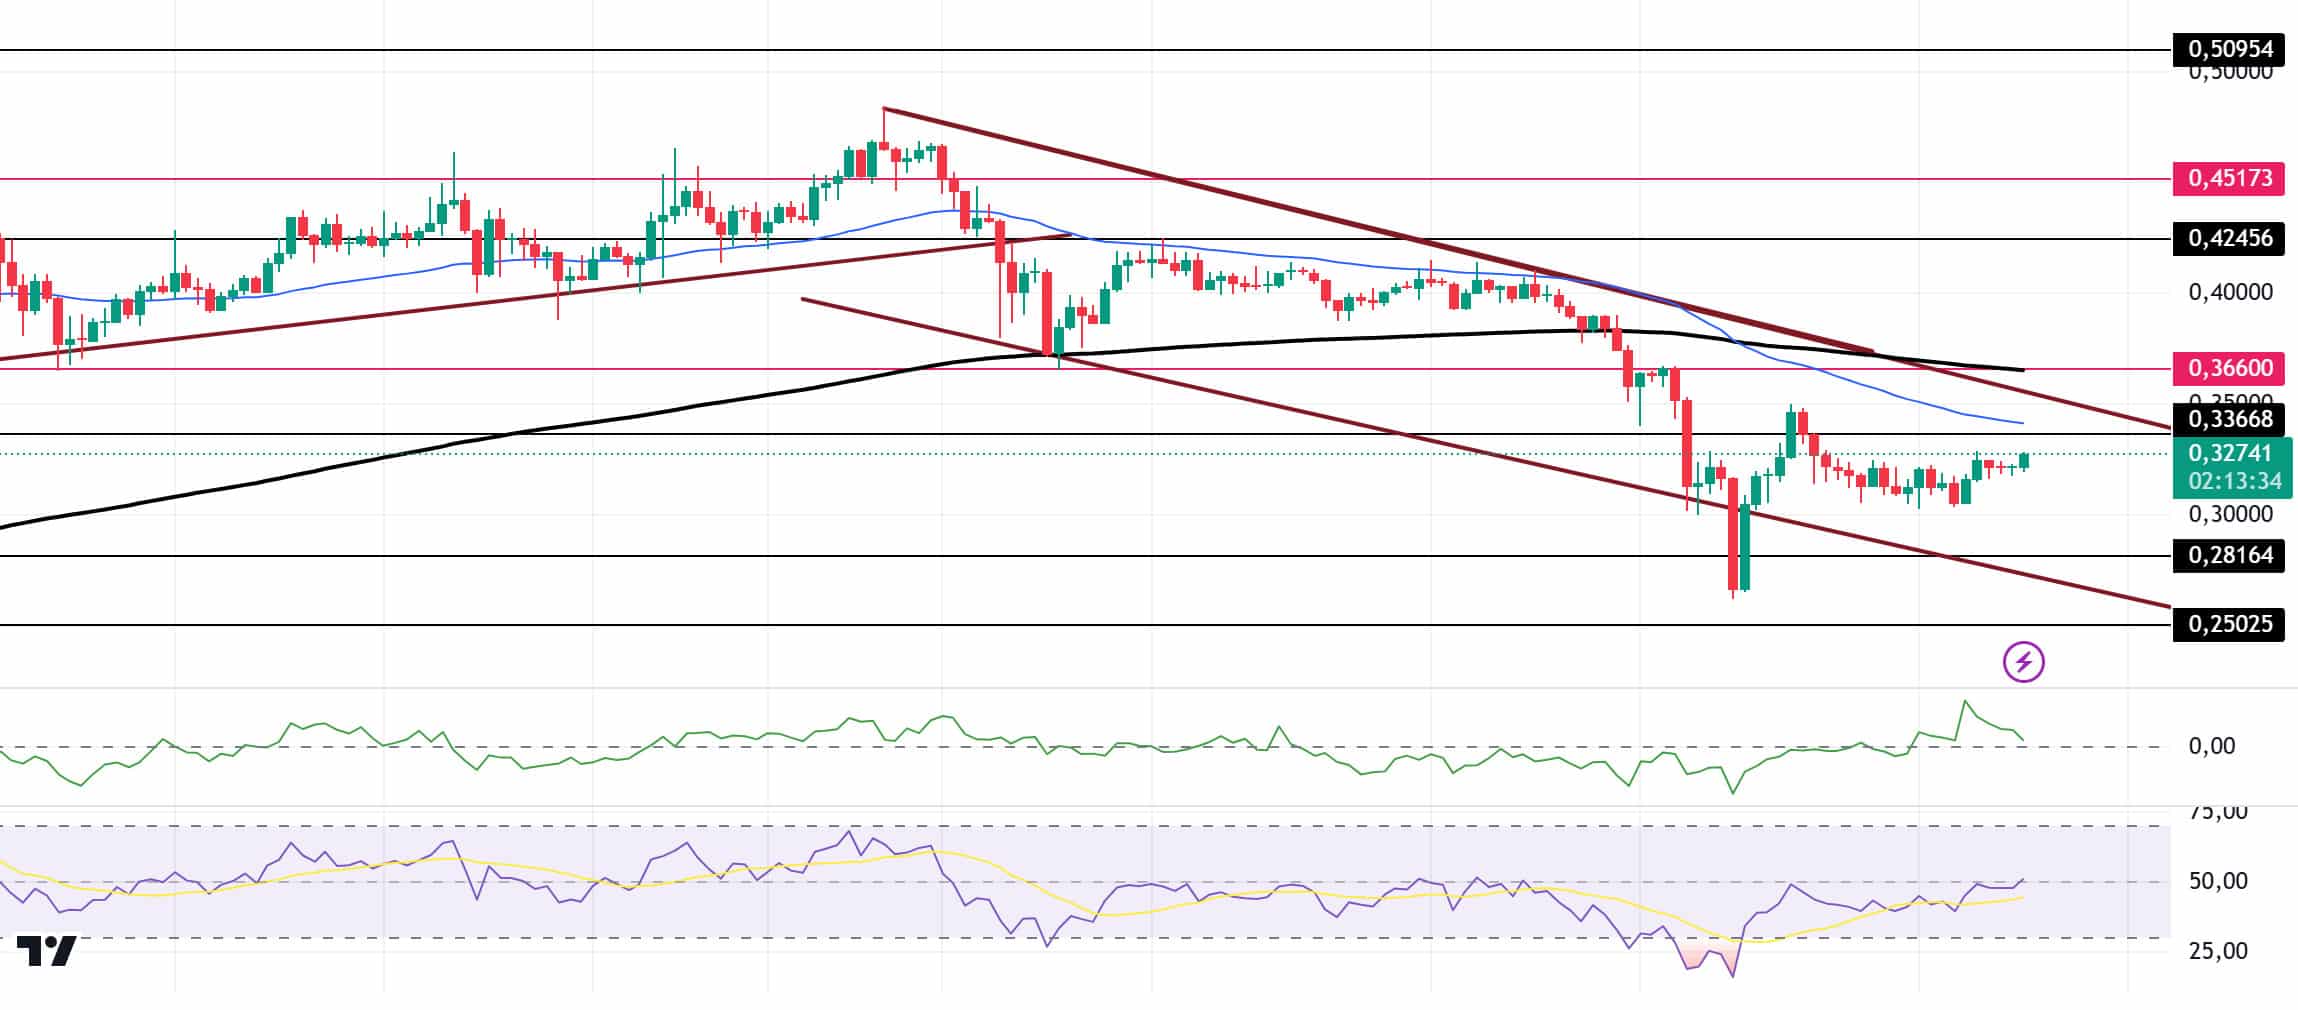
Doge continues its horizontal course in recent days. When we look at the chart, DOGE, which has been in a downtrend since December 8, broke the support of this trend and deepened the decline and found support from the 0.2800 and 0.2600 band and found itself in the middle of the trend again. In the 4-hour timeframe, the 50 EMA (Blue Line) started to hover below the 200 EMA (Black Line). When we examine the Chaikin Money Flow (CMF)20 indicator, although it was positive, money outflows started to increase. However, Relative Strength Index (RSI)14 continues to move around the neutral zone. The 0.36600 level stands out as a very strong resistance point in the rises driven by both the upcoming macroeconomic data and the innovations in the Doge coin. If DOGE catches a new momentum and rises above this level, the rise may continue strongly. In case of possible pullbacks due to macroeconomic reasons or negativity in the ecosystem, the 0.25025 level is an important support. If the price reaches these support levels, a potential bullish opportunity may arise if momentum increases.
Supports 0.28164 – 0.25025 – 0.21154
Resistances 0.33668 – 0.36600 – 0.42456
LEGAL NOTICE
The investment information, comments and recommendations contained herein do not constitute investment advice. Investment advisory services are provided individually by authorized institutions taking into account the risk and return preferences of individuals. The comments and recommendations contained herein are of a general nature. These recommendations may not be suitable for your financial situation and risk and return preferences. Therefore, making an investment decision based solely on the information contained herein may not produce results in line with your expectations.


