MARKET SUMMARY
Latest Situation in Crypto Assets
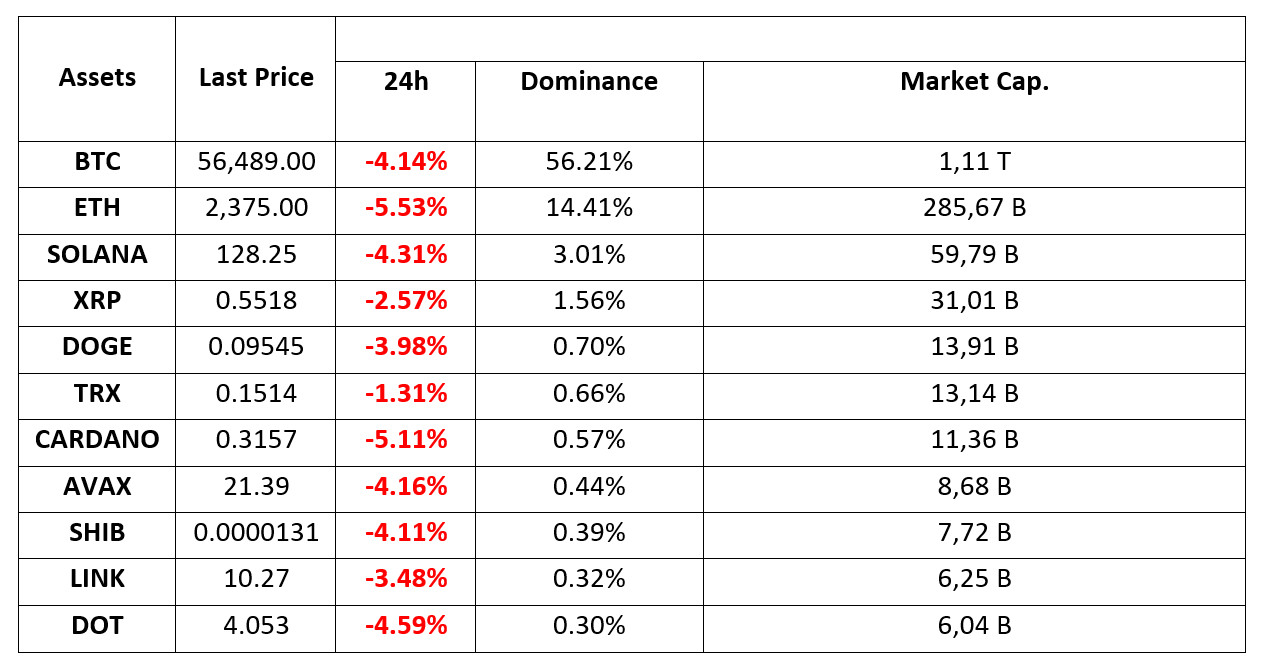
WHAT’S LEFT BEHIND
Nvidia’s Anti-Dumping Pressure
The cryptocurrency market is experiencing significant downward pressure due to external economic factors. The US Department of Justice’s recent regulatory actions against Nvidia have polarized investor sentiment, adding to market uncertainty. Bitcoin’s recent volatility has resulted in more than $200 million outflows from Bitcoin ETFs, creating significant selling pressure.
BoJ Interest Rate Increase Decision Negatively Affects Bitcoin
Bank of Japan Governor Kazuo Ueda stated that the central bank will raise interest rates further if the economy and inflation develop as expected. Ueda emphasized that the economic environment was favorable for the decision, with inflation-adjusted interest rates negative even after the late July increase in the benchmark borrowing cost.
Former Mt. Gox CEO’s new crypto exchange to launch this month with focus on ‘transparency’
Mark Karpeles, former CEO of the Mt. Gox crypto exchange, Mark Karpeles said that his new crypto exchange will launch in Europe this month with a focus on transparency and user-friendliness. Karpeles expressed hope that the level of transparency achieved from his new exchange could become the industry standard. The new platform, called EllipX, plans to launch in Europe later this month with its base in Poland.
HIGHLIGHTS OF THE DAY

INFORMATION
*The calendar is based on UTC (Coordinated Universal Time) time zone. The economic calendar content on the relevant page is obtained from reliable news and data providers. The news in the economic calendar content, the date and time of the announcement of the news, possible changes in the previous, expectations and announced figures are made by the data provider institutions. Darkex cannot be held responsible for possible changes that may arise from similar situations.
MARKET COMPASS
Markets are back in the red
Global markets are experiencing a wave of selling similar to the one in early August. After the sharp losses in the US stock markets yesterday, Asian indices are also down this morning. The Nasdaq fell 3.26% while the Japanese Nikkei closed 4.24% lower. European stock markets are also expected to be affected by this wave and start the new day 1% or more negative. Digital currencies were also hit hard by this perception.
Yesterday, ISM Manufacturing PMI, one of the macro indicators from the US, came in at 47.2, falling short of the forecasts of 47.5. After this data, which gave the markets an excuse to rekindle recession concerns, we saw a serious deterioration in risk sentiment. This situation actually supported the warning that risk sentiment remains fragile, which we have been talking about in our analysis for some time. In addition, the news that Nvidia has received a subpoena from the US Department of Justice (DoJ) for an antitrust lawsuit sent the company’s stock prices down by 9.5% and brought sales to technology stocks globally. On the digital assets front, we also saw this being felt in AI tokens.
Ahead of the critical US employment data on Friday, macro data and expectations regarding the FED’s rate cut path, which are currently evolving very sharply, are likely to continue to concern all markets. According to CME FedWatch, the probability of the Fed raising interest rates by 50 basis points instead of 25 on September 18 has risen from around 30% to 41%. However, while this does not reflect positively on the markets in the current equation, it indicates that investors are pricing more according to the state of the economy.
The JOLTS and Beige Book to be published today may continue to shape market perception. In this special period we are in, we can interpret a higher-than-expected JOLT figure as “may have a positive impact” for crypto assets, as it may reduce recession concerns to some extent. Under normal conditions, we could have evaluated such a figure, which would exceed the forecasts, negatively for crypto assets with the idea that it could keep the FED away from interest rate cuts. However, we can see that the way the equation works has changed.
US data and news flows will continue to be important later in the day and week. We can say that digital assets may look for an excuse to recover after their recent losses. In this parallel, just as we warned about the fragility in risk appetite when prices were rising, we do not hesitate to point out that falling prices may be an opportunity.
TECHNICAL ANALYSIS
BTC/USDT
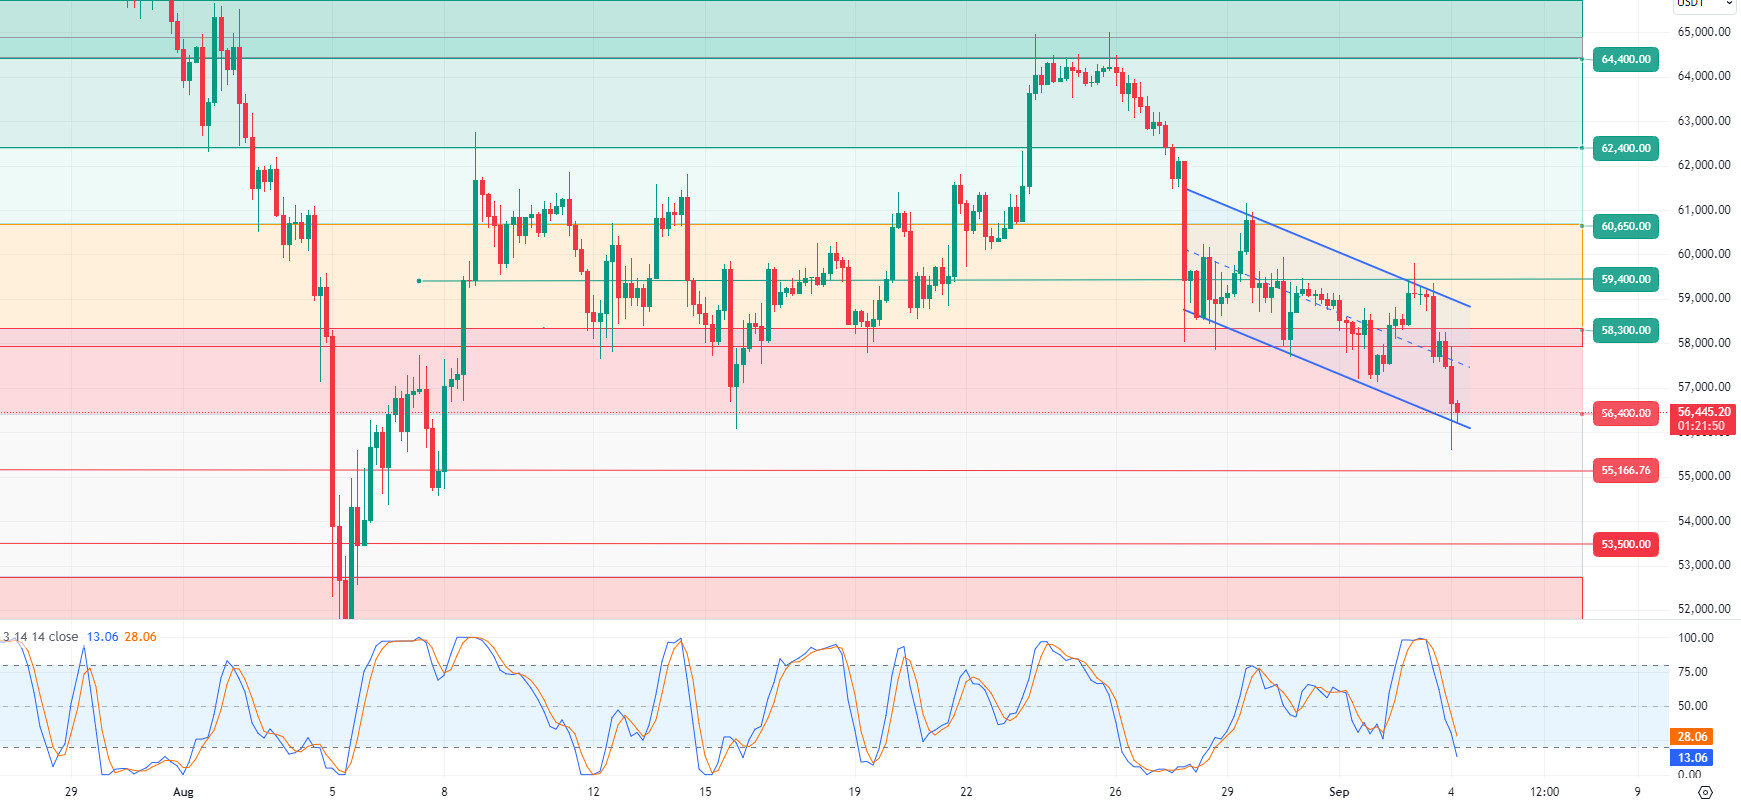
Selling Pressure on Bitcoin: Over the past day, recent US regulatory actions against Nvidia have had a significant impact on investor sentiment. This, combined with a $200 million outflow from Bitcoin ETFs, created significant selling pressure in the market. In addition, Bank of Japan Governor Kauzo Ueda’s statements that interest rate hikes will continue continue to create a negative atmosphere on the market. In the short term, Bitcoin 4-hour technical analysis showed that the price could not hold above the $ 59,000 level due to these developments. With the break of the support point of 58,300, the price fell as low as 55,600. This pullback led to the formation of a falling trend structure in Bitcoin. In particular, closures below the support point at 56,400 may increase selling pressure and pullbacks may occur towards the region previously defined as the ‘gap’ zone. The lack of strong support points in the ‘gap’ zone may cause us to see more drastic movements in the market. With the RSI, one of the technical indicators, falling into the oversold zone, the price may be likely to recover from these levels and make a move towards the 58.300 resistance level.
Supports 56,400 – 55,166 – 53,500
Resistances 57,200 – 58,300 – 59,400
ETH/USDT
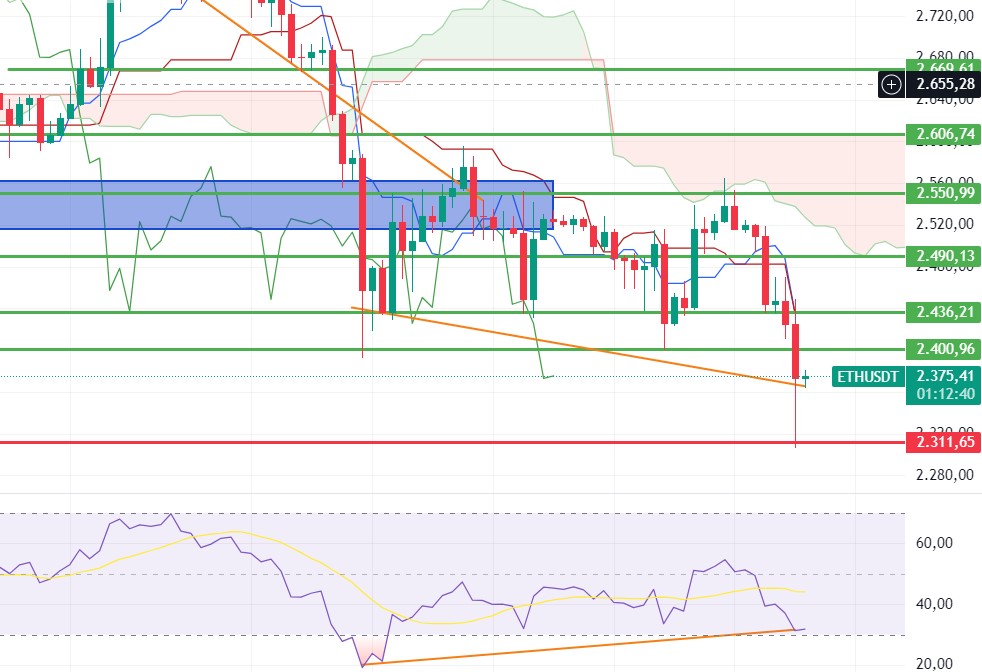
Ethereum, which fell to 2,300 levels with the break of the 2,450 level and the bad opening of Asian markets, has received a reaction up to 2,375 levels. With the positive mismatch in Rsi, it may be priced a little higher. With the regain of 2,400, we can see 2,450 levels during the day. However, the loss of 2,311 may cause the decline to deepen and pullbacks to 2,194 levels.
Supports 2,311 – 2,194 – 2,112
Resistances 2,450 – 2,490 – 2,550
LINK/USDT
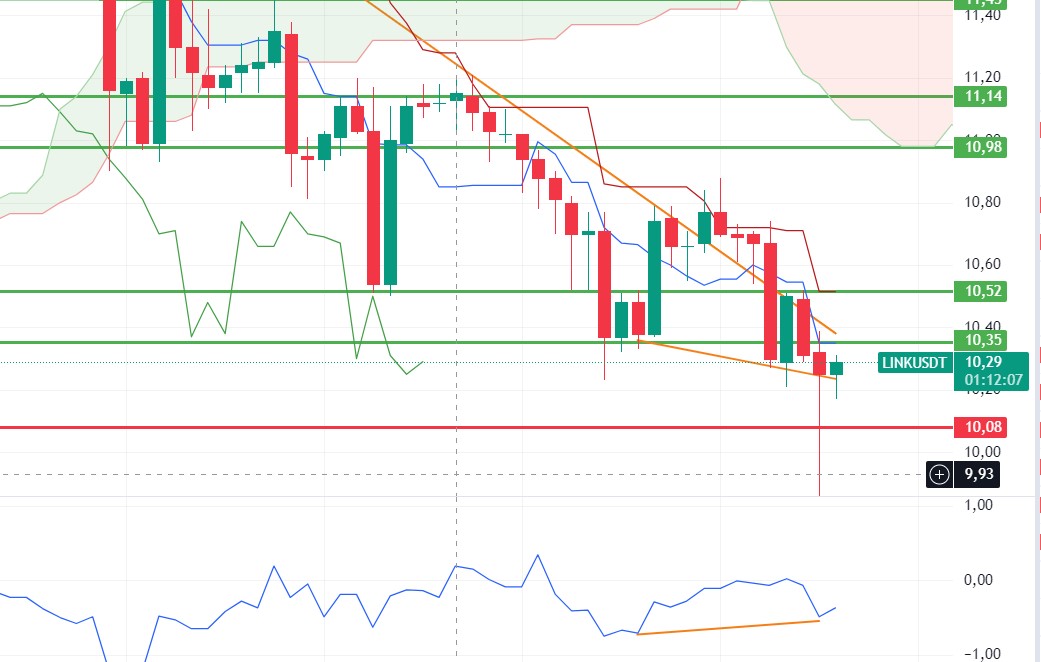
LINK, which took its share from the decline in the market, took a reaction up to 10.26 by throwing a needle to the level of 9.82. With the clear buy signal in momentum, we can see rises up to 10.52 if the market allows. The loss of 10.08 may bring a decline to 9.47 levels.
Supports 10.08- 9.47 – 8.12
Resistances 10.35 – 10.52 – 10.98
SOL/USDT
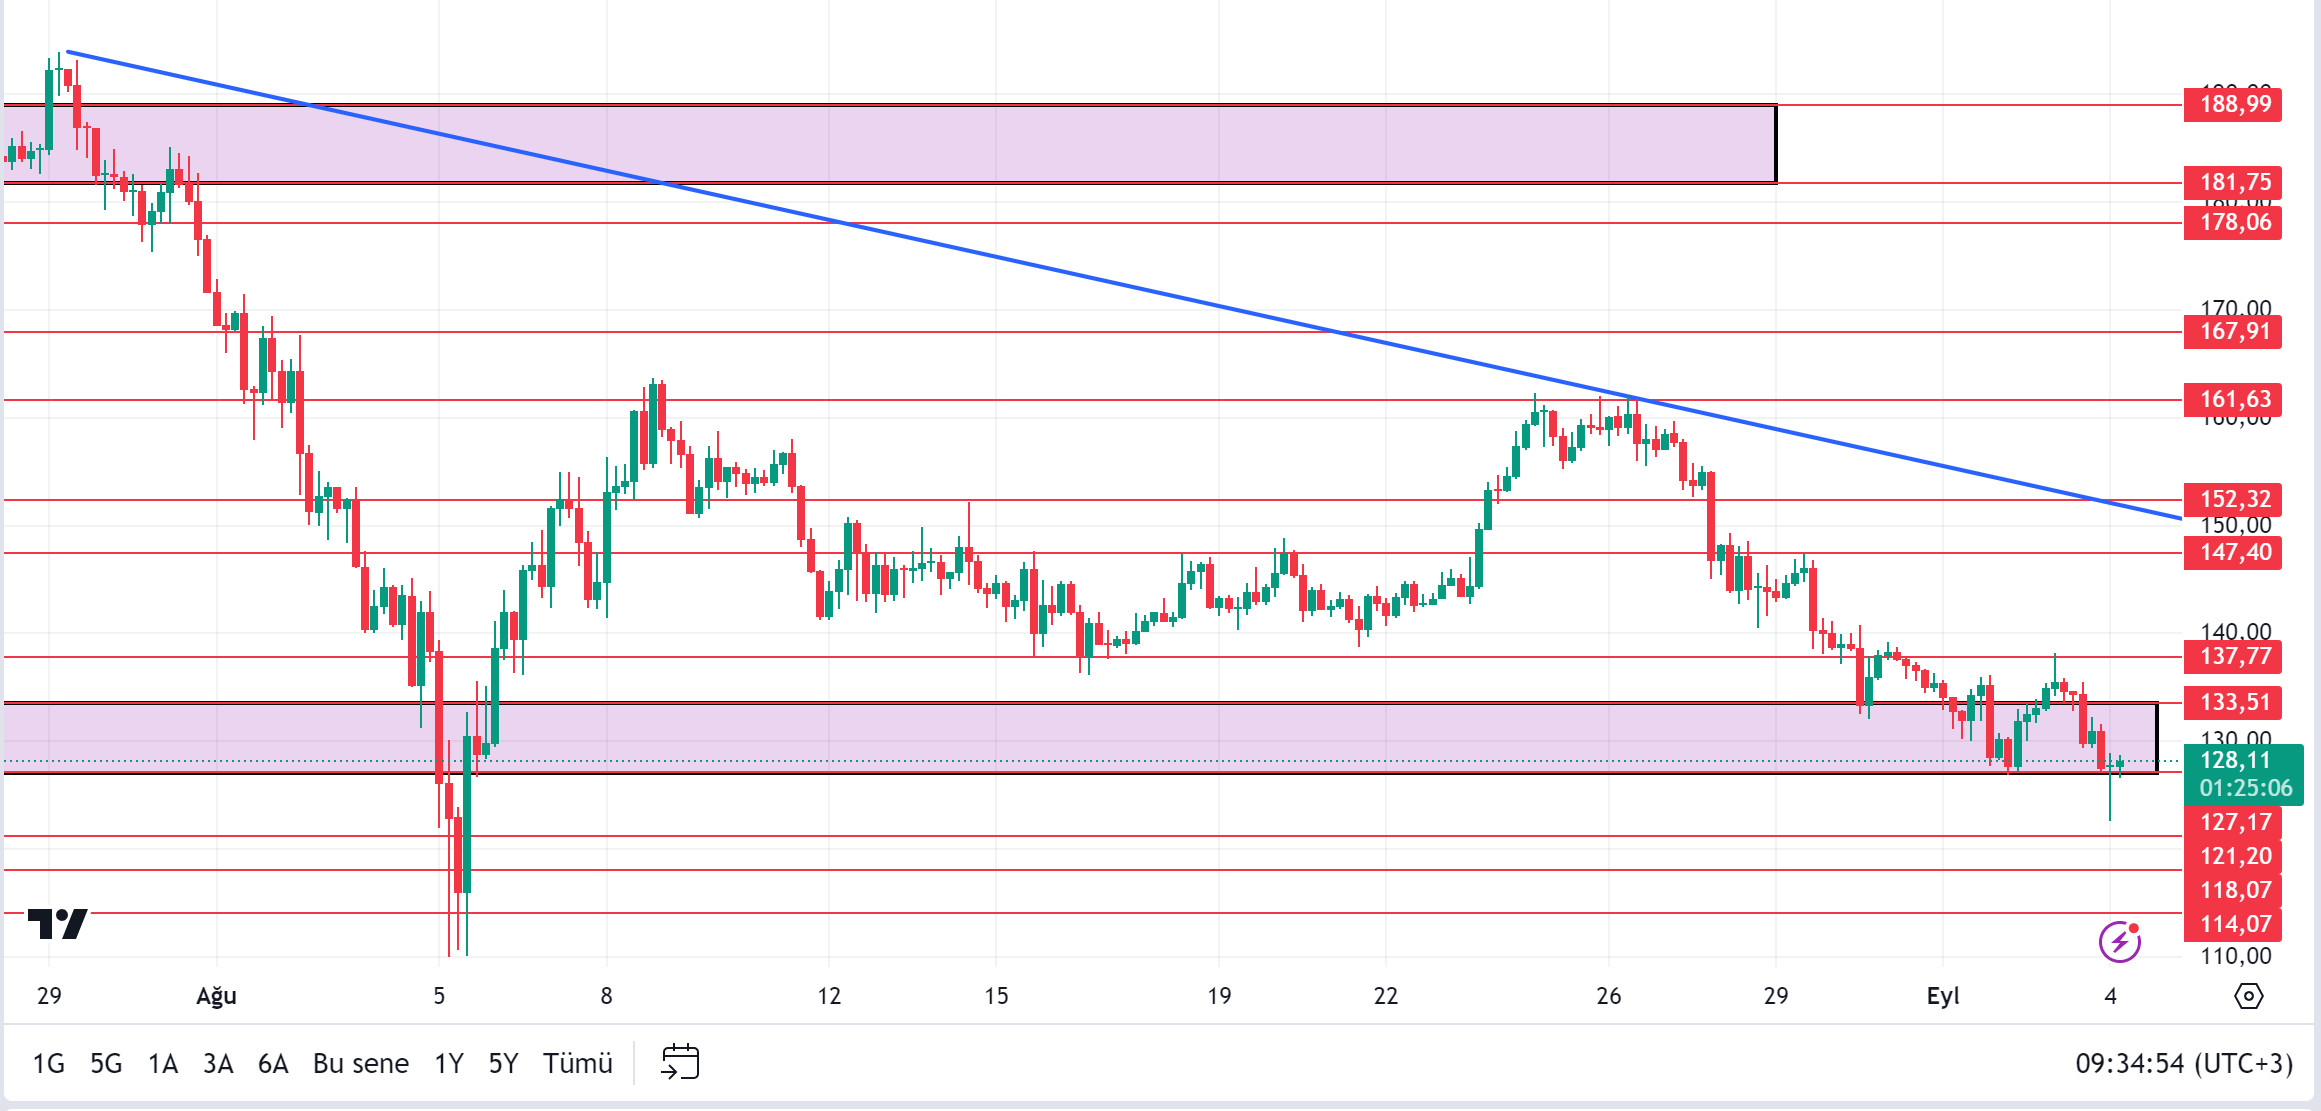
While the Japanese stock market started the day with a very serious decline, this was also reflected in the cryptocurrency market. On the other hand, Citi stated that it expects 125,000 new jobs to be created in the upcoming Non-Farm Payrolls (NFP) data and the unemployment rate to be realized at 4.3 percent. Citi noted that the US non-farm payrolls and unemployment data to be released on Friday will increase the likelihood of a 50 basis point rate cut by the Fed in September. However, they also stated that they expect the Fed to cut interest rates by another 50 basis points in November. In the Solana ecosystem, a global centralized exchange announced that it will launch SOL Staking in September. However, fraudsters have found a way to burn tokens from inside Solana wallets. Fraudsters have reportedly found a new way to steal the cryptocurrencies of Solana users. This time, it was found that users’ tokens were burned a few seconds after purchase. According to Slorg, a member of Solana-based Jupiter in the kitchen, the scammers started using an internal Solana token extension to secretly delete their targets’ crypto assets. Reports emerged of users buying tokens and not showing up in their wallet balances. Looking at the chart, SOL seems to have received support from the base level of the 133.51 – 127.17 band. If it breaks this band, the declines may deepen. SOL, which has been accumulating in a certain band since April, may test the support levels of 121.20 – 118.07 if the declines continue. If the pessimism in the market decreases, 133.51 – 137.77 resistances should be followed.
Supports 121.20 – 118.07 – 114.07
Resistances 133.51 – 137.77 – 147.40
ADA/USDT
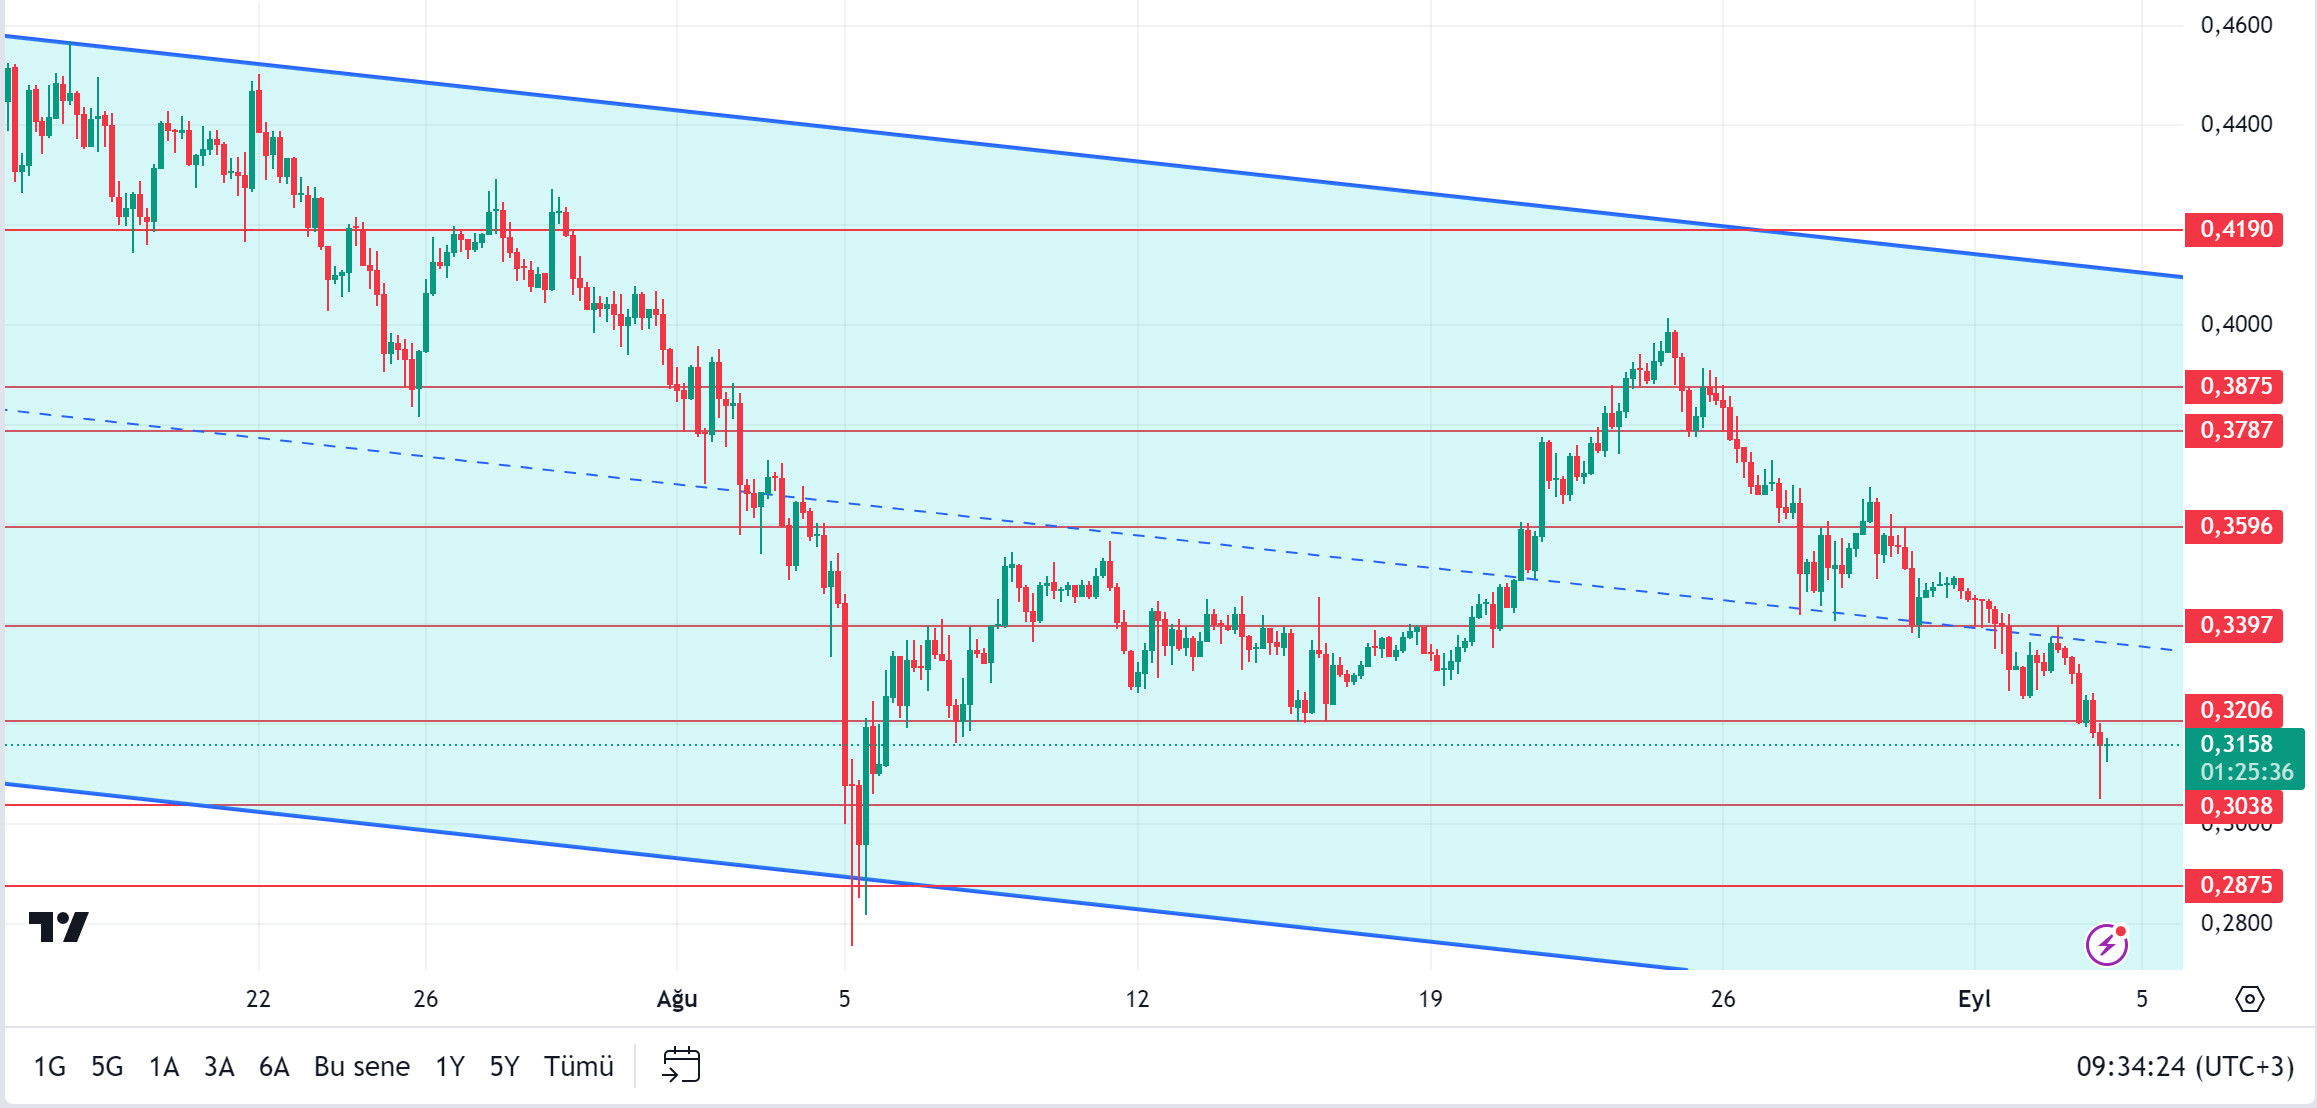
While the Japanese stock market started the day with a very serious decline, this was also reflected in the cryptocurrency market. ADA lost about 4% in value. On the other hand, Cardano officially launched the Chang Hard Fork, unlocking approximately $500 million worth of Sovereign Wealth Funds in ADA. This is equivalent to about 1.5 billion ADA tokens. The first phase of the upgrade is complete. This upgrade marks an important milestone for the blockchain’s infrastructure, bringing changes to the network’s setup. However, despite these developments, more crypto whales are selling their holdings. For this reason, ADA is struggling to rise. When we look at the chart of ADA, it is priced at 0.3158 in the descending channel. Despite the expectation of the incoming update, the news from Japan has made it difficult for ADA’s rise to continue. In case of deepening, 0.3038 – 0.2875 levels can be followed as support levels. If investors assume that investors are testing the bottom levels by relying on the innovations brought by the update and start buying, 0.3206 – 0.3038 levels can be followed as support if it continues to be priced by rising in the descending channel.
Supports 0.3038 – 0.2875 – 0.2611
Resistances 0.3206 – 0.3397 – 0.3596
AVAX/USDT
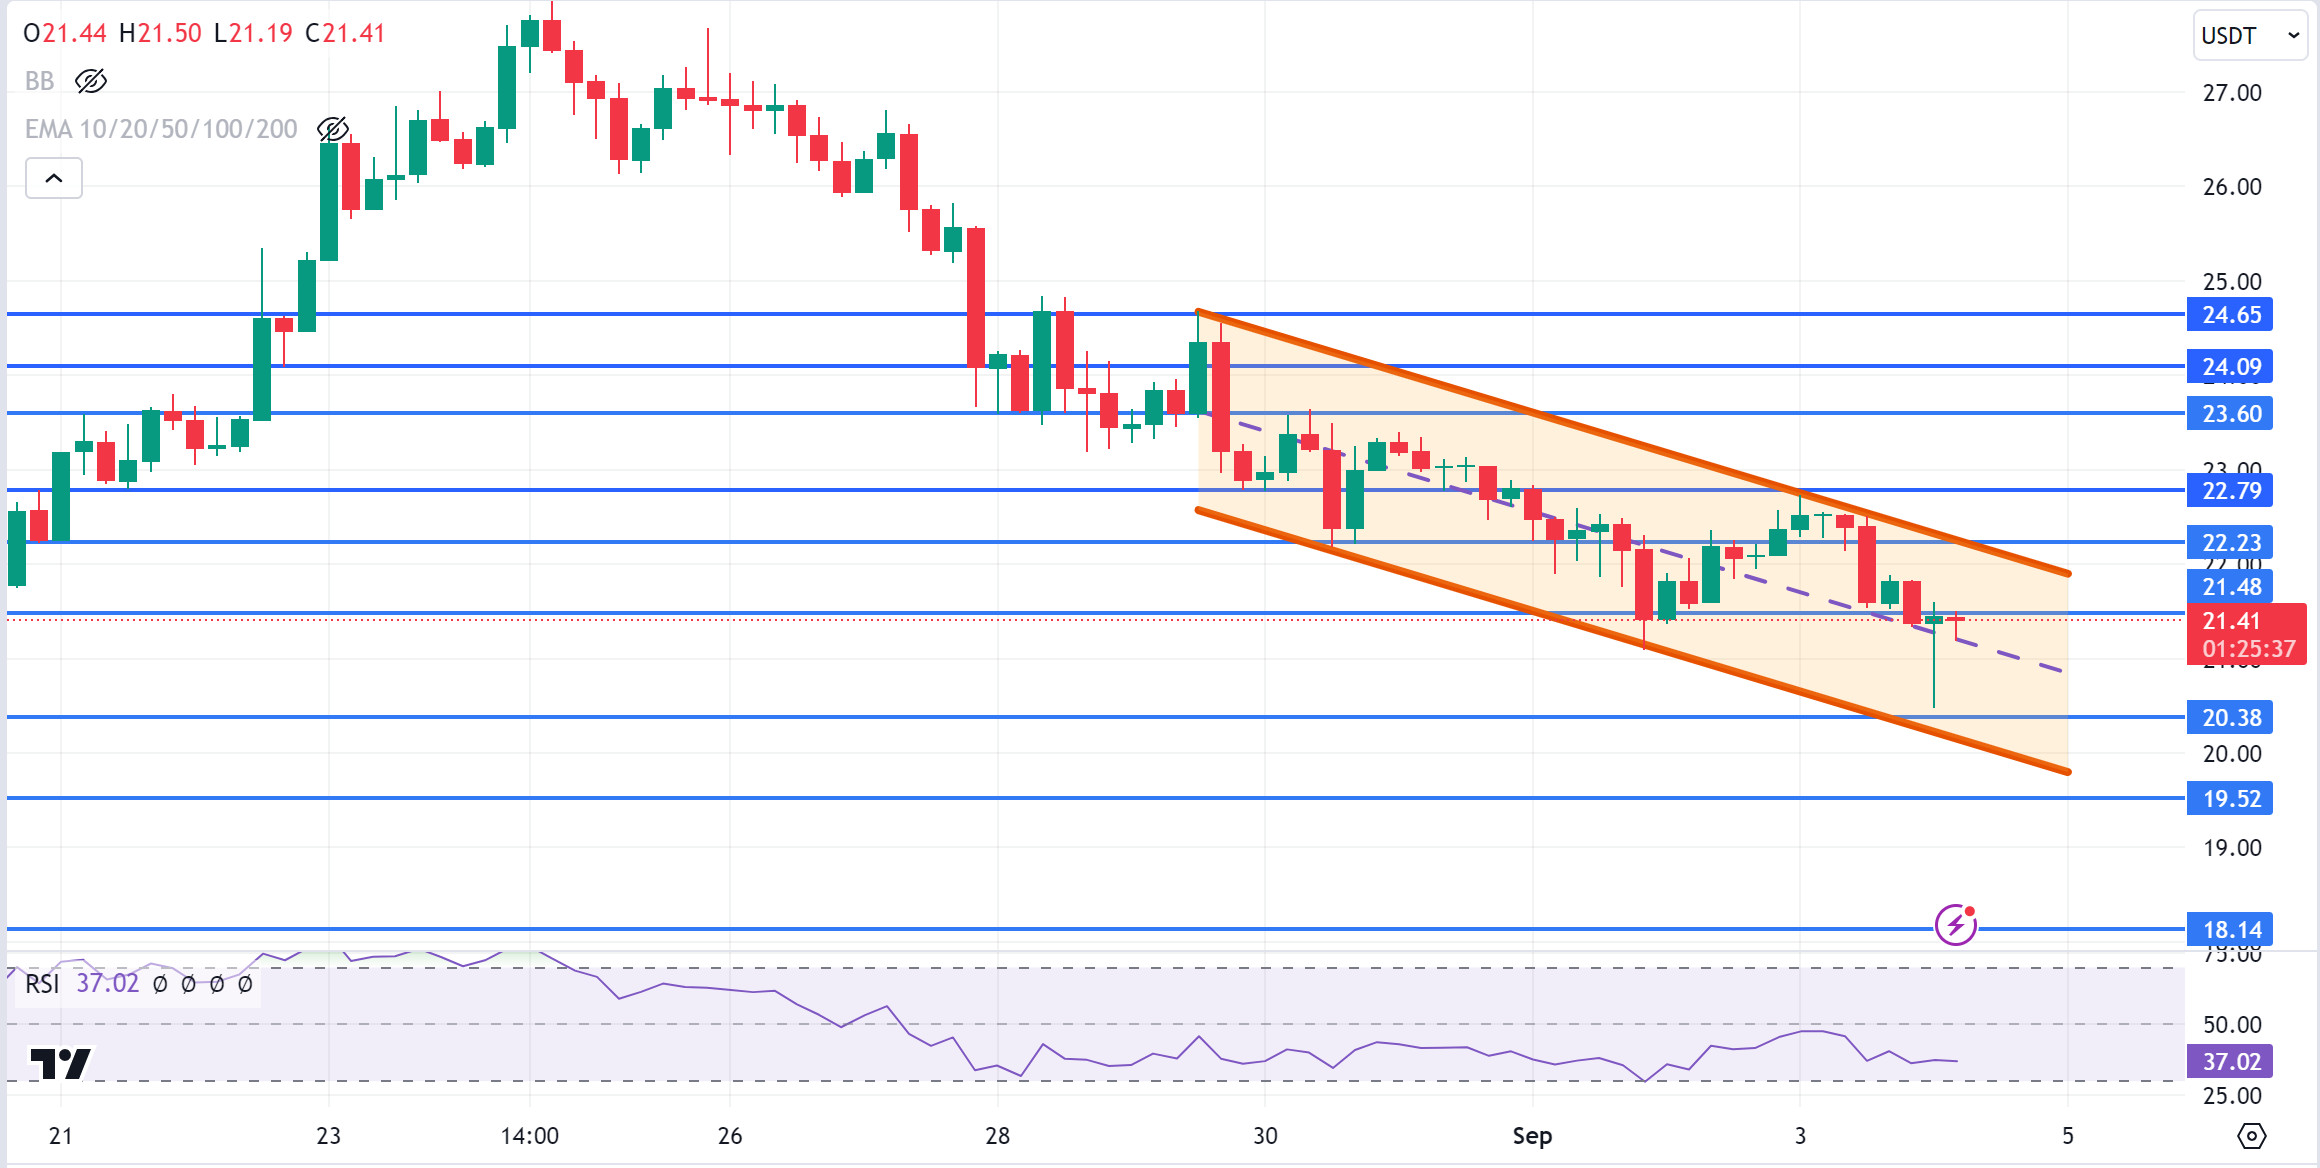
AVAX, which opened yesterday at 22.37, closed the day at 21.38, down about 4.5% during the day.
AVAX, currently trading at 21.41, continues to move in a falling channel. On the 4-hour chart, it is trying to climb to the upper band of the channel and is close to the oversold zone with an RSI value of 37. With the RSI value falling below 30, it may start a bullish movement and may continue to rise if it closes the candle above the 21.48 resistance. In such a case, it may test the 22.23 and 22.79 resistances. If it fails to break 21.48 resistance and sales pressure comes, it may test 20.38 support. As long as it stays above 20.38 support during the day, we can expect it to maintain its desire to rise. With the break of 20.38 support, sales may deepen.
Supports 20.38 – 19.52 – 18.14
Resistances 21.48 – 22.23 – 22.79
TRX/USDT
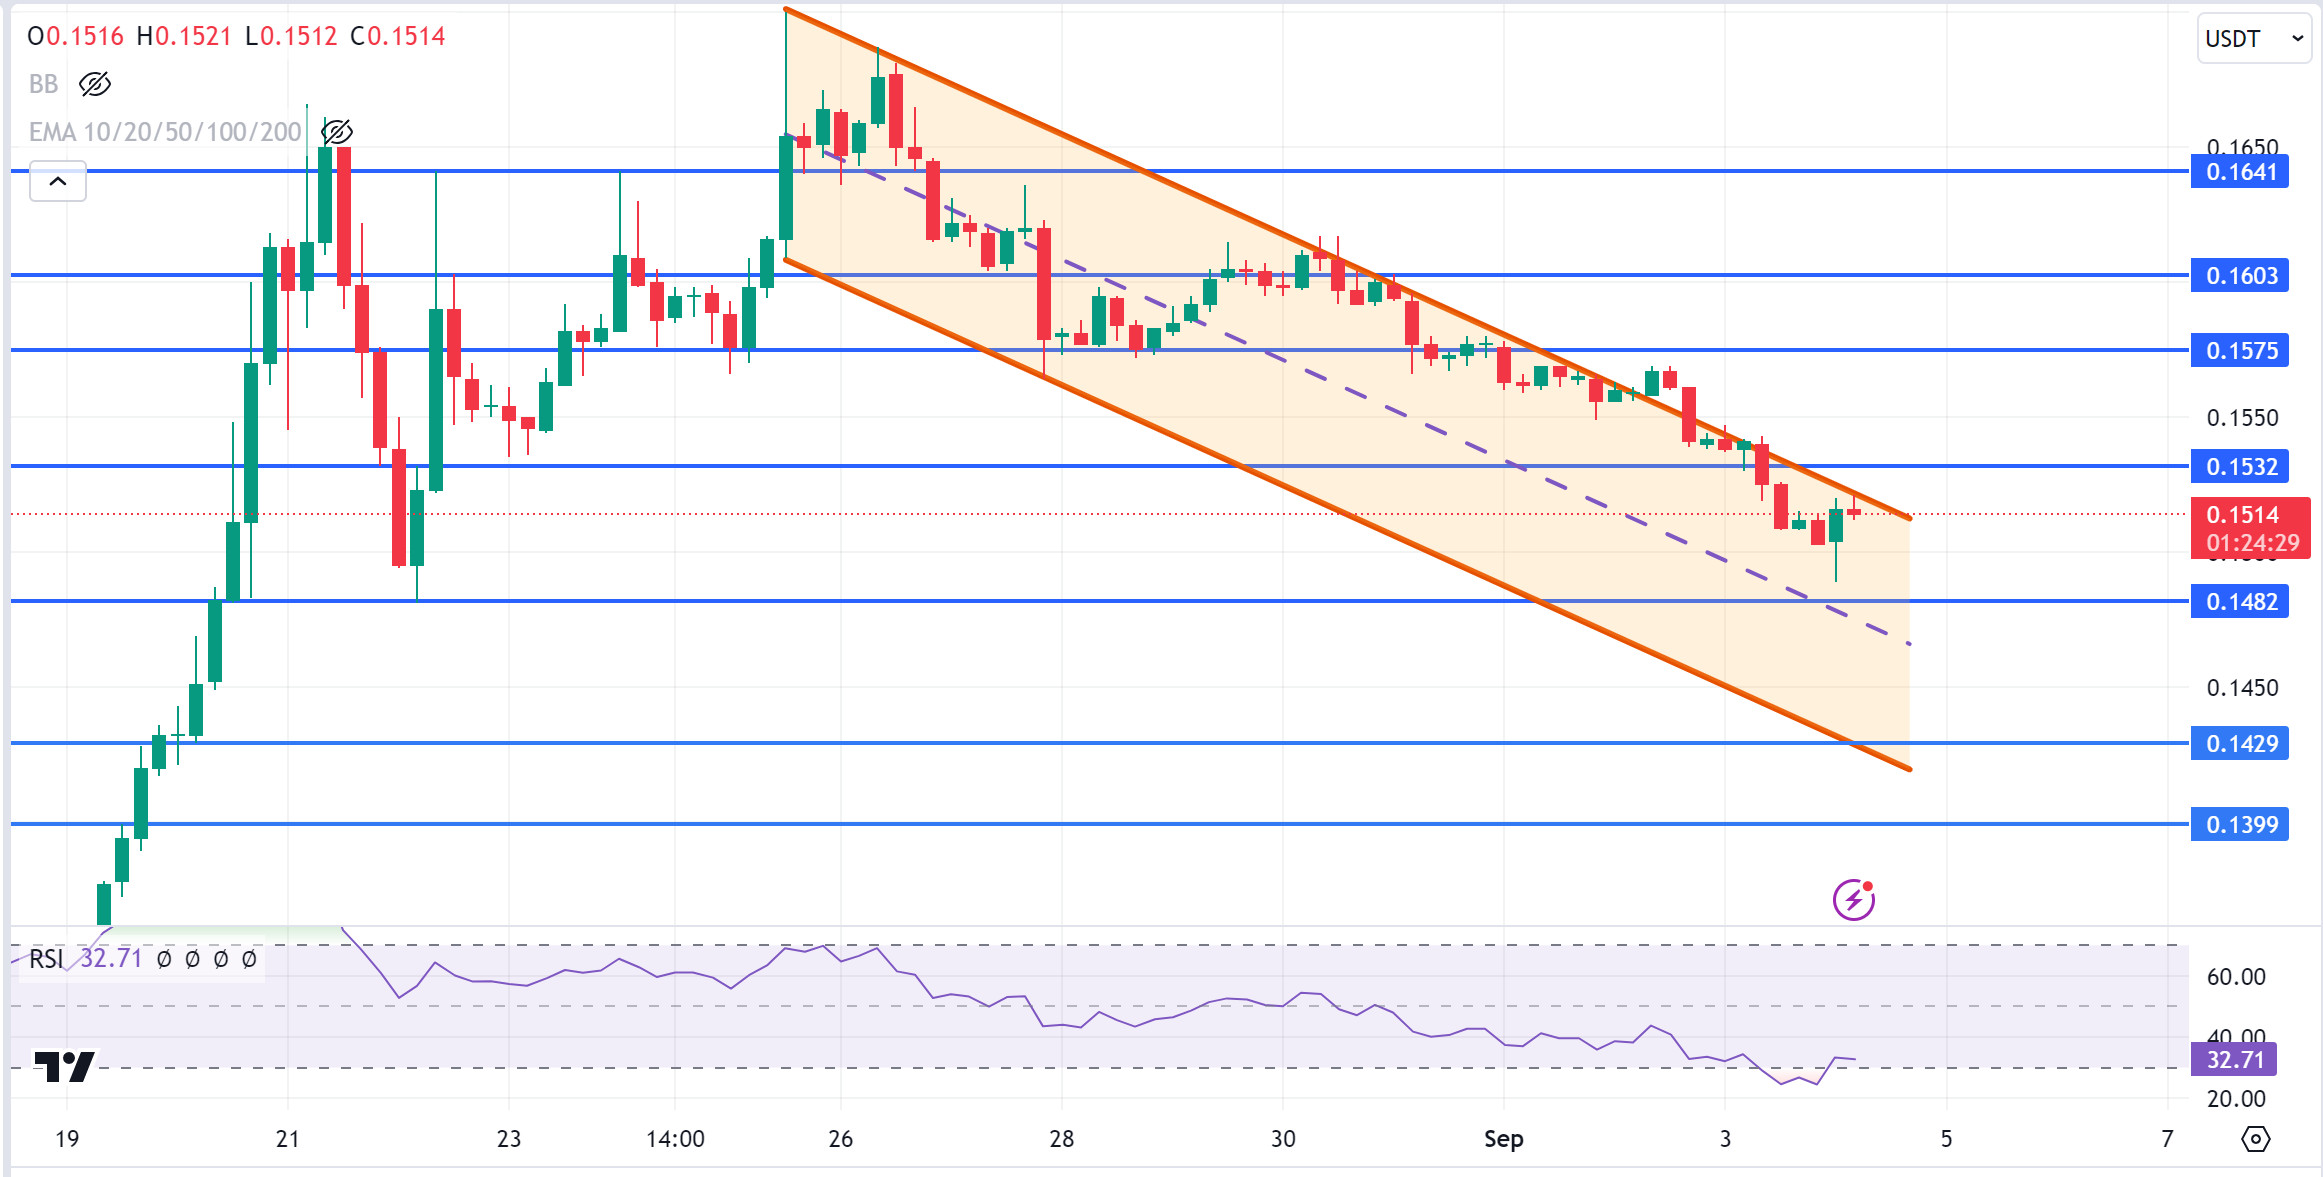
TRX, which started yesterday at 0.1542, lost 2.5% and closed the day at 0.1503. TRX, currently at 0.1514, is moving towards the upper band of the falling channel on the 4-hour chart. Breaking the 0.1532 resistance, it may want to continue its rise. In this case, it may test the 0.1575 resistance. If there is no candle closure above the 0.1532 resistance, it may move to the middle and lower band of the channel with the selling pressure. In this case, it may test 0.1482 and 0.1429 supports. As long as TRX stays above 0.1482 support, it can be expected to continue its upward trend. If it breaks this support downwards, sales may deepen.
Supports 0.1482 – 0.1429 – 0.1399
Resistances 0.1532 – 0.1575 – 0.1603
XRP/USDT
XRP started today at 0.5677, down 1.85% after yesterday’s rally. The crypto market in general started today with a sharp decline after the Japanese stock market opened negative. After the head of the Bank of Japan warned of further increases in interest rates as part of the fight against inflation, the stock markets’ reaction to this situation was not delayed and caused money outflows in the crypto market.
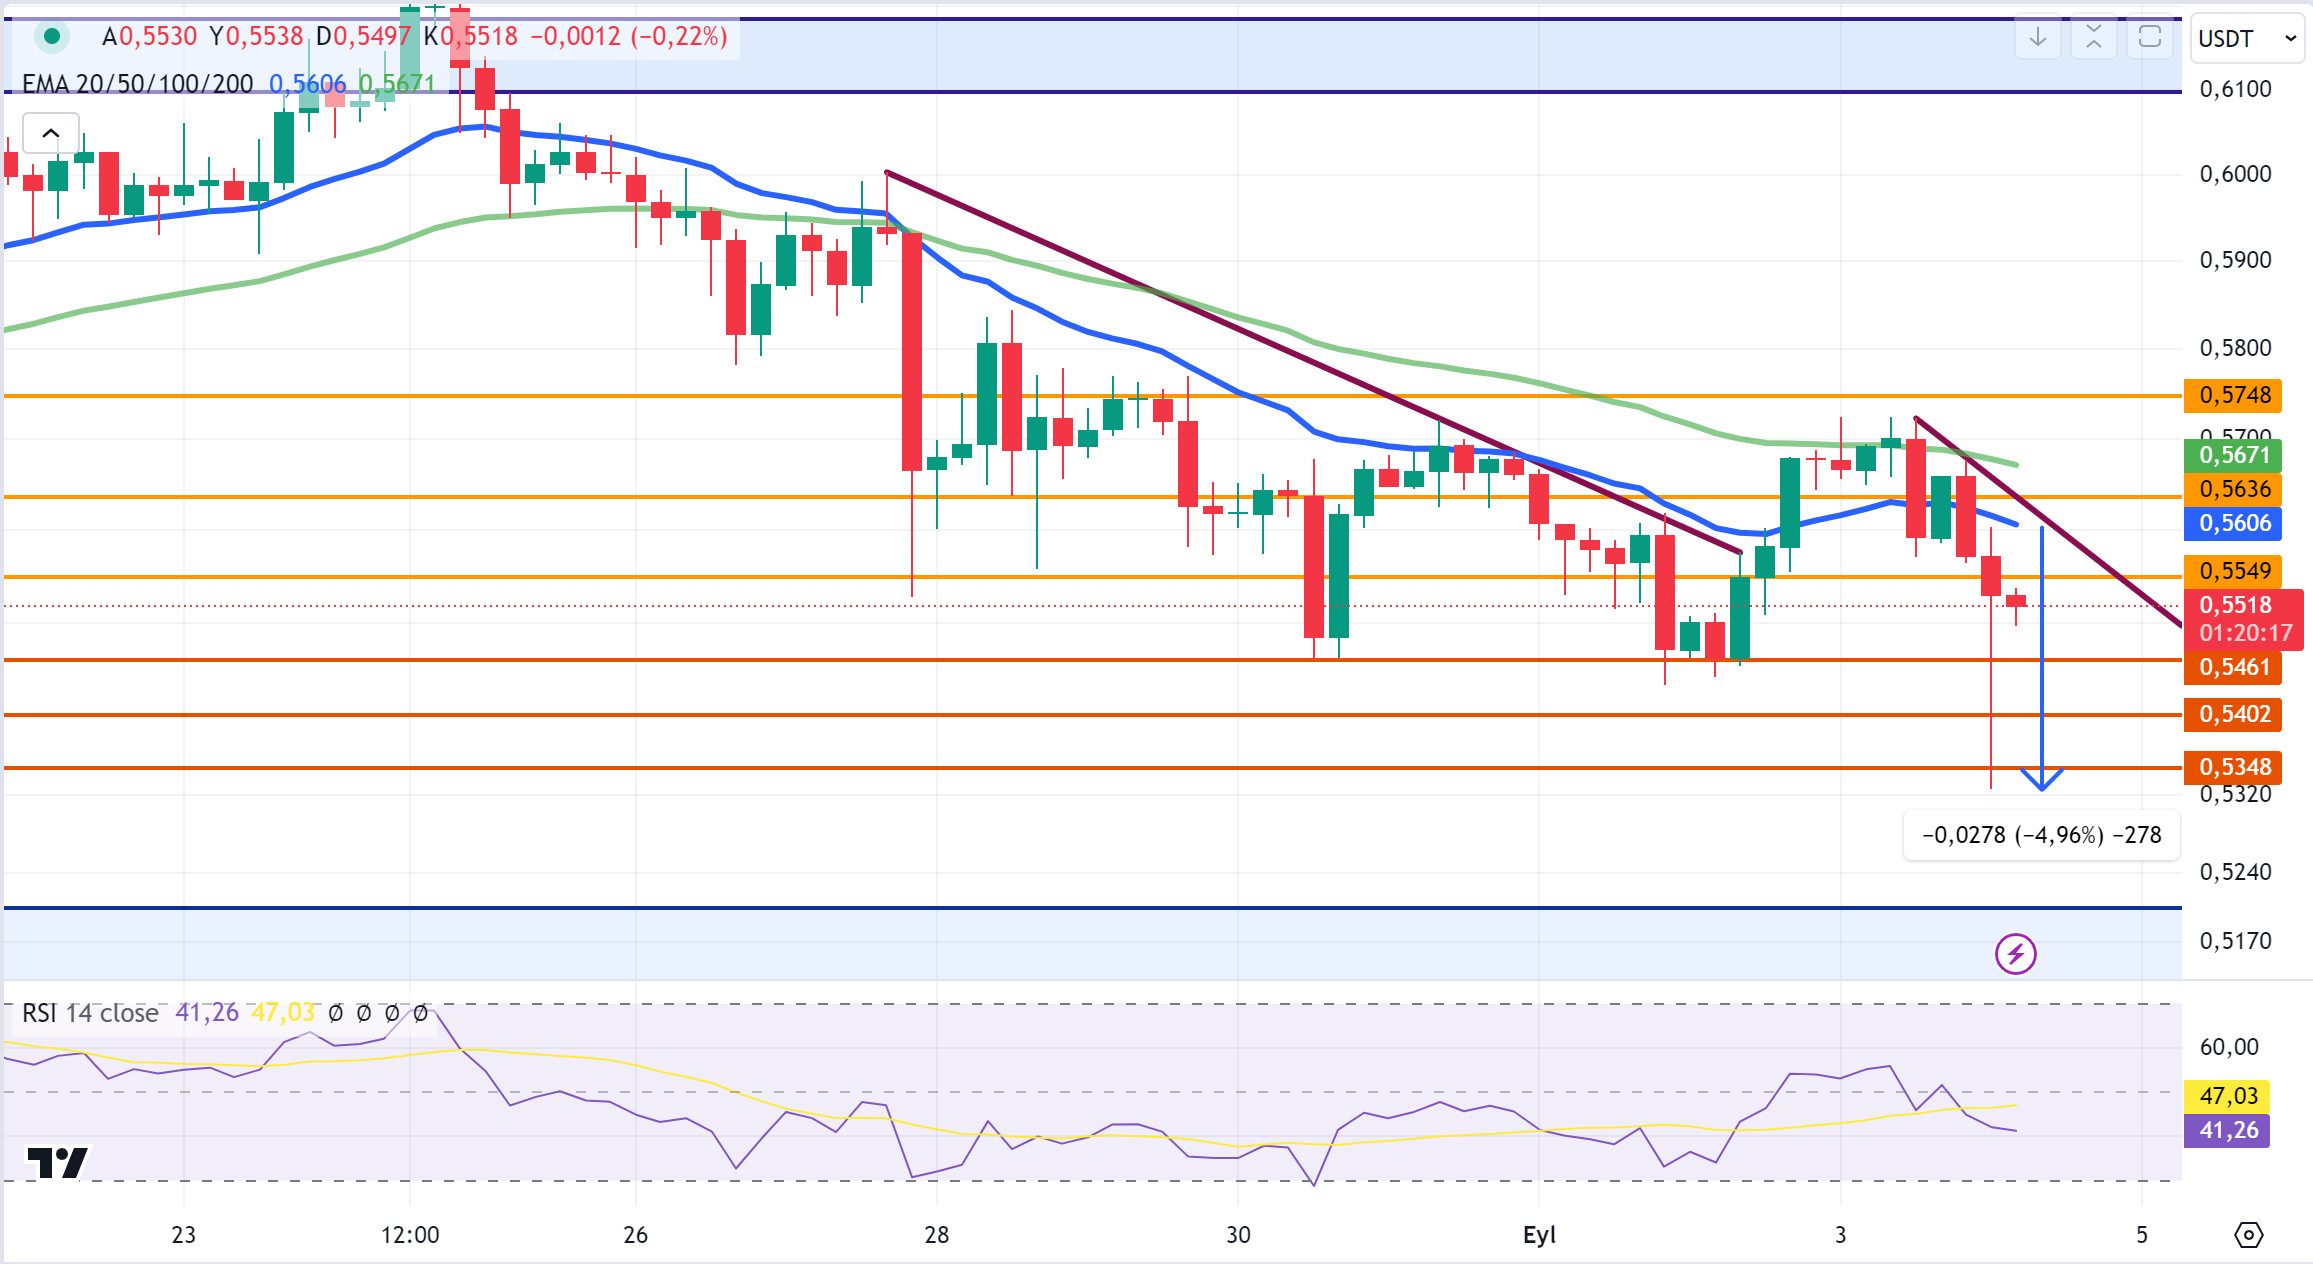
In the 4-hour analysis, XRP fell by about 5% to 0.5326 on the opening candle to start the day, before recovering to rise above 0.55. It is currently trading at 0.5518. XRP, which is in a downtrend, may test the support levels of 0.5461-0.5402-0.5348 if the decline continues. If it recovers and rises after a sharp decline, it may test the resistance levels of 0.5549-0.5636-0.5748.
Supports 0.5461 – 0.5402 – 0.5348
Resistances 0.5549 – 0.5636 – 0.5748
DOGE/USDT
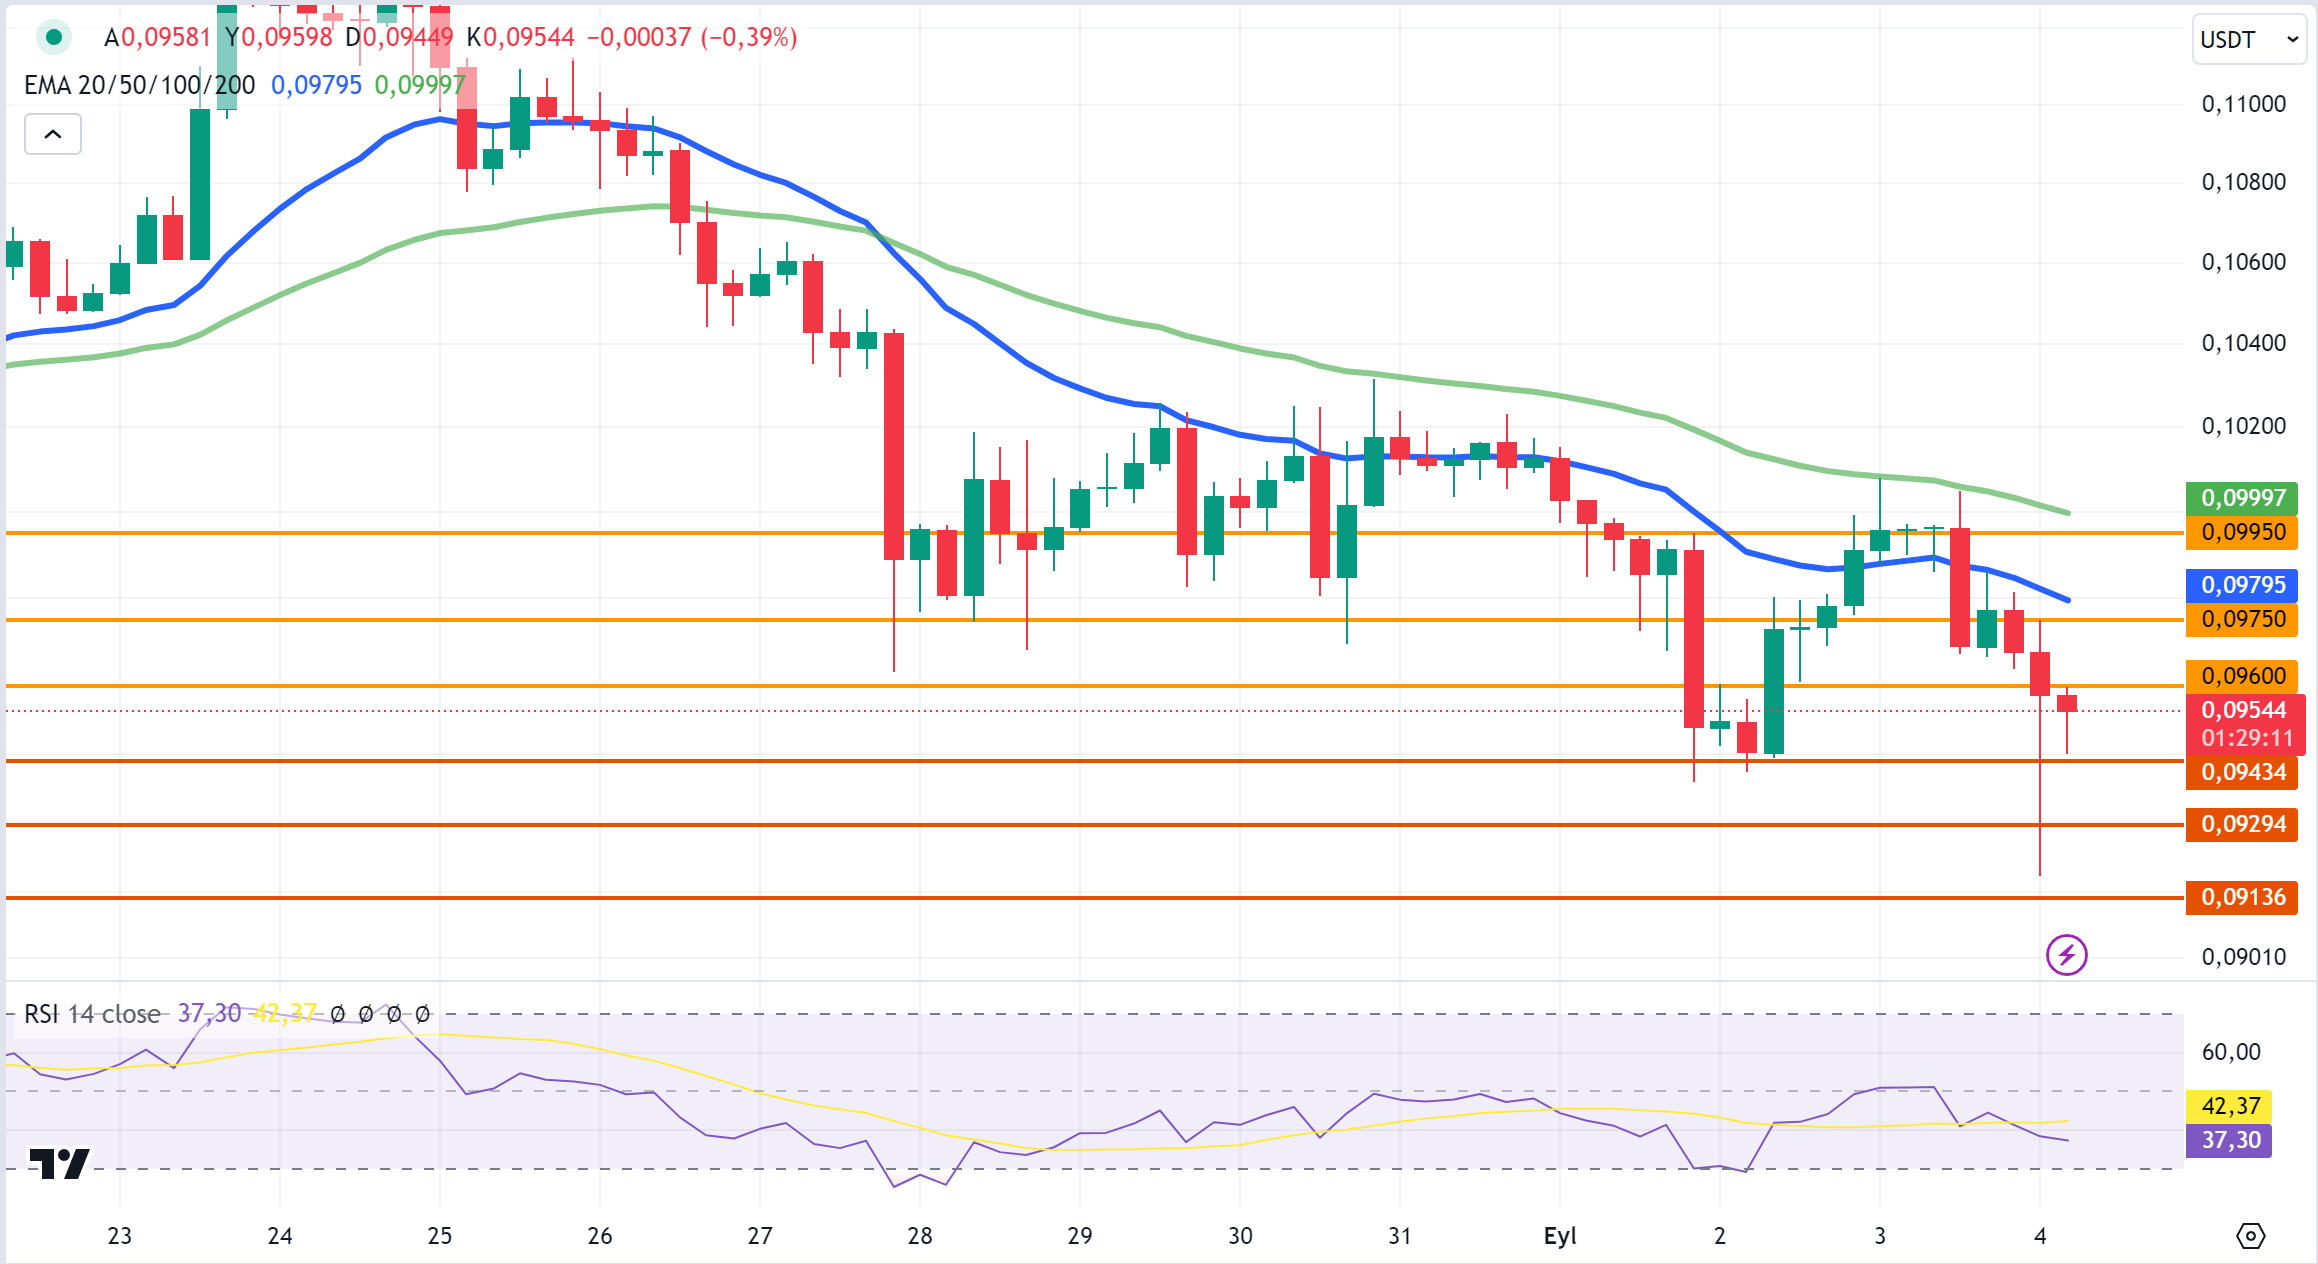
DOGE fell sharply and fell as low as 0.0918 after Japan’s stock markets opened -4% on the opening candle in the 4-hour analysis today. While the sharp decline was observed across the crypto market, this was caused by the negative opening of the stock markets after the Bank of Japan governor’s statement on interest rate hikes.
In the 4-hour analysis, DOGE, which rose to 0.0958 with a recovery after falling to 0.0918 today, is currently trading at 0.0954. DOGE, which is in a downtrend, may test support levels of 0.0943-0.0929-0.0913 if it continues to decline. Otherwise, with the markets recovering and rising, DOGE may test the resistance levels of 0.0960-0.0975-0.0995 in the scenario where it is on the rise.
Supports 0.0943 – 0.0929 – 0.0913
Resistances 0.0960 – 0.0975 – 0.0995
DOT/USDT
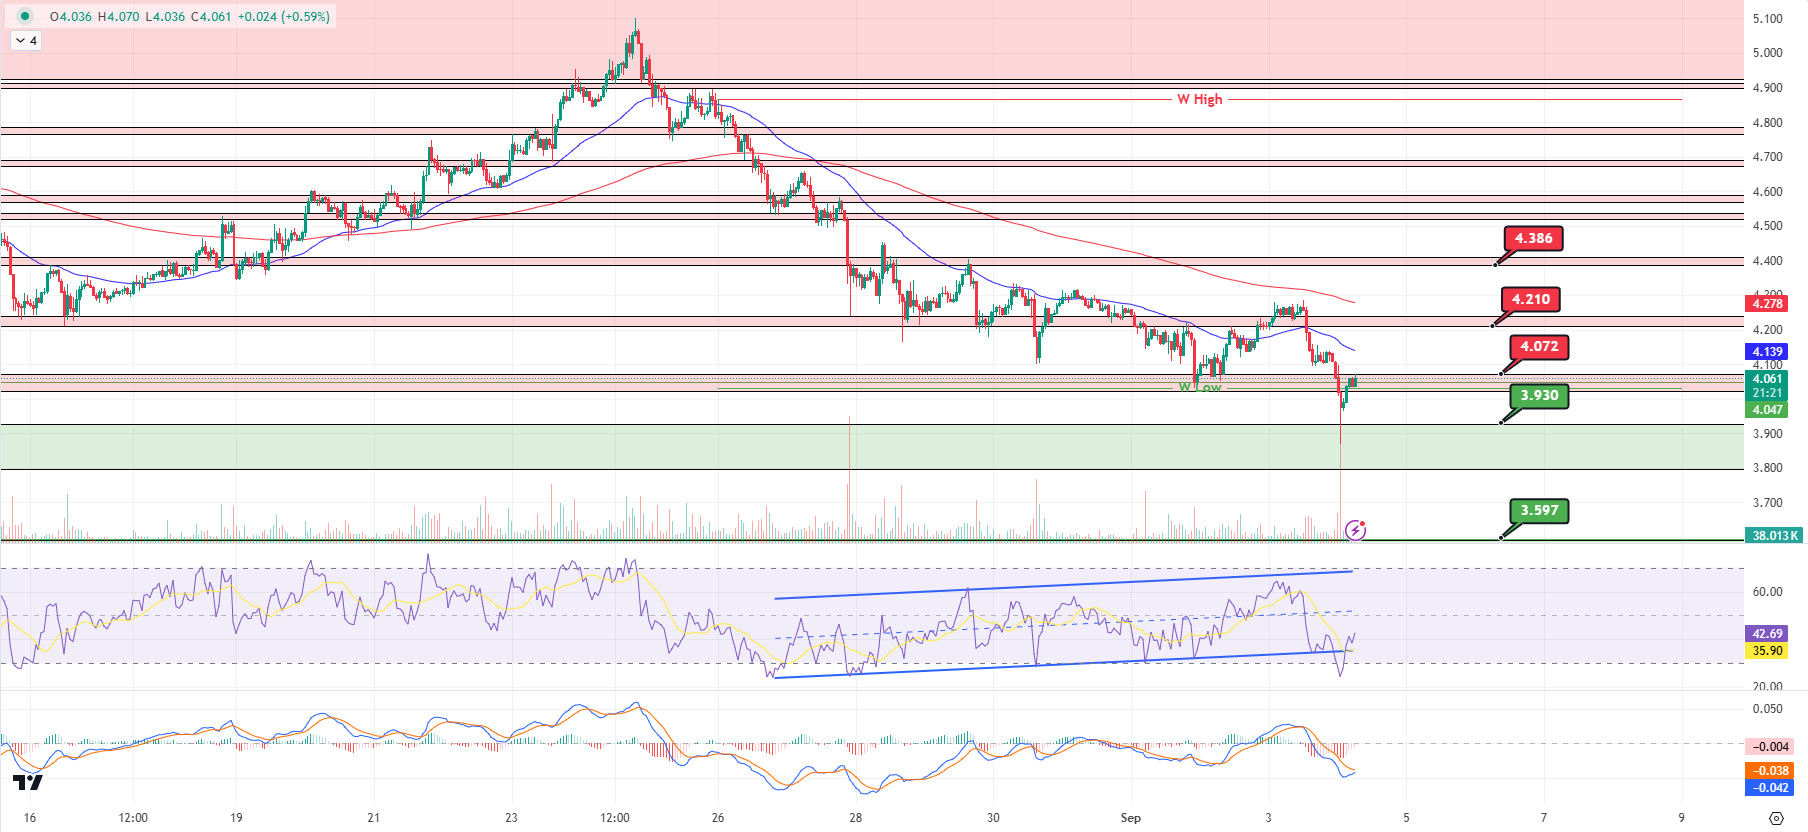
After the negative opening of the US stock markets yesterday, the Japanese stock market also opened with -4%. The expectation of recession in the market negatively affected the cryptocurrency market. When we examine the Polkadot (DOT) chart, the price, which was rejected from the 4.210 resistance, seems to have broken down the first support level of 4.072 and reacted from the second support level of 3.930. When we examine the MACD, we can say that the selling pressure is decreasing. In this context, if the price stays above the 4,072 level, it may want to test the 4,210 level again. In the negative scenario, if the price cannot hold at 4.072 and moves down, it may want to test the 3.930 level.
(Blue line: EMA50, Red line: EMA200)
Supports 3.930 – 3.597 – 3.335
Resistances 4.072 – 4.210 – 4.386
SHIB/USDT
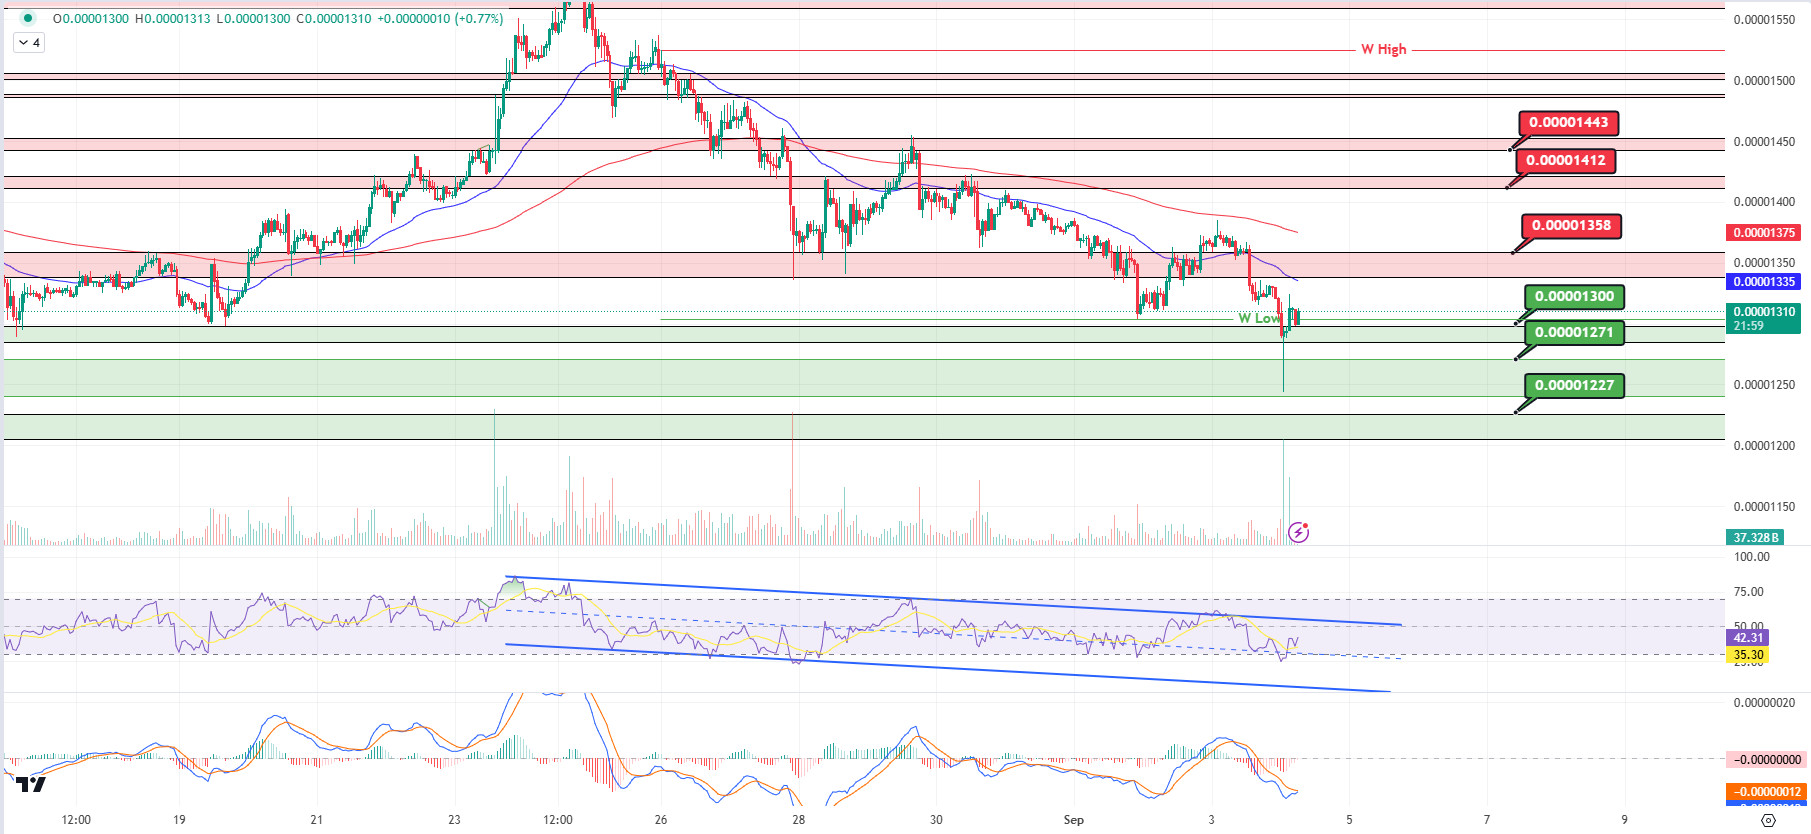
The serious selling pressure following the recession expectations also had an impact on SHIB. Rejected at 0.00001358, the first resistance level, SHIB’s reaction at the first support level was insufficient. Breaking the first support level down, the price pinned the second support level at 0.00001271. When we examine the MACD, we can say that the selling pressure is decreasing. In a positive scenario, if the price can maintain above 0.00001300, its next target will be 0.00001358 resistance. On the other hand, if the selling pressure rises again, the price may react again at 0.00001300. In case this support is lost, the price may want to retest the second support level of 0.00001271.
(Blue line: EMA50, Red line: EMA200)
Supports 0.00001300 – 0.00001271 – 0.00001227
Resistances 0.00001358 – 0.00001412 – 0.00001443
LEGAL NOTICE
The investment information, comments and recommendations contained herein do not constitute investment advice. Investment advisory services are provided individually by authorized institutions taking into account the risk and return preferences of individuals. The comments and recommendations contained herein are of a general nature. These recommendations may not be suitable for your financial situation and risk and return preferences. Therefore, making an investment decision based solely on the information contained herein may not produce results in line with your expectations.


