MARKET SUMMARY
Latest Situation in Crypto Assets
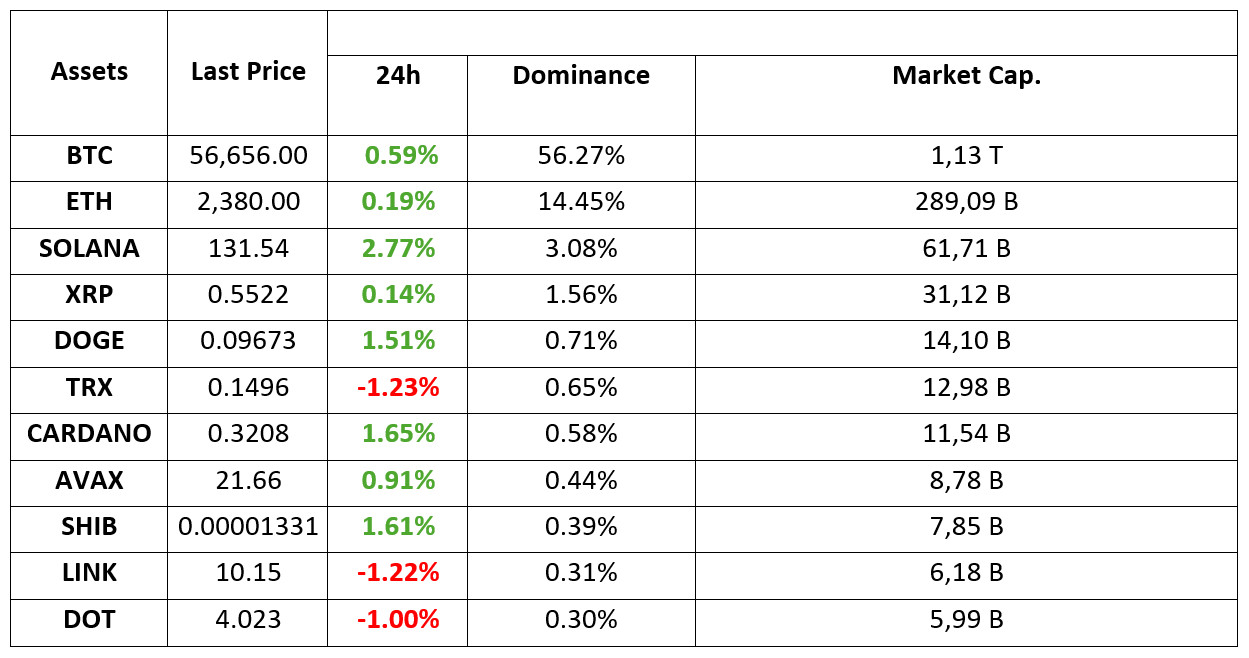
*Prepared on 5.09.2024 at 07:00 (UTC)
WHAT’S LEFT BEHIND
Kamala Harris Allegedly Started Collecting Cryptocurrency Donations!
Coinbase CFO Alesia Haas announced that US Vice President and Democratic presidential candidate Kamala Harris is accepting cryptocurrency donations for her campaign using the Coinbase Commerce platform.
Bitcoin ETFs Lose Highest Daily Exit in Four Months
BTC lost value as US manufacturing data fueled concerns over the growth of risk assets.US-listed spot bitcoin (BTC) exchange traded funds (ETFs) are having a tough day as growth concerns and a sell-off in Nvidia (NVDA) dampened market sentiment. According to data tracked by Farside Investors, the 11 listed ETFs recorded a net outflow of $287.8 million, the largest single-day net outflow since May 1, when the funds witnessed asset outflows of over $500 million.
Arthur Hayes Warns Bitcoin Could Be Strained Ahead of Potential Central Bank Interventions
Arthur Hayes drew attention to Bitcoin’s volatility, specifically emphasizing the impact of Federal Reserve policies on price sentiment. Changes in the Federal Reserve’s Reverse Repurchase Program (RRP) balances, which play an important role in determining liquidity in the financial system, he said.
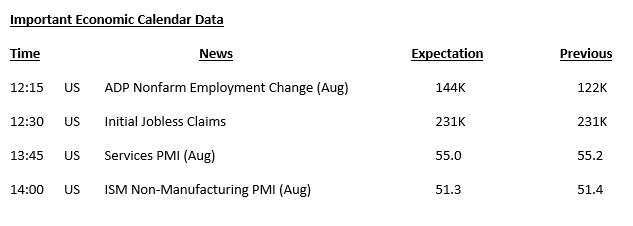
HIGHLIGHTS OF THE DAY
INFORMATION:
*The calendar is based on UTC (Coordinated Universal Time) time zone. The economic calendar content on the relevant page is obtained from reliable news and data providers. The news in the economic calendar content, the date and time of the announcement of the news, possible changes in the previous, expectations and announced figures are made by the data provider institutions. Darkex cannot be held responsible for possible changes that may arise from similar situations.
MARKET COMPASS
In global markets, expectations regarding the health of major economies and the monetary policy steps to be taken by central banks in the coming periods continue to guide prices. Yesterday’s JOLTS data for the US came in below expectations, raising the possibility that the US Federal Reserve may cut interest rates by 50 basis points in September. According to CME FedWatch, the probability of a 50-bps jumbo cut by the Fed on September 18 is around 45% (at 6:30 UTC). However, it remains to be seen whether markets are more inclined to price in the euphoria of a rate cut or the anxiety of an economic slowdown during this period.
After the US stock markets closed slightly negative yesterday, Asian indices followed a generally negative course this morning. Expectations that the Bank of Japan (BoJ) is getting closer to another rate hike seem to be increasing with new statements and data. European stock markets are also expected to start the day in the red zone. Friday’s data for the US seems to be quite critical and we can say that we have seen that investors are hesitant to take risks before that. Today, we will again watch a data set coming from the US front and we think it may be quite important in terms of pricing behavior.
Yesterday, the appetite brought by expectations that the Fed was close to a stronger rate cut pushed digital assets higher for a while. In our analysis yesterday evening, we noted that markets may look for an excuse to rally during the relevant trading hours. The gains could not be permanent and the fragility of risk appetite due to economic concerns led to the inability of cryptocurrencies to maintain their gains. We can say that similar pricing may occur in the markets with the US data coming today. However, the pricing of economic health, i.e. “Bad data, bad market. Good data, good market” equation seems more likely to work. It would be healthier to evaluate the upcoming data set from the US from this perspective.
TECHNICAL ANALYSIS
BTC/USDT
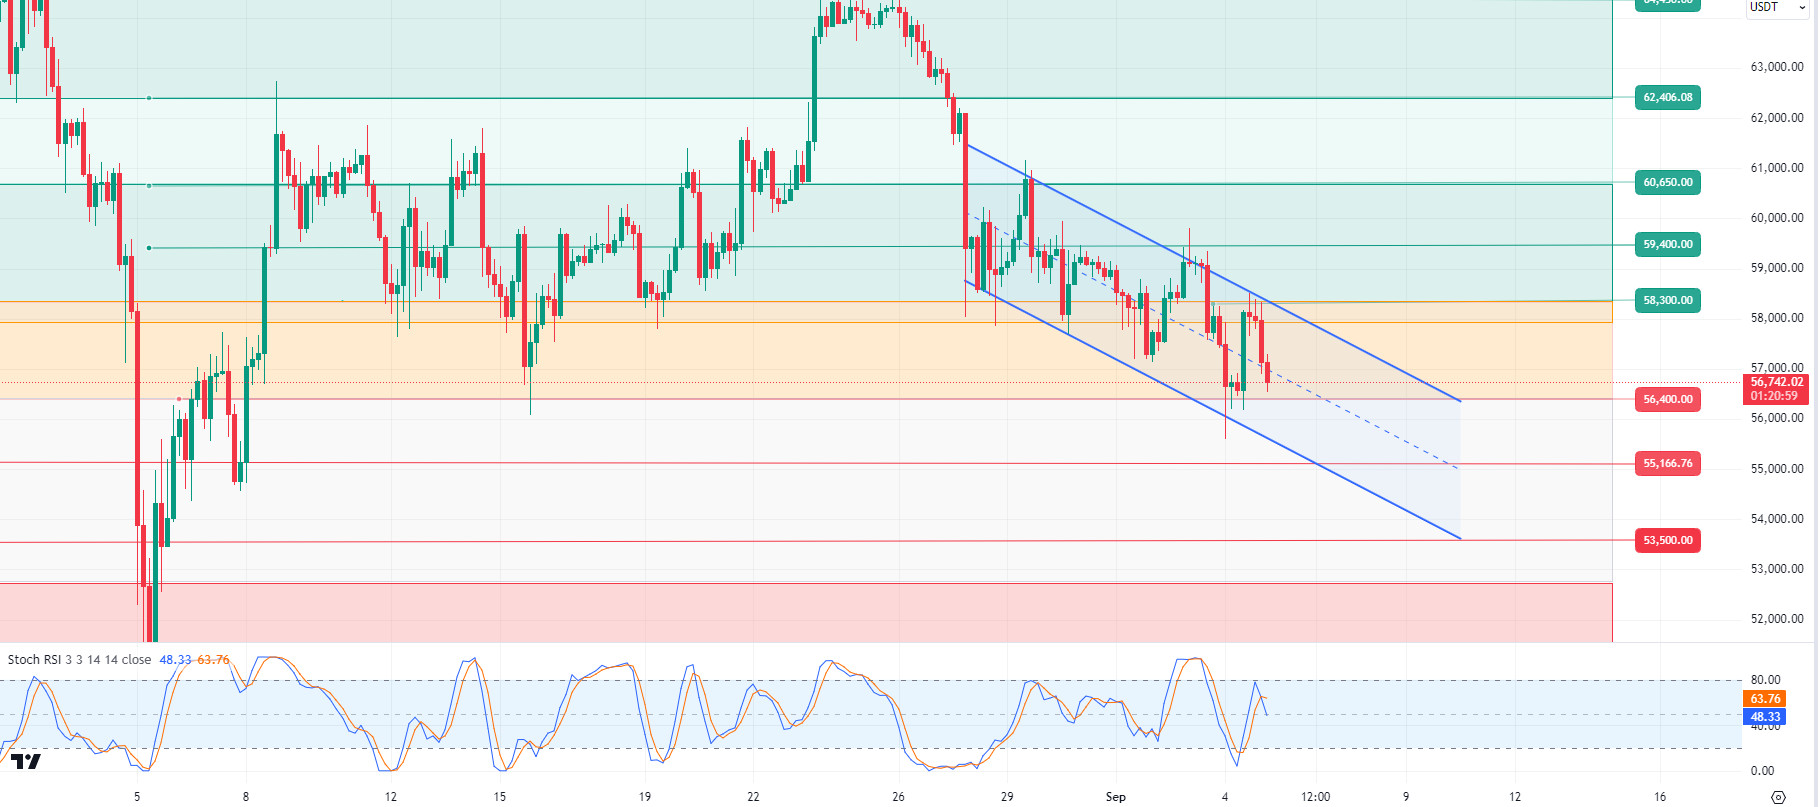
Impact of ETFs on Bitcoin! Growth concerns over US manufacturing data and the sell-off in Nvidia led to a massive outflow of $287.8 million in spot Bitcoin ETFs. This was recorded as the largest single-day outflow since May 1. Yesterday’s lower-than-expected JOLTS figures, which provide important data on the US job market, brought the possibility of a 50 basis point rate cut by the FED on September 18 back to the agenda. If the unemployment rate and non-farm employment data to be announced tomorrow are realized within expectations on the US side, it may cause Bitcoin and risky assets to recover and end the short-term downtrend. After consolidating at the level of 56,400, which we stated as critical support in the BTC 4-hour technical analysis, it turned its direction up again and the resistance level of 58,300 was tested. The search for direction in BTC, which is currently trading at 57,800 in the downtrend, may be shaped by the data to be announced tomorrow. Our support level before the critical data is 56,400 and the resistance level is 58,300. The break of these points can give us a message about the direction of the trend.
Supports 56,400 – 55,166 – 53,500
Resistances 57,200 – 58,300 – 59,400
ETH/USDT
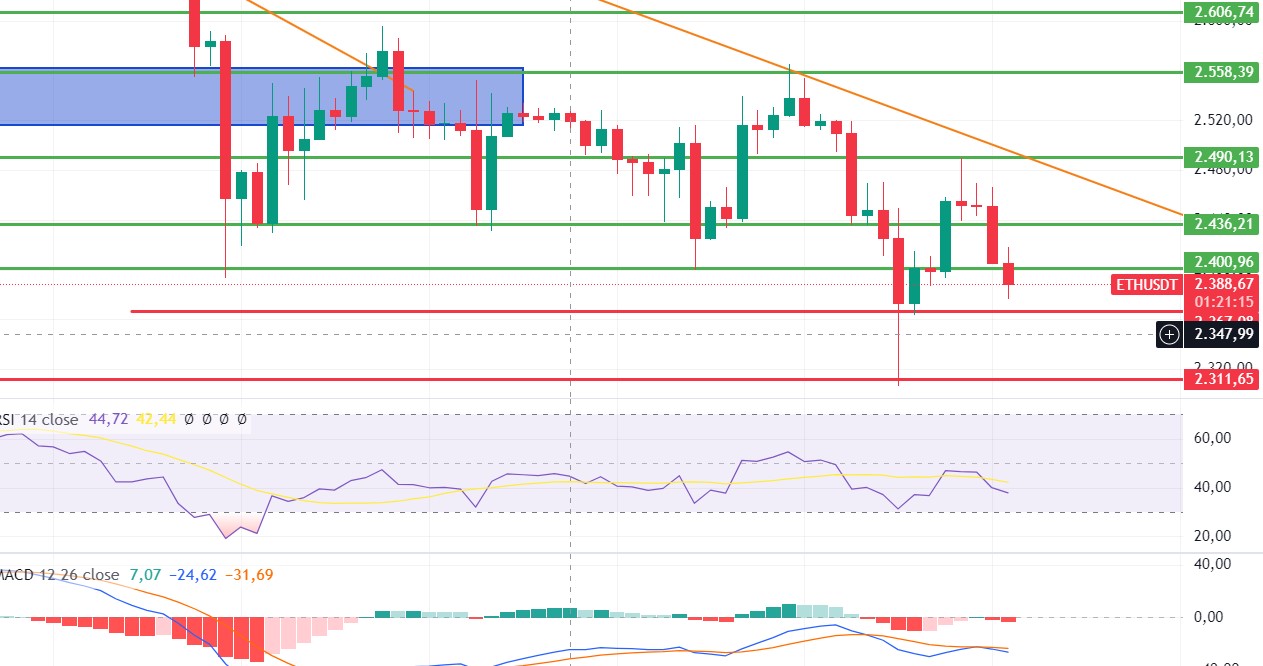
Ethereum, which rose as high as 2,490 resistance yesterday, fell sharply again at the Asian opening, dipping below 2,400. The fact that funding rates are directly positive on every rise and the lack of volume on the spot side makes the pressure on the price even more felt. RSI and MACD have turned negative again. If 2,436 cannot be regained, it is possible to see a retracement to the 2,300 level during the day. Regaining the 2,436 level may cause an increase up to the 2,490 level.
Supports 2,367 – 2,311 – 2,194
Resistances 2,436 – 2,490 – 2,550
LINK/USDT
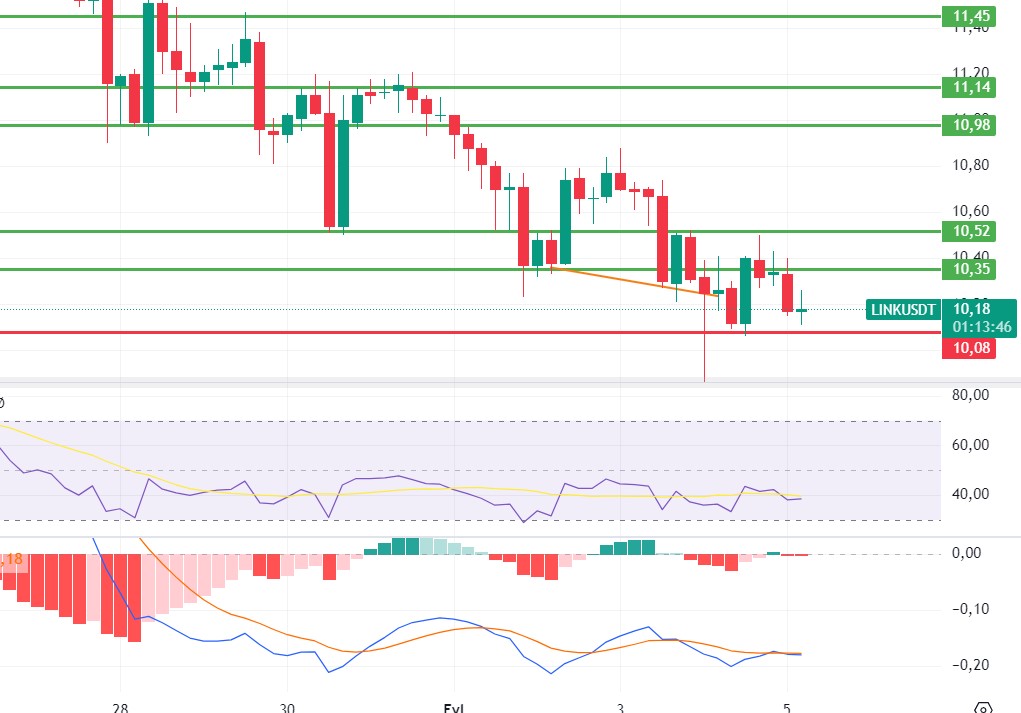
In yesterday’s movement, LINK rose up to 10.52 resistance but was affected by the decline and fell to 10.08 support. Breaks in the decisive 10.08 – 10.35 range can draw a healthier outlook for the direction. For now, it can be expected to go back and forth in this range. The break of 10.08 may start a serious decline.
Supports 10.08- 9.47 – 8.12
Resistances 10.35 – 10.52 – 10.98
SOL/USDT
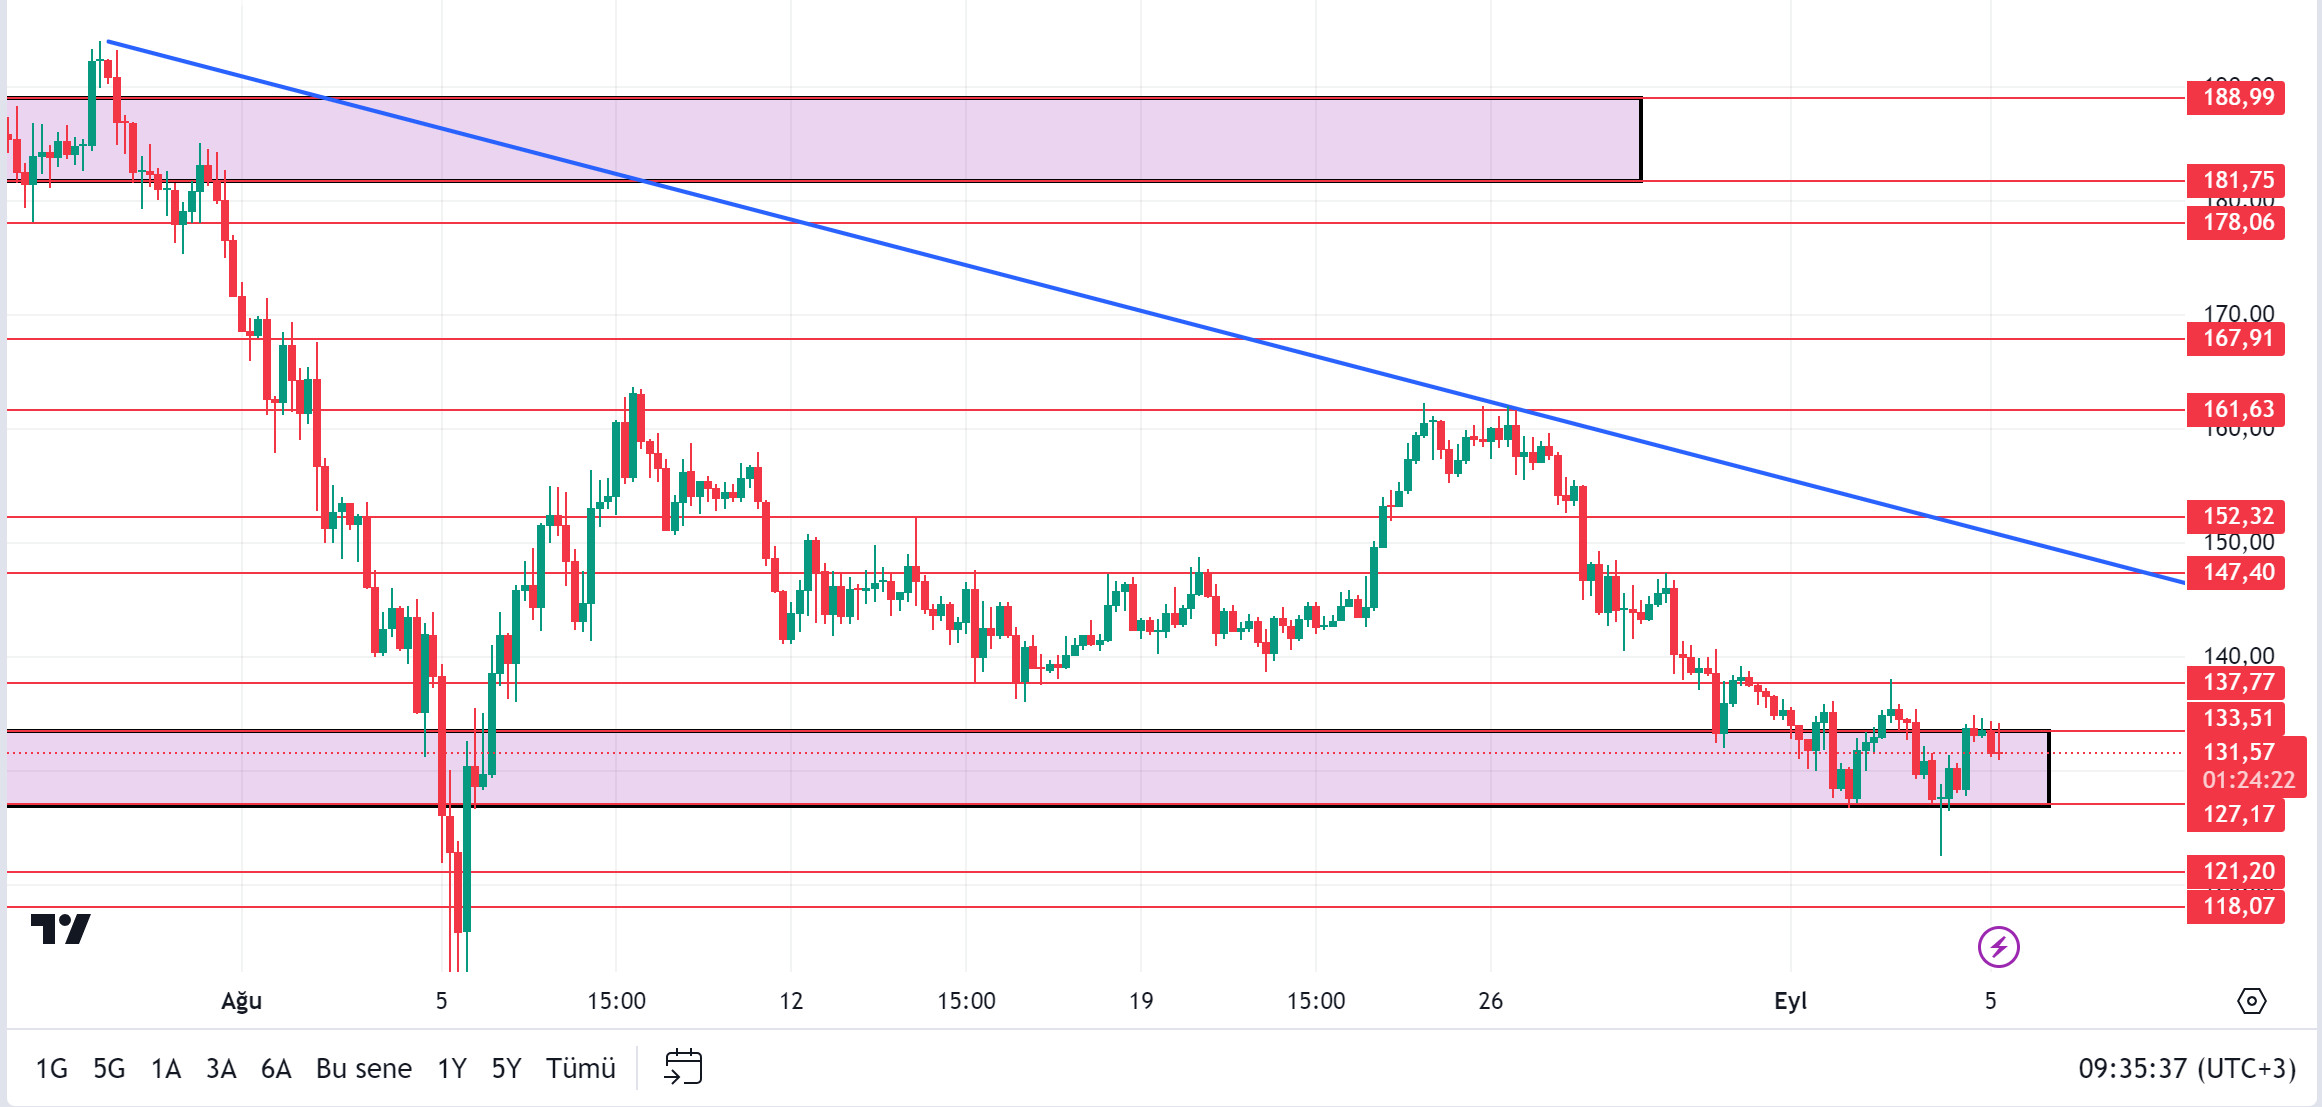
Negative data continues to come from Japan. Japan stock market continues to close in the minus. Today, ISM Services PMI data from the US should be followed. Money inflows to the SOL ecosystem continue. While there was only 750 thousand dollars of inflows yesterday, this number is 11.99 million dollars at the time of writing today. Looking at the chart, SOL seems to have encountered resistance at the ceiling level of the 133.51 – 127.17 band. If it breaks this band, the rise may begin. SOL, which has been accumulating in a certain band since April, seems to have received the support to test the 137.77 – 147.40 support levels if the rises continue. If the pessimism in the market increases, 127.17 – 121.20 resistances should be followed.
Supports 127.17 – 121.20 – 118.07
Resistances 133.51 – 137.77 – 147.40
ADA/USDT
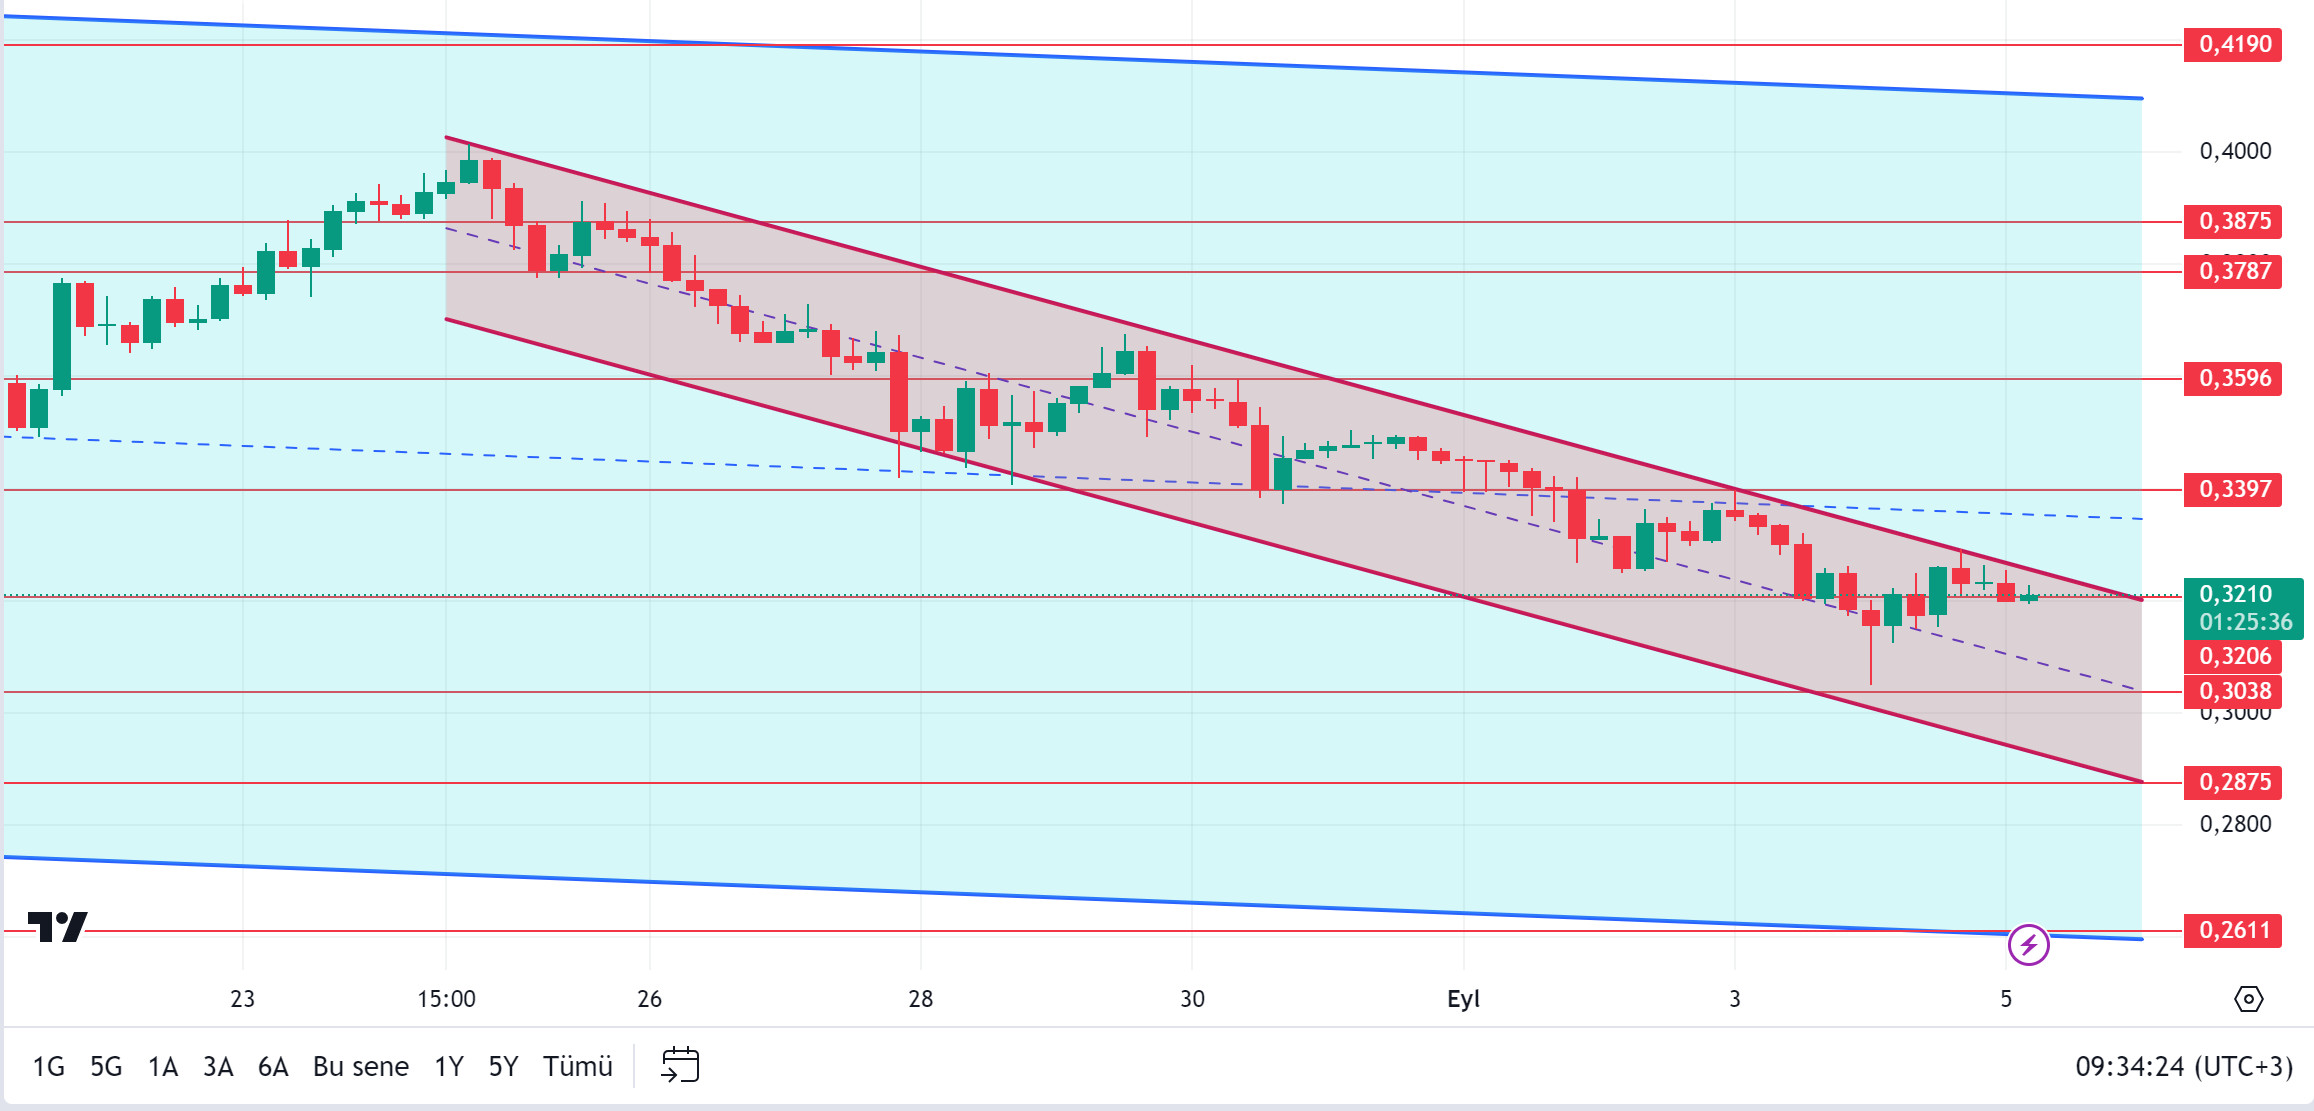
Negative data continues to come from Japan. Japan stock market continues to close in the minus. Today, ISM Services PMI data from the US should be followed. According to the data from CME, the probability of a 50 basis point interest rate cut in the US seems to be 45%. When we look at the chart of ADA, ADA, which is in a downtrend that started on August 24, is priced at 0.3210. Despite the expectation of the incoming update, the news from Japan has made it difficult for ADA’s uptrend to continue. In case of deepening, 0.3206 – 0.3038 levels can be followed as support levels. If investors take into account the innovations brought by the update and the increased likelihood of a 50 basis point US interest rate cut, the price may continue to be priced by rising in the descending channel, bringing the price to 0.3397 – 0.3596 levels.
Supports 0.3206 – 0.3038 – 0.2875
Resistances 0.3397 – 0.3596 – 0.3787
 AVAX/USDT
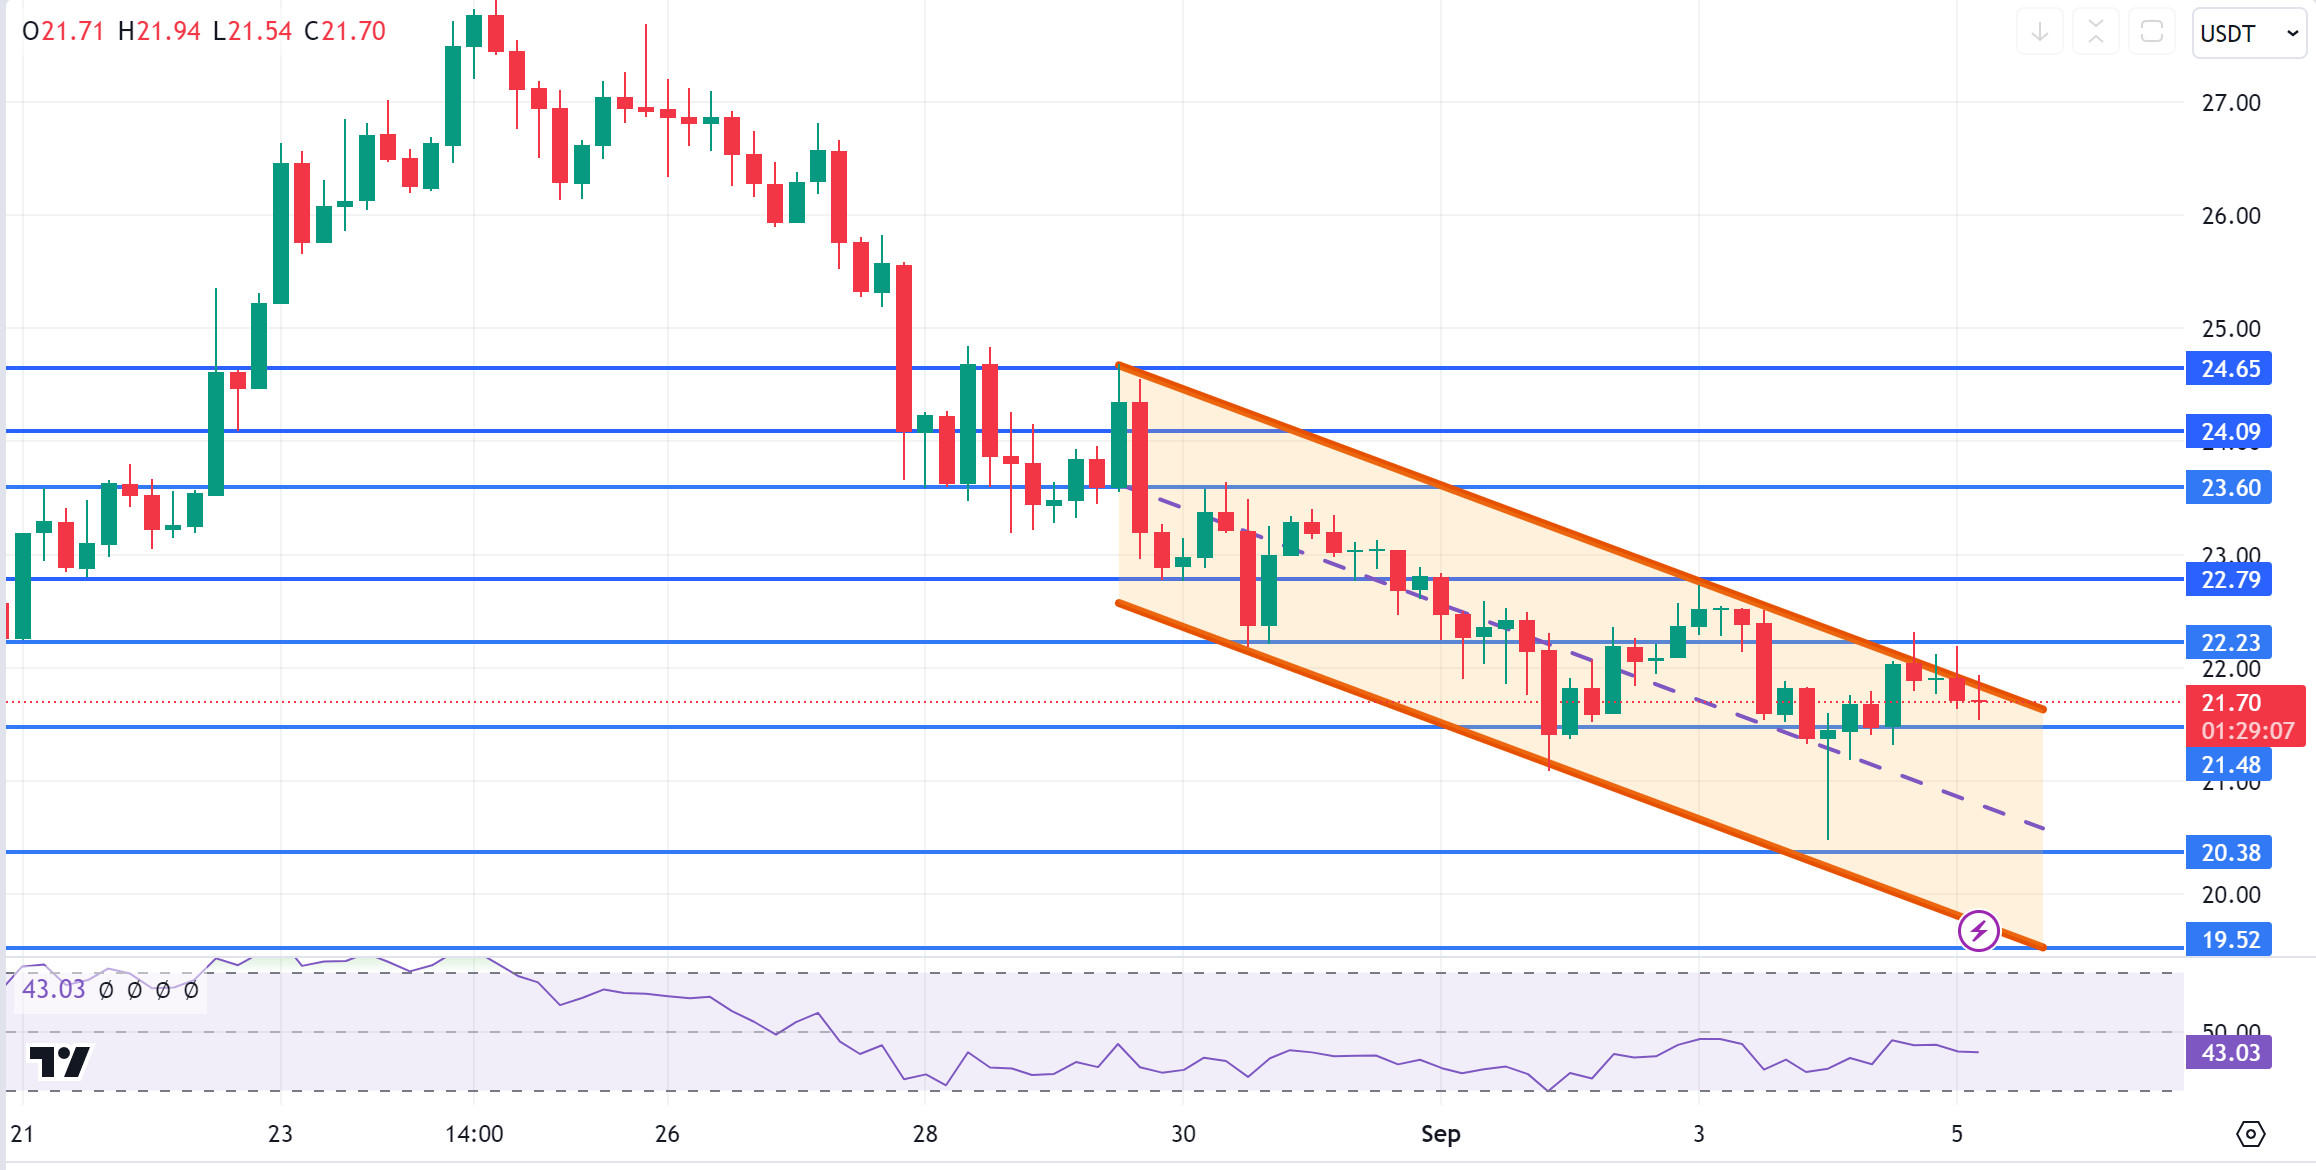
AVAX, which opened yesterday at 21.38, closed the day at 21.90, although it experienced a decline parallel to the market during the day with the statement of the governor of the central bank of Japan that we may raise interest rates.
It is currently trading at 21.70 and continues its movement within the falling channel. On the 4-hour chart, it is trying to break the upper band of the channel. If it closes above 22.23 resistance, it may break the channel upwards and test 22.79 and 23.60 resistances. If it fails to break 22.23 resistance and a sales reaction comes, it may test 21.48 support. As long as it stays above 20.38 support during the day, we can expect it to maintain its upward demand. With the break of 20.38 support, sales may deepen.
Supports 21.48 – 20.38 – 19.52
Resistances 22.23 – 22.79 – 23.60
TRX/USDT
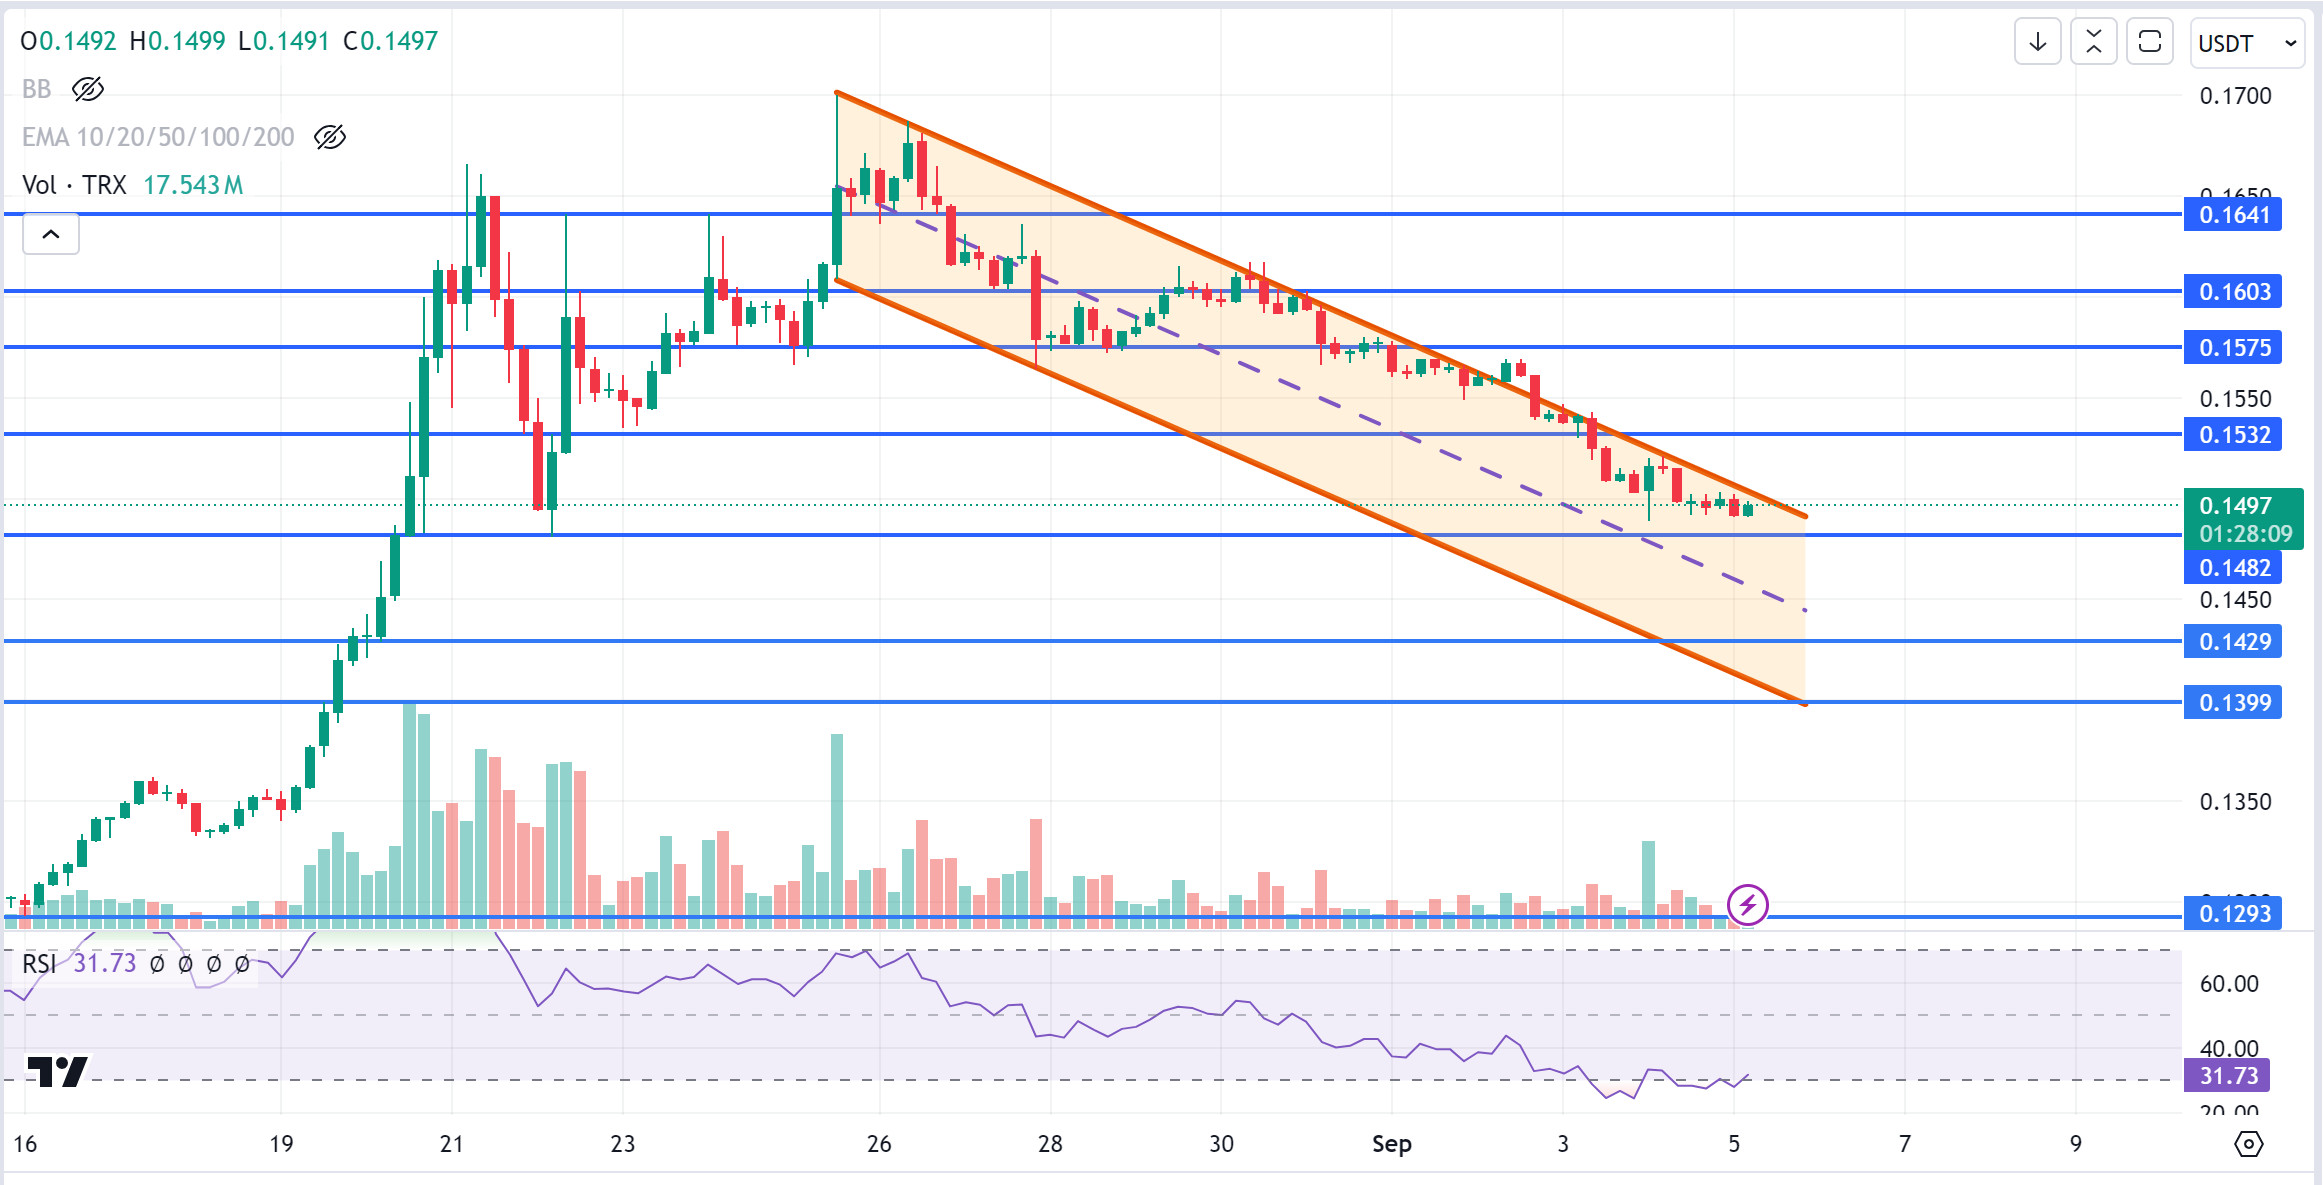
TRX, which started yesterday at 0.1504, fell slightly after the statements of the governor of the central bank of Japan and closed the day at 0.1498. TRX, currently trading at 0.1497, continues to move in the upper band of the falling channel. On the 4-hour chart, the RSI is in the oversold zone with 31 and a buying reaction can be expected from this zone. In such a case, it may test the 0.1532 resistance. If it breaks the 0.1482 support during the day and moves towards the lower band of the channel, it may test the 0.1429 and 0.1399 supports. As long as TRX stays above 0.1482 support, it can be expected to continue its upward demand. If this support is broken downwards, selling pressure may increase.
Supports 0.1482 – 0.1429 – 0.1399
Resistances 0.1532 – 0.1575 – 0.1603
XRP/USDT
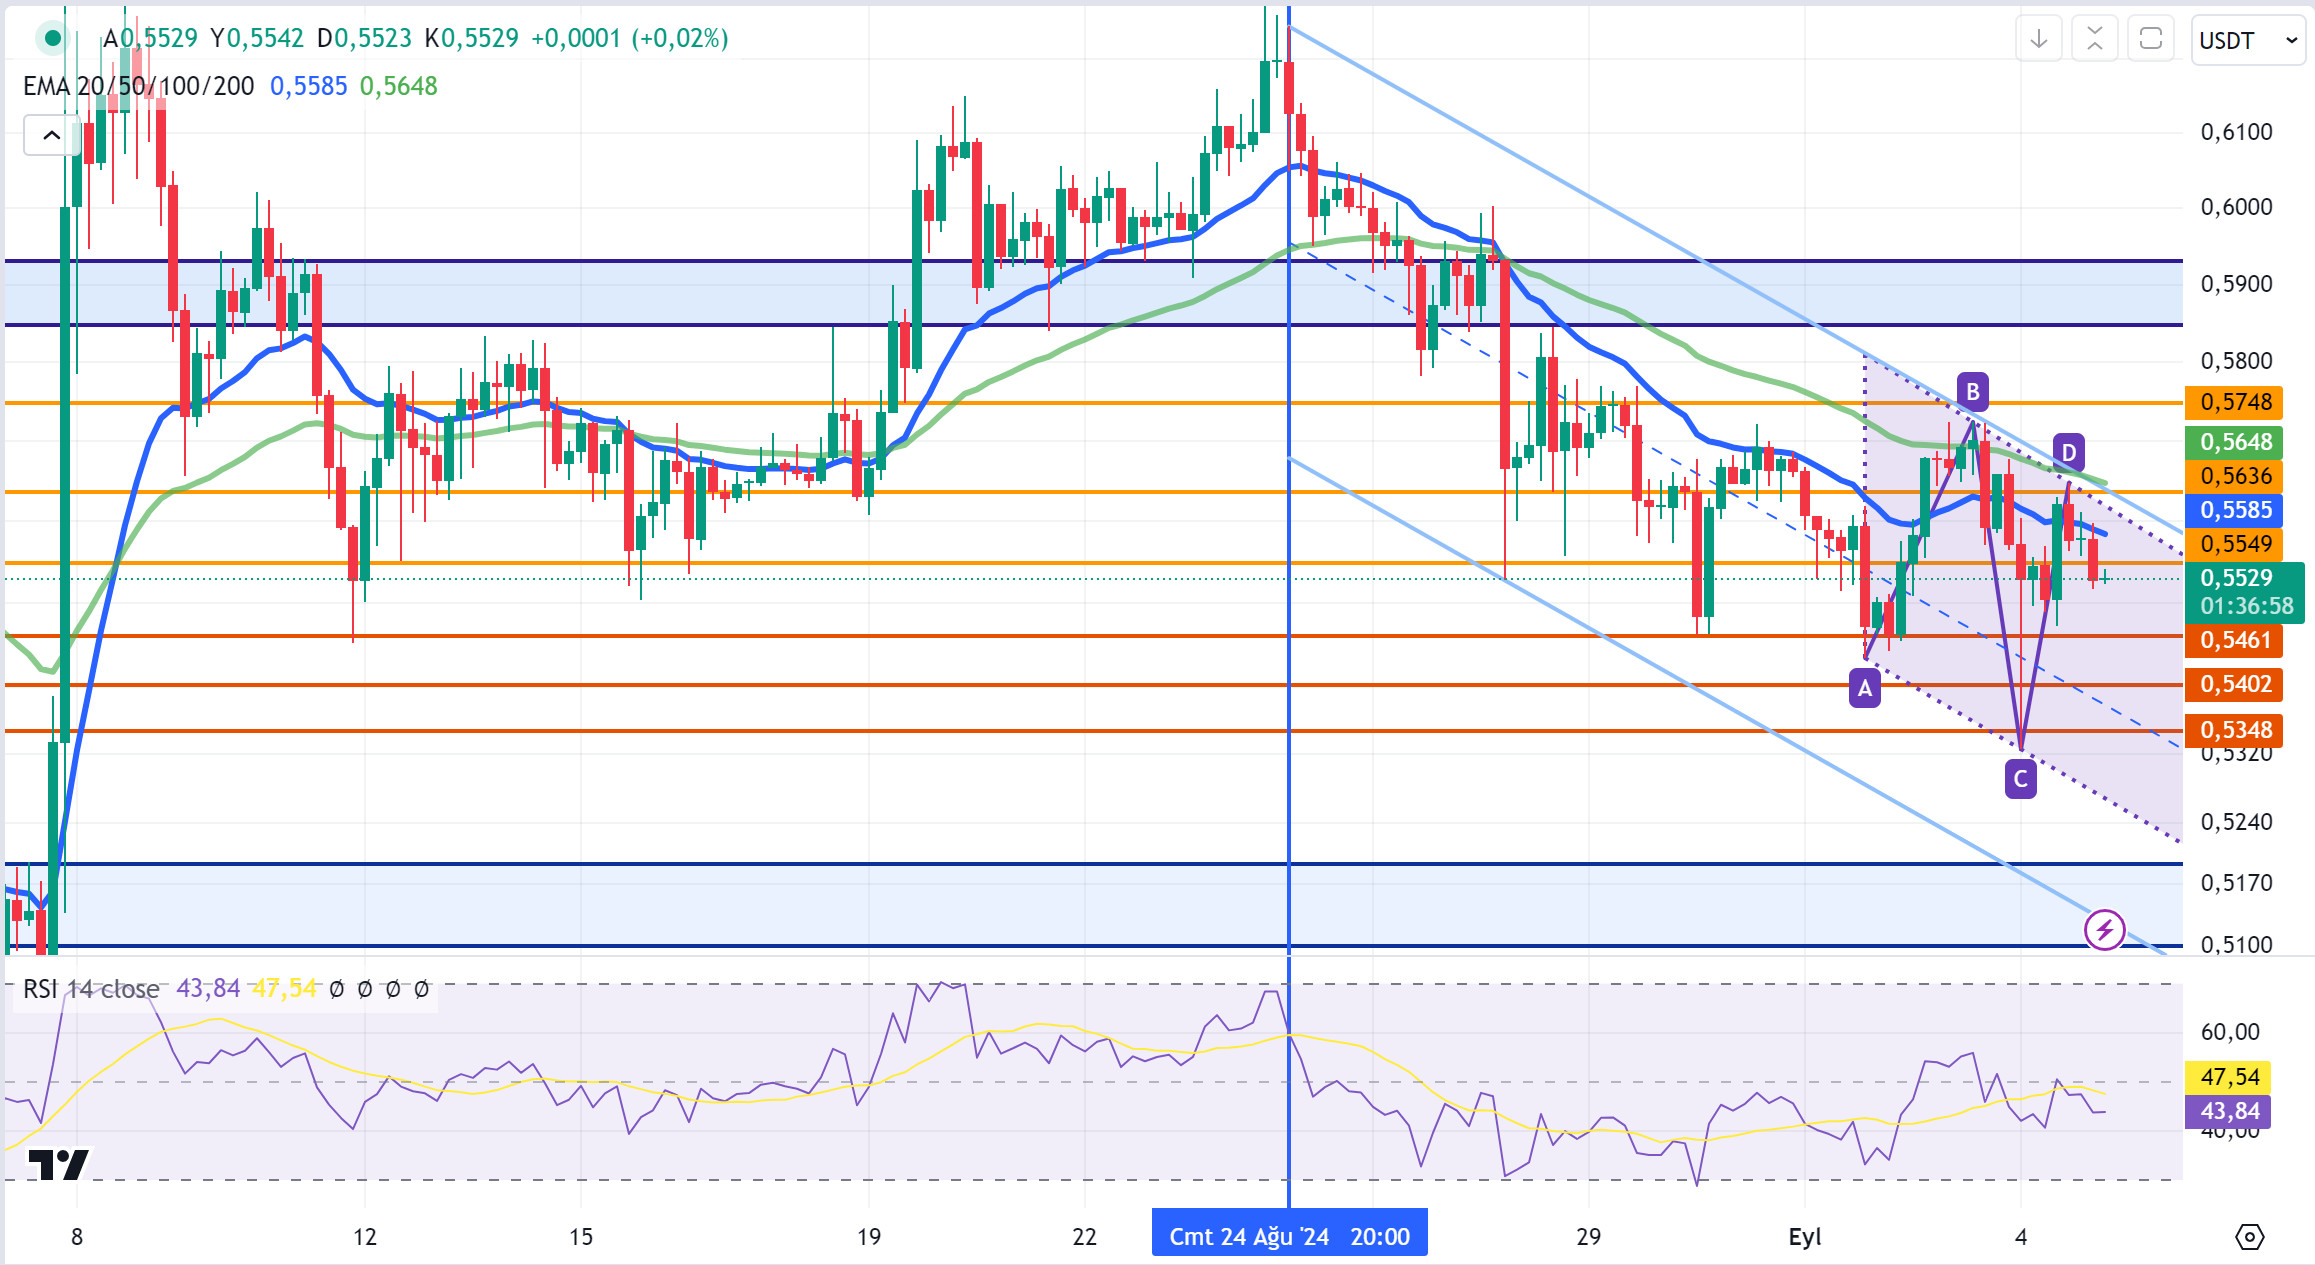
XRP, in the 4-hour analysis, after the sharp decline it experienced in the opening candle yesterday, after recovering and rising up to 0.5648, it declined and closed yesterday at 0.5579. XRP, which continues to decline today, is currently trading at 0.5529.
Starting on August 24, XRP, which continues the downtrend that started on August 24, is generally trading in a horizontal band for a while, then experiencing sharp declines or rises. XRP, which is in a downtrend, depreciated by about 1% on the opening candle today in the 4-hour analysis and fell to 0.5528. If the decline in XRP continues, it may test the support levels of 0.5461-0.5402-0.5348. In the rise that may come with the end of the decline and recovery, XRP may test the resistance levels of 0.5549-0.5636-0.5748.
If the decline continues, especially the 0.5461 support level stands out in the 4-hour analysis. XRP, which tested this support level 6 times before the sharp decline yesterday, could not break it and started to rise with the reactions. The start of the rise with the reactions that may come in a similar situation may offer a long trading opportunity. Otherwise, it may offer a short trading opportunity if the support level is broken, and the decline deepens.
Supports 0.5461 – 0.5402 – 0.5348
Resistances 0.5549 – 0.5636 – 0.5748
DOGE/USDT
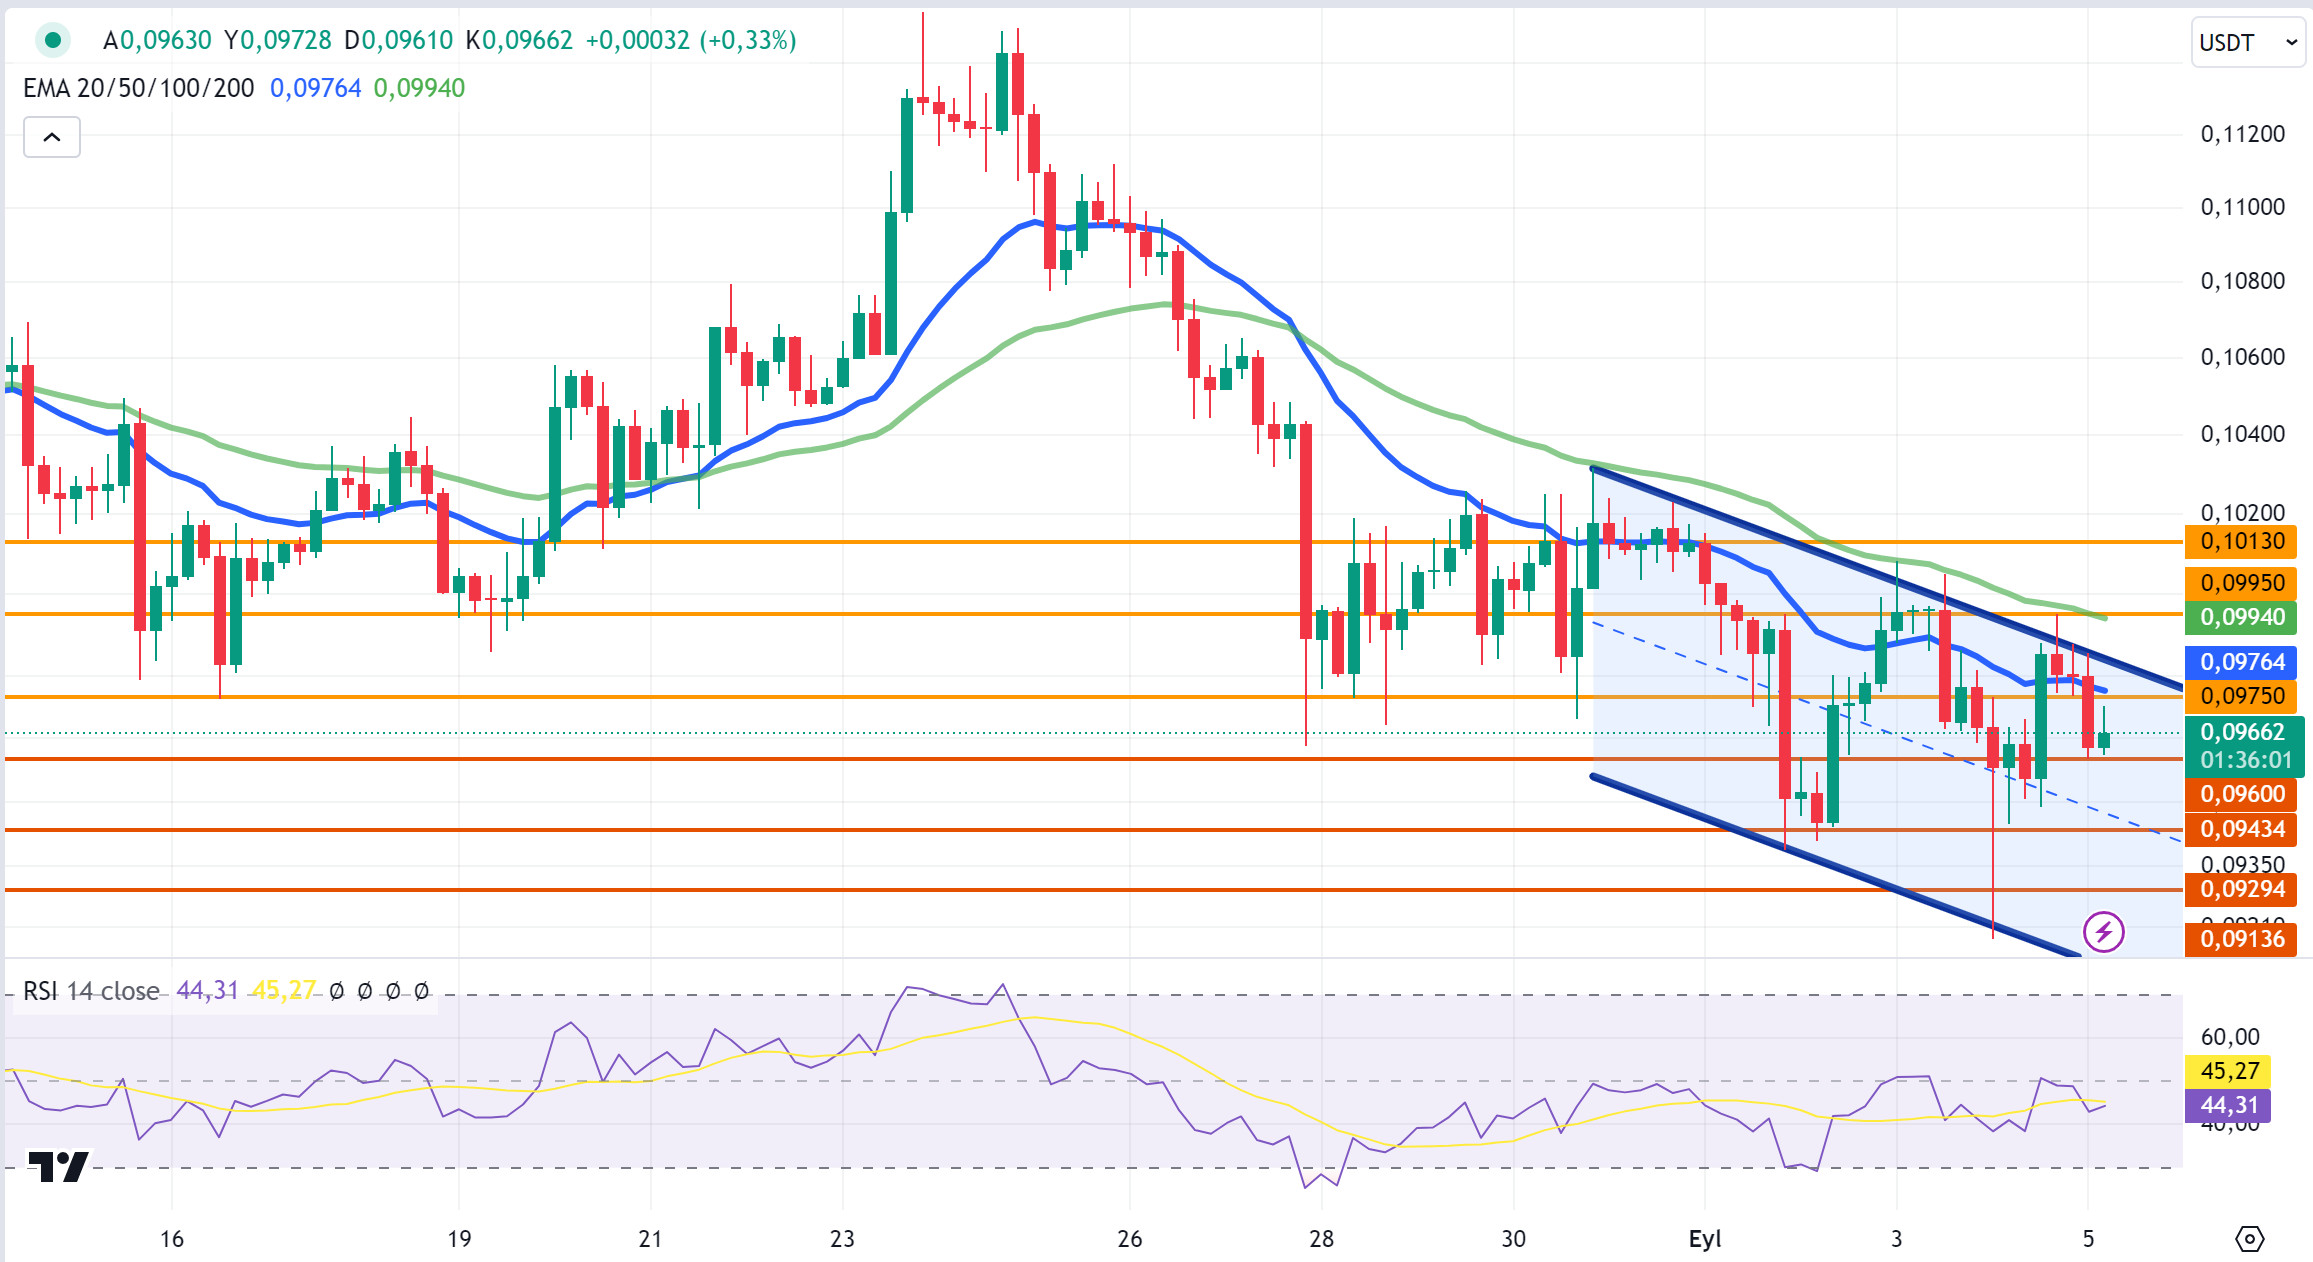
In the 4-hour analysis, DOGE, which fell sharply to 0.0918 with a sharp decline in the opening candle on the opening candle and then recovered and rose after the reaction, closed yesterday at 0.0980 with a daily increase of 1.3% on a daily basis.
In today’s 4-hour analysis, it fell to 0.0966 with a decline in the opening candle and is currently trading at that level. If the decline seen in the first candle continues today, DOGE may test the support levels of 0.0960-0.0943-0.0929. On the contrary, if it starts to rise with the reactions that may come, it may test the resistance levels of 0.0975-0.0995-0.1013.
In the crypto market, where volatility is high, we can see that short-term declines and rises occur when candles are examined in the 4-hour analysis. This may offer opportunities in short-term trading.
Supports 0.0960 – 0.0943 – 0.0929
Resistances 0.0975 – 0.0995 – 0.1013
DOT/USDT
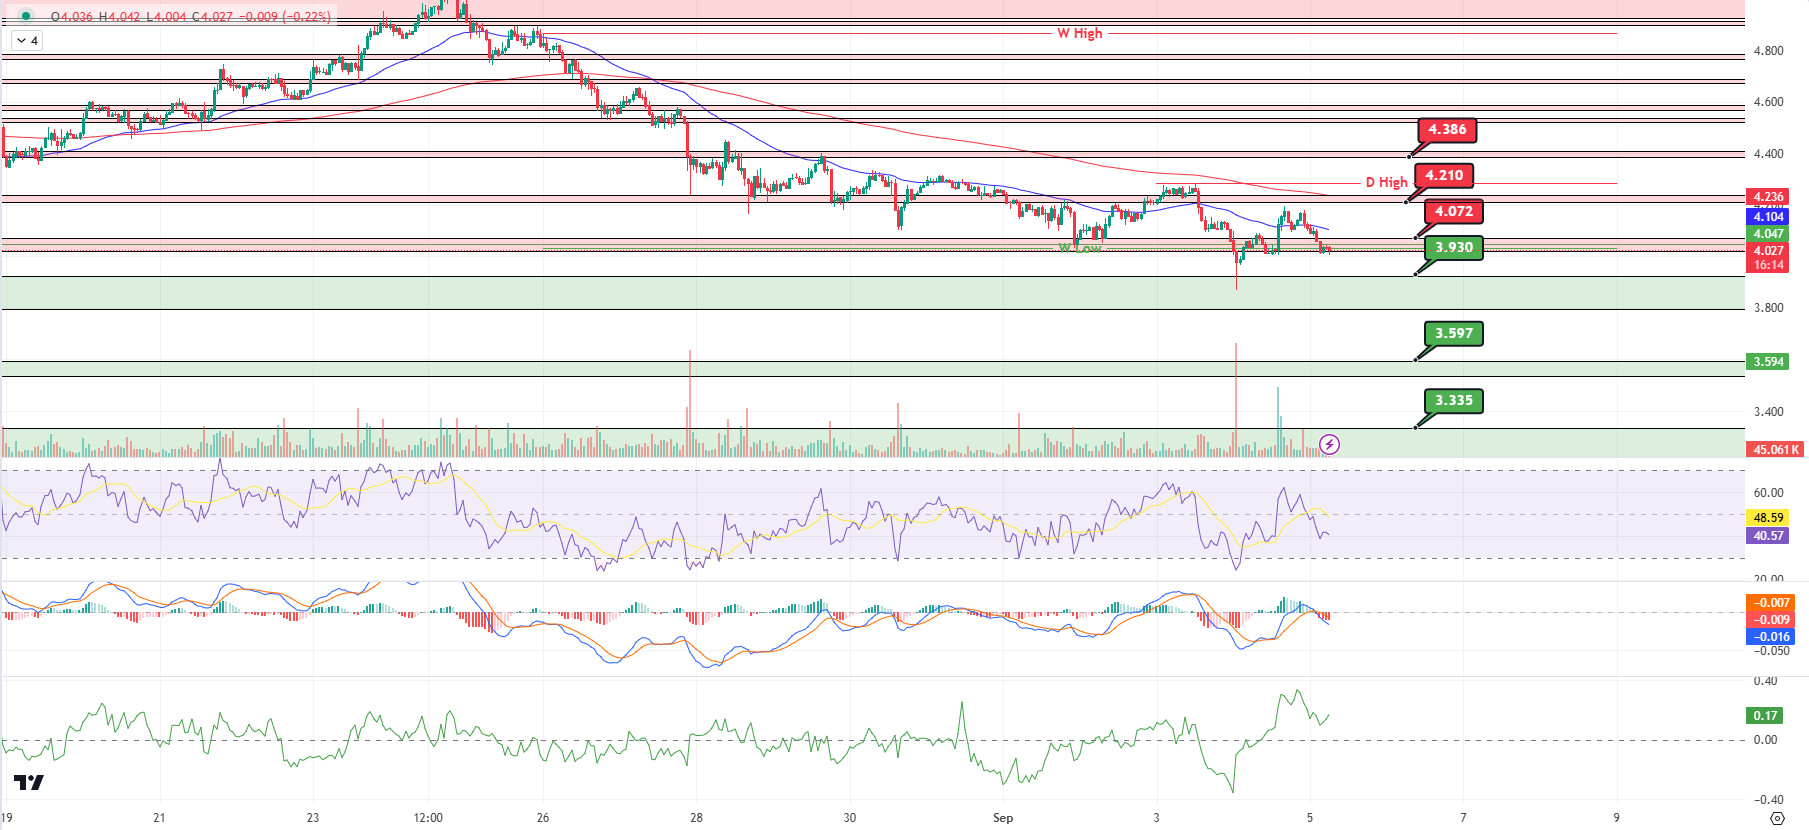
As we mentioned in our previous analysis, Polkadot (DOT) closed the candle above the 4.072 resistance and seems to have sold in the 4.210 bands. When we examine the MACD, we can say that the selling pressure increased compared to the previous hour. If the price stays below 4.072, its next target could be 3.930. In the positive scenario, according to the CMF (Chaikin Money Flow) oscillator, buying pressure seems to be more than selling pressure. In this context, we can think that if the price is permanent above the 4.072 level, it may test the 4.210 levels again.
(Blue line: EMA50, Red line: EMA200)
Supports 3.930 – 3.597 – 3.335
Resistances 4.072 – 4.210 – 4.386
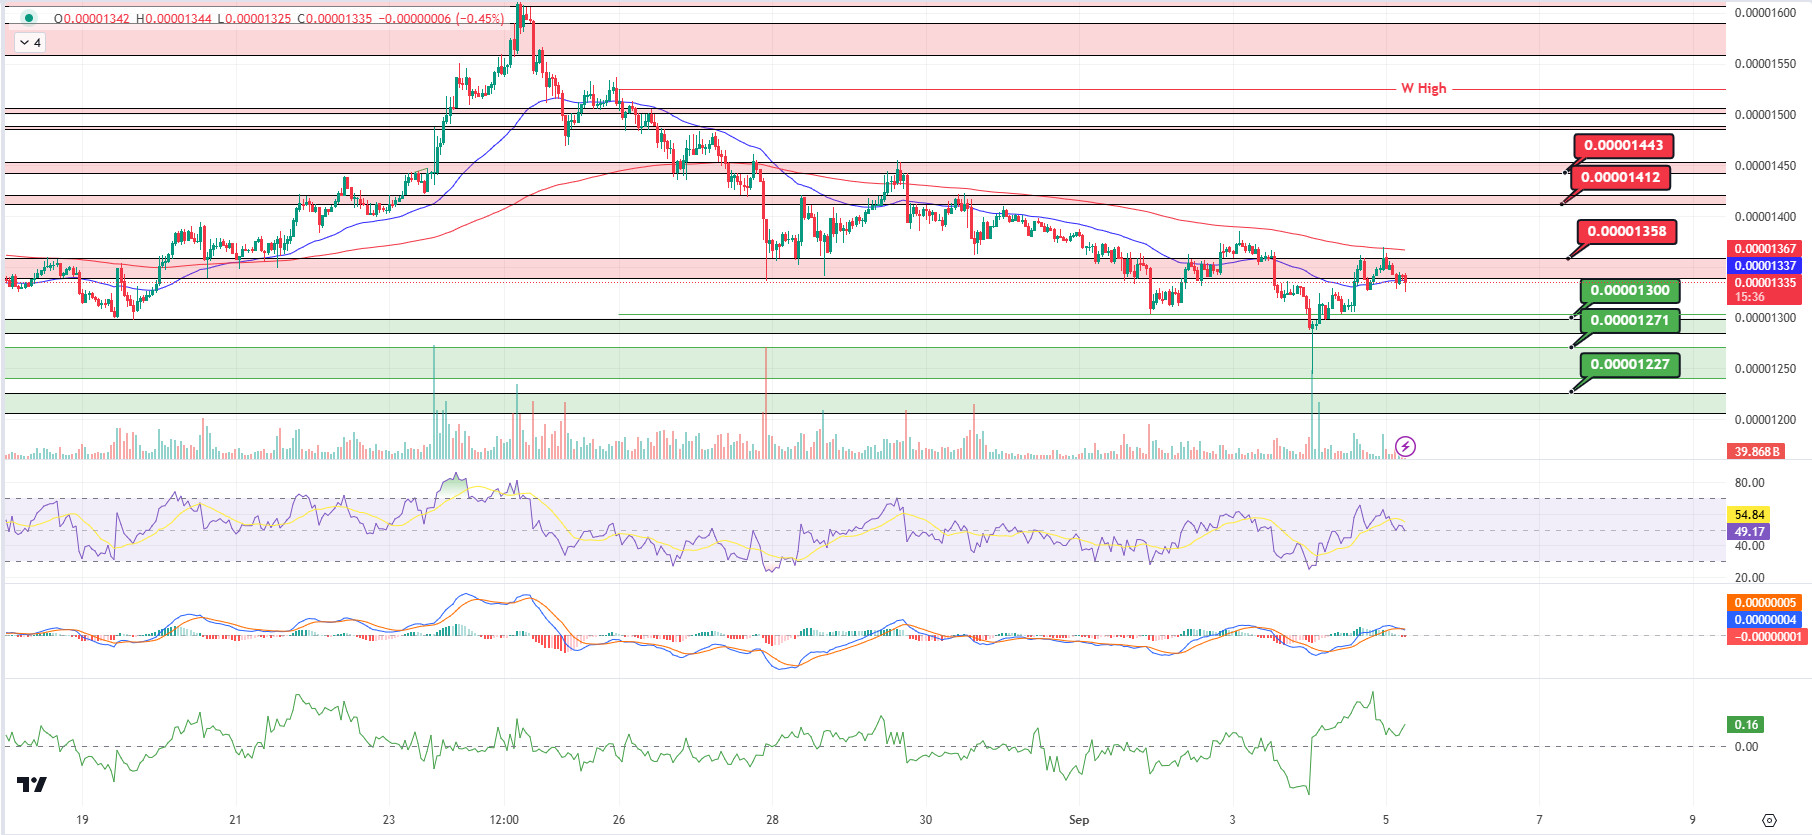
SHIB/USDT
As we mentioned in our previous analysis, Shiba Inu (SHIB) closed the candle above EMA50 and tested 0.00001358 levels. Rejected at 0.00001358, SHIB seems to be correcting its rise. When we examine the RSI, we can say that there is a negative mismatch between it and the price. On the MACD, we can see that the seller pressure is more. If the candle closes below the EMA50, the price may test the support level of 0.00001300. On the other hand, the positive CMF (Chaikin Money Flow) oscillator shows that the buyer pressure is more than the seller pressure. Accordingly, if the price closes above the EMA200 with a reaction from the EMA50, the price may move towards the next resistance level at 0.00001412.
(Blue line: EMA50, Red line: EMA200)
Supports 0.00001300 – 0.00001271 – 0.00001227
Resistances 0.00001358 – 0.00001412 – 0.00001443
LEGAL NOTICE
The investment information, comments and recommendations contained herein do not constitute investment advice. Investment advisory services are provided by authorized institutions on a personalized basis, taking into account the risk and return preferences of individuals. The comments and recommendations contained herein are of a general nature. These recommendations may not be suitable for your financial situation and risk and return preferences. Therefore, making an investment decision based solely on the information contained herein may not produce results in line with your expectations.