MARKET SUMMARY
Latest Situation in Crypto Assets
| Assets | Last Price | 24h Change | Dominance | Market Cap. |
|---|---|---|---|---|
| BTC | 97,830.61 | -1.27% | 56.03% | 1,94 T |
| ETH | 3,702.15 | -5.07% | 12.92% | 447,03 B |
| XRP | 2.170 | -11.03% | 3.58% | 123,76 B |
| SOLANA | 214.61 | -6.44% | 2.96% | 102,44 B |
| DOGE | 0.4015 | -8.97% | 1.71% | 59,15 B |
| CARDANO | 0.9966 | -12.44% | 1.01% | 35,04 B |
| TRX | 0.2689 | -10.90% | 0.67% | 23,22 B |
| AVAX | 44.81 | -11.17% | 0.53% | 18,38 B |
| SHIB | 0.00002669 | -12.18% | 0.45% | 15,73 B |
| LINK | 22.44 | -9.81% | 0.41% | 14,26 B |
| DOT | 8.399 | -13.35% | 0.37% | 12,83 B |
*Prepared on 12.10.2024 at 14:00 (UTC)
WHAT’S LEFT BEHIND
Marathon’s new $1 billion Bitcoin purchase
Bitcoin companies started the new week with new purchases. After MicroStrategy’s purchase of 21,500 units yesterday, Marathon bought 11,774 Bitcoin at a cost of 1.1 billion dollars today. The total number of BTC held by the company was 40,435. The price per BTC in these purchases of Marathon Digital was announced as 96 thousand dollars. The mining company is the institutional company holding the most BTC after MicroStrategy.
Microsoft Votes on Bitcoin Decision Today
Microsoft will vote today on the Bitcoin purchase proposal that came to the agenda in October. If the proposal is accepted, the company will become the largest institutional investor in Bitcoin. However, Microsoft’s board of directors characterizes this proposal as “unnecessary”.
Google Unveils Quantum Chip Willow
Google announced its new quantum chip called Willow, which can solve a problem in just 5 minutes that a normal computer cannot solve in billions of years. However, the chip is not yet capable of solving the encryption mechanisms in the Bitcoin network. This once again shows that blockchain technology is resistant to the quantum era.
HIGHLIGHTS OF THE DAY
Important Economic Calender Data
| Time | News | Expectation | Previous |
|---|---|---|---|
| – | Microsoft: Shareholder meeting regarding BTC | – | – |
INFORMATION:
*The calendar is based on UTC (Coordinated Universal Time) time zone.
The economic calendar content on the relevant page is obtained from reliable news and data providers. The news in the economic calendar content, the date and time of the announcement of the news, possible changes in the previous, expectations and announced figures are made by the data provider institutions. Darkex cannot be held responsible for possible changes that may arise from similar situations.
MARKET COMPASS
After last night’s turmoil in digital assets, a relatively more stable picture is observed today, while the recovery in Bitcoin, one of the major cryptocurrencies, stands out. On the traditional markets side, we see that stock exchanges are also following a flat course. Although the data calendar is weak today, the result of the board vote on whether Microsoft will buy Bitcoin as a reserve and the expectations regarding this may have an impact on digital asset prices. Click here to review our monthly report on this topic.
From the short term to the big picture….
The victory of former President Trump on November 5, which was one of the main pillars of our bullish expectation for the long-term outlook in digital assets, produced a result in line with our predictions. Afterwards, the appointments made by the president-elect and the expectations of increased regulation of the crypto ecosystem in the US continued to take place in our equation as a positive variable. Although Powell gave cautious messages in his last speech, the continuation of the FED’s interest rate cut cycle and the volume in BTC ETFs indicating an increase in institutional investor interest (in addition to MicroStrategy’s BTC purchases, Microsoft’s start to evaluate the purchase issue, BlackRock’s BTC ETF options started trading…) support our upward forecast for the big picture for now.
In the short term, given the nature of the market and pricing behavior, we think it would not be surprising to see occasional pauses or pullbacks in digital assets. However, at this point, it is worth emphasizing again that the fundamental dynamics continue to be bullish. We continue to evaluate the recent declines in major crypto assets within this framework.
TECHNICAL ANALYSIS
BTC/USDT
Microstrategy continues to buy Bitcoin at full speed. According to MicroStrategy’s official announcement, the company reported that from December 2 to December 8, the company purchased 21,550 Bitcoins in cash for about $2.1 billion, with an average price per Bitcoin of about $98,783. As of December 9, MicroStrategy and its subsidiaries own a total of 423,650 BTC, with a total purchase cost of about $25.6 billion and an average purchase price per Bitcoin of about $60,324.
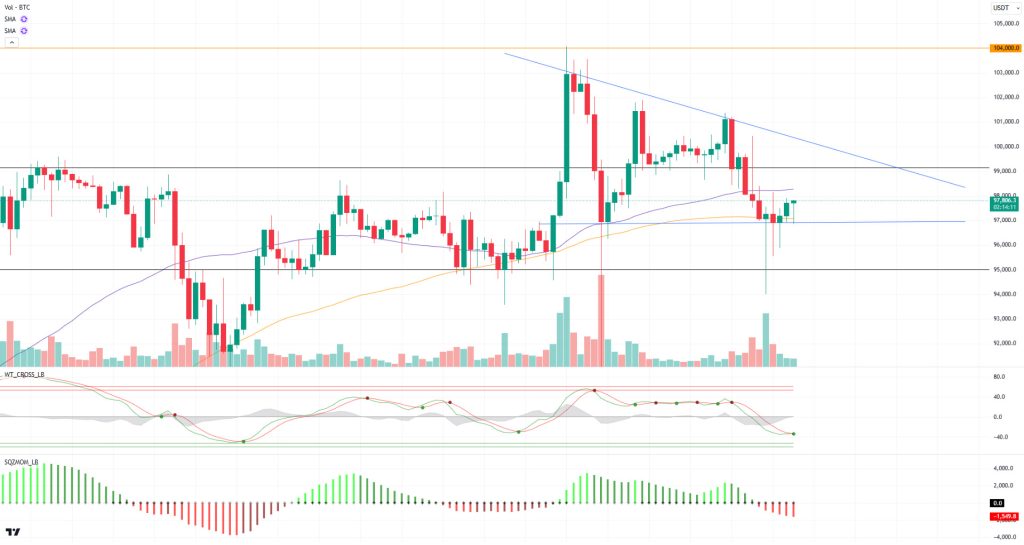
When we look at the technical outlook with the latest development, the price, which touched the bottom line of the trend during the day, reacted and turned its direction upwards. In BTC, which is currently trading at 99,000, technical oscillators continue to maintain the sell signal, while we see that the momentum indicator is getting weaker. Fundamental developments continue to limit corrections in Bitcoin price. While stock market indices in global markets follow a positive course, eyes will be on the US stock markets ahead of inflation data. While the minor resistance level of 90,140 levels awaits us in the continuation of the rise, it may test over 100,000 again if it is exceeded. In a possible pullback, we will follow the trend bottom line and SMA levels of 97,900, 97,200.
Supports 99,140 – 97,200 – 95,000
Resistances 100,000 – 101,100 – 104,000
ETH/USDT
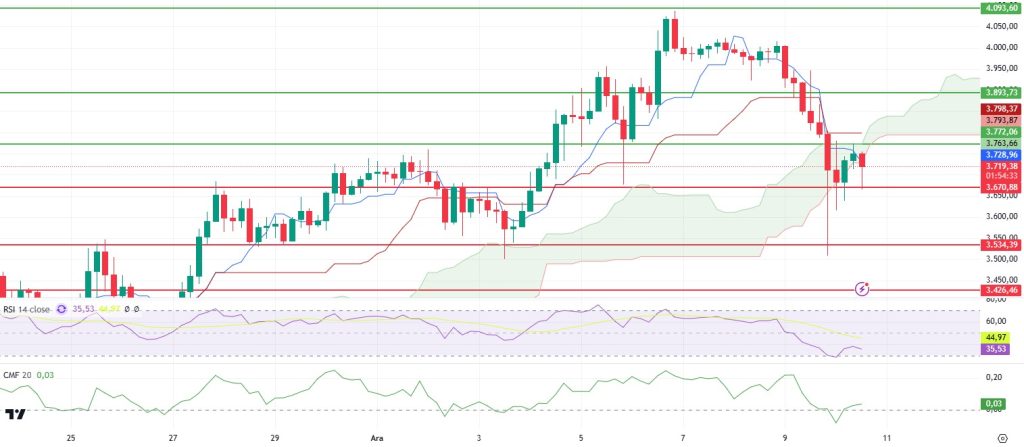
After yesterday’s decline, Ethereum managed to rise to the Kumo cloud resistance level of 3,770 in the morning hours. However, selling pressure from this level pulled the price back to 3,670. With this move, the RSI (Relative Strength Index) fell to the oversold zone and started to exhibit a downward trend again, although it regained a positive outlook with reaction purchases.
While momentum weakness continues, CMF (Chaikin Money Flow) is flat in positive territory. When we look at the Ichimoku indicator, we see that the price dipped below the Kumo cloud after the sell signal and this situation paints a negative picture.
On the other hand, the drop in the funding fee level to around 0.01 and the recovery in the Cumulative Volume Delta (CVD) spot after the fall indicate that sharp rises may come after the completion of the correction process. In this context, if 3.670 support is broken, the price may retreat to 3.534. If the 3.770 Kumo cloud resistance is exceeded, a rapid rise up to 3.893 may occur. Since these levels constitute a critical threshold, it is important to closely monitor market dynamics.
Supports 3,670 – 3,534 – 3,426
Resistances 3,772 – 3,893 – 4,093
XRP/USDT
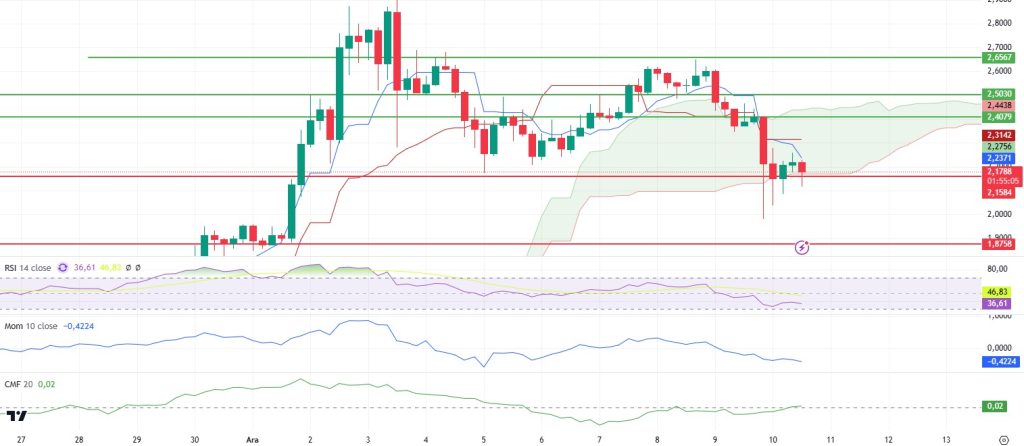
After yesterday’s decline, XRP price has been trending sideways at Kumo cloud support, while market dynamics suggest that momentum is weakening again. In particular, the RSI (Relative Strength Index), which briefly gained momentum with the morning rebound, has turned down again after this recovery. This indicates that the impact of buyers on the market has diminished.
Looking at the Ichimoku indicator, the price is moving within the Kumo cloud. However, the intersection between tenkan-sen and kijun-sen indicates a clear sell signal. This technical signal is considered as an important sign that the current trend may move in a negative direction. In this context, if Kumo cloud support is broken, the price can be expected to retreat to 1.91 levels. This level stands out as an important technical support point and investors may show buying interest at this point. On the other hand, if the price rebounds and regains the 2.41 level, the current negative outlook may end. This may signal that a buyer-dominated movement will resume in the market and rapid rises may be seen. The weakness in momentum and the uncertainty within the Ichimoku cloud make it important to follow critical levels to determine which direction the price will move. In particular, market sentiment and how trading volume reacts to support or resistance levels could play a decisive role in XRP’s short-term price action.
Supports 2.1982 – 1. 8758- 1. 6160
Resistances 2.4079 – 2.5030 – 2.6567
SOL/USDT
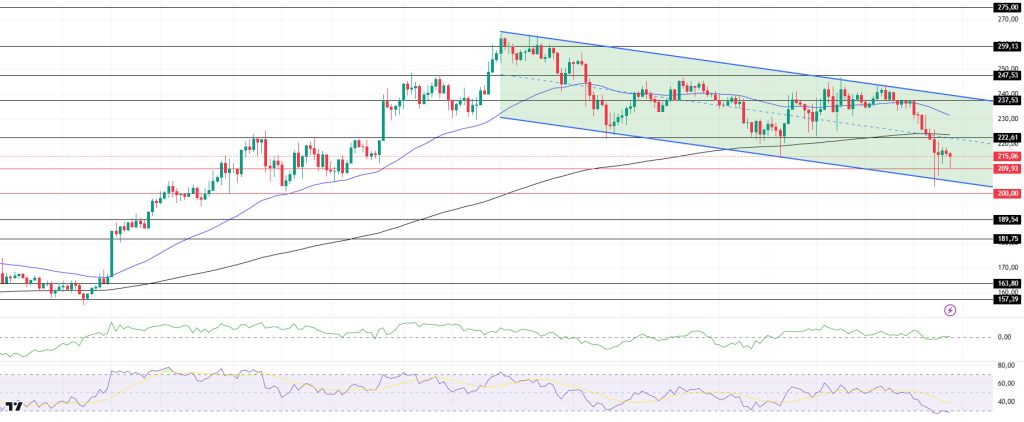
On the 4-hour timeframe, the 50 EMA (Blue Line) is above the 200 EMA (Black Line). Since November 22, the asset has been in a downtrend, losing about 6.20% of its value in the last 24 hours, keeping pace with the depreciation in the market. This movement caused the price to hit the support level of the channel. Although there was an upward acceleration from the support level, momentum started to fall again. When we examine the Chaikin Money Flow (CMF)20 indicator, we see that money inflows are also declining. This can be shown as a downward signal. However, Relative Strength Index (RSI)14 has accelerated towards the overbought zone. On the other hand, the gap between the 50 EMA and the 200 EMA closed. This may push the asset’s value lower. The 237.53 level stands out as a very strong resistance point in the uptrend driven by both the upcoming macroeconomic data and the news in the Solana ecosystem. If it breaks here, the rise may continue. In case of retracements for the opposite reasons or due to profit sales, the support levels of 189.54 and 181.75 can be triggered again. If the price hits these support levels, a potential bullish opportunity may arise if momentum increases.
Supports 209.93 – 200.00 – 189.54
Resistances 222.61 – 237.53 – 247.53
DOGE/USDT
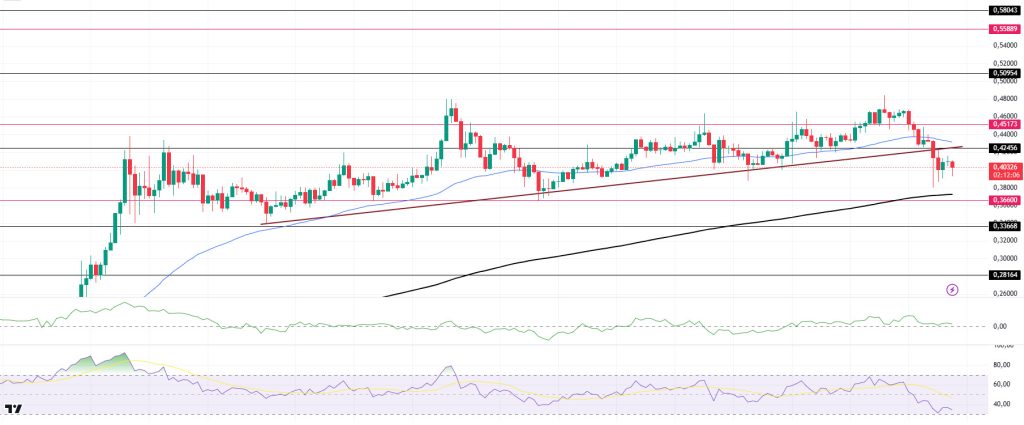
When we look at the chart, the asset, which has been in an uptrend since November 11, has started to move by breaking the trend downwards due to the usual pullback in the market yesterday. If this movement is strong, the 0.36600 level may be triggered. On the 4-hour timeframe, the 50 EMA (Blue Line) is above the 200 EMA (Black Line). On the other hand, when we look at the RSI 14 indicator, it seems to be positioned in the overbought zone. However, when we examine the Chaikin Money Flow (CMF)20 indicator, it is seen that there is a small amount of money inflows. The 0.50954 level appears to be a very strong resistance place in the rises driven by both the upcoming macroeconomic data and the innovations in the Doge coin. If DOGE maintains its momentum and rises above this level, the rise may continue strongly. In case of possible retracements due to macroeconomic reasons or negativities in the ecosystem, the 0.36600 support level is an important support level. If the price reaches these support levels, a potential bullish opportunity may arise if momentum increases.
Supports 0.36600 – 0.33668 – 0.28164
Resistances 0.42456 – 0.45173 – 0.50954
LEGAL NOTICE
The investment information, comments and recommendations contained herein do not constitute investment advice. Investment advisory services are provided individually by authorized institutions taking into account the risk and return preferences of individuals. The comments and recommendations contained herein are of a general nature. These recommendations may not be suitable for your financial situation and risk and return preferences. Therefore, making an investment decision based solely on the information contained herein may not produce results in line with your expectations.


