MARKET SUMMARY
Latest Situation in Crypto Assets
| Assets | Last Price | 24h Change | Dominance | Market Cap. |
|---|---|---|---|---|
| BTC | 98,644.97 | 0.75% | 55.33% | 1,95 T |
| ETH | 3,740.55 | 0.87% | 12.77% | 450,53 B |
| XRP | 2.375 | 9.25% | 3.86% | 136,22 B |
| SOLANA | 226.43 | 5.52% | 3.07% | 108,18 B |
| DOGE | 0.4050 | 0.77% | 1.69% | 59,76 B |
| CARDANO | 1.0766 | 7.87% | 1.07% | 37,89 B |
| TRX | 0.2786 | 3.51% | 0.68% | 24,12 B |
| AVAX | 46.29 | 3.03% | 0.54% | 19,01 B |
| SHIB | 0.00002804 | 4.96% | 0.47% | 16,60 B |
| LINK | 23.37 | 2.63% | 0.42% | 14,65 B |
| DOT | 9.010 | 7.16% | 0.39% | 13,77 B |
*Prepared on 12.11.2024 at 14:00 (UTC)
WHAT’S LEFT BEHIND
US, Consumer Price Index (CPI) Announced
Announced: 2.7%, Expected: 2.7% , Previous: 2.6
FTX borrowers recover $14.5 million in assets through payment of political contributions
FTX borrowers recovered approximately $14.5 million in assets through the settlement of political donations in November. The funds were recovered from the House Majority PAC ($6 million), the Senate Majority PAC ($3 million), and organizations such as the Forward Action Fund, Mind the Gap, People for the American Way, and more than $1 million each.
MicroStrategy expects to join the Nasdaq-100 index on December 23
MicroStrategy is expected to be included in the Nasdaq-100 index on December 23, Crypto Briefing reported. It was reported that the official announcement will be made on Friday, December 13. Bloomberg ETF analyst James Seyffart explained that ETFs tracking the Nasdaq-100 are expected to buy about $2.1 billion worth of MicroStrategy shares. Analyst Eric Balchunas stated that the company’s weight in the index could reach 0.47% and rank among the top 40 holdings.
HIGHLIGHTS OF THE DAY
Important Economic Calender Data
*There is no important calendar data for the rest of the day.
INFORMATION
*The calendar is based on UTC (Coordinated Universal Time) time zone.
The economic calendar content on the relevant page is obtained from reliable news and data providers. The news in the economic calendar content, the date and time of the announcement of the news, possible changes in the previous, expectations and announced figures are made by the data provider institutions. Darkex cannot be held responsible for possible changes that may arise from similar situations.
MARKET COMPASS
The latest Consumer Price Index (CPI) data, released ahead of the Federal Open Market Committee (FOMC) meeting next week, came in line with market expectations and did not surprise, pointing to a positive opening for Wall Street indices. European indices have a similar outlook for the day.
Following the release of CPI data, we saw a decline in the dollar index and an increase in the probability of a 25 bps rate cut by the FOMC (according to the CME FED Watch Tool). Major digital assets continued to rebound after yesterday’s sharp moves during European trading. While the FOMC rate cut is now almost certain, we think this trend may continue for the rest of the day.
From the short term to the big picture…
The victory of former President Trump on November 5, which was one of the main pillars of our bullish expectation for the long-term outlook in digital assets, produced a result in line with our predictions. Afterwards, the appointments made by the president-elect and the expectations of increased regulation of the crypto ecosystem in the US continued to take place in our equation as a positive variable. Although Powell gave cautious messages in his last speech, the continuation of the FED’s interest rate cut cycle and the volume in BTC ETFs indicating an increase in institutional investor interest (in addition to MicroStrategy’s BTC purchases, BlackRock’s BTC ETF options started trading…) support our upward forecast for the big picture for now.
In the short term, given the nature of the market and pricing behavior, we think it would not be surprising to see occasional pauses or pullbacks in digital assets. However, at this point, it is worth emphasizing again that the fundamental dynamics continue to be bullish.
TECHNICAL ANALYSIS
BTC/USDT
Before the FED interest rate meeting, US Inflation data was announced as 2.7% within expectations. Inflation data in line with expectations may give us an important message about the path the FED will follow on the interest rate cut policy. After the inflation data, it is seen that the FED’s 25 basis point interest rate cut expectation is 87%.
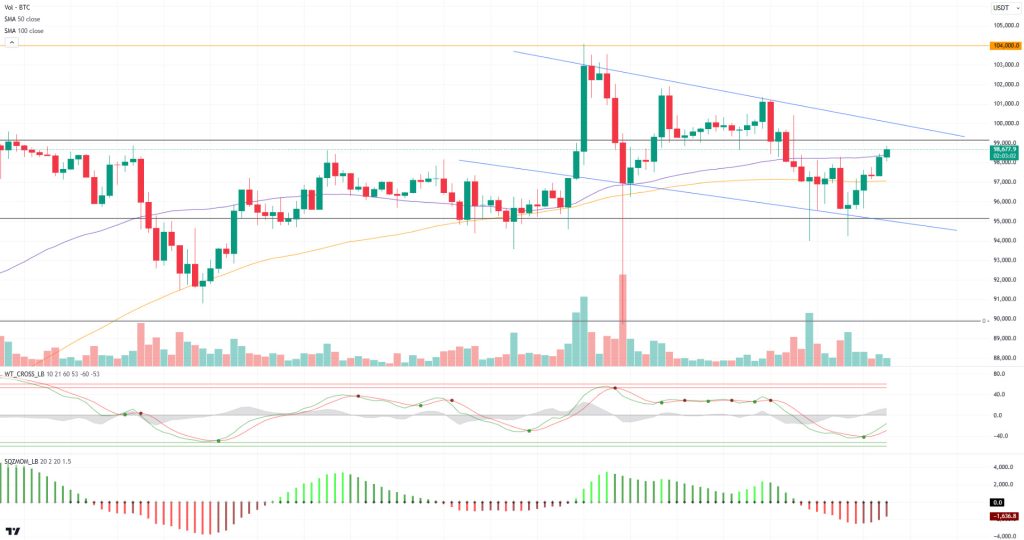
When we look at the technical outlook after the macroeconomic data, the price, which moved at the 50-day SMA line before the inflation data, broke through this line and rose to 98,850. BTC, which is trading within the minor downtrend channel, may need to cross six-digit levels to recapture the uptrend. Currently trading at 98,600, BTC technical oscillators continue to maintain a buy signal, while the momentum indicator is gaining strength in the negative territory. In the continuation of the uptrend, the upward momentum may gain strength by first exceeding the resistance level of 99,140. In case of a possible pullback, the SMA 50 and 100-day lines serve as support, while the 95,000 point appears as an important support zone in case of a loss.
Supports 95,000 – 92,750 – 90,000
Resistances 97,200 – 99,140 – 100,000
ETH/USDT
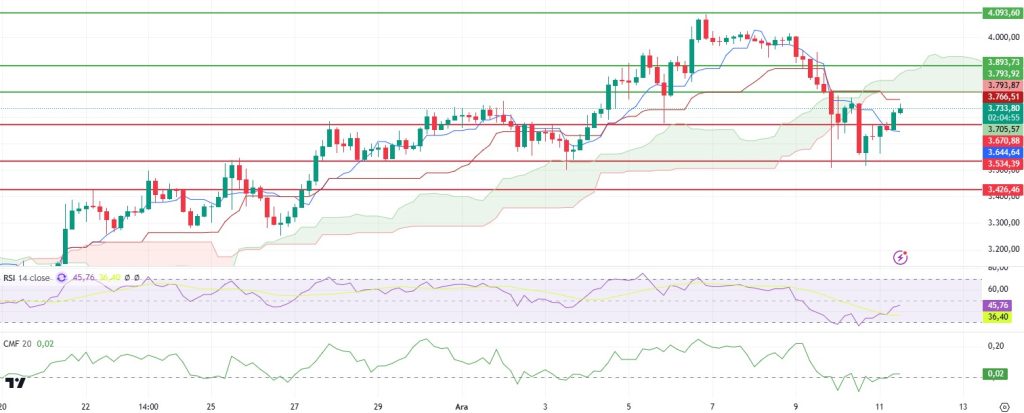
ETH managed to hold above the 3,670 level in line with expectations during the day and is approaching the 3,770 level by maintaining its upward momentum. The US inflation data coming in line with expectations was an important factor supporting this rise.
Technical indicators also present a positive picture. Relative Strength Index (RSI) turned upwards after forming a double bottom pattern in oversold territory, contributing positively to the price action. Chaikin Money Flow (CMF) has turned positive, indicating that capital inflows are continuing. Kumo Cloud’s lower band has been hovering at 3.793 for a long time, indicating that this area is a critical resistance point.
ETH’s reaction when it approaches the 3,793 level will be critical in determining the short-term direction. However, based on the current indicators, the price seems to have a high potential to continue its upward movement. On the other hand, closes below 3,670 could lead to a loss of momentum, causing the price to fall as low as 3,534. Therefore, it is important to closely monitor the support and resistance levels.
Supports 3,670 – 3,534 – 3,426
Resistances 3,793 – 3,893 – 4,093
XRP/USDT
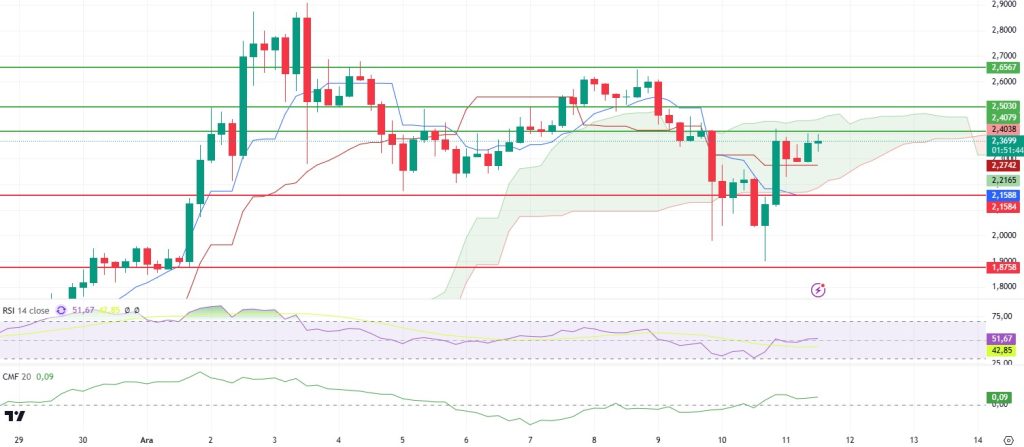
XRP rebounded after receiving official approval from the New York Department of Financial Services (NYDFS) for the RLUSD stablecoin and entered the boundaries of the kumo cloud. However, the price paused at the critical resistance point at 2.41 and started to move sideways.
Technical indicators show that the negative divergence on the Relative Strength Index (RSI) continues. On the other hand, the Chaikin Money Flow (CMF) indicator maintains its positive outlook after the rally.
It can be said that the most critical decision zone for XRP is between the 2.41 resistance level and the 2.50 level at the upper limit of the kumo cloud. An upside breakout of this area could support a continuation of the uptrend. However, if it fails to hold in this zone and retreats, the price is likely to face the risk of falling towards the 2.15 levels.
Supports 2.1982 – 1. 8758- 1. 6160
Resistances 2.4079 – 2.5030 – 2.6567
SOL/USDT
The funding ratio for Solana has dropped 81% in the last 48 hours, signaling a worsening of the bullish trend. Although the funding rate for SOL remained positive, the rapid decline was noteworthy. Solana’s active addresses, a key indicator of user engagement, fell to the lowest point in December, further reinforcing concerns that interest is waning. This decline in user activity could further weaken Solana’s market position. Without a revival in user activity, pressure on Solana’s price may continue.
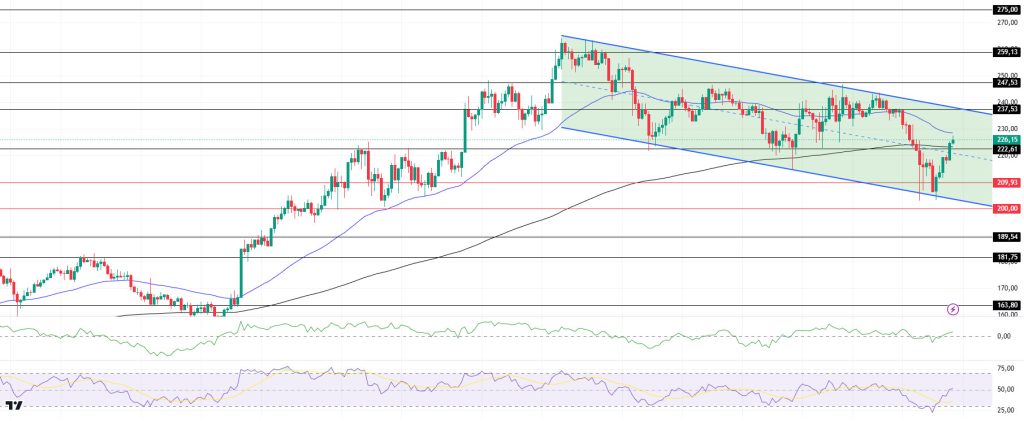
Technically, the asset, which has been in a downtrend since November 22, has kept pace with the depreciation in the market, causing the price to reach the support level of the channel. On the 4-hour timeframe, the 50 EMA (Blue Line) is above the 200 EMA (Black Line). Although there was an upward momentum from the support level, volume started to fall again. When we examine the Chaikin Money Flow (CMF)20 indicator, it is seen that there is an increase in money inflows. This can be shown as an upward signal. However, Relative Strength Index (RSI)14 is in the neutral zone. On the other hand, the difference between the 50 EMA and the 200 EMA closed. This may push the asset’s value lower. The 237.53 level stands out as a very strong resistance point in the uptrend driven by both the upcoming macroeconomic data and the news in the Solana ecosystem. If it breaks here, the rise may continue. In case of retracements for the opposite reasons or due to profit sales, the support levels of 189.54 and 181.75 can be triggered again. If the price hits these support levels, a potential bullish opportunity may arise if momentum increases.
Supports 222.61 – 209.93 – 200.00
Resistances 237.53 – 247.53 – 259.13
DOGE/USDT
Elon Musk recently hinted that the Department of Government Efficiency (D.O.G.E.) could help end inflationary pressure in the US. The Tesla CEO also shared the root causes behind US inflation. The newly established department aims to reduce Federal IT spending on outdated systems. On the onchain side, Dogecoin’s Open Interest (OI) reached an all-time high of $4.45 billion on December 9 after tripling in less than a month amid increased speculative interest in memecoin. However, over the past two days, OI has fallen by more than $1.5 billion to $2.95 billion at the time of writing. The declining OI suggests that investors are closing their positions on Dogecoin.
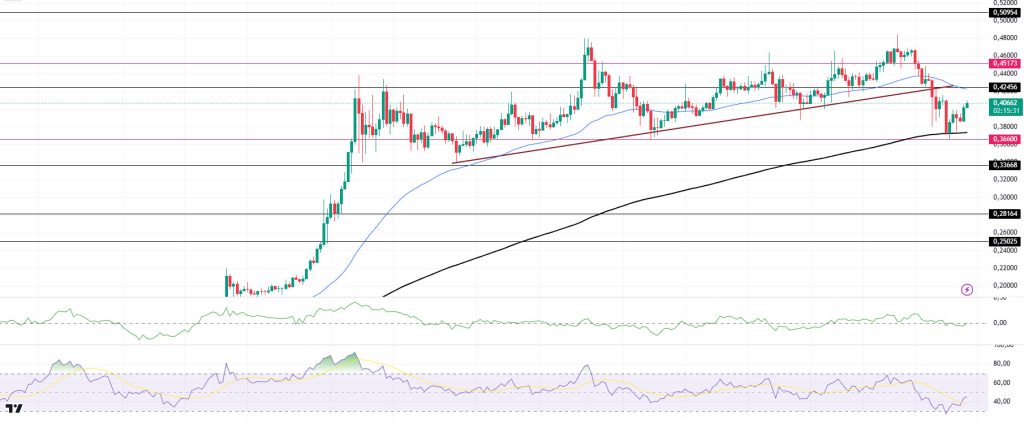
When we look at the chart, the asset, which has been in an uptrend since November 11, has started to move by breaking the trend downwards due to the usual pullback in the market. Since this movement was strong, it triggered the 0.36600 level and received support from both this level and the 200 EMA (Black Line) and started to rise. On the 4-hour timeframe, the 50 EMA (Blue Line) is above the 200 EMA (Black Line). On the other hand, when we look at the RSI 14 indicator, it has accelerated from the overbought zone to the neutral level. However, when we examine the Chaikin Money Flow (CMF)20 indicator, it maintains its neutrality, albeit with a small amount of money inflows. The 0.50954 level stands out as a very strong resistance level in the rises driven by both the upcoming macroeconomic data and the innovations in the Doge coin. If DOGE maintains its momentum and rises above this level, the rise may continue strongly. In case of possible retracements due to macroeconomic reasons or negativities in the ecosystem, the 0.33668 support level is an important support level. If the price reaches these support levels, a potential bullish opportunity may arise if momentum increases.
Supports 0.36600 – 0.33668 – 0.28164
Resistances 0.42456 – 0.45173 – 0.50954
LEGAL NOTICE
The investment information, comments and recommendations contained herein do not constitute investment advice. Investment advisory services are provided individually by authorized institutions taking into account the risk and return preferences of individuals. The comments and recommendations contained herein are of a general nature. These recommendations may not be suitable for your financial situation and risk and return preferences. Therefore, making an investment decision based solely on the information contained herein may not produce results in line with your expectations.


