
MARKET SUMMARY
Latest Situation in Crypto Assets
| Assets | Last Price | 24h Change | Dominance | Market Cap. |
|---|---|---|---|---|
| BTC | 101,086.93 | 2.52% | 54.98% | 2,00 T |
| ETH | 3,947.29 | 5.56% | 13.02% | 474,22 B |
| XRP | 2.417 | 1.72% | 3.79% | 137,80 B |
| SOLANA | 230.42 | 1.79% | 3.03% | 110,21 B |
| DOGE | 0.4117 | 1.73% | 1.67% | 60,57 B |
| CARDANO | 1.136 | 5.47% | 1.10% | 39,90 B |
| TRX | 0.2988 | 7.35% | 0.71% | 25,79 B |
| AVAX | 51.13 | 10.39% | 0.58% | 20,99 B |
| LINK | 27.83 | 18.80% | 0.48% | 17,34 B |
| SHIB | 0.00002875 | 2.42% | 0.47% | 16,99 B |
| DOT | 9.178 | 1.40% | 0.39% | 14,05 B |
*Prepared on 12.12.2024 at 14:00 (UTC)
WHAT’S LEFT BEHIND
US Producer Price Index (PPI) was announced.
Announced: 3%, Expected: 2.6%, Previous: 2.6
US Applications for Unemployment Benefits were announced.
Announced: 242K, Expected: 220K, Previous: 224K
Trump named Person of the Year 2024 and featured on the cover of Time magazine
US President-elect Donald Trump has been named the 2024 Person of the Year, according to Time magazine. The photo shoot for Time’s famous cover was held at Trump’s private club at Mar-a-Lago. The shoot was conducted by photographer Platon, who has previously taken portraits of leaders such as Barack Obama and Vladimir Putin.
MicroStrategy’s Bitcoin strategy launches a follow-up with 144 companies holding Bitcoin
MicroStrategy holds a total of 423,600 BTC worth approximately $42 billion through convertible bonds and equity financing. This is equivalent to 2% of the total Bitcoin supply. The strategy has boosted the company’s share price 30 times since August 2020. According to BitcoinTreasuries, about 144 companies already hold Bitcoin on their balance sheets.
DOGE executives Elon Musk and Vivek Ramaswamy slam SEC
Elon Musk and Vivek Ramaswamy, leaders of the newly formed organization DOGE, have sharply criticized the SEC for its crackdown on the crypto world over the past two years. In tweets, they said that the SEC has violated the law and is losing its legitimacy.
HIGHLIGHTS OF THE DAY
Important Economic Calender Data
*There is no important calendar data for the rest of the day.
INFORMATION:
*The calendar is based on UTC (Coordinated Universal Time) time zone. The economic calendar content on the relevant page is obtained from reliable news and data providers. The news in the economic calendar content, the date and time of the announcement of the news, possible changes in the previous, expectations and announced figures are made by the data provider institutions. Darkex cannot be held responsible for possible changes that may arise from similar situations.
MARKET COMPASS
While digital assets, which had a relatively calm session, tried to maintain their recent gains, news from the European and US fronts were under the scrutiny of investors. Swiss and European Central Banks cut interest rates. In the US, weekly jobless claims and the monthly producer price index (PPI) for the November period were realized above the forecasts. There was no major change in expectations that the US Federal Reserve (FED) will cut its policy rate by 25 basis points at its meeting next week.
Although flat, European stock markets are holding in positive territory while Wall Street futures are pointing to a negative opening. The dollar declined after the macro indicators released and the country’s treasury bond yields had a similar effect. Later in the day, digital assets may lack a catalyst for a new rise and short-term pullbacks may be observed. However, we do not expect this to be too deep for now. Afterwards, there may be grounds for a recovery, in line with our longer-term views below.
From the short term to the big picture….
The victory of former President Trump on November 5, which was one of the main pillars of our bullish expectation for the long-term outlook in digital assets, produced a result in line with our predictions. Afterwards, the appointments made by the president-elect and the expectations of increased regulation of the crypto ecosystem in the US continued to take place in our equation as a positive variable. Although Powell gave cautious messages in his last speech, the continuation of the FED’s interest rate cut cycle and the volume in BTC ETFs indicating an increase in institutional investor interest (in addition to MicroStrategy’s BTC purchases, BlackRock’s BTC ETF options started trading…) support our upward forecast for the big picture for now.
In the short term, given the nature of the market and pricing behavior, we think it would not be surprising to see occasional pauses or pullbacks in digital assets. However, at this point, it is worth emphasizing again that the fundamental dynamics continue to be bullish.
TECHNICAL ANALYSIS
BTC/USDT
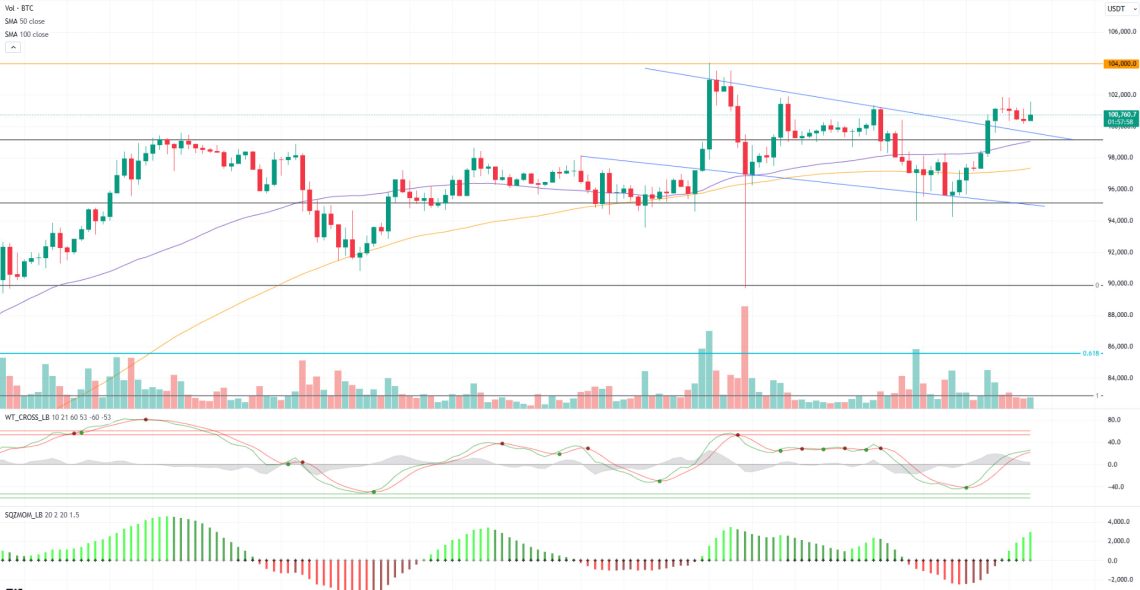
US macroeconomic data was announced. US Producer Price Index (PPI) data was announced as 3%, slightly above expectations, while unemployment claims were announced as 242 thousand against 220 thousand expectations. With yesterday’s inflation data and the data released today before the FED interest rate meeting, the market’s expectation for a 25 basis point rate cut is at 98%, which clearly reveals the market’s expectation for a rate cut.
When we look at the technical outlook after all this data, BTC, which broke the falling minor trend structure upwards, is currently trading at 101,000. The persistence above the 100,000 level, which we mentioned in the previous analysis, can be seen as positive in BTC and may bring a new ATH attempt. When we look at the technical oscillators, the hourly charts continue to maintain the buy signal, while the momentum indicator is gaining strength in the positive zone. While the 104,000 level is expected to be exceeded in the continuation of the rise, our trend upper line may serve as support in a possible pullback.
Supports 99,140 – 97,200 – 95,000
Resistances 102,450 – 103,500 – 104,000
ETH/USDT
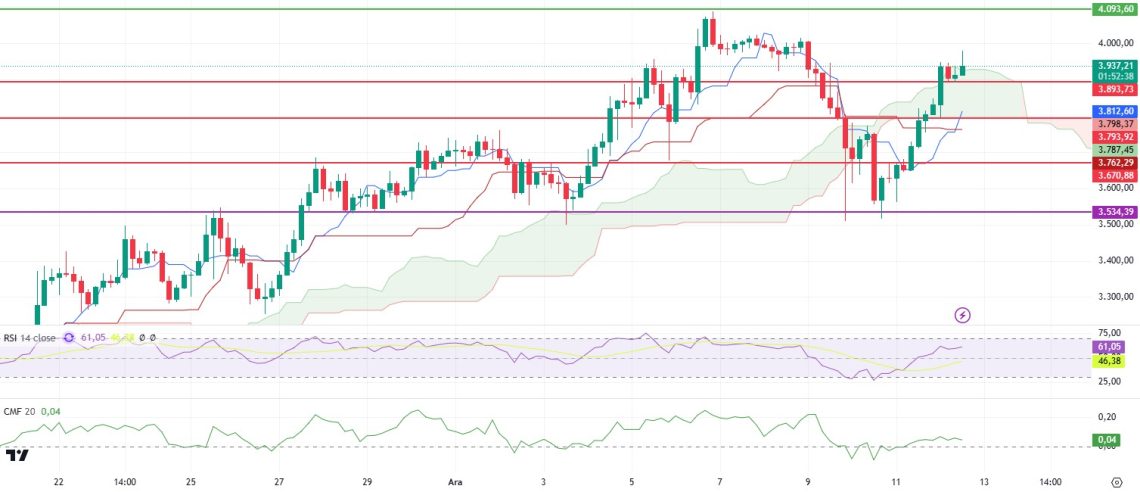
Ethereum is showing a positive outlook, rising above the critical threshold of 3,893 with yesterday’s and morning’s rally. ETH, which continues to hold above this level, is notable for a notable increase in onchain activity. Compared to the past months, volume increases in bluechip NFT collections with high market capitalization and Layer 2 (L2) networks have had a positive impact on the ETH price.
The Ichimoku indicator is pointing to a strong bullish bias with a clear buy signal. As highlighted in the morning analysis, the intersection of the Tenkan and Kijun lines and the rise of the price above the Kumo cloud support a technically positive picture. The Cumulative Volume Delta (CVD) spot metric shows that the spot market continues to rise, while the funding rate does not show an excessive increase, which makes this rise healthy. Additionally, positive trends on Relative Strength Index (RSI) and Chaikin Money Flow (CMF) are also noteworthy.
If
ETH continues to hold above the
3,893 level, it may signal that the uptrend will continue. However, if this level is broken to the downside, there is a risk that the price may retreat to 3,793 levels. Therefore, it is critical to closely monitor the movement at current levels.
Supports 3,893 – 3,793 – 3,670
Resistances 4,093 – 4,299 – 4,440
XRP/USDT
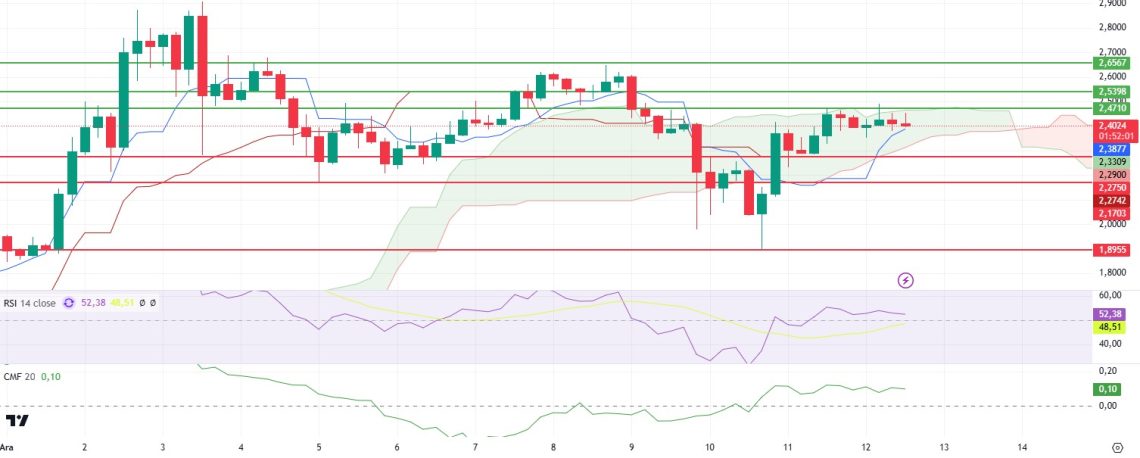
Although XRP has managed to rise up to 2.47 levels with the recent positive developments, it is struggling to break through this critical resistance level. This region also stands out as an important technical threshold as it coincides with the upper resistance level of the kumo cloud on the Ichimoku indicator.
The sideways movement of the price is also accompanied by the Relative Strength Index (RSI), which is pointing to a neutral zone. Similarly, the Chaikin Money Flow (CMF) indicator continues to move sideways at 0.1, indicating that capital inflows in the market are limited.
The decrease in momentum and trading volume suggests that XRP may exhibit a sideways or slightly bearish trend in the short term. This suggests that investors are monitoring market conditions and looking for a new direction.
If XRP breaks the 2.47 level, it could create strong buying pressure on the price and trigger the start of a new uptrend. However, if it continues to stay below this level, the price is likely to move in a sideways band or pull back somewhat. Therefore, movements towards the 2.47 resistance should be closely monitored. A possible breakout could create opportunities for investors. However, weak volume and momentum suggest that a cautious stance may be beneficial.
Supports 2.2750 – 1.1703- 1.8955
Resistances 2.4710 – 2.5398 – 2.6567
SOL/USDT
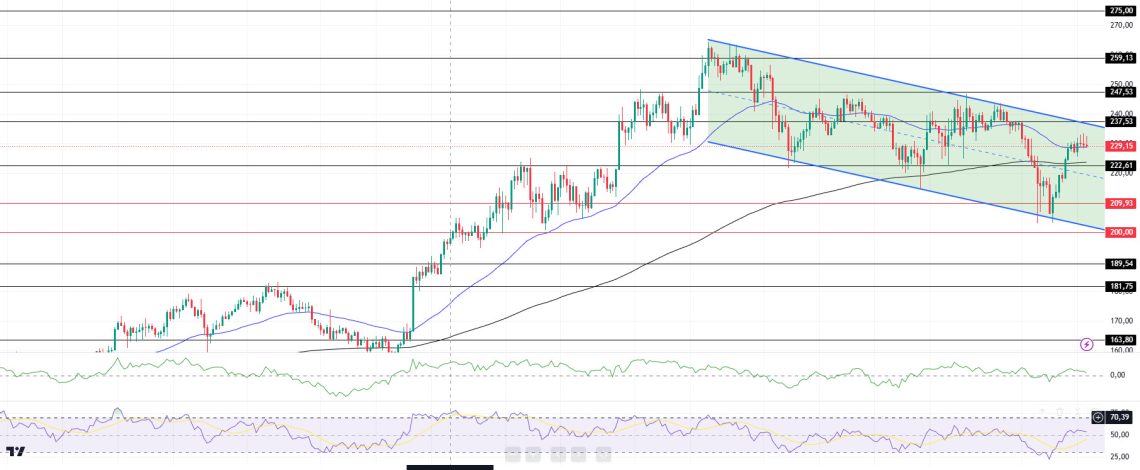
On the 4-hour timeframe, the 50 EMA (Blue Line) is above the 200 EMA (Black Line). Although there is an upward acceleration from the support level, the volume has started to fall again. When we examine the Chaikin Money Flow (CMF)20 indicator, we see a decline in money inflows. This can be shown as a downward signal. However, Relative Strength Index (RSI)14 is accelerating from the neutral zone to the overbought zone. The 237.53 level stands out as a very strong resistance point in the rises driven by both the upcoming macroeconomic data and the news in the Solana ecosystem. If it breaks here, the rise may continue. In case of retracements for the opposite reasons or due to profit sales, the support levels of 189.54 and 181.75 can be triggered again. If the price hits these support levels, a potential bullish opportunity may arise if momentum increases.
Supports 222.61 – 209.93 – 200.00
Resistances 237.53 – 247.53 – 259.13
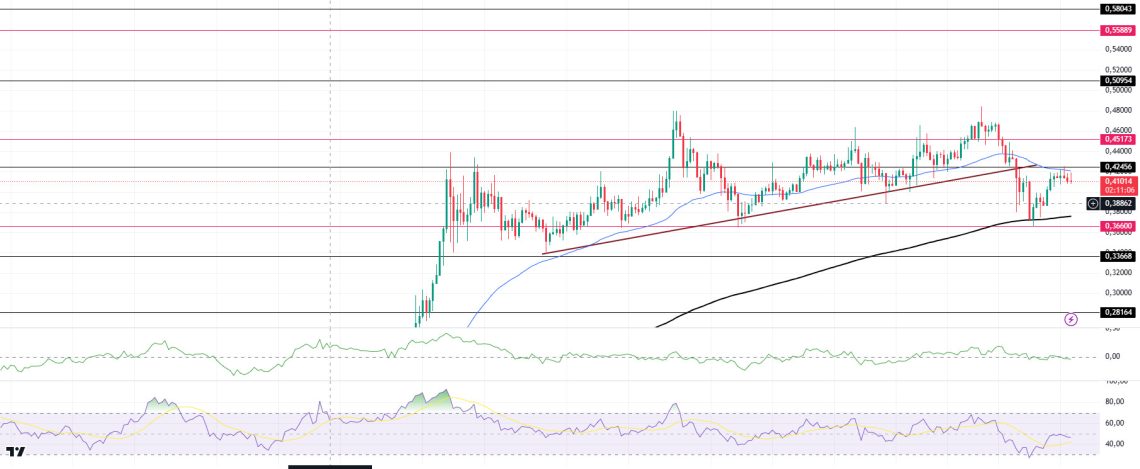
DOGE/USDT
A hacker exploited a critical vulnerability in the Dogecoin network, causing 69% of nodes to crash. During the day, Andreas Kohl, co-founder of Bitcoin sidechain Sequentia, claimed to have crashed 69% of the Dogecoin network. On the other hand, Dogecoin (DOGE) Foundation Director Marshall Hayner announced the launch of the DOGE DAO Dashboard via a post on the X platform.
When we look at the chart, the asset, which has been in an uptrend since November 11, has started to move by breaking the trend downwards due to the usual pullback in the market, but the uptrend seems to have started again. Since this movement was strong, it tested the 0.42456 level and saw resistance from both this level and the 50 EMA (Blue Line) and lost some momentum. On the 4-hour timeframe, the 50 EMA (Blue Line) is above the 200 EMA (Black Line). On the other hand, when we look at the RSI 14 indicator, it has accelerated from the overbought zone to the neutral level. However, when we examine the Chaikin Money Flow (CMF)20 indicator, it maintains its neutrality, although there is a little money outflows. The 0.50954 level appears as a very strong resistance level in the rises driven by both the upcoming macroeconomic data and the innovations in the Doge coin. If DOGE maintains its momentum and rises above this level, the rise may continue strongly. In case of possible retracements due to macroeconomic reasons or negativities in the ecosystem, the 0.33668 support level is an important support level. If the price reaches these support levels, a potential bullish opportunity may arise if momentum increases.
Supports 0.36600 – 0.33668 – 0.28164
Resistances 0.42456 – 0.45173 – 0.50954
LEGAL NOTICE
The investment information, comments and recommendations contained herein do not constitute investment advice. Investment advisory services are provided individually by authorized institutions taking into account the risk and return preferences of individuals. The comments and recommendations contained herein are of a general nature. These recommendations may not be suitable for your financial situation and risk and return preferences. Therefore, making an investment decision based solely on the information contained herein may not produce results in line with your expectations.
