MARKET SUMMARY
Latest Situation in Crypto Assets
| Assets | Last Price | 24h Change | Dominance | Market Cap |
|---|---|---|---|---|
| BTC | 94,995.57 | -1.99% | 57.37% | 1,88 T |
| ETH | 3,309.72 | -1.81% | 12.17% | 399,28 B |
| XRP | 2.177 | -3.93% | 3.80% | 124,66 B |
| SOLANA | 182.05 | -1.92% | 2.66% | 87,29 B |
| DOGE | 0.3106 | -2.96% | 1.40% | 45,82 B |
| CARDANO | 0.8793 | -3.26% | 0.94% | 30,94 B |
| TRX | 0.2482 | -0.37% | 0.65% | 21,41 B |
| AVAX | 36.27 | -4.28% | 0.45% | 14,90 B |
| LINK | 22.66 | 1.19% | 0.44% | 14,47 B |
| SHIB | 0.00002148 | -1.82% | 0.39% | 12,66 B |
| DOT | 6.906 | -2.10% | 0.32% | 10,60 B |
*Prepared on 12.23.2024 at 14:00 (UTC)
WHAT’S LEFT BEHIND
MicroStrategy Buys Bitcoin for the 7th Week in a Row
MicroStrategy has continued to buy Bitcoin every Monday since November 11, purchasing 5,262 BTC between December 15-22. While the average purchase was $106,000, the company’s total Bitcoin reserve reached 444,262 units.
Metaplanet: “The Japanese Version of MicroStrategy”
Japan-based Metaplanet is pursuing a strategy to increase its Bitcoin reserves by issuing zero-interest bonds. The company has bought more than 1,000 BTC since May 2024. Its share price has risen 2,450% since the beginning of the year.
Telegram’s Revenue Exceeds $1 Billion
Telegram announced that it turned a profit for the first time in 2024. With premium subscriptions exceeding 12 million and advertising revenue increasing, total revenue exceeded $1 billion, while year-end cash reserves exceeded $500 million.
Phoenix Group Plans to List on US NASDAQ
Phoenix Group, listed on the Abu Dhabi Securities Exchange, is targeting a dual listing on NASDAQ in 2025. The company is the first publicly traded crypto and blockchain organization in the Middle East.
VanEck: US Bitcoin Reserves Could Reduce Debt
VanEck predicts that if the US builds a reserve of 1 million BTC, the national debt could be reduced by 35% by 2049. Bitcoin’s CAGR is projected to reach 25%, pushing its price to $42.3 million.
HIGHLIGHTS OF THE DAY
Important Economic Calender Data
Time News Expectation Previous
15:00 US CB Consumer Confidence (Dec) 112.9 111.7
INFORMATION
*The calendar is based on UTC (Coordinated Universal Time) time zone.
The economic calendar content on the relevant page is obtained from reliable news and data providers. The news in the economic calendar content, the date and time of the announcement of the news, possible changes in the previous, expectations and announced figures are made by the data provider institutions. Darkex cannot be held responsible for possible changes that may arise from similar situations
MARKET COMPASS
In the first trades of the week, which will be shortened by the Christmas holiday, we have typically seen volumes decline and prices remain flat. The most talked about fundamental dynamic continues to be the US Federal Reserve’s (FED) rate cut path for 2025. After the Bank’s last meeting, markets are pricing in two 25 basis point rate cuts. European stock markets and Wall Street index futures were mixed, flat and the dollar, which eased slightly after last week’s PCE Price Index, which fell below expectations with the partial shutdown of the US government averted, gained value and attracted attention. The consumer confidence index to be announced for the US later in the day will be under the spotlight.
Major digital assets continued to be under pressure, as we often noted in our analysis last week, despite brief rebounds. Although the Fed’s latest stance did not change the main dynamics of the equation, it caused the weights of these dynamics to shift. In line with this, expectations that financial conditions in the coming period will be slightly tighter than previously thought have led to a sell-off in cryptocurrencies and an exit from ETFs. Since we do not expect the pricing brought about by this trend to stabilize in a short period of time, we mentioned that the downward pressure in the short-term outlook may continue in our analysis under the assumption that the effect of this course will continue. However, we do not see enough reason to change our long-term expectation yet and underline that it is important to see the future process after Trump officially takes office on January 20.
From the short term to the big picture.
The victory of former President Trump on November 5, which was one of the main pillars of our bullish expectation for the long-term outlook in digital assets, produced a result in line with our predictions. Afterwards, the appointments made by the president-elect and the expectations of increased regulation of the crypto ecosystem in the US continued to be a positive variable in our equation. Although it is expected to continue at a slower pace, the FED’s signal that it will continue its interest rate cut cycle and the volume in BTC ETFs indicating an increase in institutional investor interest (in addition to MicroStrategy’s BTC purchases, BlackRock’s BTC ETF options start trading…) support our upward forecast for the big picture for now.
In the short term, given the nature of the market and pricing behavior, we think it would not be surprising to see occasional pauses or pullbacks in digital assets. However, at this point, it is worth emphasizing again that the fundamental dynamics continue to be bullish. After the FED’s recent announcements, we think that the declines, which have been realized with short-term recoveries and are still continuing, are in line with the market texture and are necessary for healthier potential rises for the long term.
TECHNICAL ANALYSIS
BTC/USDT
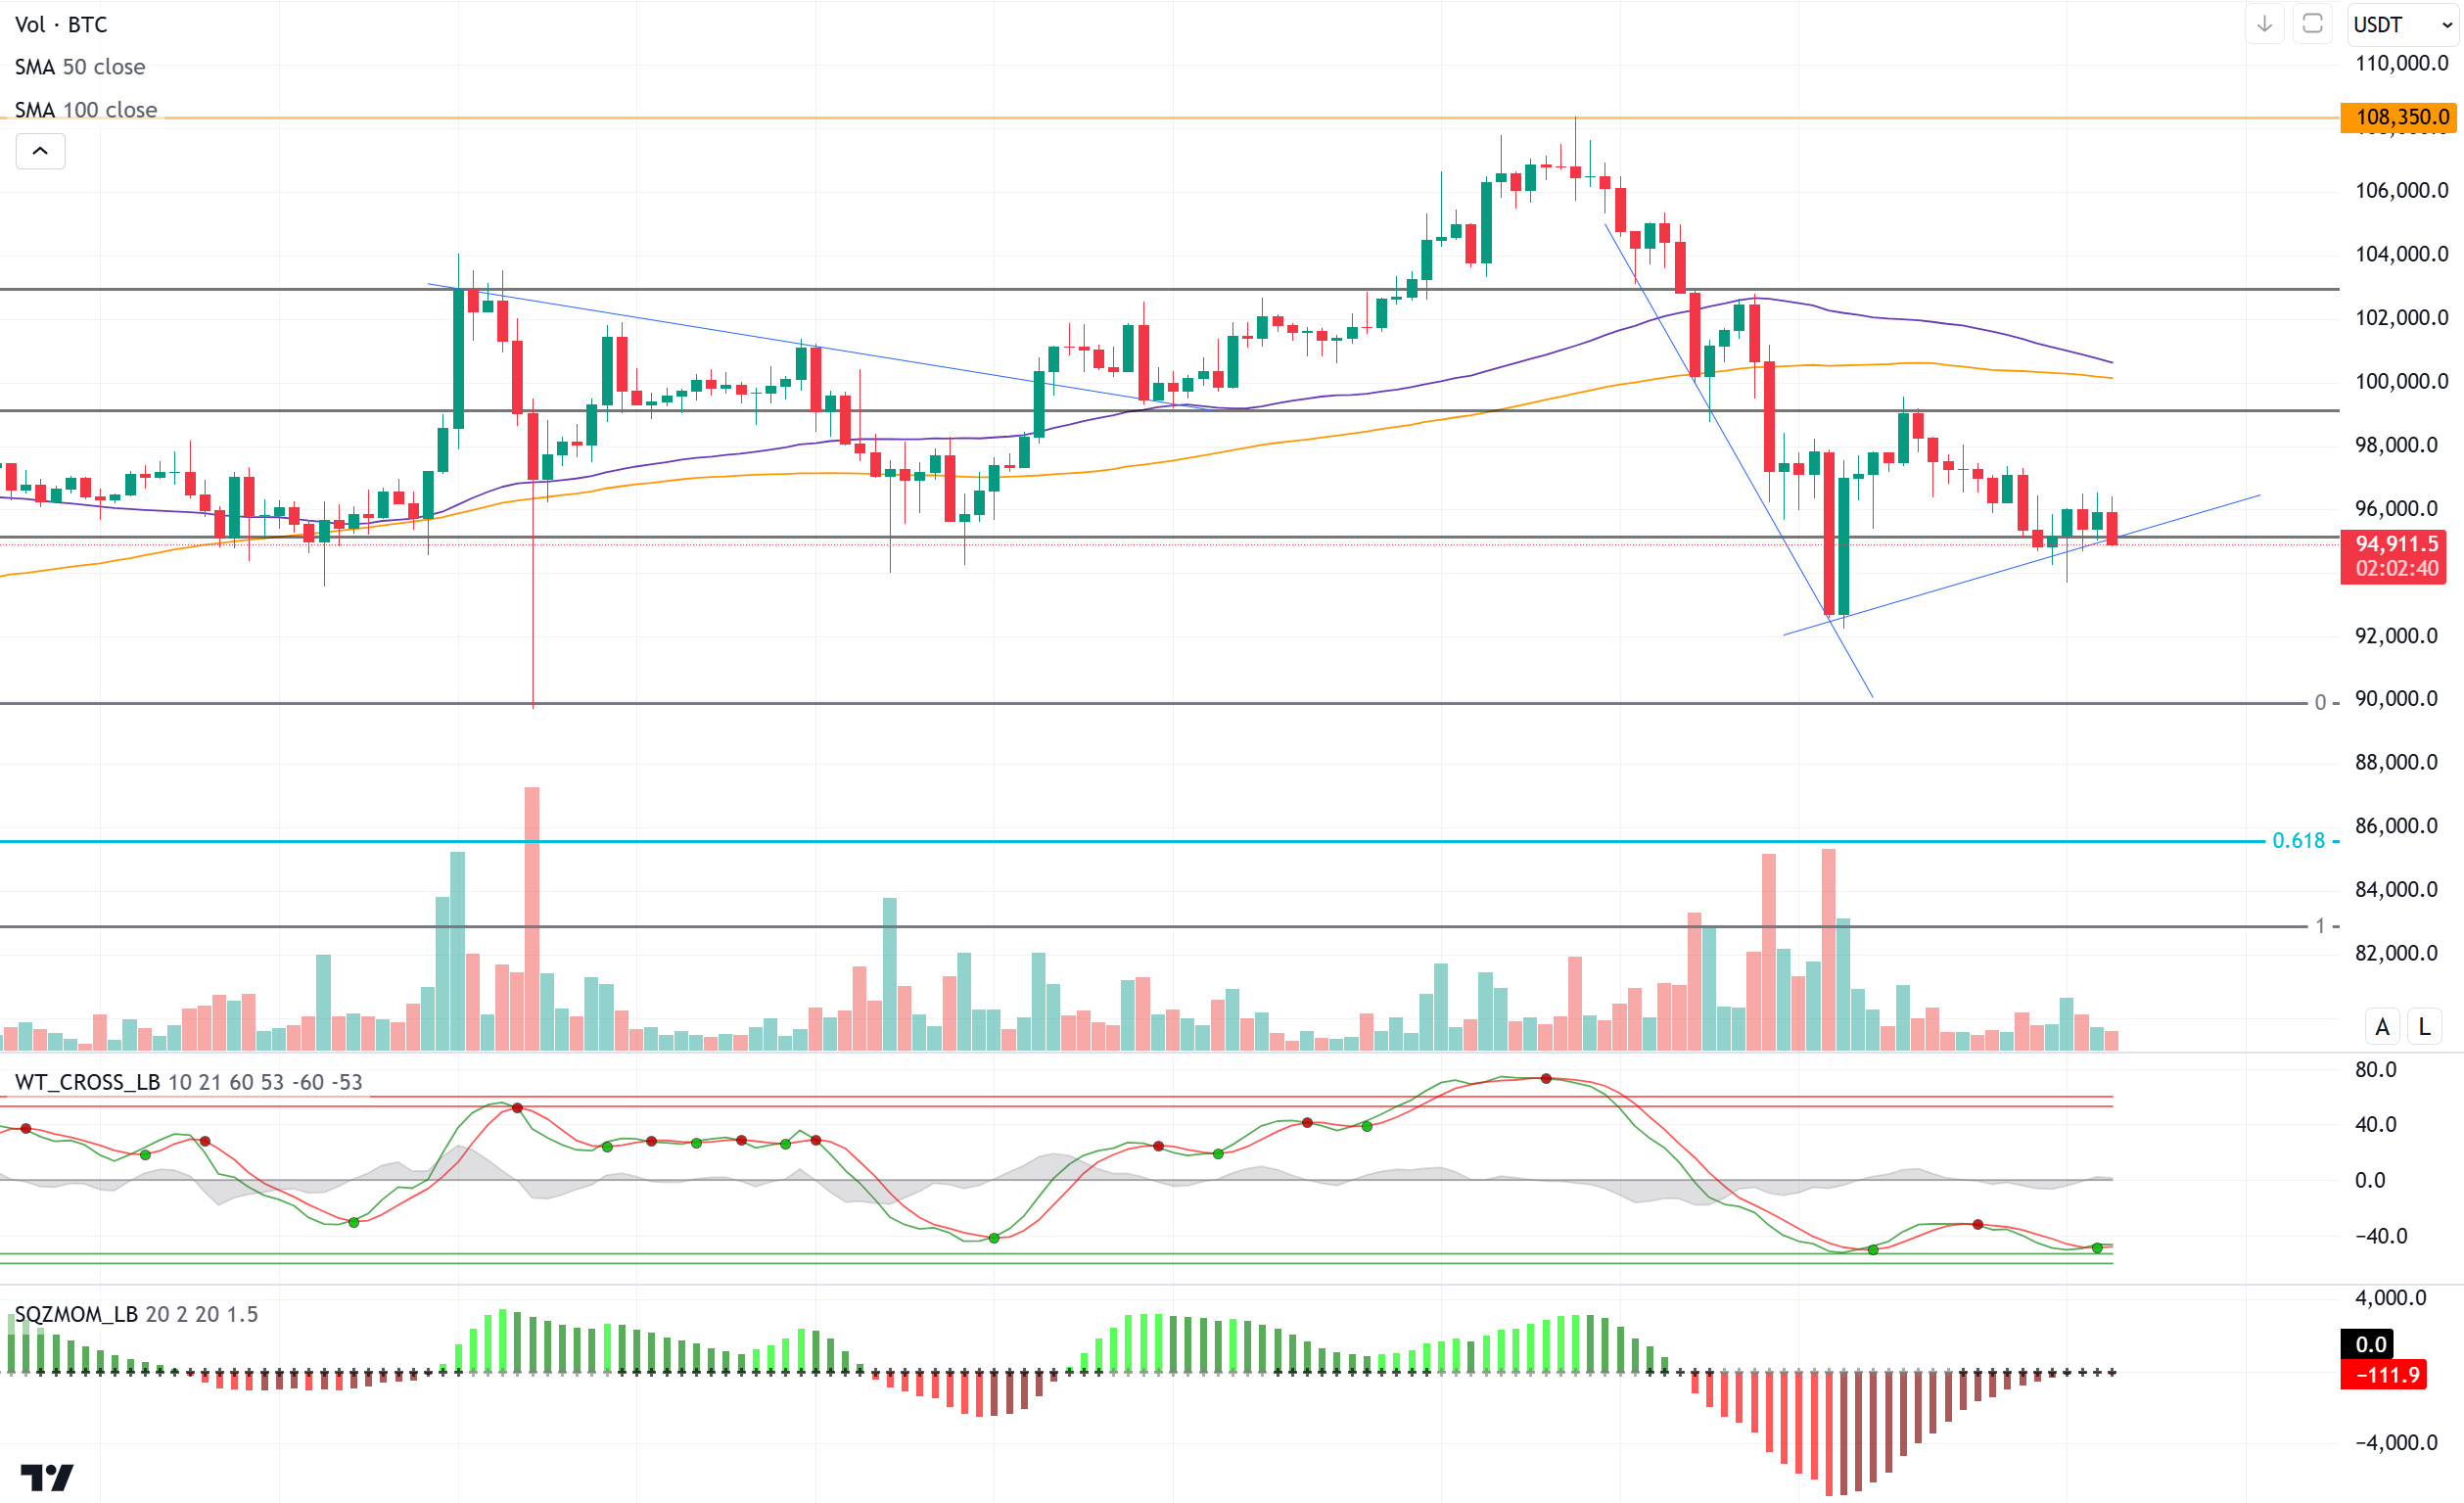
According to CoinShares’ latest weekly report data, last week saw net inflows of digital asset investment products total $308 million. However, a massive net outflow of $576 million was recorded in a single day on December 19, resulting in a total outflow of $1 billion over the weekend. Looking at the first day of the week, Microstategy continued its tradition of buying Bitcoin for the seventh week in a row. MicroStrategy; announced that it bought 5262 BTC with an average of 106 thousand purchases between December 15-22.
When we look at the technical outlook after the weekend with the latest developments, BTC, which rose to 96,000 in the morning hours, retreated again. BTC, which is currently trading at the critical support level of 95,000, is seen on hourly charts with our technical oscillator giving a buy signal. With our momentum indicator moving into the positive zone, it could trigger the start of an upward trend. In a possible pullback, closes below the 95,000 level may create a double bottom formation by allowing the price to test the 92,550 level again with selling pressure. Later in the week, low volatility can be observed in the BTC price as the US markets enter the Christmas holiday.
Supports 95,000 – 92,550 – 91,450
Resistances 97,200 – 98,000 – 99,100
ETH/USDT
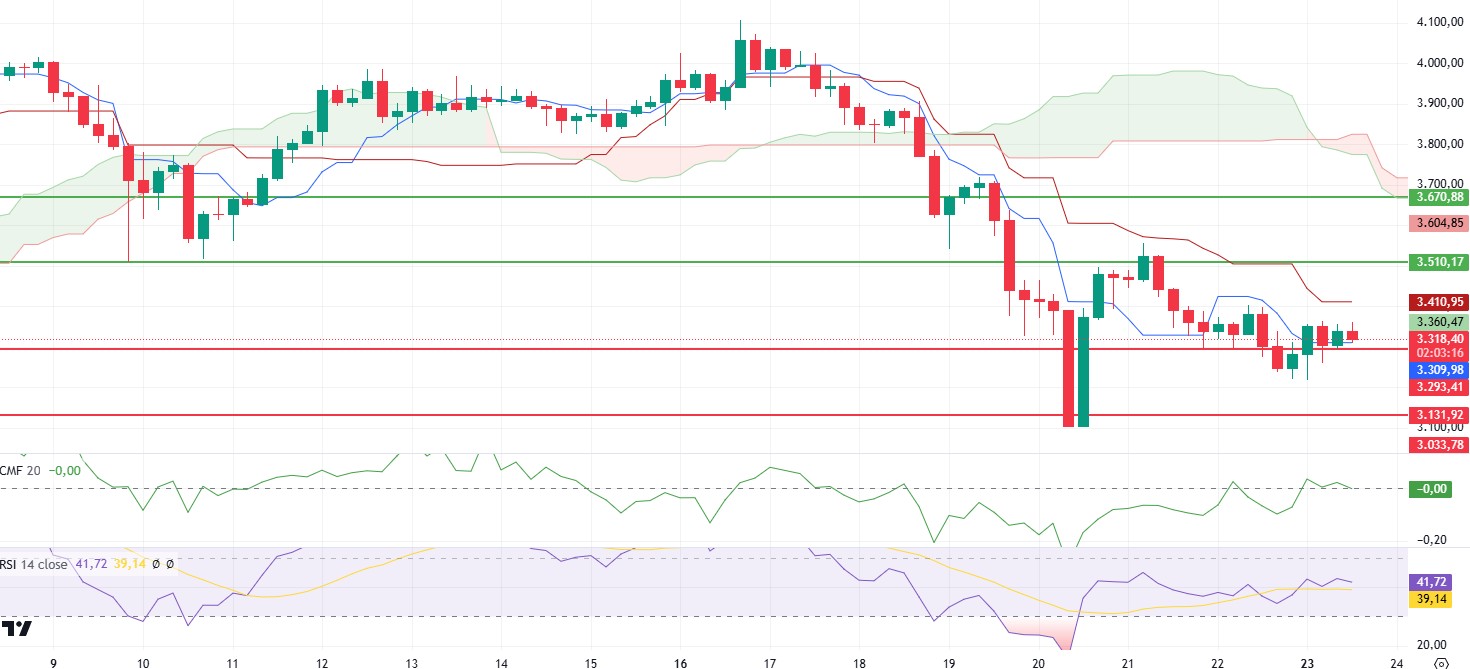
Ethereum (ETH) tried to test the 3,350 level by regaining the 3,293 level in the morning hours but experienced some retracement with increasing selling pressure in this region. When the Cumulative Volume Delta (CVD) data is analyzed, it is seen that this retracement is mainly due to the spot market. Also, it is noteworthy that the funding rate increased with this move, indicating an increase in buyers in leveraged transactions.
Technical indicators are giving more clues about the current state of price action. The negative outlook on the Relative Strength Index (RSI) persists, suggesting that the market is struggling to gain upside momentum. Chaikin Money Flow (CMF), on the other hand, remains flat at the zero level, indicating that market participants have not set a clear direction for capital inflows and outflows.
Based on the current data, if the Ethereum price holds above 3,293, a bullish move up to the Kijun level of 3,413 can be expected. However, the negative outlook on the RSI, CVD-induced selling pressure on the spot side and the increase in the funding rate suggest that a loss of the 3,293 level could deepen the bearish move. In such a scenario, the price is likely to test lower support levels.
Supports 3,293 – 3,131- 3,033
Resistances 3,510 – 3,670 – 3,798
XRP/USDT
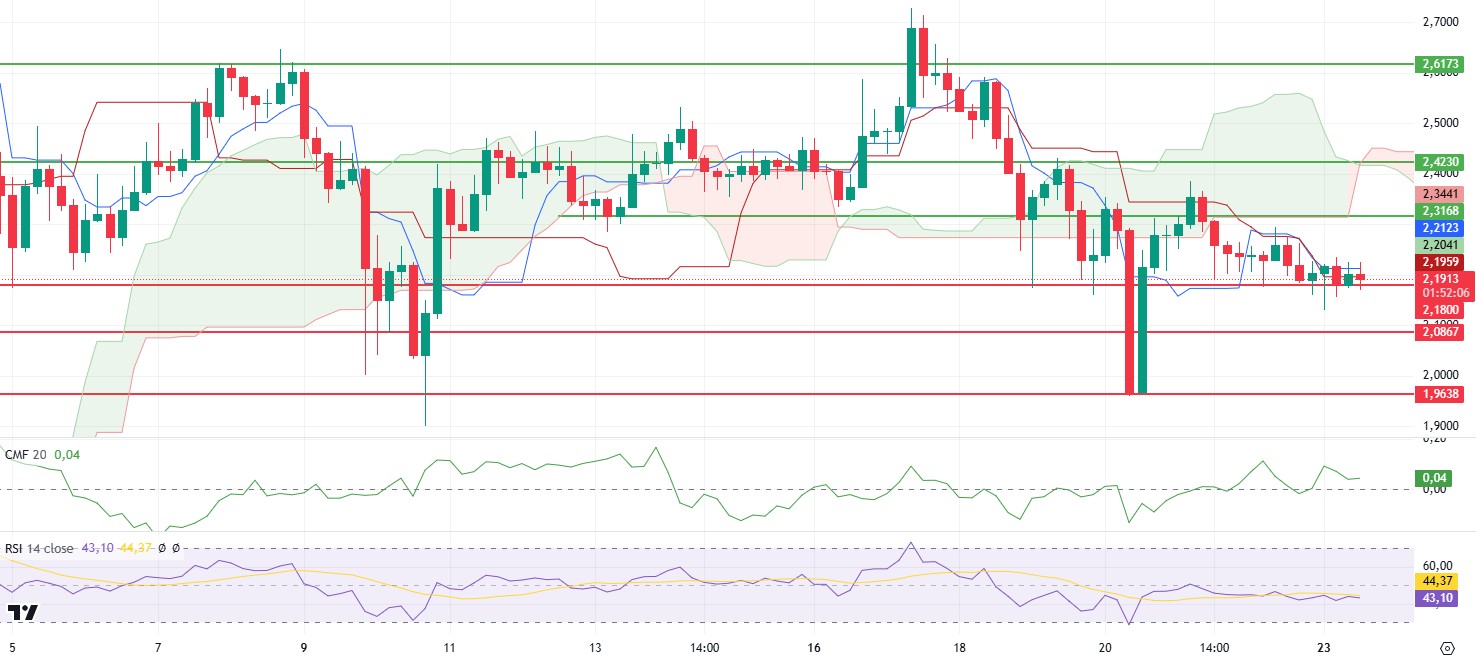
XRP has been moving in a fairly narrow zone between 2.20 and 2.18 recently and is currently trying to hold above 2.18. This price action is generally neutral on technical indicators, including momentum. However, the fact that the Tenkan level remains above the Kijun level is considered a positive sign. This suggests that the market has a slight buying pressure in the short term and could set the stage for a potential upside move.
If the XRP price breaks below 2.18, a deeper decline could be possible, in which case lower levels like 2.10 could be tested. However, in case of a strong reaction from the 2.18 level, the price can be expected to rise as high as 2.31. Breaching this level could allow the price action to gain momentum and turn into a short-term uptrend.
In summary, while the 2.18 level stands out as a critical support point for XRP, maintaining this level could create an important opportunity for a potential recovery. The 2.31 level is one of the important resistance levels to be monitored in case buyers step in.
Supports 2.1800 – 2.0867- 1.9638
Resistances 2.3168 – 2.4230 – 2.6173
SOL/USDT
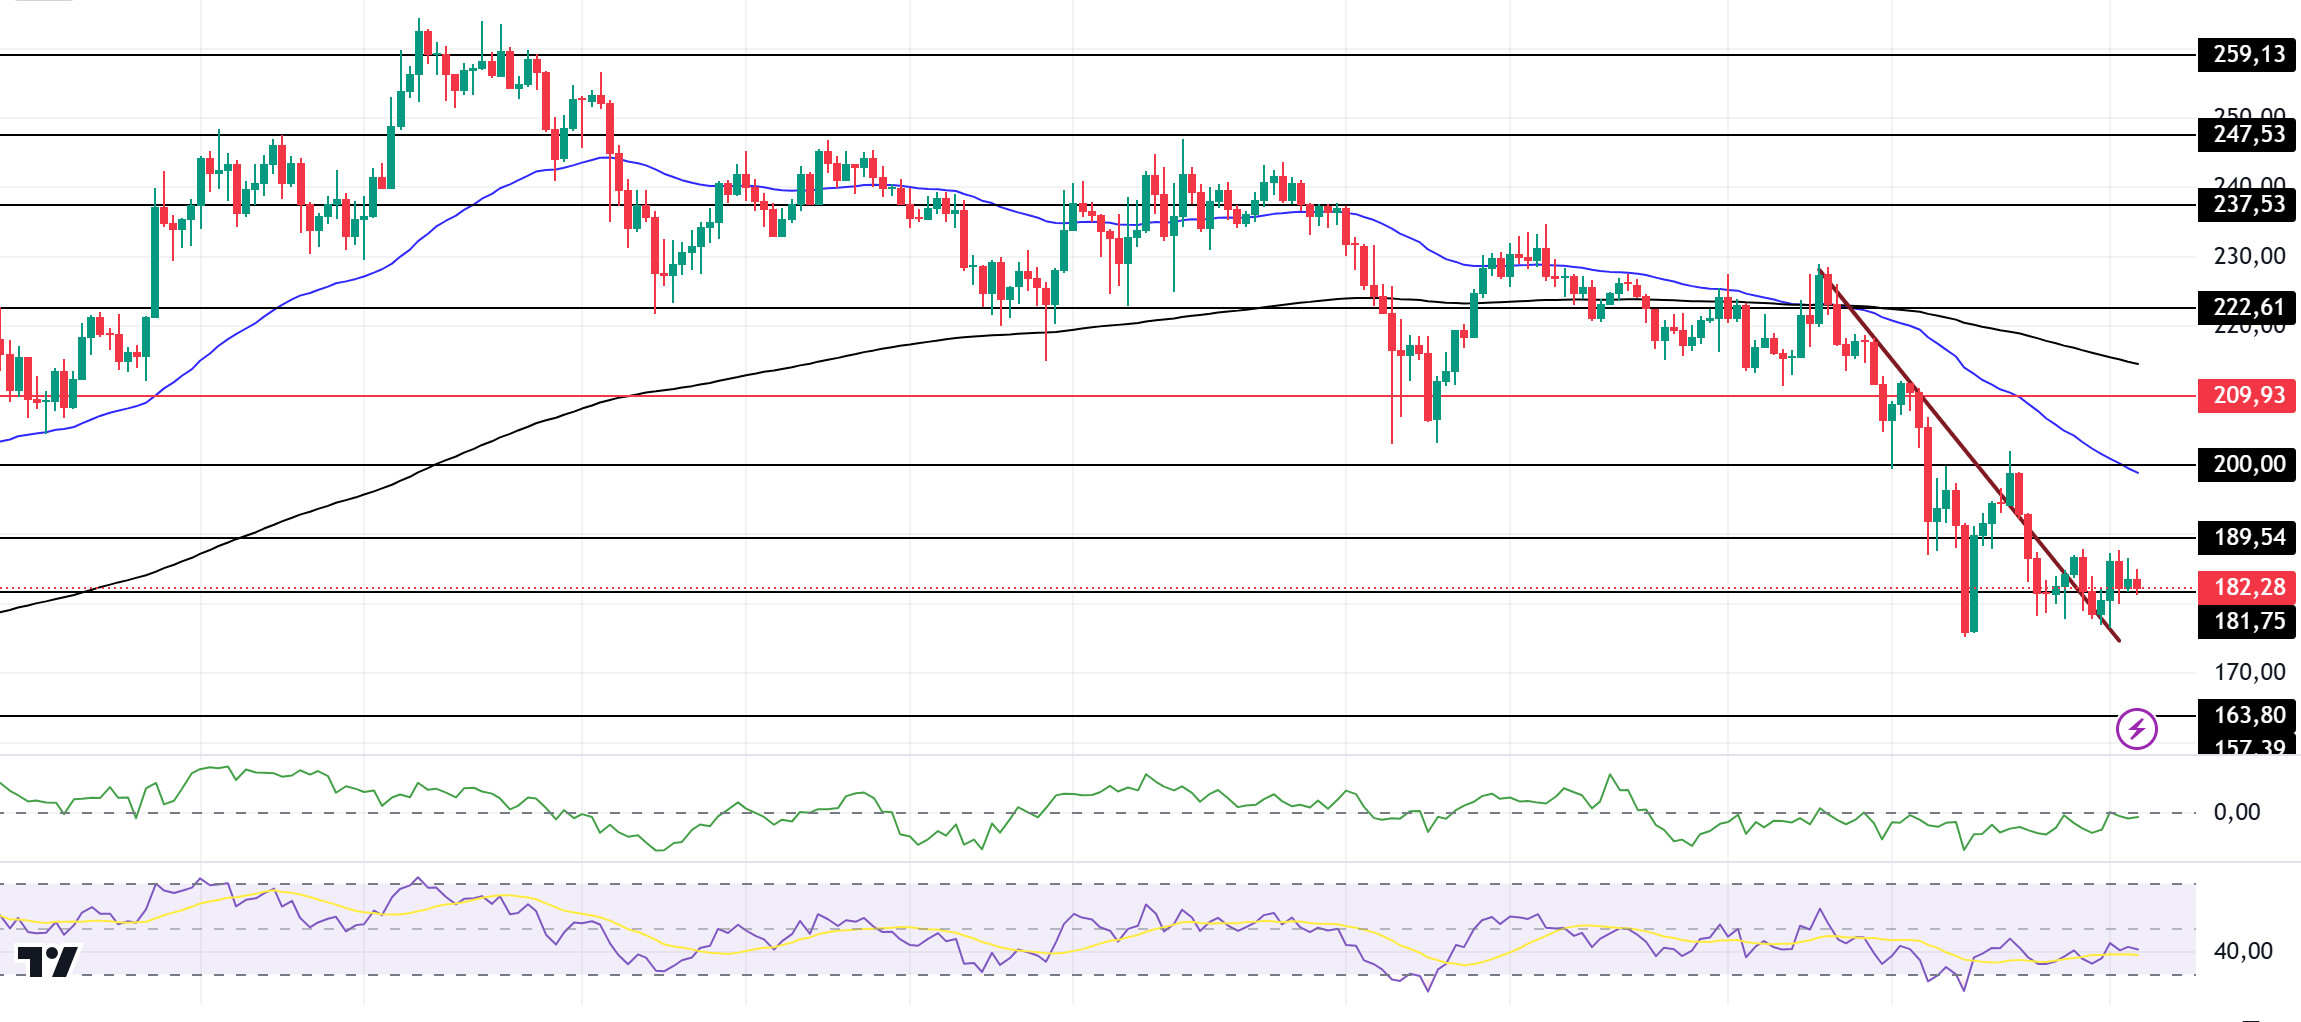
Solana points to further recovery with key resistance supporting the bullish move. In the 4-hour timeframe, the 50 EMA (Blue Line) is below the 200 EMA (Black Line) in the asset, which has been flat since our analysis in the morning. When we examine the Chaikin Money Flow (CMF)20 indicator, the increase in money inflows seems to have reduced the selling pressure. However, Relative Strength Index (RSI)14 continued to be between the neutral zone level and the oversold zone. The 200.00 level appears to be a very strong resistance point in the rises driven by both the upcoming macroeconomic data and the news in the Solana ecosystem. If it breaks here, the rise may continue. In case of retracements for the opposite reasons or due to profit sales, the 163.80 support level can be triggered. If the price reaches these support levels, a potential bullish opportunity may arise if momentum increases.
Supports 181.75 – 163.80 – 157.39
Resistances 189.54 – 200.00 – 209.93
DOGE/USDT
Doge founder Billy Markus, known as Shigetoshi Nakamoto in a post shared on his X platform, recently started a lively discussion in the crypto community with an ironic tweet about wealth, projecting hope amidst uncertainties in market trends. This is resonating with crypto enthusiasts.
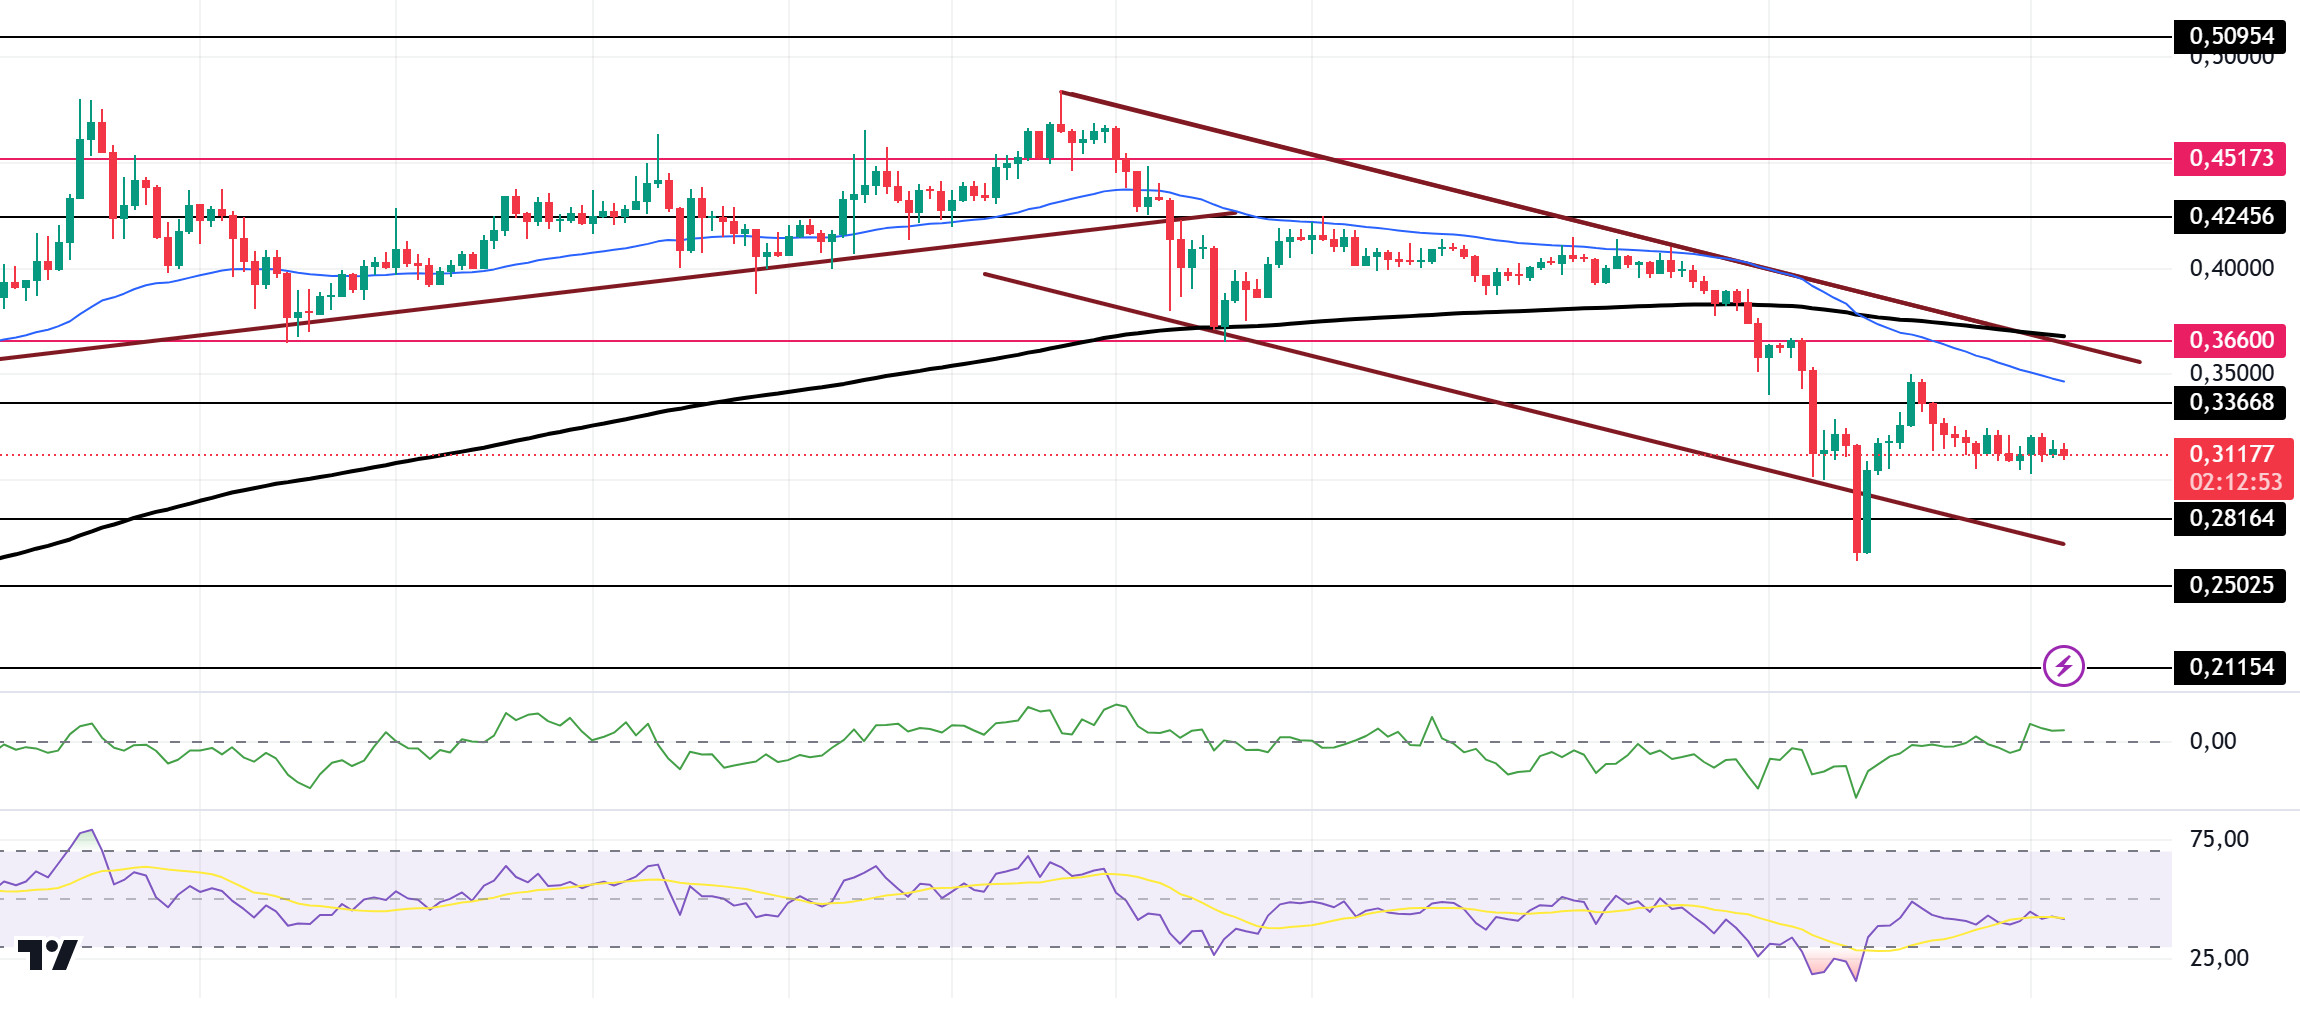
When we look at the chart, DOGE, which has been in a downtrend since December 8, broke the support of this trend and deepened the decline and found support from the 0.2800 and 0.2600 band and found itself in the middle of the trend again. In the 4-hour timeframe, the 50 EMA (Blue Line) started to hover below the 200 EMA (Black Line). When we examine the Chaikin Money Flow (CMF)20 indicator, it is positive and money inflows have increased slightly. However, Relative Strength Index (RSI)14 is between the neutral zone level and the oversold level. The 0.36600 level stands out as a very strong resistance level in the rises driven by both the upcoming macroeconomic data and the innovations in the Doge coin. If DOGE catches a new momentum and rises above this level, the rise may continue strongly. In case of possible pullbacks due to macroeconomic reasons or negativity in the ecosystem, the 0.25025 level is an important support. If the price reaches these support levels, a potential bullish opportunity may arise if momentum increases.
Supports 0.28164 – 0.25025 – 0.21154
Resistances 0.33668 – 0.36600 – 0.42456
LEGAL NOTICE
The investment information, comments and recommendations contained herein do not constitute investment advice. Investment advisory services are provided individually by authorized institutions taking into account the risk and return preferences of individuals. The comments and recommendations contained herein are of a general nature. These recommendations may not be suitable for your financial situation and risk and return preferences. Therefore, making an investment decision based solely on the information contained herein may not produce results in line with your expectations.


