MARKET SUMMARY
Latest Situation in Crypto Assets
| Assets | Last Price | 24h Change | Dominance | Market Cap. |
|---|---|---|---|---|
| BTC | 95,619.12 | 1.87% | 53.48% | 1,89 T |
| ETH | 3,702.22 | 4.49% | 12.61% | 445,47 B |
| XRP | 2.550 | 6.85% | 4.12% | 145,29 B |
| SOLANA | 231.40 | 6.00% | 3.11% | 109,78 B |
| DOGE | 0.4118 | 3.75% | 1.71% | 60,34 B |
| CARDANO | 1.200 | 1.70% | 1.19% | 42,03 B |
| TRX | 0.3756 | 63.03% | 0.92% | 32,39 B |
| AVAX | 54.38 | 9.74% | 0.63% | 22,27 B |
| SHIB | 0.00002983 | 8.31% | 0.50% | 17,57 B |
| LINK | 24.54 | 5.71% | 0.44% | 15,37 B |
| DOT | 11.40 | 19.79% | 0.50% | 17,68 B |
*Prepared on 12.4.2024 at 14:00 (UTC)
WHAT’S LEFT BEHIND
Historic Decline in Bitcoin Reserves
Bitcoin reserves have hit multi-year lows on crypto exchanges, according to CryptoQuant data. This coincides with Bitcoin’s bull market run to close in on the $100,000 mark. The decline in reserves could affect Bitcoin’s supply-demand dynamics, putting upward pressure on the price.
TRON (TRX) at ATH Level: “It Will Be the New XRP”
After Justin Sun’s “TRON is the new XRP” statements for TRON, TRX reached an all-time high (ATH) level, up 70% in 24 hours. TRON, which has returned nearly 100% in the last week, has taken its place on the agenda as one of the remarkable altcoins of the bull seasons.
Crypto Trading Volume Surpasses Stock Exchange in South Korea
The XRP craze in South Korea has pushed the country’s crypto trading volume above stock exchange volume. In addition to XRP, Dogecoin (DOGE), Stellar (XLM) and Shiba Inu (SHIB) were among the most traded crypto assets. The high interest in altcoins is reshaping market dynamics.
HIGHLIGHTS OF THE DAY
Important Economic Calender Data
| Time | News | Expectation | Previous |
|---|---|---|---|
| 14:45 | US Final Services PMI (Nov) | 57.0 | 57.0 |
| 15:00 | US ISM Services PMI (Nov) | 55.7 | 56.0 |
| 18:45 | US Fed Chair Powell Speaks | – | – |
| 19:00 | US Beige Book | – | – |
INFORMATION:
*The calendar is based on UTC (Coordinated Universal Time) time zone. The economic calendar content on the relevant page is obtained from reliable news and data providers. The news in the economic calendar content, the date and time of the announcement of the news, possible changes in the previous, expectations and announced figures are made by the data provider institutions. Darkex cannot be held responsible for possible changes that may arise from similar situations.
MARKET COMPASS
In the shadow of political tensions in the Far East and Europe, markets tried to evaluate macro indicators and welcomed the first critical data of the week, the ADP Non-Farm Payrolls Change. In November, we saw that the private sector of the US economy added 146,000 jobs in non-farm payrolls, which was below expectations of 152,000 but still a far cry from the expected 152,000. On the other hand, St. Louis Fed President Alberto Musalem suggested that the time to slow or pause rate cuts may be approaching.
Except for SOL, we are watching a generally flat to slightly down European session in major digital assets. Stock markets on the continent are generally positive and Wall Street is expected to start the day with a rise. In the dollar index, despite the ADP data, which was below the forecasts, we saw appreciation with Musalem’s statements. In the rest of the day, we think that US data and Chairman Powell’s statements may be decisive on the direction.
Powell ahead of December 18th…
Fed Chair Powell will participate in a discussion at the New York Times DealBook Summit. We will continue to listen to the evaluations of the Federal Open Market Committee (FOMC) officials at various events later in the week, but of course, the Chairman’s sentences may be very important.
Please click here to review our assessments in our weekly report on this issue.
You can also click here to review our December Strategy Report prepared by Darkex Research Department.
From the short term to the big picture.
The victory of former President Trump on November 5, which was one of the main pillars of our bullish expectation for the long-term outlook in digital assets, produced a result in line with our forecasts. In the aftermath, the president-elect’s appointments to Congress and the increased regulatory expectations for the crypto ecosystem in the US remained in our equation as a positive variable. Although Powell gave cautious messages in his last speech, the fact that the FED continued its interest rate cut cycle and the volume in BTC ETFs indicates an increase in institutional investor interest (addition, MicroStrategy’s BTC purchases, Microsoft’s start to evaluate the purchase issue, BlackRock’s BTC ETF options start trading…) supports our upward forecast for the big picture for now.
In the short term, given the nature of the market and pricing behavior, we think it would not be surprising to see occasional respite or pullbacks in digital assets. However, at this point, it would be useful to underline again that the fundamental dynamics continue to be bullish.
TECHNICAL ANALYSIS
BTC/USDT
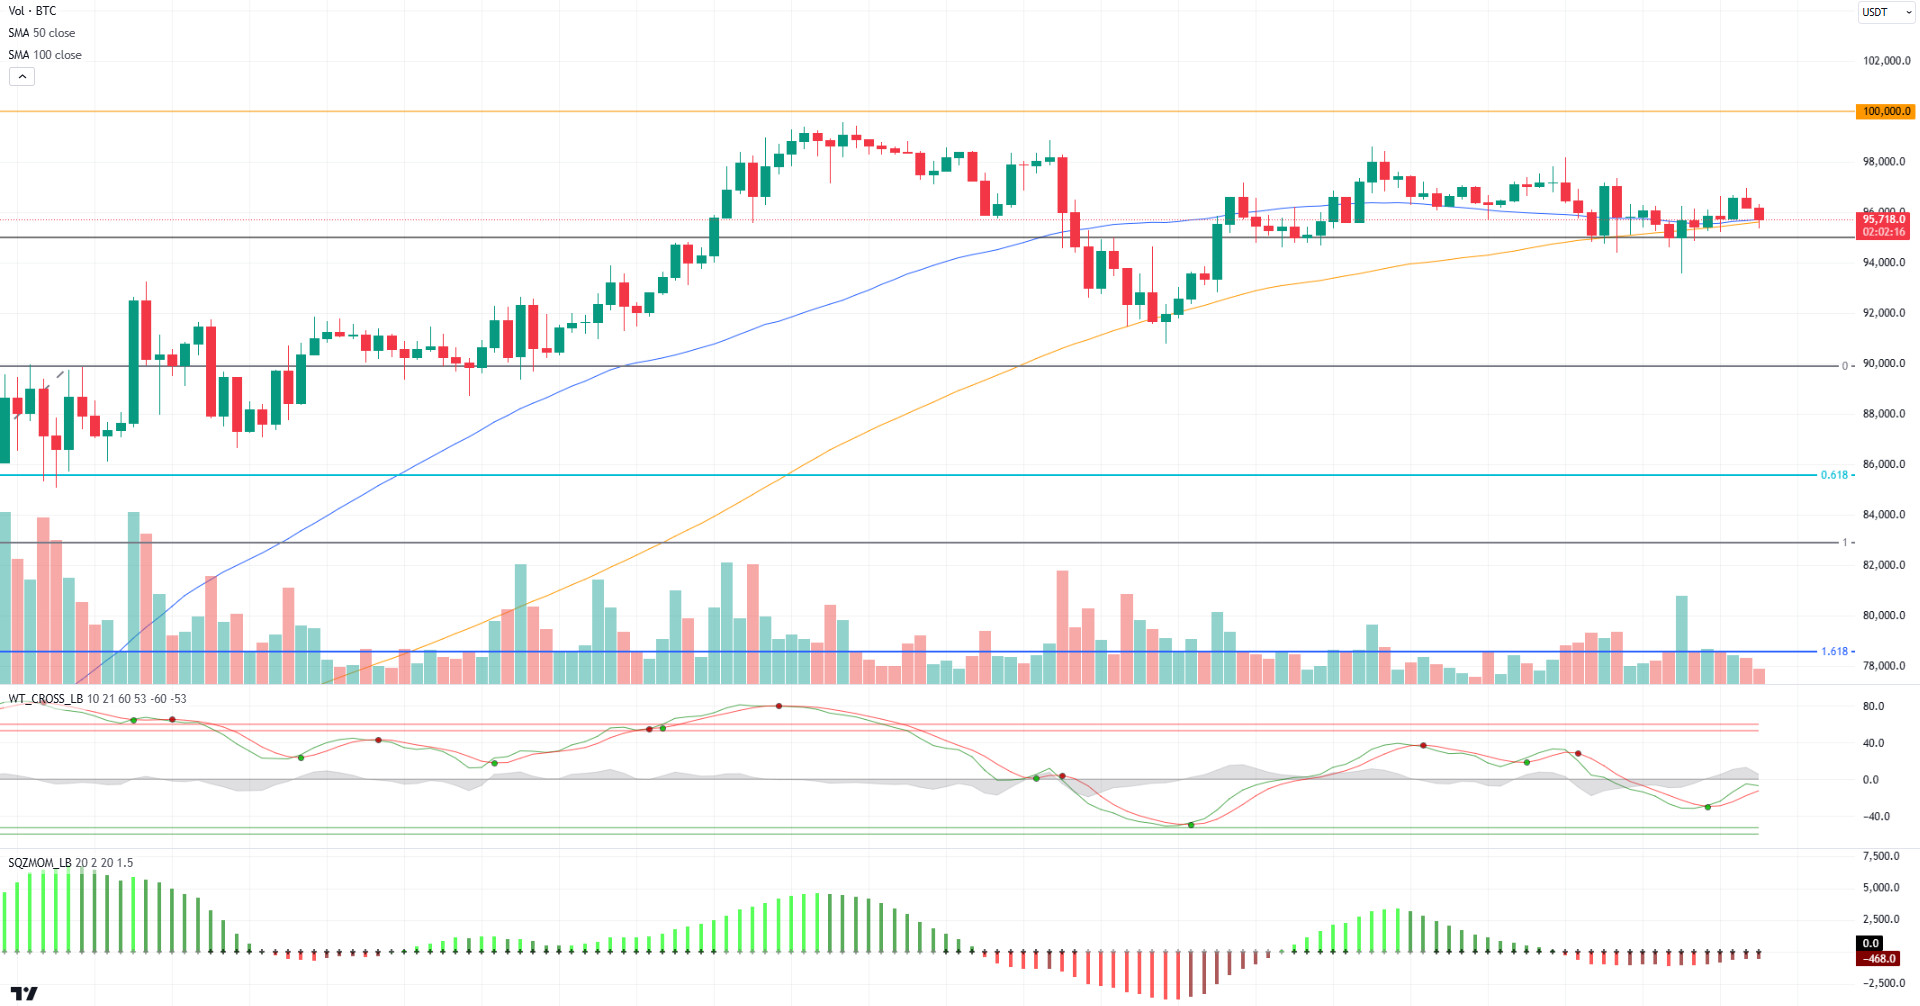
According to on-chain data, Bitcoin reserves have fallen to multi-year lows on cryptocurrency exchanges. The drop coincides with Bitcoin approaching the $100,000 level during the bull market. The decline in reserves offers important clues to the supply-demand balance as Tether (USDT) continues to increase its supply.
The technical outlook following the Onchain data shows that the price is back above the $95,000 level. With the 50 and 100-day moving averages (SMA) approaching each other, it may indicate a “golden cross”. In Bitcoin, which is currently trading around $95,400, technical oscillators maintain their buy signals, while the momentum indicator remains weak in the negative zone. While a mixed outlook continues in global markets, the performance of indices, especially in the US, will be closely monitored. Today, FED Chairman Powell’s statements on inflation, the labor market and the interest rate cycle are expected to create volatility in the markets.
Supports 95,000 – 92,500 – 90,000
Resistances 99,655 – 100,000 – 105,000
ETH/USDT
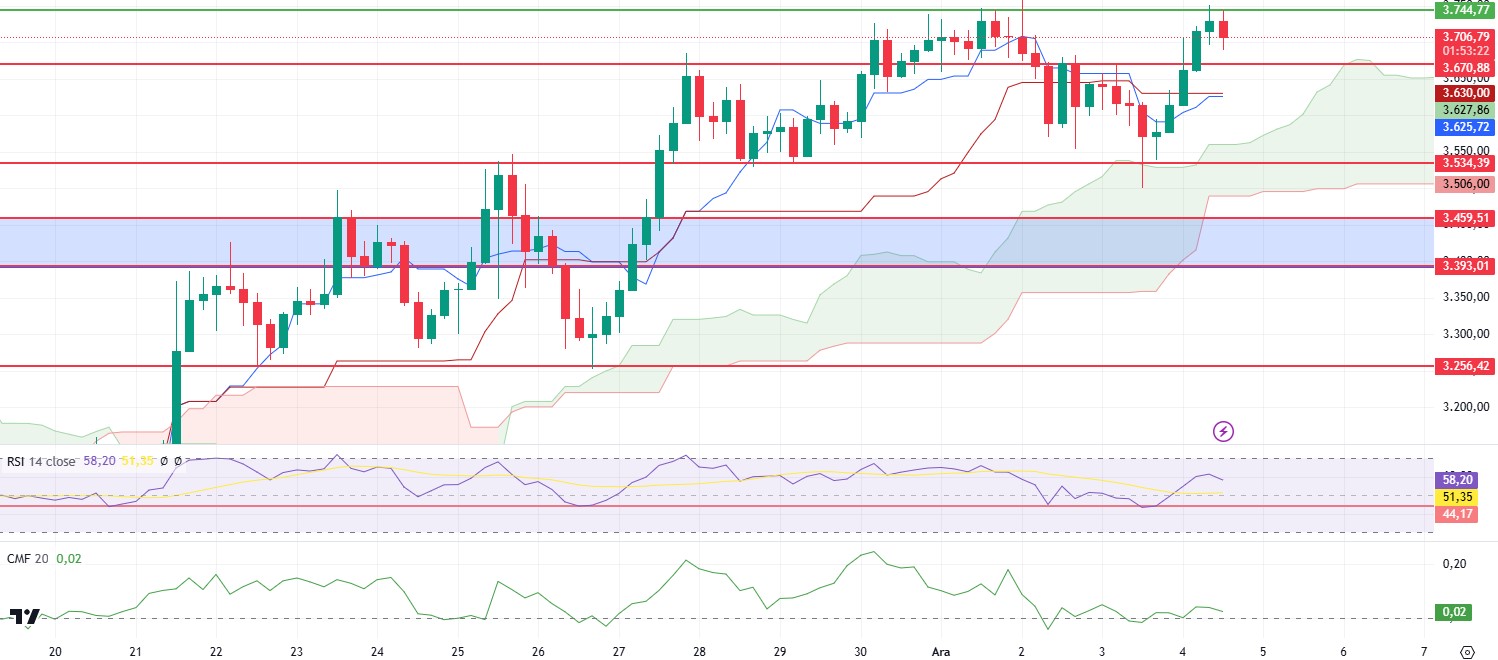
ETH managed to rise above the 3,670 level during the day and then rose to the 3,744 region, as mentioned in the morning analysis. For ETH, which has been rejected twice from this level, it is seen that high sales are coming on the Coinbase spot side. Despite Coinbase, which has been under selling pressure for a long time, other exchanges and ETFs are in a buyer position. After this sale, Chaikin Money Flow (CMF) turned its direction down but still remains in the positive area. The fact that the Tenkan level is close to the kijun level can be seen as a positive factor, but it has started a horizontal movement without a clear positive signal. The rise of the Kumo cloud has also slowed down and started to move horizontally. With all this data; For ETH, which has established a double top structure, exceeding the 3,744 level is critical for the continuity of the rise. The breakout of this region may bring sharp rises, but every moment below it seems to strengthen the possibility of a correction to the 3,534 region.
Supports 3,670 – 3,534 – 3,459
Resistances 3,744- 3,839 – 3,943
XRP/USDT
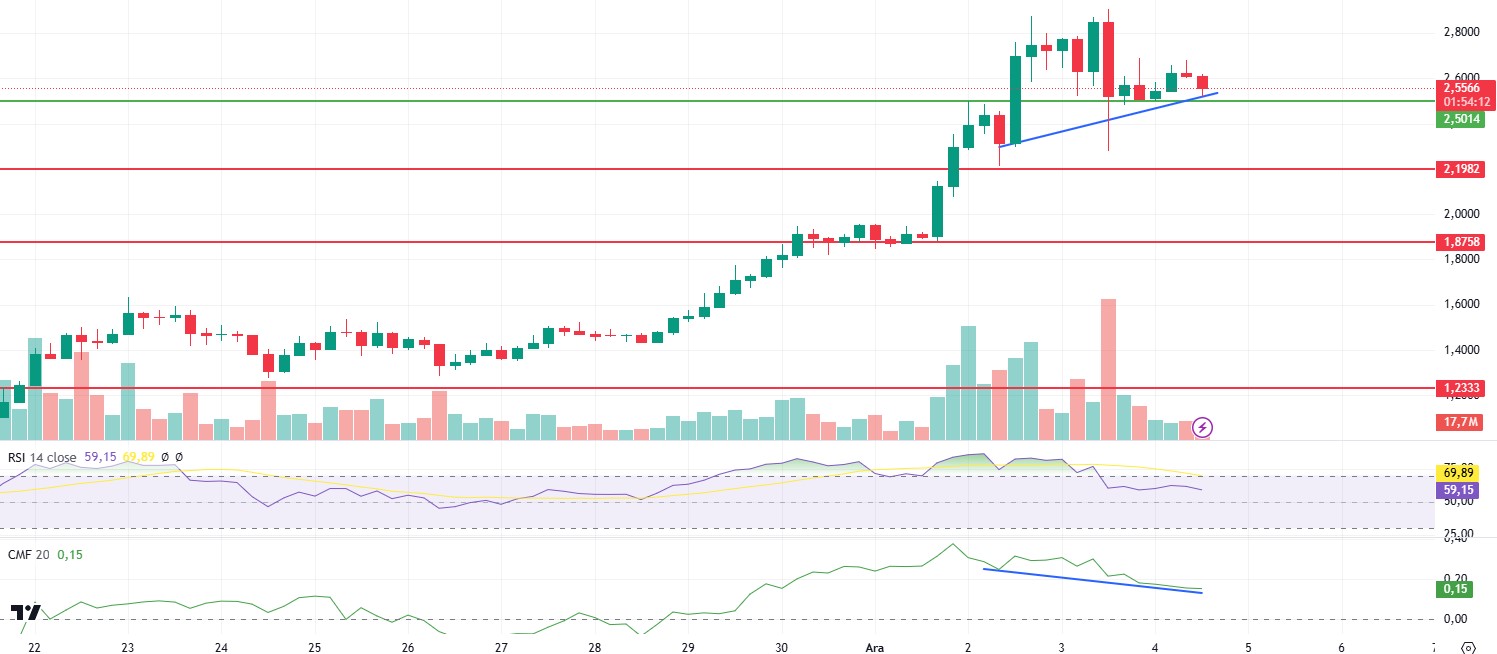
XRP has started to move horizontally above the 2.5 level after yesterday’s correction. With this movement, we see that trading volumes have started to decrease. Although Chaikin Money Flow (CMF) continues its downward movement, it is seen that there is a positive divergence as mentioned in the chart. Relative Strength Index (RSI) continues its horizontal movement. XRP may continue its sideways movement above the 2.5 level. As long as it does not lose this level, we can see the continuation of its rise with the positive divergence on CMF. However, closures below the 2.5 level may bring pullbacks to the 2.19 level.
Supports 2.5014- 2.1982- 1.8758
Resistances 2.6971 – 3.105
SOL/USDT
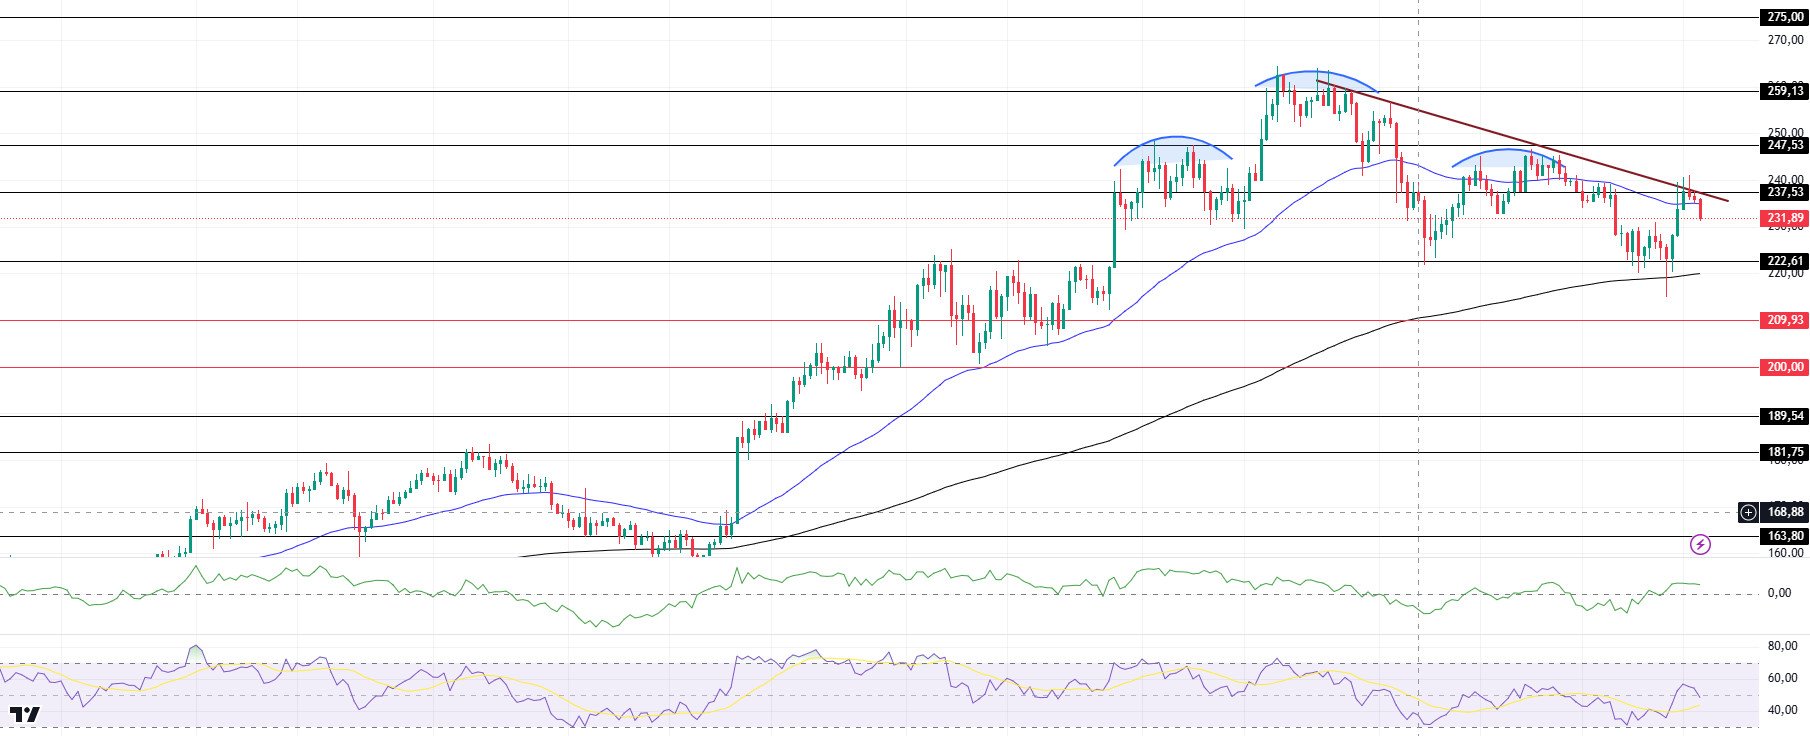
When we look at the chart, the 50 EMA (Blue Line) is above the 200 EMA (Black Line) in the 4-hour timeframe. Since November 22, SOL, which has been in a downtrend since November 22, continues to decline. Priced at $232.74, the asset has fallen to a market capitalization of about 110 billion. When we examine the Chaikin Money Flow (CMF)20 indicator, it is seen that there is an increase in money inflows. This can be shown as a bullish signal. However, Relative Strength Index (RSI)14 is at neutral level. Another potential directional indicator on the chart, the shoulder head and shoulders pattern, has started to work. This could lead to a decline to 189.54 if the pattern continues to work. On the other hand, although the price started to trend up with support from the 200 EMA, the momentum started to decline. The 247.53 level is a very strong resistance point in the uptrend driven by both macroeconomic conditions and innovations in the Solana ecosystem. If it breaks here, the rise may continue. In case of possible retracements due to macroeconomic reasons or profit sales, the support levels of 209.93 and 189.54 may be triggered again. If the price reaches these support levels, a potential bullish opportunity may arise if momentum increases.
Supports 222.61 – 209.93 – 200.00
Resistances 237.53 – 247.53 – 259.13
DOGE/USDT
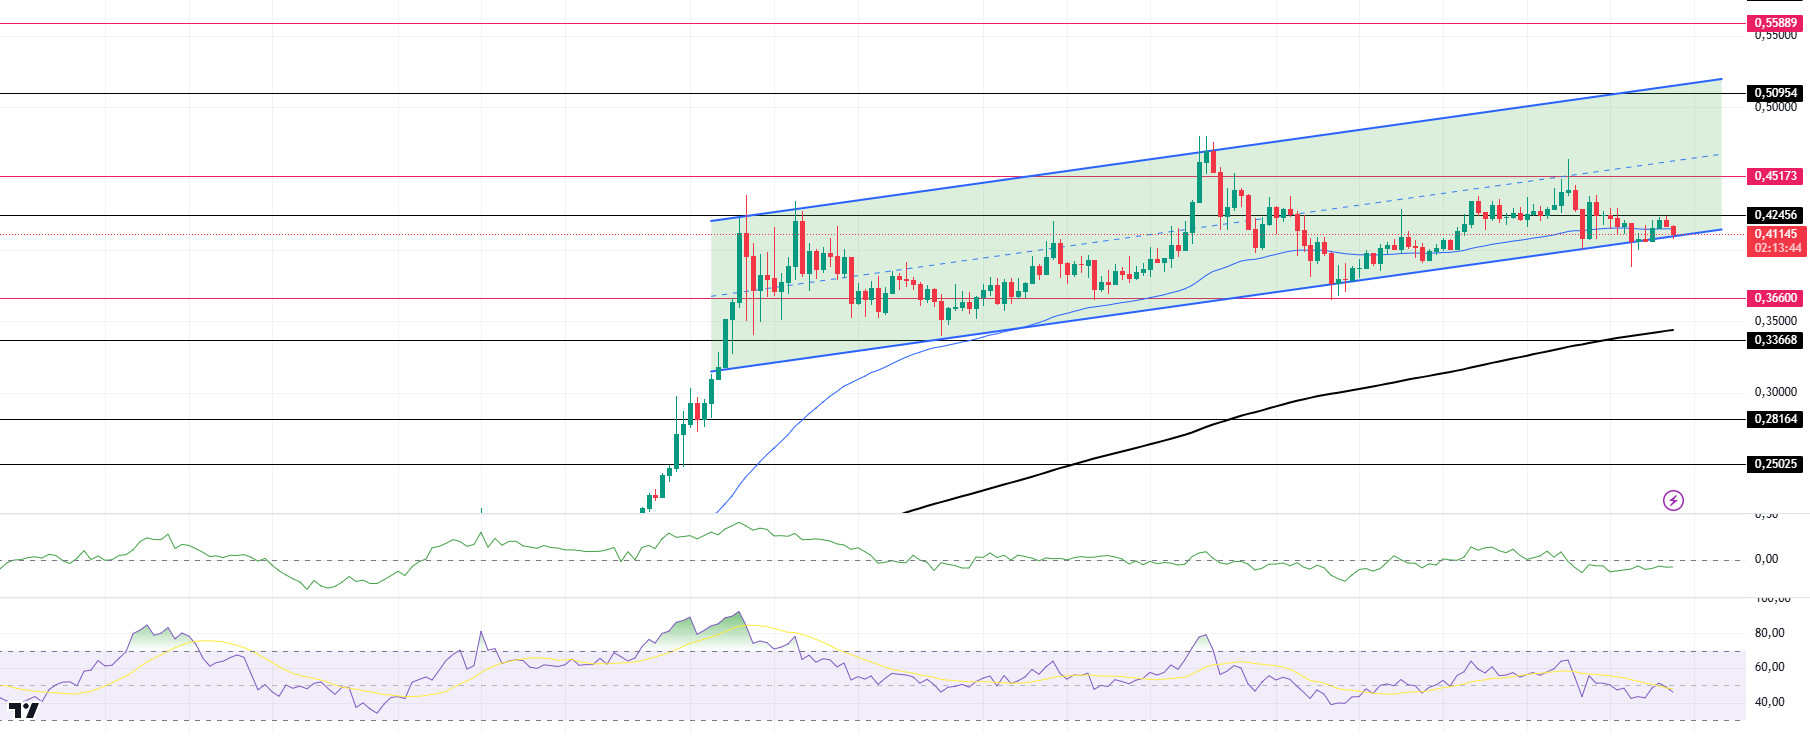
When we look at the chart, the asset, which has been in an uptrend since November 11, is testing the base level of the trend once again by entering a downward trend, although it has been rising with support from both the base level of the trend and the 50 EMA. If the upward momentum is strong, the 0.50954 level may be triggered. On the 4-hour timeframe, the 50 EMA (Blue Line) is above the 200 EMA (Black Line). But the gap between the two averages is still too wide. This may cause pullbacks. On the other hand, when we look at the RSI 14 indicator, we see that it is at a neutral level. However, when we examine the Chaikin Money Flow (CMF)20 indicator, we see that there are money outflows. The 0.50954 level appears to be a very strong resistance place in the rises driven by both macroeconomic conditions and innovations in Doge coin. If DOGE maintains its momentum and rises above this level, the rise may continue strongly. In case of retracements due to possible macroeconomic reasons or profit sales, the 0.36600 support level can be triggered again. If the price reaches these support levels, a potential bullish opportunity may arise if momentum increases.
Supports 0.36600 – 0.33668 – 0.28164
Resistances 0.42456 – 0.45173 – 0.50954
LEGAL NOTICE
The investment information, comments and recommendations contained herein do not constitute investment advice. Investment advisory services are provided individually by authorized institutions taking into account the risk and return preferences of individuals. The comments and recommendations contained herein are of a general nature. These recommendations may not be suitable for your financial situation and risk and return preferences. Therefore, making an investment decision based solely on the information contained herein may not produce results in line with your expectations.


