MARKET SUMMARY
Latest Situation in Crypto Assets
| Assets | Last Price | 24h Change | Dominance | Market Cap. |
|---|---|---|---|---|
| BTC | 102,895.38 | 7.75% | 54.95% | 2,04 T |
| ETH | 3,923.07 | 6.21% | 12.76% | 472,78 B |
| XRP | 2.373 | -6.41% | 3.66% | 135,50 B |
| SOLANA | 240.16 | 3.88% | 3.08% | 114,20 B |
| DOGE | 0.4522 | 10.35% | 1.80% | 66,72 B |
| CARDANO | 1.211 | 1.30% | 1.15% | 42,59 B |
| TRX | 0.3398 | -9.22% | 0.79% | 29,30 B |
| AVAX | 52.76 | -2.41% | 0.58% | 21,66 B |
| SHIB | 0.00003189 | 7.30% | 0.51% | 18,79 B |
| DOT | 10.90 | -4.36% | 0.45% | 16,69 B |
| LINK | 24.46 | 0.13% | 0.42% | 15,37 B |
*Prepared on 12.5.2024 at 14:00 (UTC)
WHAT’S LEFT BEHIND
Trump Celebrates Bitcoin’s $100,000 Breakthrough
US President-elect Donald Trump posted on his social media account, “Congratulations to Bitcoin enthusiasts, $100,000! You’re welcome, together we will make America great again.” This statement emphasized Trump’s support for Bitcoin’s recent bull run.
Bitcoin is the World’s 10th Largest Currency and 12th Largest Economy
Bitcoin has become the 10th largest currency in the world by market capitalization with a total supply of approximately 19,790,568 BTC. In addition, Bitcoin has once again proved its financial and economic power by reaching a level equivalent to the 12th largest economy in the world with its total market capitalization.
Putin: Digital Currencies Can Play a Role in BRICS Investment Platform
Russian President Vladimir Putin stated that national digital currencies could be used as a solution tool in the future of the BRICS organization.
HIGHLIGHTS OF THE DAY
Important Economic Calender Data
*There is no important calendar data for the rest of the day.
INFORMATION
*The calendar is based on UTC (Coordinated Universal Time) time zone.
The economic calendar content on the relevant page is obtained from reliable news and data providers. The news in the economic calendar content, the date and time of the announcement of the news, possible changes in the previous, expectations and announced figures are made by the data provider institutions. Darkex cannot be held responsible for possible changes that may arise from similar situations.
MARKET COMPASS
Markets are relatively quieter during European trading after Bitcoin, the largest digital currency, crossed a historic threshold. The recent rally was underpinned by President-elect Trump continuing to make appointments that raised hopes of crypto regulation in the US. The rest of the day may be relatively quieter, but digital assets may continue to reflect investor excitement as they move towards becoming a mainstream investment instrument.
In the shadow of political tensions in the Far East and Europe, data from the US continues to be under scrutiny. Weekly jobless claims were announced today and came in above the forecasts. Tomorrow, eyes will be on the critical labor statistics and will provide information about the next interest rate move of the US Federal Reserve (FED).
You can click here to review our December Strategy Report prepared by Darkex Research Department.
From the short term to the big picture.
The victory of former President Trump on November 5, which was one of the main pillars of our bullish expectation for the long-term outlook in digital assets, produced a result in line with our forecasts. In the aftermath, the president-elect’s appointments to Congress and the increased regulatory expectations for the crypto ecosystem in the US remained in our equation as a positive variable. Although Powell gave cautious messages in his last speech, the fact that the FED continued its interest rate cut cycle and the volume in BTC ETFs indicates an increase in institutional investor interest (in addition, MicroStrategy’s BTC purchases, Microsoft’s start to evaluate the purchase issue, BlackRock’s BTC ETF options start trading…) supports our upward forecast for the big picture for now.
In the short term, given the nature of the market and pricing behavior, we think it would not be surprising to see occasional respite or pullbacks in digital assets. However, at this point, it would be useful to underline again that the fundamental dynamics continue to be bullish.
TECHNICAL ANALYSIS
BTC/USDT
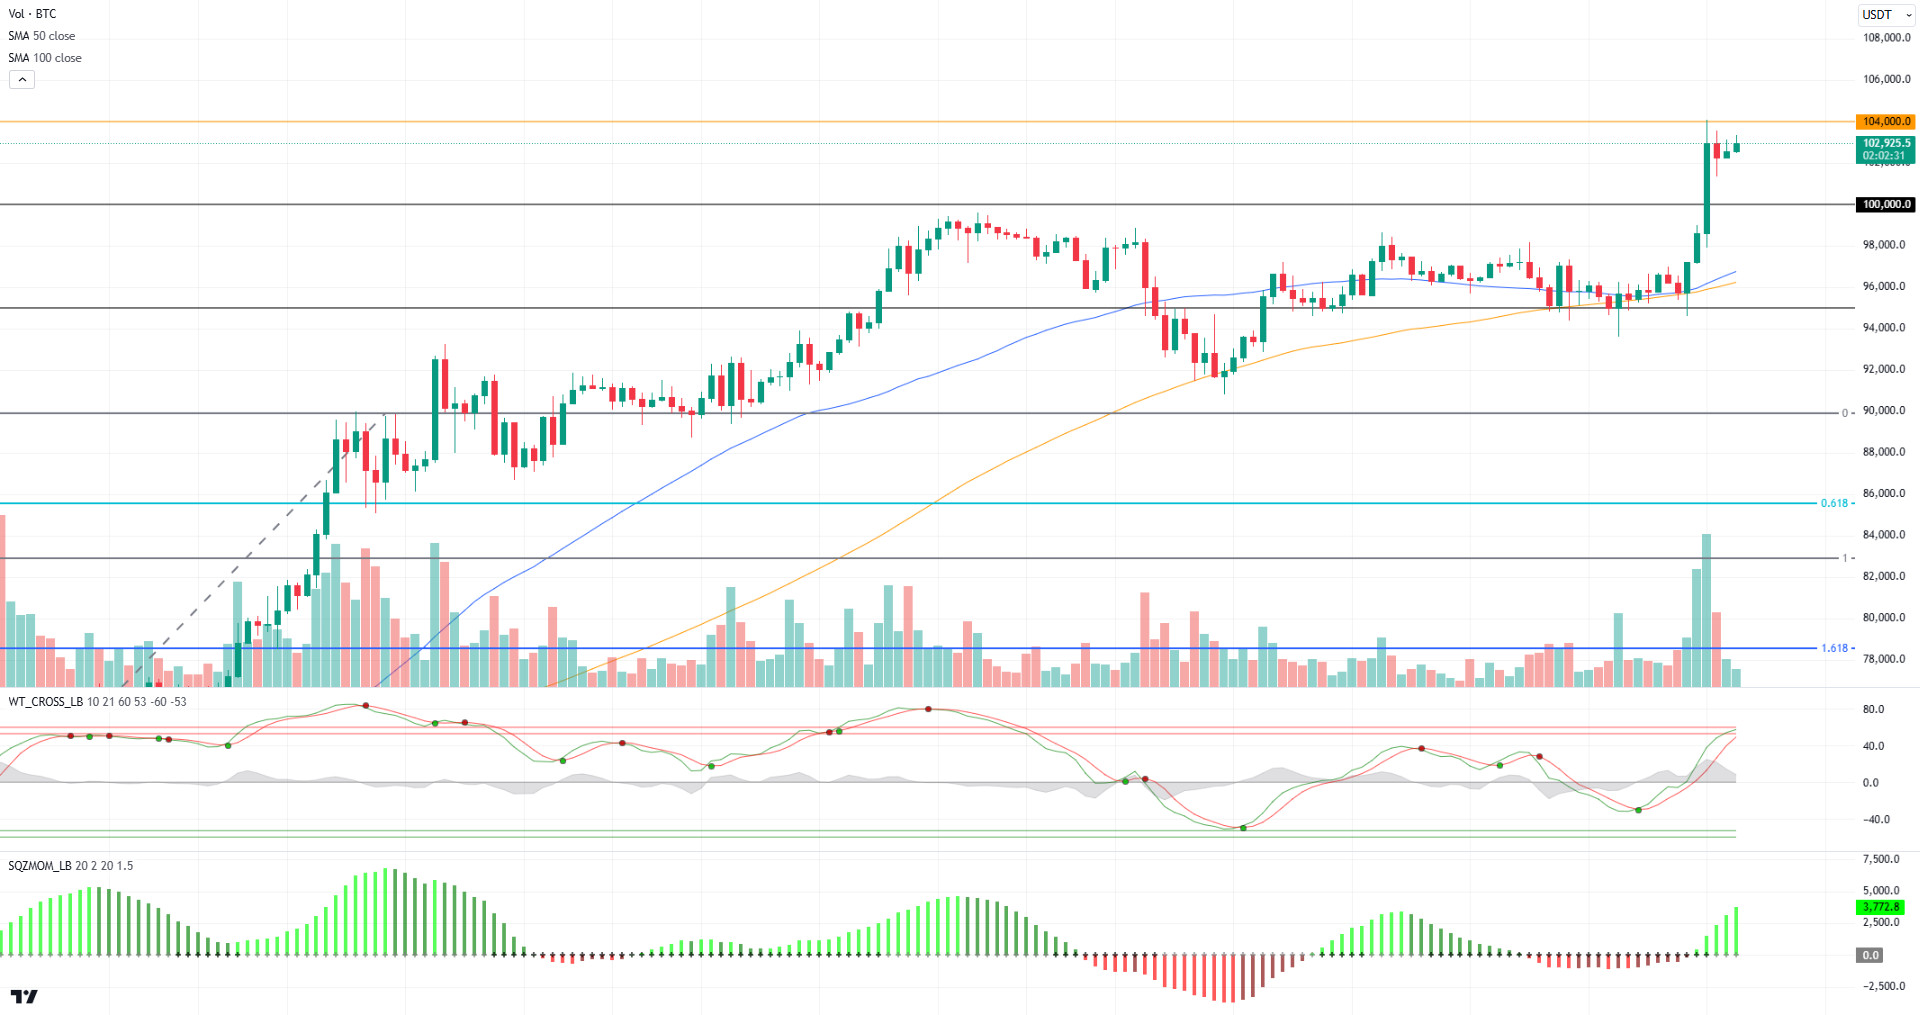
Bitcoin, which has reached six-digit levels, is experiencing a historic day. Exceeding the critical psychological threshold of 100,000 continues to resonate widely around the world. US President D. Trump published a congratulatory message, showing once again that he closely follows the market. Bitcoin, which has become the 10th largest currency in the world, has once again proved its financial and economic power by reaching a level equivalent to the 12th largest economy in the world.
When we look at the technical outlook with fundamental developments, BTC, which tested the 104,000 level with the crossing of the 100,000 level, is currently trading close to its peak level. While technical oscillators continue to maintain the buy signal on hourly charts, the momentum indicator is gaining strength. In the continuation of the rise, it can move the band range to the level of 110,000 with the crossing of the 105,000 level. The high risk appetite in global markets strengthens this scenario. In a possible market correction, the 100,000 level may become a strong support.
Supports: 100,000 -95,000 – 92,500
Resistances 104,000 – 105,000 – 110,000
ETH/USDT
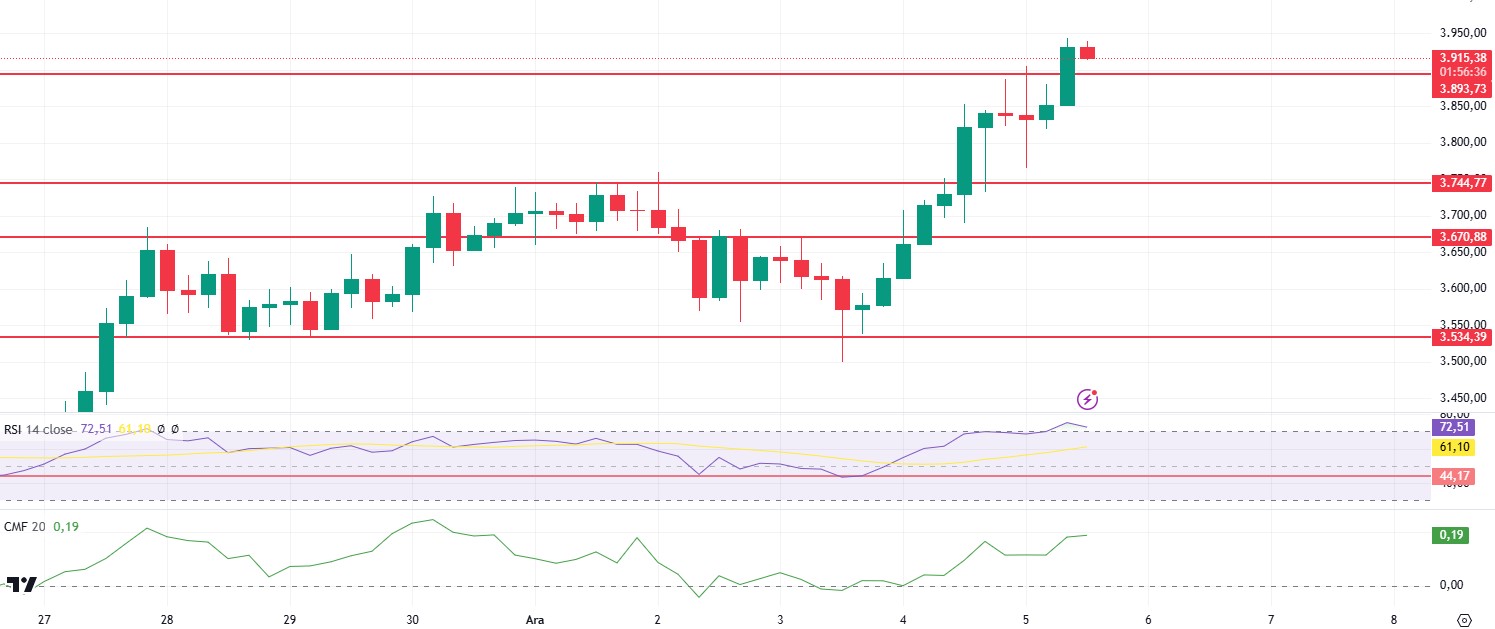
ETH managed to break through the 3,893 area, one of the most important resistance levels during the day. Increases in the amount of ETH in liquidity pools on Decentralized Exchanges (DEXs) such as Uniswap and Balancer are also notable. With this activity, Chaikin Money Flow (CMF) also strengthens the positive outlook by rising to 0.22. The downward trend of the Relative Strength Index (RSI) in the overbought zone strengthens the possibility of a re-test to 3.893. In this scenario, unless there are no closures below 3.893, it can be expected that the rise may continue in the night hours. Nowadays, when the rises are voluminous, much more drastic movements can be seen with the price rising above the 4,093 level. As the main support position, the 3,744 level remains valid, but the loss of this region may bring retracements up to 3,534.
Supports 3,893 – 3,744 – 3,670
Resistances 4,093 – 4,299 – 4,474
XRP/USDT
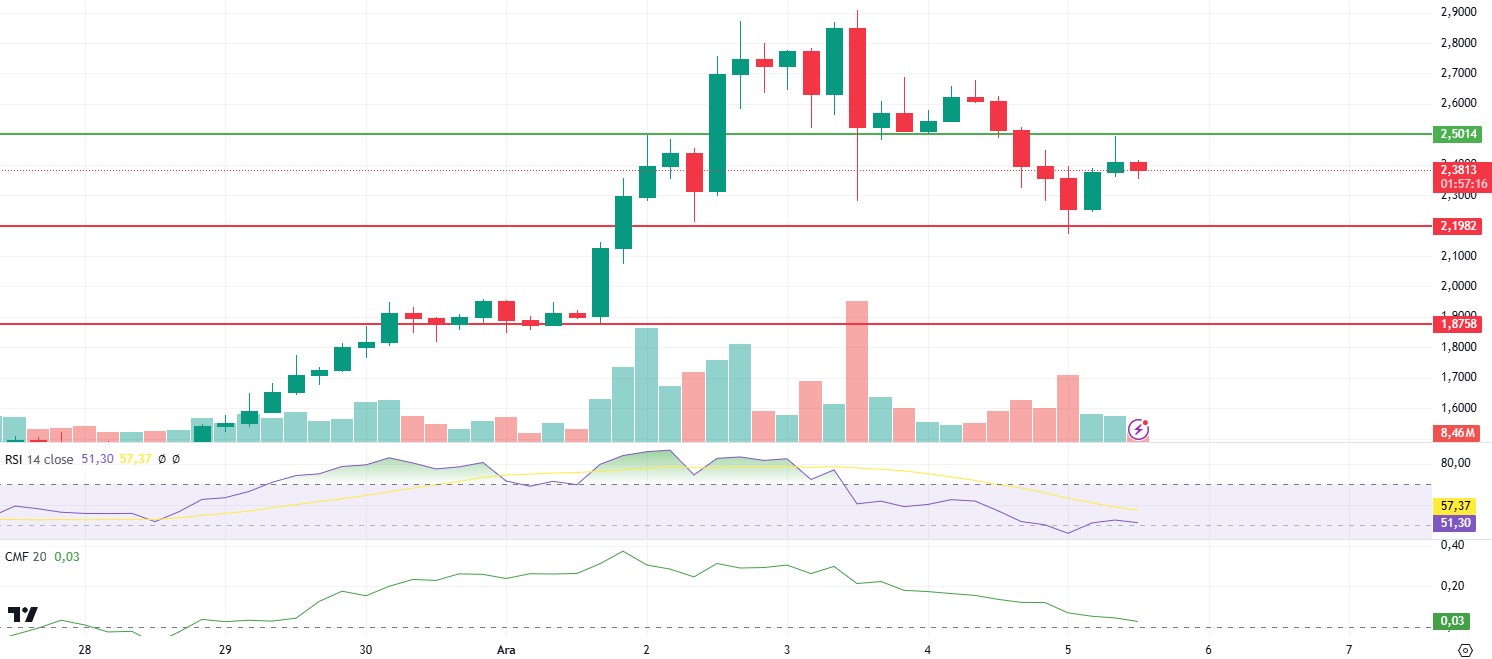
The current outlook remains valid for XRP, which continues to move horizontally after the correction movement and after the recent rises. The Relative Strength Index (RSI) and Chaikin Money Flow (CMF) levels also maintain their bearish outlook after the rejection from the XRP region, which retested the 2.5 level during the day. With the weakness in momentum and volume, there may be pullbacks to the 2.1982 level. The loss of this region may cause further declines. If the price closes above the 2.5 zone, it can be said that the upward trend may continue.
Supports 2.1982 – 1.8758- 1.2333
Resistances 2.5014 – 2.6971 – 3.105
SOL/USDT
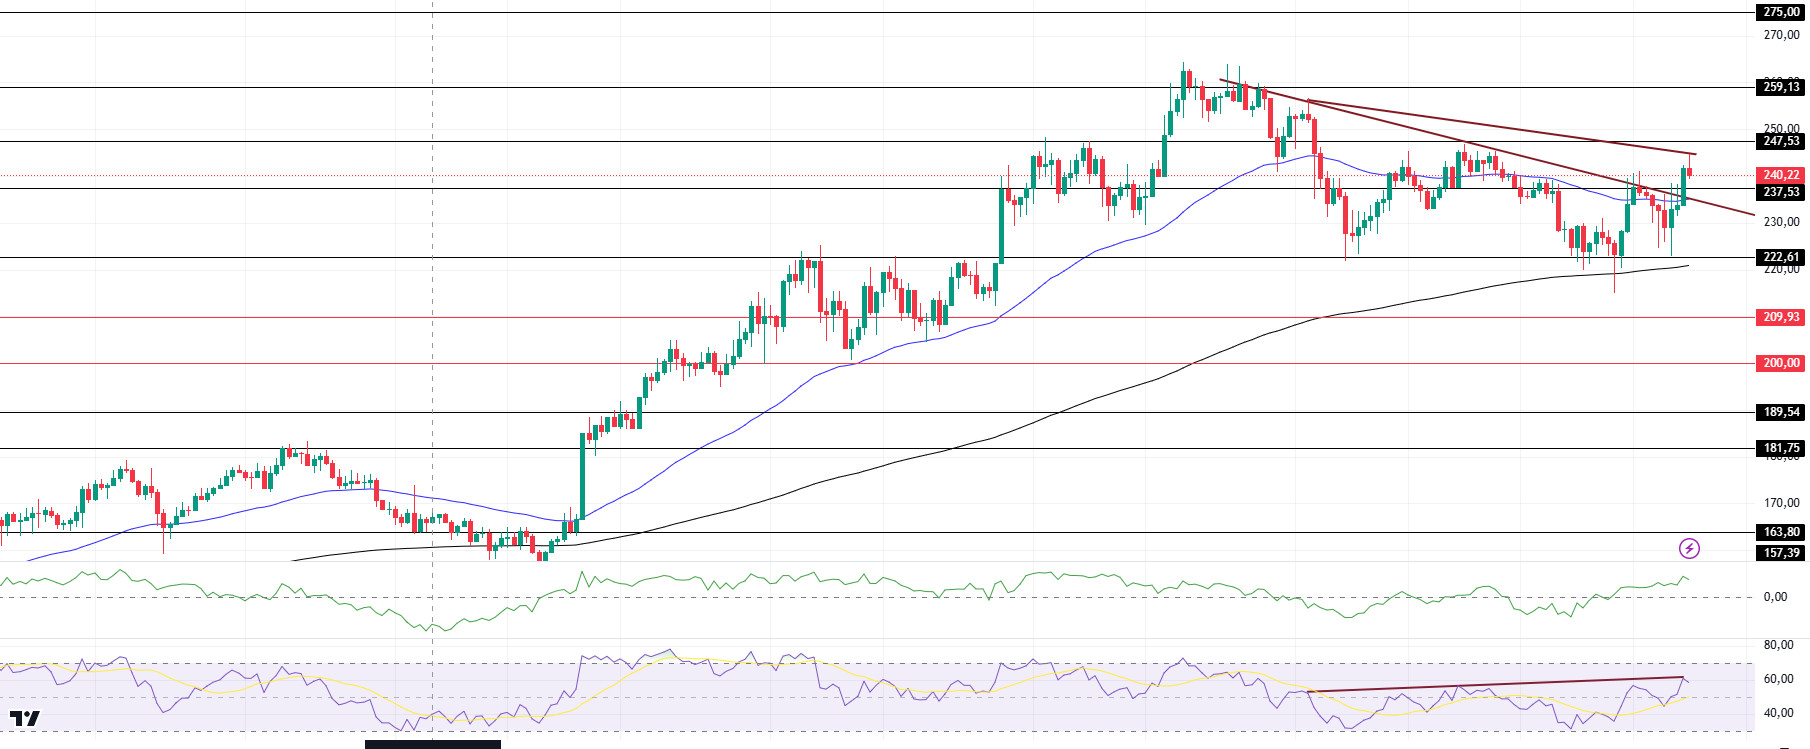
On the 4-hour timeframe, the 50 EMA (Blue Line) is above the 200 EMA (Black Line). Since November 22, SOL, which has been in a downtrend since November 22, has broken the downtrend, but we can say that this is a rise due to the general market. As a matter of fact, at the time of writing, the price started to rise with support from the 200 EMA, but the momentum started to decline. When we examine the Chaikin Money Flow (CMF)20 indicator, we see that there is an increase in money inflows. This can be shown as an upward signal. However, Relative Strength Index (RSI)14 is at neutral level. At the same time, there is a bearish mismatch between the RSI (14) and the chart. The 247.53 level is a very strong resistance point in the uptrend driven by both macroeconomic conditions and innovations in the Solana ecosystem. If it breaks here, the rise may continue. In case of possible retracements due to macroeconomic reasons or profit sales, the support levels of 209.93 and 189.54 can be triggered again. If the price reaches these support levels, a potential bullish opportunity may arise if momentum increases.
Supports 237.53 – 222.61 – 209.93
Resistances 247.53 – 259.13 – 275.00
DOGE/USDT
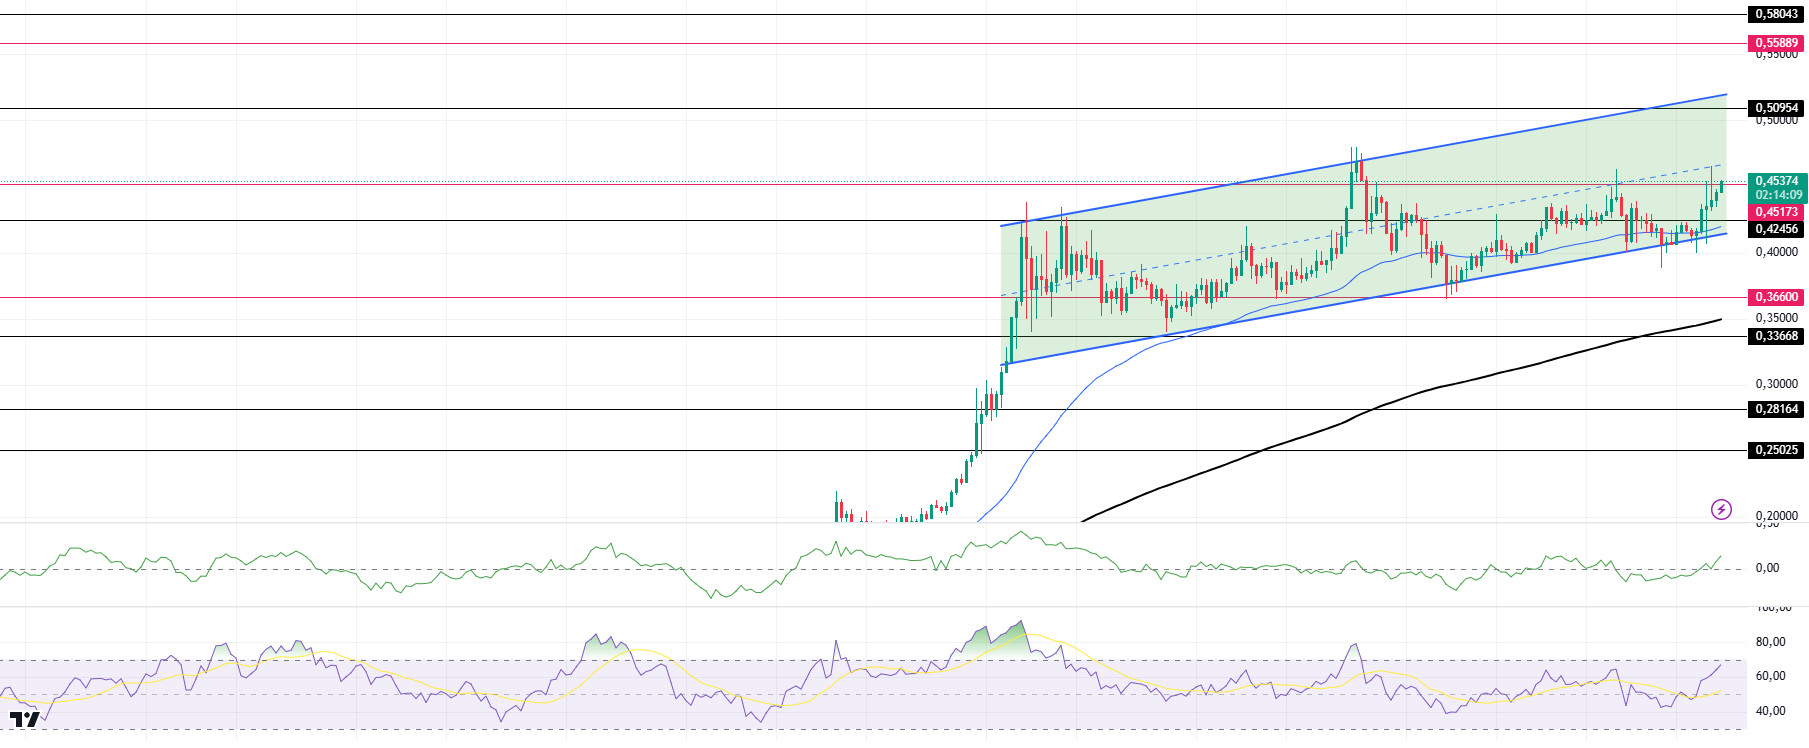
When we look at the chart, the asset, which has been in an uptrend since November 11, has risen with support from both the base level of the trend and the 50 EMA. If the upward momentum is strong, the 0.50954 level may be triggered. On the 4-hour timeframe, the 50 EMA (Blue Line) is above the 200 EMA (Black Line). But the gap between the two averages is still too wide. This may cause pullbacks. On the other hand, when we look at the RSI 14 indicator, we see that it is accelerating towards the overbought zone. However, when we examine the Chaikin Money Flow (CMF)20 indicator, we see that there are money inflows. The 0.50954 level is a very strong resistance point in the rises driven by both macroeconomic conditions and innovations in Doge coin. If DOGE maintains its momentum and rises above this level, the rise may continue strongly. In case of retracements due to possible macroeconomic reasons or profit sales, the 0.36600 support level can be triggered again. If the price reaches these support levels, a potential bullish opportunity may arise if momentum increases.
Supports 0.42456 – 0.36600 – 0.33668
Resistances 0.45173 – 0.50954 – 0.55889
LEGAL NOTICE
The investment information, comments and recommendations contained herein do not constitute investment advice. Investment advisory services are provided individually by authorized institutions taking into account the risk and return preferences of individuals. The comments and recommendations contained herein are of a general nature. These recommendations may not be suitable for your financial situation and risk and return preferences. Therefore, making an investment decision based solely on the information contained herein may not produce results in line with your expectations.


