
MARKET SUMMARY
Latest Situation in Crypto Assets
| Assets | Last Price | 24h Change | Dominance | Market Cap. |
|---|---|---|---|---|
| BTC | 98,838.33 | 2.49% | 57.23% | 1,96 T |
| ETH | 3,287.58 | 2.17% | 11.58% | 396,09 B |
| XRP | 2.848 | 10.58% | 4.77% | 163,79 B |
| SOLANA | 195.12 | 3.67% | 2.77% | 94,70 B |
| DOGE | 0.3655 | 4.16% | 1.58% | 54,11 B |
| CARDANO | 1.0444 | 7.54% | 1.08% | 36,78 B |
| TRX | 0.2276 | 1.54% | 0.57% | 19,62 B |
| AVAX | 38.93 | 7.76% | 0.46% | 15,88 B |
| LINK | 21.14 | 5.16% | 0.39% | 13,50 B |
| SHIB | 0.00002183 | 1.54% | 0.38% | 12,89 B |
| DOT | 6.884 | 6.29% | 0.31% | 10,55 B |
*Prepared on 1.15.2025 at 14:00 (UTC)
WHAT’S LEFT BEHIND
US Consumer Price Index was announced.
(Annual) Announced: 2.9% Exp: 2.9% Previous: 2.7%
(Monthly) Announced: 0.4% Expected: 0.4% Previous: 0.3%
Tether Sues Swan Bitcoin
Tether has sued Swan Bitcoin over alleged breach of contract claims in a Bitcoin mining joint venture, according to Cointelegraph. The dispute stems from disagreements between the parties over obligations and profit-sharing in the project.
Donald Trump’s son Eric Trump,
In an interview, Eric Trump, who is known for his proximity to the cryptocurrency world as well as being the son of Donald Trump, revealed the cryptocurrencies he personally holds. In addition to Bitcoin, Trump holds Ethereum, Solana and SUI.
HIGHLIGHTS OF THE DAY
Important Economic Calender Data
| Time | News | Previous |
|---|---|---|
| 14:20 | US FOMC Member Barkin Speaks | – |
| 15:00 | US FOMC Member Kashkari Speaks | – |
| 16:00 | US FOMC Member Williams Speaks | – |
| 17:00 | US FOMC Member Goolsbee Speaks | – |
| 19:00 | US Beige Book | – |
INFORMATION:
*The calendar is based on UTC (Coordinated Universal Time) time zone. The economic calendar content on the relevant page is obtained from reliable news and data providers. The news in the economic calendar content, the date and time of the announcement of the news, possible changes in the previous, expectations and announced figures are made by the data provider institutions. Darkex cannot be held responsible for possible changes that may arise from similar situations
MARKET COMPASS
We are in a period when macro dynamics continue to play a decisive role in pricing behavior, and on the digital assets front, the highly anticipated US Consumer Price Index (CPI) figures released today were effective. When evaluated together with yesterday’s Producer Price Index (PPI) data, the fact that inflation did not deliver the feared surprise was a factor that increased risk appetite. On a monthly basis, core inflation came in at 0.2% in December, below expectations of 0.3%. While the dollar index and bond yields declined, stock market indices rose globally. Wall Street futures are pointing to a premium opening of over 1.5%.
For the rest of the day, we can expect the positive sentiment to continue to have a positive impact on digital assets. However, it should be noted that there is no change in the expectation that the US Federal Reserve (FED) will only cut interest rates by 25 basis points in the whole of 2025. We only see that the Federal Open Market Committee (FOMC) meeting, where the first rate cut will take place, has shifted from July to June. The main expectation continues to be the actions Trump will take after taking over the White House next week. CPI data, which was decisive for intraday trading, was left behind. FOMC members’ statements and Beige Book details, which may cause relatively low price changes, can be followed.
From the short term to the big picture.
The victory of former President Trump on November 5, which was one of the main pillars of our bullish expectation for the long-term outlook in digital assets, produced a result in line with our predictions. Afterwards, the appointments made by the president-elect and the increasing regulatory expectations for the crypto ecosystem in the US and the emergence of BTC as a reserve continued to take place in our equation as positive variables. Although it is expected to continue at a slower pace, the preservation of expectations that the FED will continue its interest rate cut cycle (for now) and the volume in ETFs based on crypto assets indicating an increase in institutional investor interest support our upward forecast for the big picture for now. In the short term, given the nature of the market and pricing behavior, we think it would not be surprising to see occasional pauses or pullbacks in digital assets. However, at this point, it is worth emphasizing again that we think that the fundamental dynamics continue to be bullish.
TECHNICAL ANALYSIS
BTC/USDT
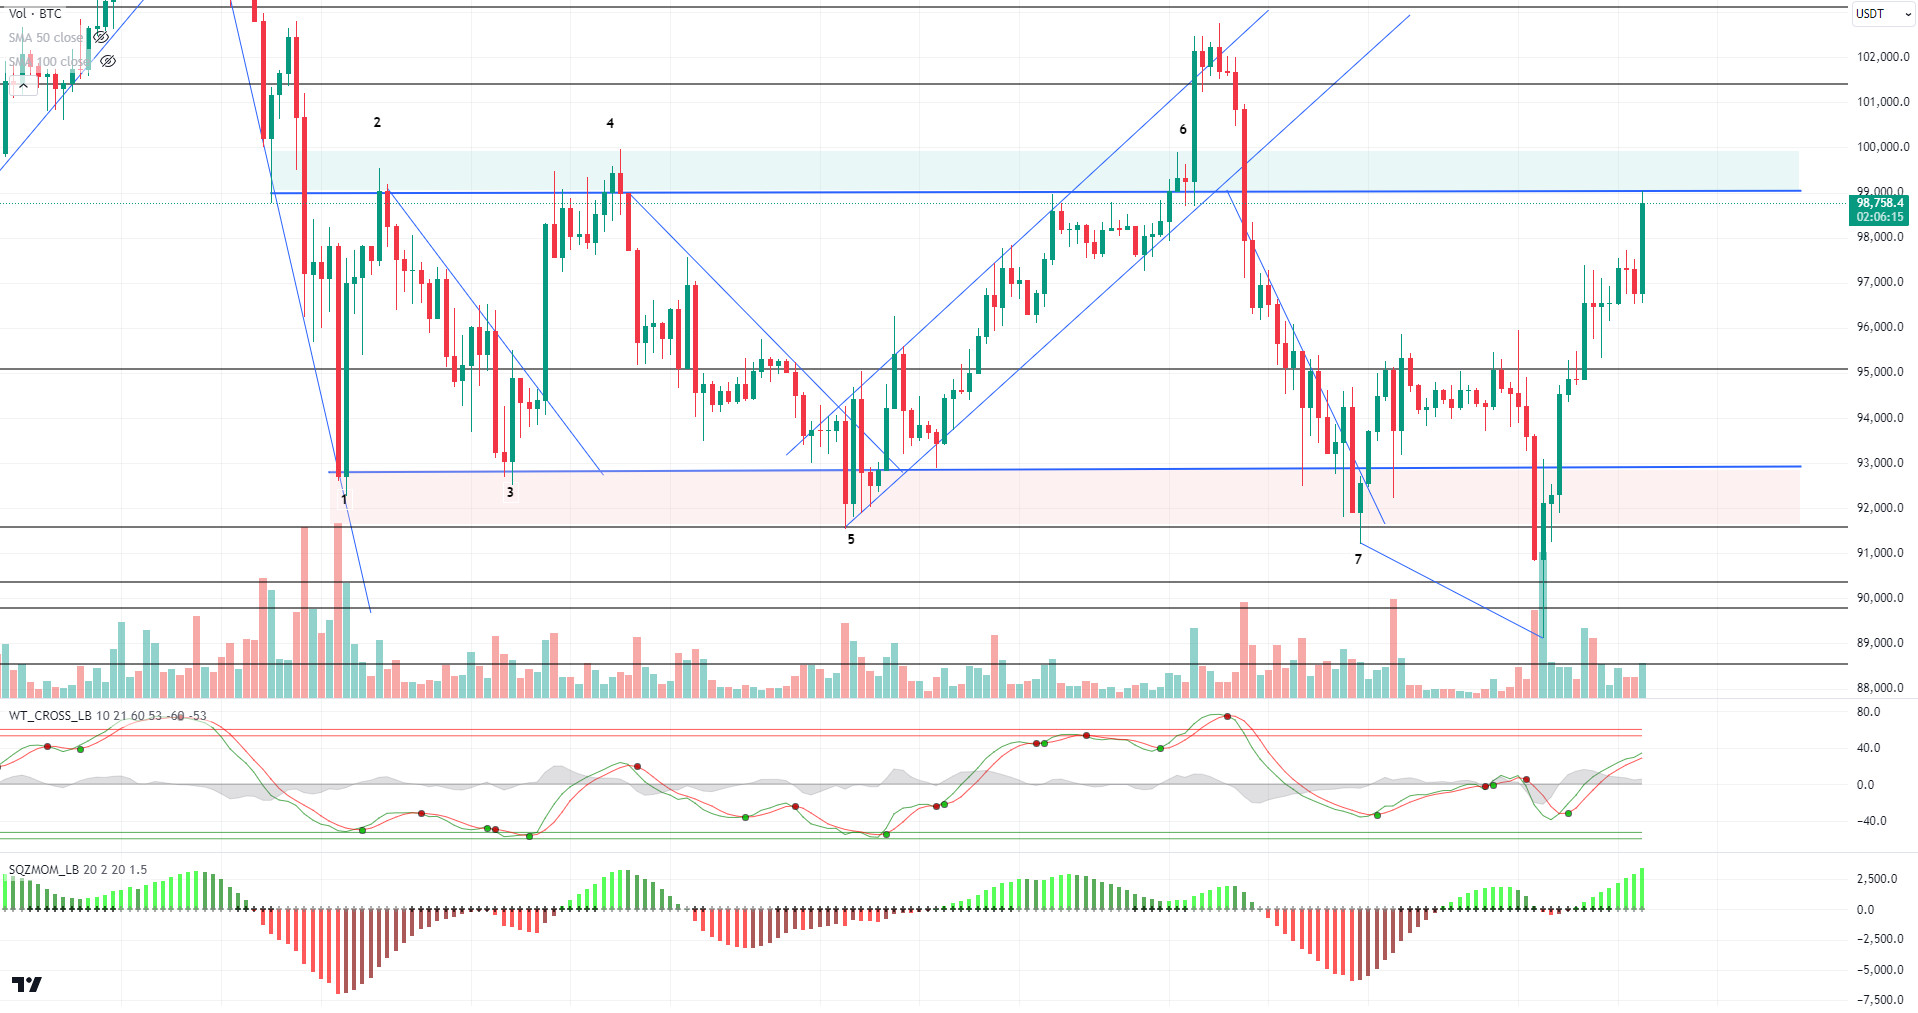
Expectations of volatility in the Bitcoin derivatives market have increased ahead of the inauguration of D. Trump as he prepares for his second presidential term in the US. Although the sentiment among traders seems cautious, it is thought that sharp price movements may occur. On the other hand, eyes were on US critical inflation data today. Bitcoin maintained its gains before the US inflation data. The 2.9% monthly and 0.4% annual inflation data announced within expectations increased volatility in Bitcoin.
When we look at the technical outlook with the latest developments, BTC, which exhibited low volatility before the inflation data, attempted a sharp upward attack after the data. Currently trading at the 99,000 level, BTC’s technical oscillators continue to signal buying, while momentum has increased well. While the liquidation of short transactions in the weekly liquidation chart we mentioned in the previous analysis, we will follow the closes above the 99,100 resistance level in the continuation of the rise, but we will follow the price to settle in the green zone. In case of correction after the impact of the news, 97,200 is our minor support level.
Supports: 97,200 – 95,000 – 92,800
Resistances: 98,100 – 99,100 – 101,400
ETH/USDT
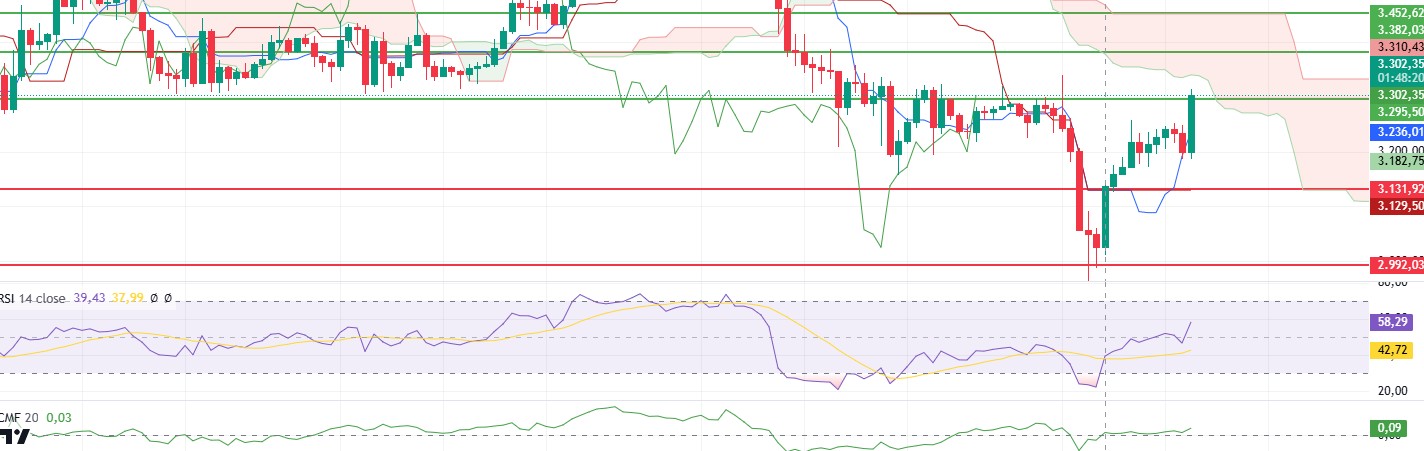
With the US Consumer Price Index coming in line with expectations, Ethereum made a rapid rise, avoiding possible negative effects managed to exceed the 3,300 resistance. It can be said that market participants are acting on optimistic expectations that inflation is under control.
Looking at the technical indicators, the Relative Strength Index (RSI) continues to rise, indicating a strong buying momentum as long as the price does not approach the overbought zone. The Ethereum price surpassing the 3,293 level also helps to eliminate the current negative divergence. Looking at the Ichimoku indicator, the lower band of the kumo cloud is rising and the tenkan level is moving away from the kijun level, indicating that the uptrend is strengthening. These indicators increase the potential for the price to move further upwards. Cumulative Volume Delta (CVD) data also shows that Ethereum’s recent rally has been supported by strong buying not only in the futures market but also in the spot market. This could be interpreted as a sign that the uptrend will be sustainable.
As a result, Ethereum price can be expected to surpass the 3,293 level and accelerate towards higher targets with the positive outlook in metrics. However, if the price makes a fake-out here and pulls back to close below 3,293, a potential decline towards 3,200 levels is possible. Therefore, a break of this resistance level would be a critical threshold for the direction of the trend.
Supports 3,131 – 2,992 – 2,890
Resistances 3,293 – 3,382 – 3,452
XRP/USDT
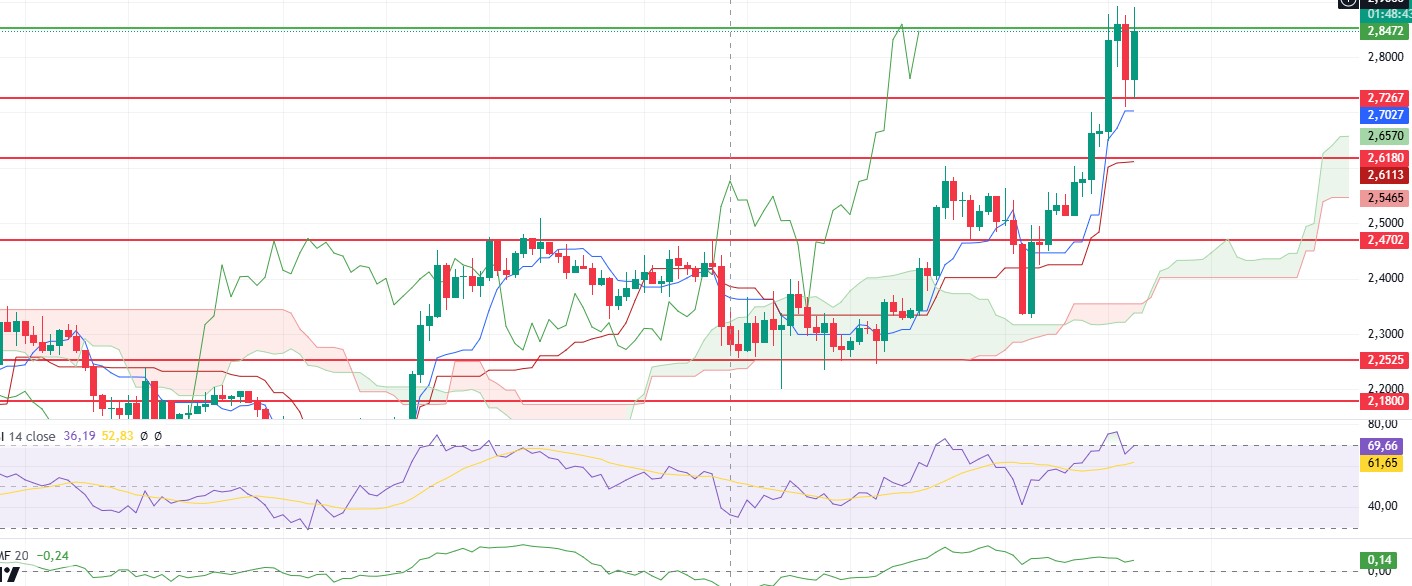
XRP is attracting attention by continuing its uptrend as ETF expectations gain strength. With yesterday’s move, XRP surpassed the resistance levels of 2.61 and 2.72 with volume and managed to climb as high as 2.85. As of today, the price is trading around 2.86 USD.
Although positive expectations about the ETF have the potential to push the price higher, some technical indicators suggest caution. In particular, the upside breakout of the descending triangle pattern is a positive signal, while the RSI indicator has reached overbought territory and the price is in an important resistance area, increasing the possibility of a pullback. In addition, as mentioned in the morning analysis, the Chaikin Money Flow (CMF) indicator failed to fully support the upside, highlighting the risk of a short-term correction. However, if the positive news flow continues and the XRP price breaks the 2.85 level, this could trigger a stronger uptrend.
In summary, if XRP breaks the 2.85 resistance, the price is likely to test higher levels. However, staying below this level or a pullback after a fake upside breakout may bring a decline towards 2.55 levels. Therefore, price movements in the critical resistance zone should be carefully monitored.
Supports 2.7268 – 2.6180 – 2.4702
Resistances 2.8580 – 2.9851 – 3.1991
SOL/USDT
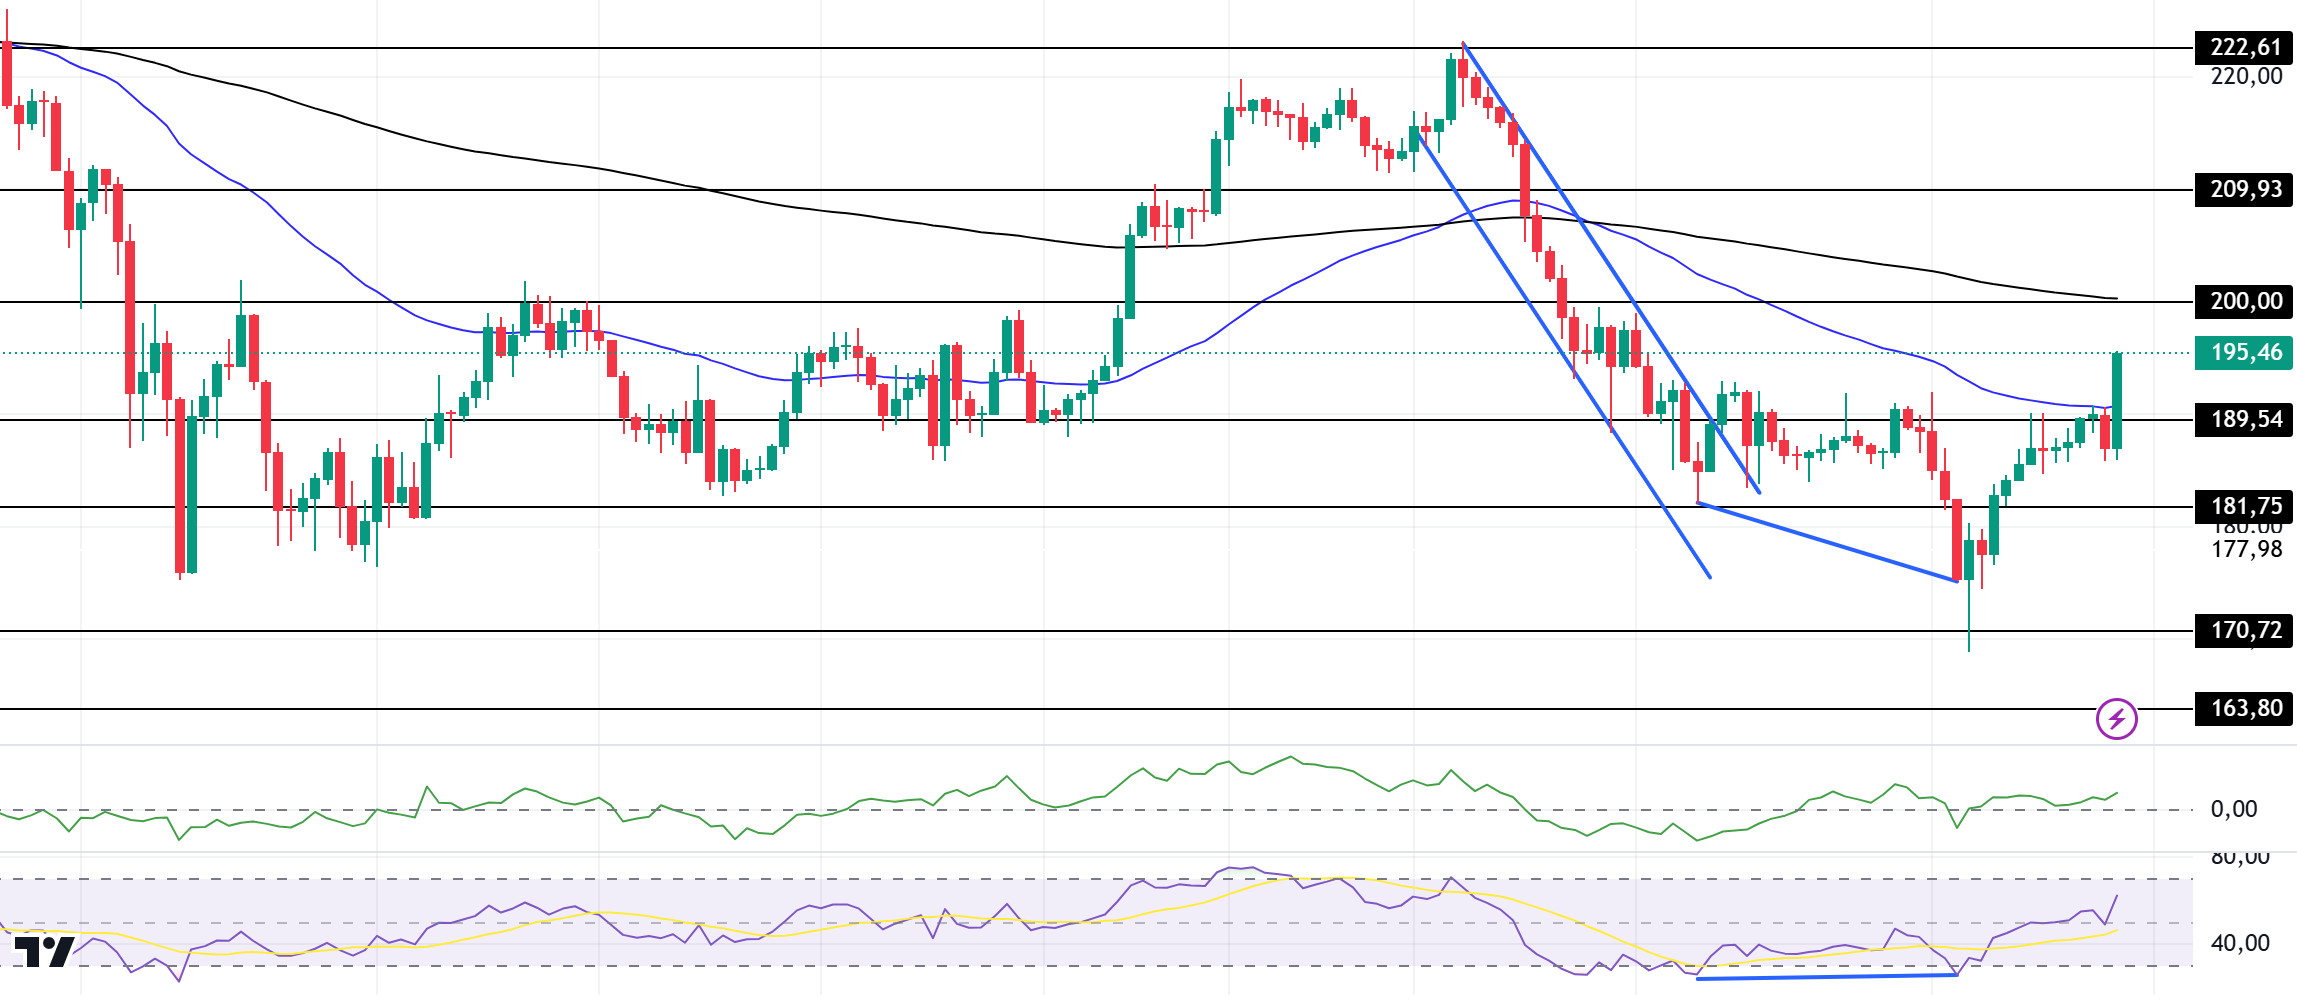
Solana has been slightly bearish since our analysis in the morning. On the 4-hour timeframe, the 50 EMA (Blue Line) continues to be below the 200 EMA (Black Line). At the same time, the 50 EMA worked as resistance to the asset and the asset experienced a 2.24% retracement. However, the fact that the inflation data from the US did not come above expectations had a positive impact on the market and had a positive impact on the asset. When we examine the Chaikin Money Flow (CMF)20 indicator, we see that it is in the positive zone but money inflows have decreased. However, the Relative Strength Index (RSI)14 indicator is at neutral level from positive level. At the same time, positive mismatch seems to have worked. The 200.00 level appears to be a very strong resistance point in the rises driven by both the upcoming macroeconomic data and the news in the Solana ecosystem. If it breaks here, the rise may continue. In case of retracements for the opposite reasons or due to profit sales, the 163.80 support level can be triggered. If the price comes to these support levels, a potential bullish opportunity may arise if momentum increases.
Supports 189.54 – 181.75 – 170.72
Resistances 200.00 – 209.93 – 222.61
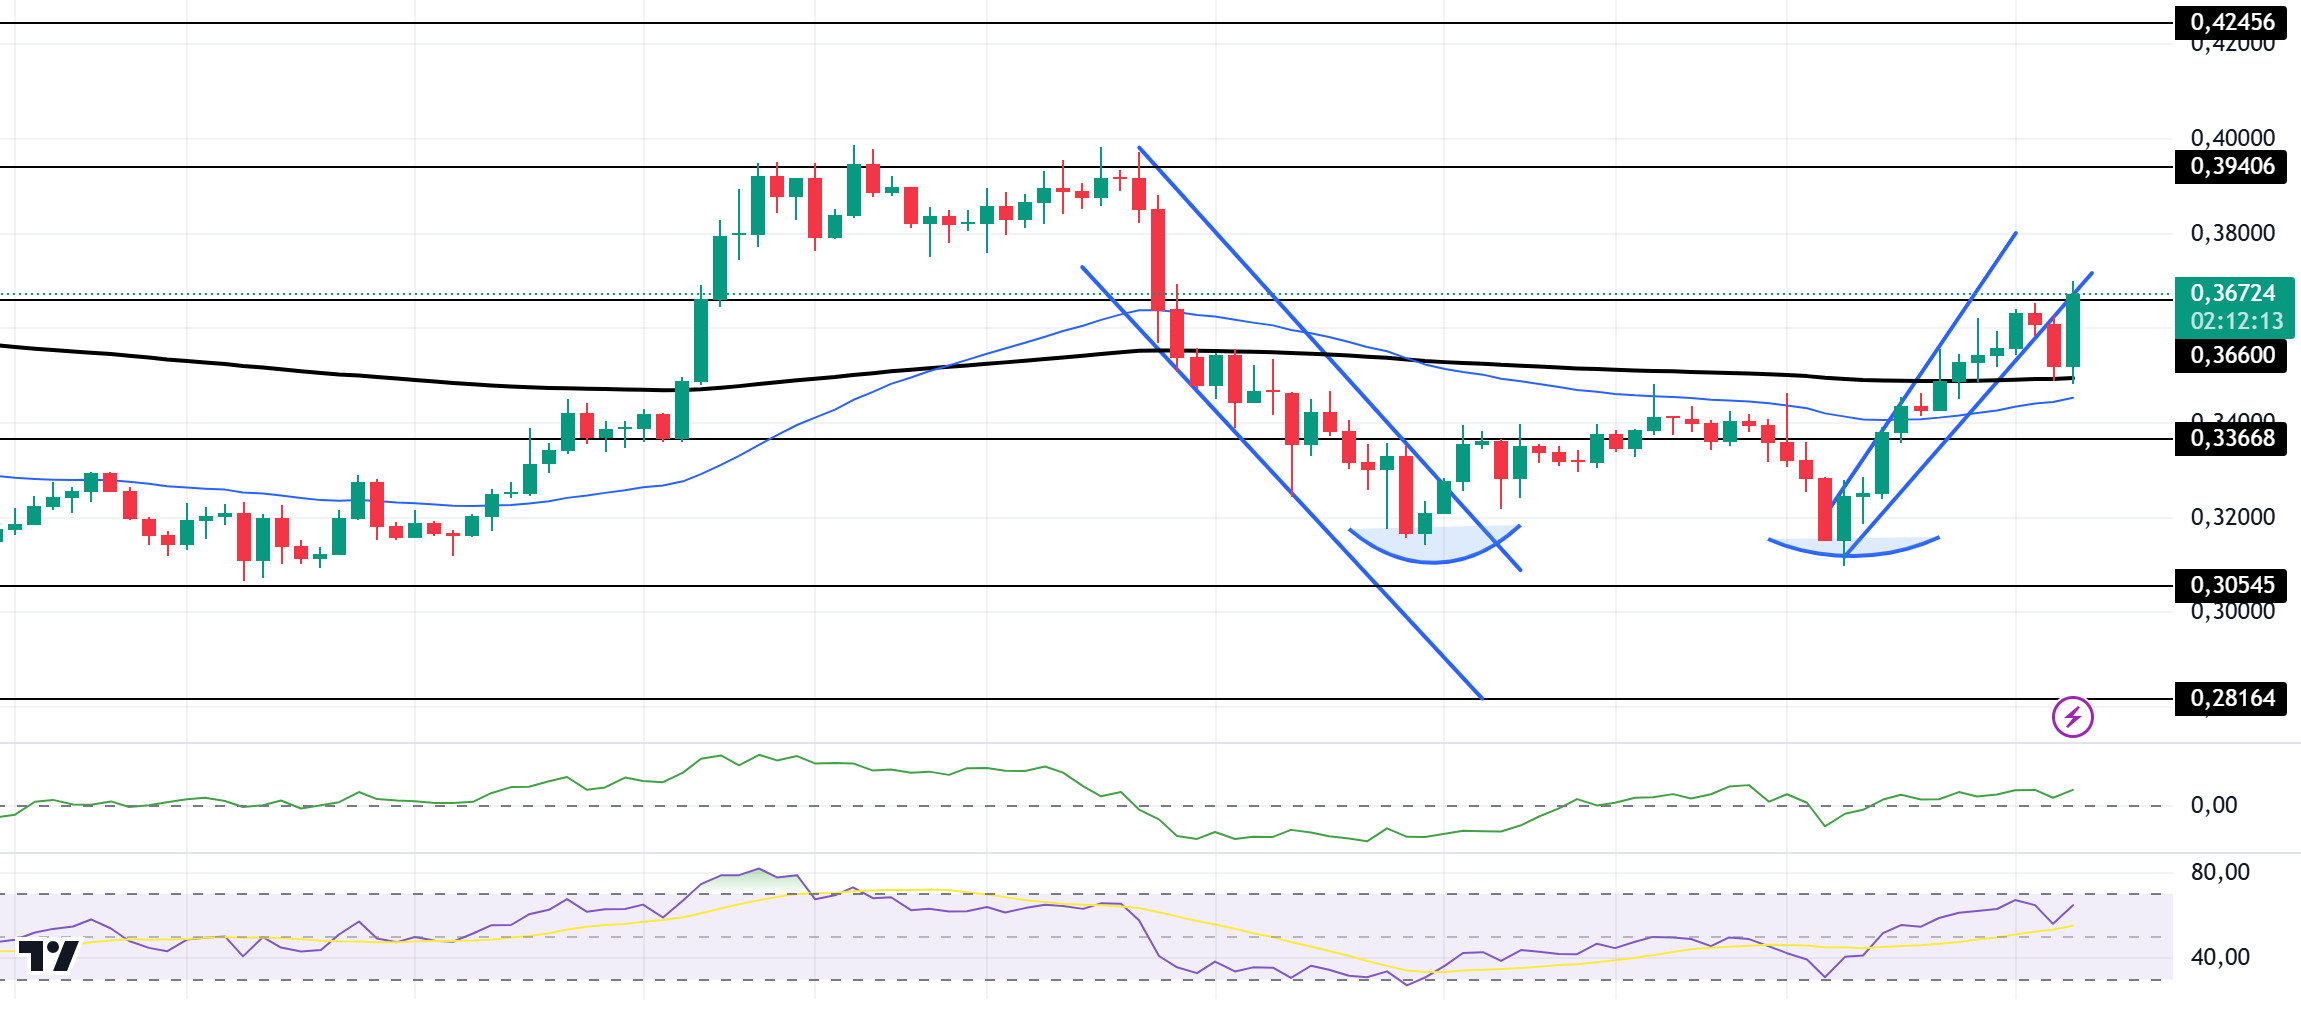
DOGE/USDT
Doge has been bearish since our analysis in the morning. When we look at the chart, the asset broke the 50 EMA (Blue Line) and 200 EMA (Black Line) upwards in the 4-hour timeframe, and while the 200 EMA was working as support for the asset at the time of writing, the inflation data from the US did not come above expectations, which had a positive impact on the market and had a positive effect on the asset. Thus, the asset increased by about 5.5% from the 200 EMA support at the time of writing. However, it seems to have broken the rising wedge pattern downwards. This may be a sign that the price will retreat again. On the other hand, a double bottom pattern has formed. When we examine the Chaikin Money Flow (CMF)20 indicator, it is in positive territory and inflows are stable. However, Relative Strength Index (RSI)14 retreated slightly from the overbought zone and the bulge was removed. The 0.39406 level appears to be a very strong resistance point in the rises due to political reasons, macroeconomic data and innovations in the DOGE coin. In case of possible pullbacks due to political, macroeconomic reasons or negativities in the ecosystem, the 0.28164 level, which is the base level of the trend, is an important support. If the price reaches these support levels, a potential bullish opportunity may arise if momentum increases.
Supports 0.33668 – 0.30545 – 0.28164
Resistances 0.36600 – 0.39406 – 0.42456
LEGAL NOTICE
The investment information, comments and recommendations contained herein do not constitute investment advice. Investment advisory services are provided individually by authorized institutions taking into account the risk and return preferences of individuals. The comments and recommendations contained herein are of a general nature. These recommendations may not be suitable for your financial situation and risk and return preferences. Therefore, making an investment decision based solely on the information contained herein may not produce results in line with your expectations.

