MARKET SUMMARY
Latest Situation in Crypto Assets
| Assets | Last Price | 24h Change | Dominance | Market Cap. |
|---|---|---|---|---|
| BTC | 102,731.22 | 3.60% | 56.30% | 2,03 T |
| ETH | 3,410.27 | 2.11% | 11.34% | 409,33 B |
| XRP | 3.230 | -2.34% | 5.13% | 185,28 B |
| SOLANA | 221.37 | 4.94% | 2.97% | 107,34 B |
| DOGE | 0.4065 | 7.20% | 1.67% | 60,03 B |
| CARDANO | 1.104 | 1.54% | 1.08% | 38,83 B |
| TRX | 0.2456 | 2.52% | 0.59% | 21,13 B |
| AVAX | 40.91 | 2.79% | 0.47% | 16,83 B |
| LINK | 23.99 | 3.38% | 0.42% | 15,29 B |
| SHIB | 0.00002416 | 7.83% | 0.39% | 14,23 B |
| DOT | 7.345 | 1.86% | 0.31% | 11,28 B |
*Prepared on 1.17.2025 at 14:00 (UTC)
WHAT’S LEFT BEHIND
DeFi and Crypto Lending Report from EBA and ESMA
The European Banking Authority (EBA) and the European Securities and Markets Authority (ESMA) published a joint report analyzing DeFi and crypto lending and staking practices. The report stated that DeFi is still a niche phenomenon, with the total value locked in DeFi protocols accounting for 4% of the global crypto market.
Bhutan Transfers Another 377.78 BTC
According to Onchain Lens, the Royal Government of Bhutan transferred 377.78 BTC with a total value of $38.57 million to two different wallets. Having transferred a total of 633,047 BTC (about $64.57 million) in the last hour, Bhutan now holds 11,055 BTC ($1.13 billion).
US Crypto Miners Double Bitcoin Assets
According to CoinDesk, TheMiningMag data shows that publicly traded crypto mining companies in the US doubled their Bitcoin holdings in one year. By the end of 2024, they totalled 92,473 BTC, worth $8.6 billion. The largest share among these companies belongs to MARA Holdings with 44,893 BTC.
HIGHLIGHTS OF THE DAY
Important Economic Calender Data
*There is no important calendar data for the rest of the day
INFORMATION
*The calendar is based on UTC (Coordinated Universal Time) time zone.
The economic calendar content on the relevant page is obtained from reliable news and data providers. The news in the economic calendar content, the date and time of the announcement of the news, possible changes in the previous, expectations and announced figures are made by the data provider institutions. Darkex cannot be held responsible for possible changes that may arise from similar situations
MARKET COMPASS
Wall Street indices, which ended their three-day rising streak with yesterday’s session, are preparing to make a positive start to the last trading day of the week. After the PPI, CPI and retail sales data, which fell below expectations this week, the recent rise in the US dollar and bond yields had come to a halt. While the markets continue to focus on the US Federal Reserve’s (FED) interest rate cut course, the policies to be implemented by Trump, who will take office on Monday, are eagerly awaited. Digital assets are feeling the impact of the slightly reduced risk of the FED ending interest rate cuts, while continuing the “Trump Trade” euphoria. In addition, the excitement of regulation and new crypto asset ETF applications continues.
Later in the day, over the weekend and early Monday, the “Trump” agenda will be important for the value of digital assets. According to the WSJ, Donald Trump has already issued nearly 100 executive orders as he aims to move quickly after Monday’s inauguration. Among them is one that elevates crypto to a policy priority and gives industry insiders a voice in his administration, people close to the matter said. So, while we may see some breathing space due to the nature of the market, we continue to see more upside potential in digital assets in the short term.
From the short term to the big picture…
The victory of former President Trump on November 5, which was one of the main pillars of our bullish expectation for the long-term outlook in digital assets, produced a result in line with our predictions. Afterwards, the appointments made by the president-elect and the increasing regulatory expectations for the crypto ecosystem in the US and the emergence of BTC as a reserve continued to take place in our equation as positive variables. Although it is expected to continue at a slower pace, the expectations that the FED will continue its interest rate cut cycle (for now) and the volume in ETFs based on crypto assets indicating an increase in institutional investor interest support our upward forecast for the big picture for now. In the short term, given the nature of the market and pricing behavior, we think it would not be surprising to see occasional pauses or pullbacks in digital assets. However, at this point, it is worth emphasizing again that we think that the fundamental dynamics continue to support the rise.
TECHNICAL ANALYSIS
BTC/USDT
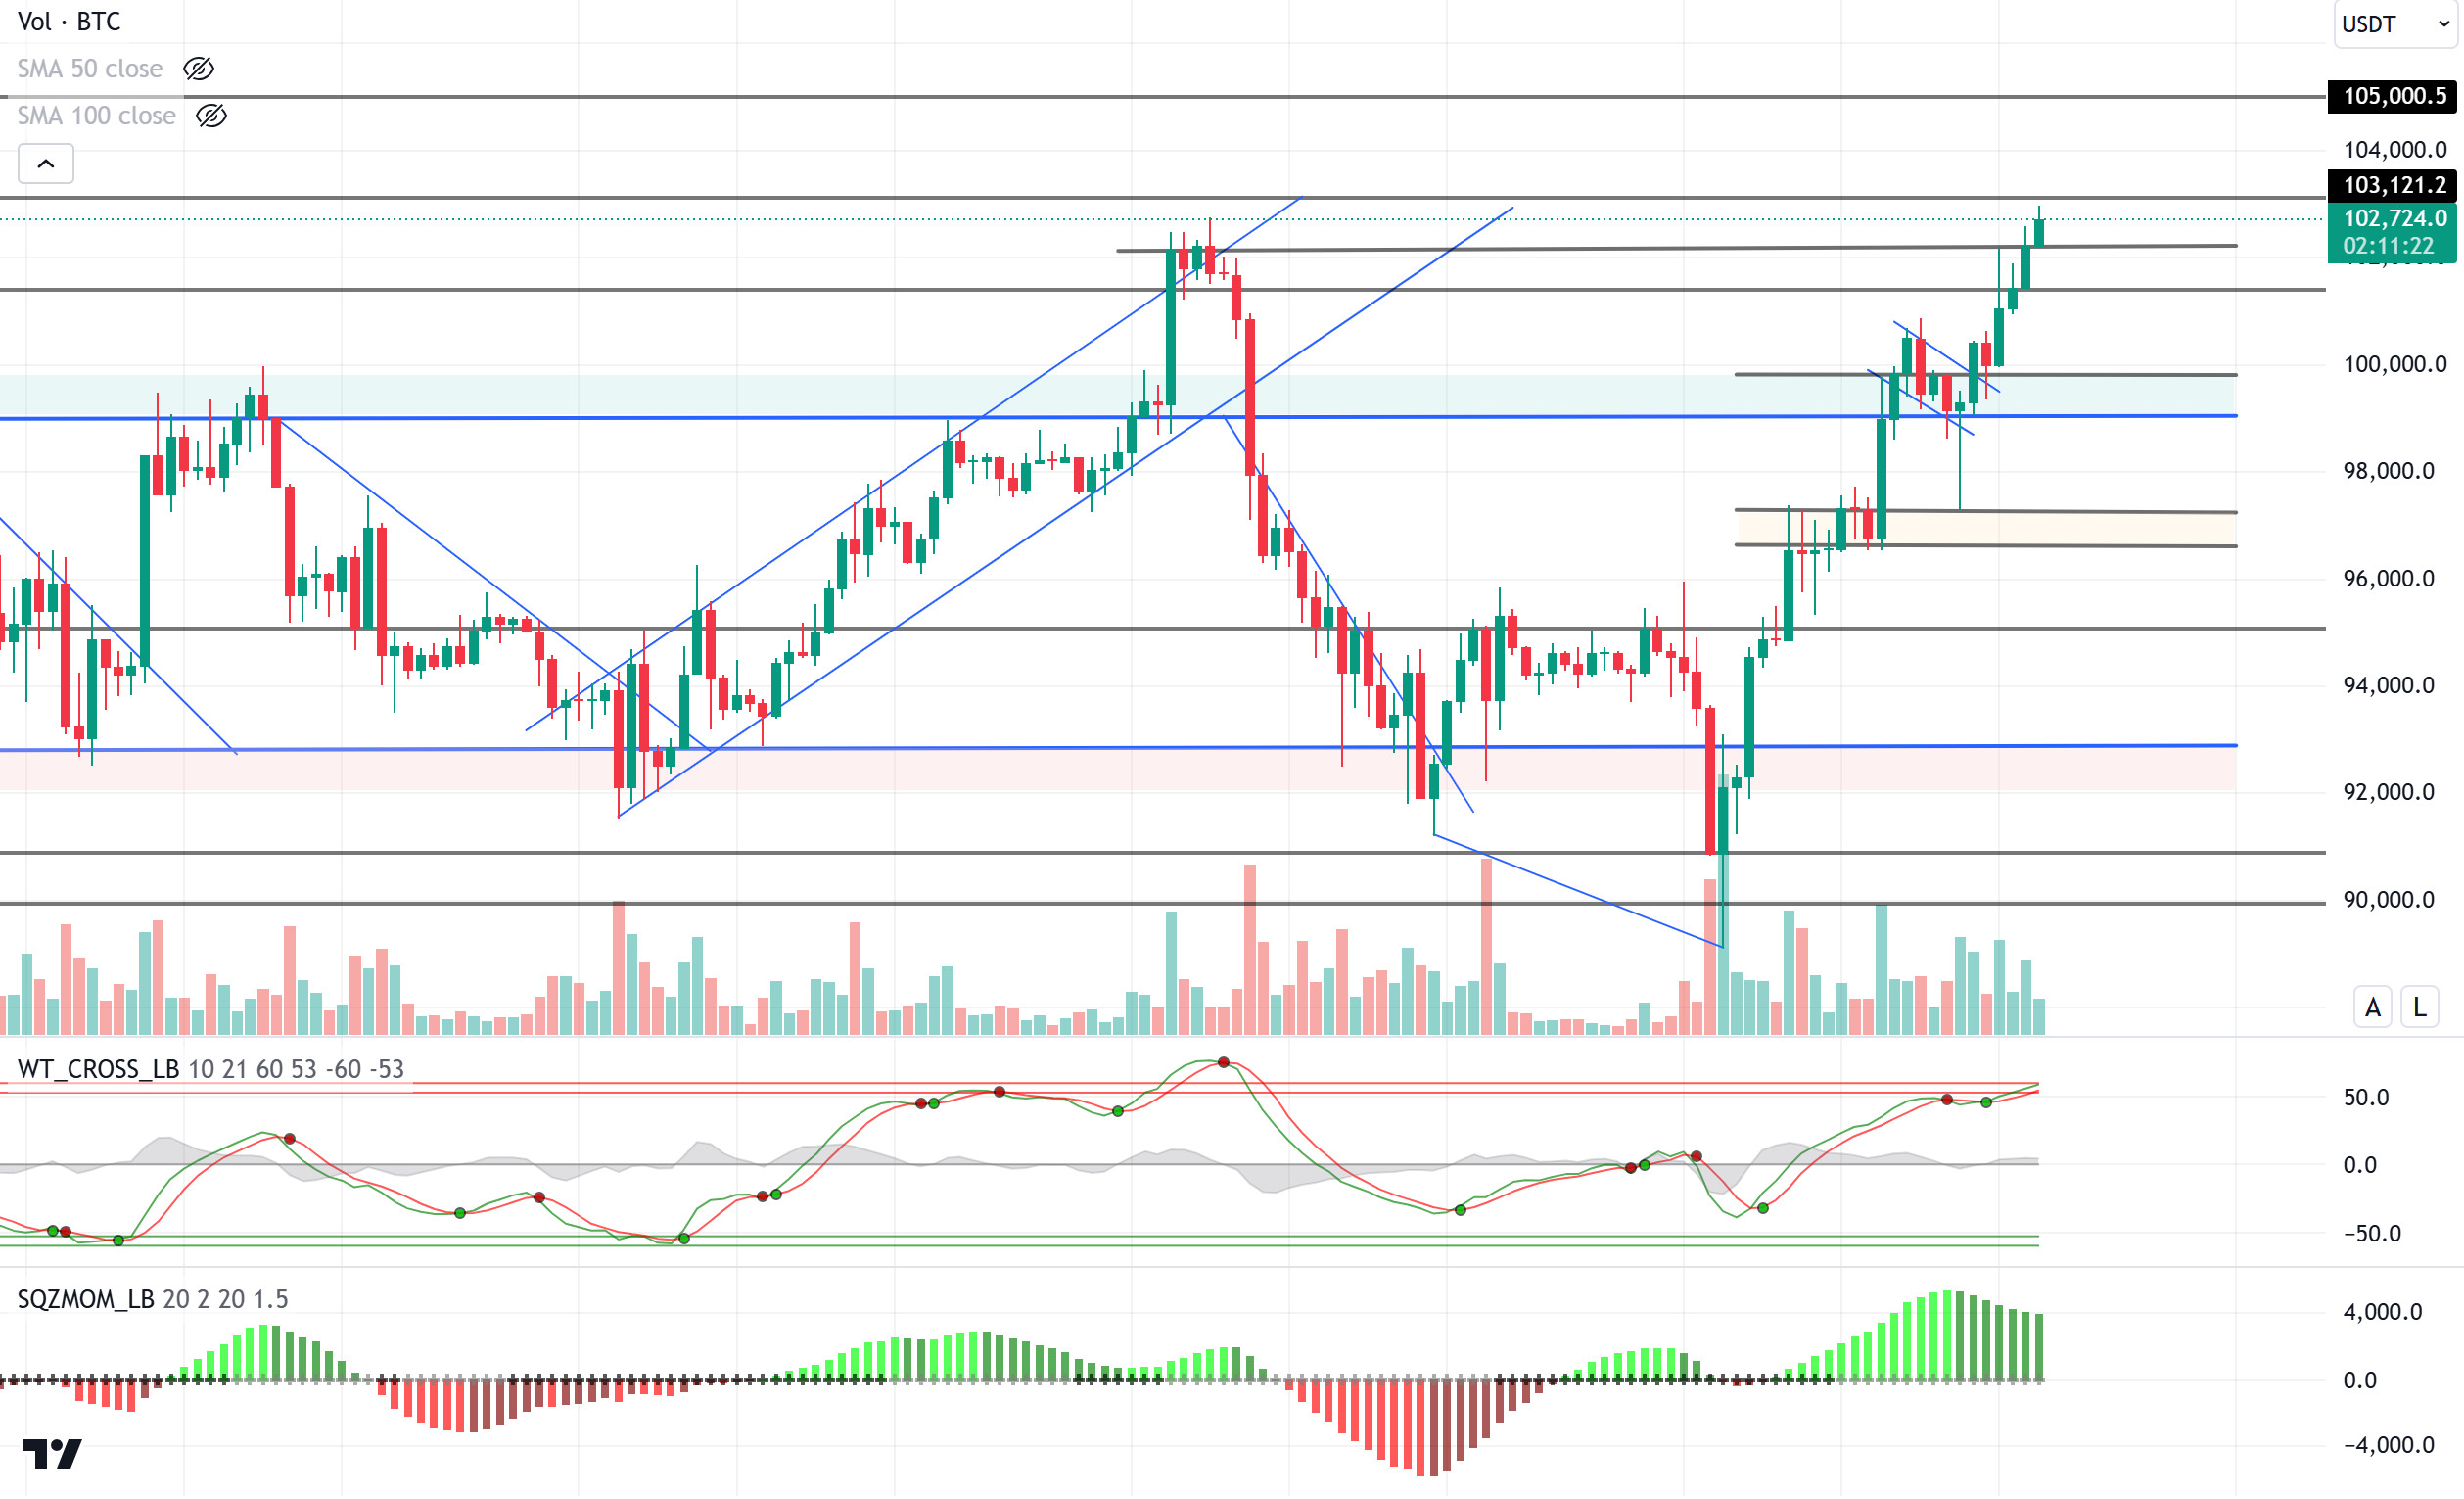
The rise in the dominance of Bitcoin, which is on its way to becoming a reserve currency, may continue to suppress altcoin markets in the coming period. Increasing institutional acceptance, Bitcoin’s limited supply and low volatility stand out among the main reasons for the rise in dominance. With the BTC.D ratio, which has been moving between 55% and 60% for a while, exceeding this band in the coming period and rising above 60% again, new ATH levels may come to the agenda in the medium term.
When we look at the technical outlook, we see that the rise in BTC continues with the effect of optimistic weather. With the momentum gained in the upward direction, it is currently testing the 103,000 level, which is the next resistance level, with the crossing of the 101,400 point, which appears as the resistance level. We observe that the technical oscillators continue to signal buying in the overbought zone and the momentum has weakened somewhat. In the continuation of the rise, the implied volatility (IV) of short-term options, which we mentioned in the previous analysis, may exhibit an upward trend towards the 105,000 level, as a matter of fact, short transactions at these levels draw attention on the weekly liquidation chart. In a possible correction, we will follow the 101,400 point, which is the minor support level, and in case of a break, we expect the 99,100 level to work as a support zone.
Supports: 101,400 – 99,100 – 97,200
Resistances: 103,000 -105,000 – 108,000
ETH/USDT
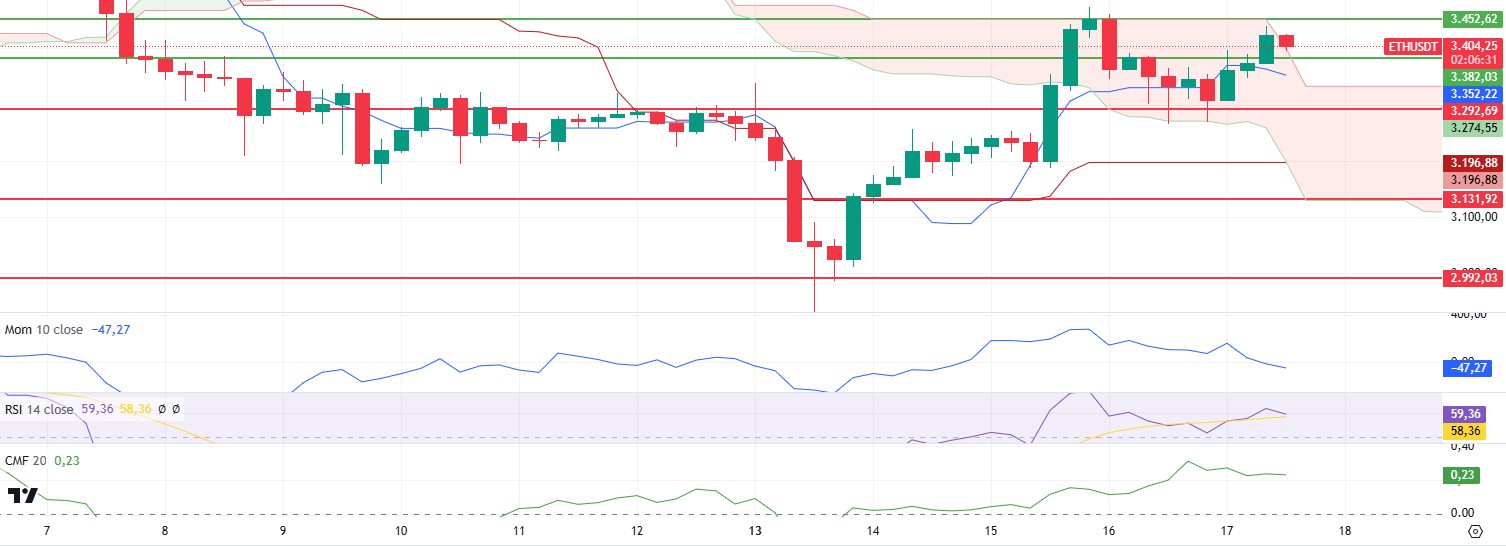
As predicted in the morning analysis, ETH managed to break the 3,382-resistance level and rise above the 3,400 level and continues to price in this region. This rally, driven by market optimism led by Bitcoin, shows that Ethereum maintains its upside potential. However, the current price action points to a critical decision point in both technical indicators and price levels.
From a technical perspective, the Ichimoku indicator provides important information. The fact that the price remains above the kumo cloud suggests a positive outlook, while the kijun line remains stable and the tenkan line is heading down suggests that the short-term momentum is weakening. This could be taken as a sign that the uptrend may lose momentum. However, the weakness seen in the RSI and momentum indicators supports that the price may experience a consolidation or pullback at current levels. The Chaikin Money Flow (CMF) indicator, on the other hand, diverges from this outlook, indicating that buyer interest in the market is still strong, and the upward movement is supported. CMF’s upward movement indicates that selling pressure remains low, confirming that optimism remains in the market.
Taken together, these technical indicators and price action suggest that ETH could rise as high as 3,452. However, the weakness in the indicators may make this level difficult to breach in the short term and may cause the price to fluctuate or retrace in this region for a while. If the 3.452 level is exceeded, a new uptrend can be expected to start in the market, which may pave the way for the price to reach higher levels. On the other hand, a downside break of the 3,382 level could lead to a pullback movement towards the main support zone of 3,292. Despite the weakness in indicators, CMF’s positive outlook reinforces the possibility that the current pullbacks may remain limited and buyers may maintain their dominance over the market.
Supports 3,382 – 3,292 – 3,131
Resistances 3,452 – 3,565 – 3,726
XRP/USDT
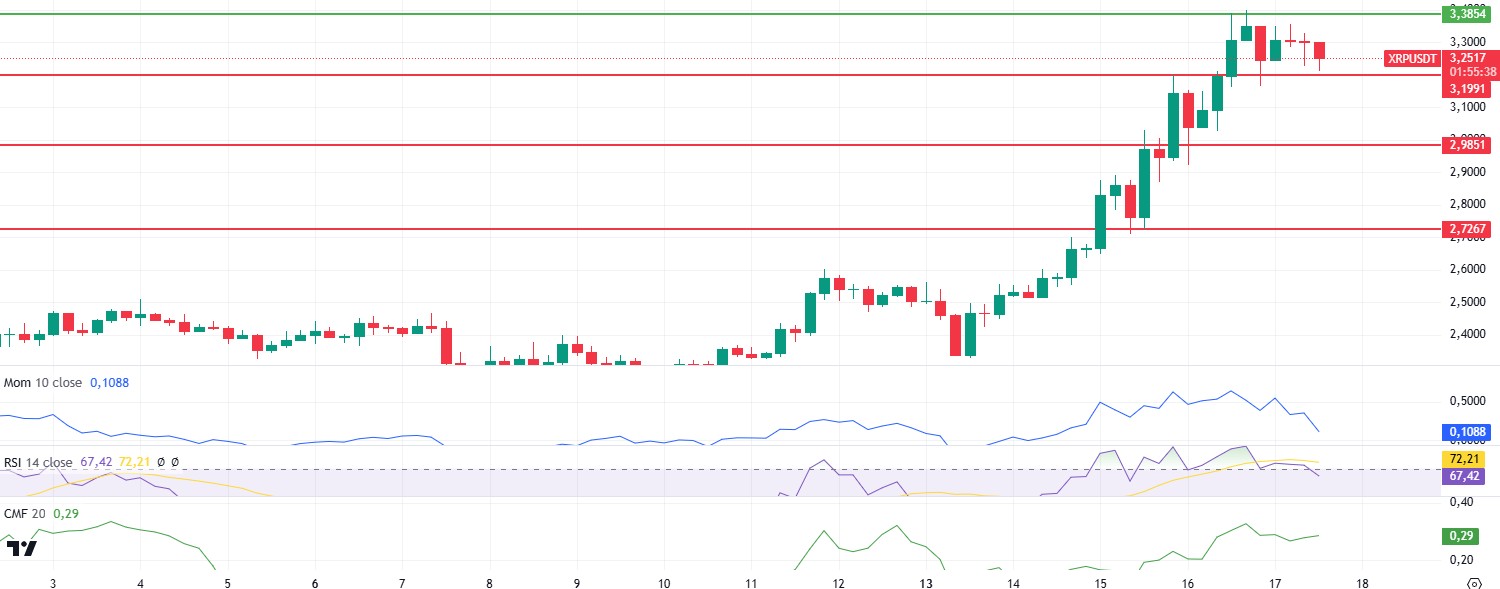
While XRP was priced between 3.38 and 3.19 levels as expected during the day, it has fallen to $3.24 with a slight pullback in recent hours.
When technical indicators are analyzed, it is seen that momentum has weakened after the last bullish move and the RSI has moved out of the overbought zone and headed down. Slight pullbacks in the price can be expected in the face of this situation, which is interpreted as important signals that buyers are losing strength and the price may remain under further pressure. Chaikin Money Flow (CMF), on the other hand, remains in the positive zone, indicating that money inflows to the market continue, albeit limited. However, if the positive outlook weakens, the pressure on the price may increase.
In light of the current data, it can be said that the price has the potential for a further pullback. In particular, the loss of 3.19 support may lead the price to make a correction movement down to 2.98 levels. This level can be expected to create a strong buyer reaction. On the other hand, a break of the 3.38 level may allow the price to gain upside momentum and target higher resistance points.
Supports 3.1991 – 2.9851 – 2.7268
Resistances 3.3854 – 3.5039- 3.7057
SOL/USDT
After the launch of the Solana mobile staking app, Sol Strategies share price increased by 27%. Oncahin, Solana future Open Interest reached a new record, reaching $6.66 billion.
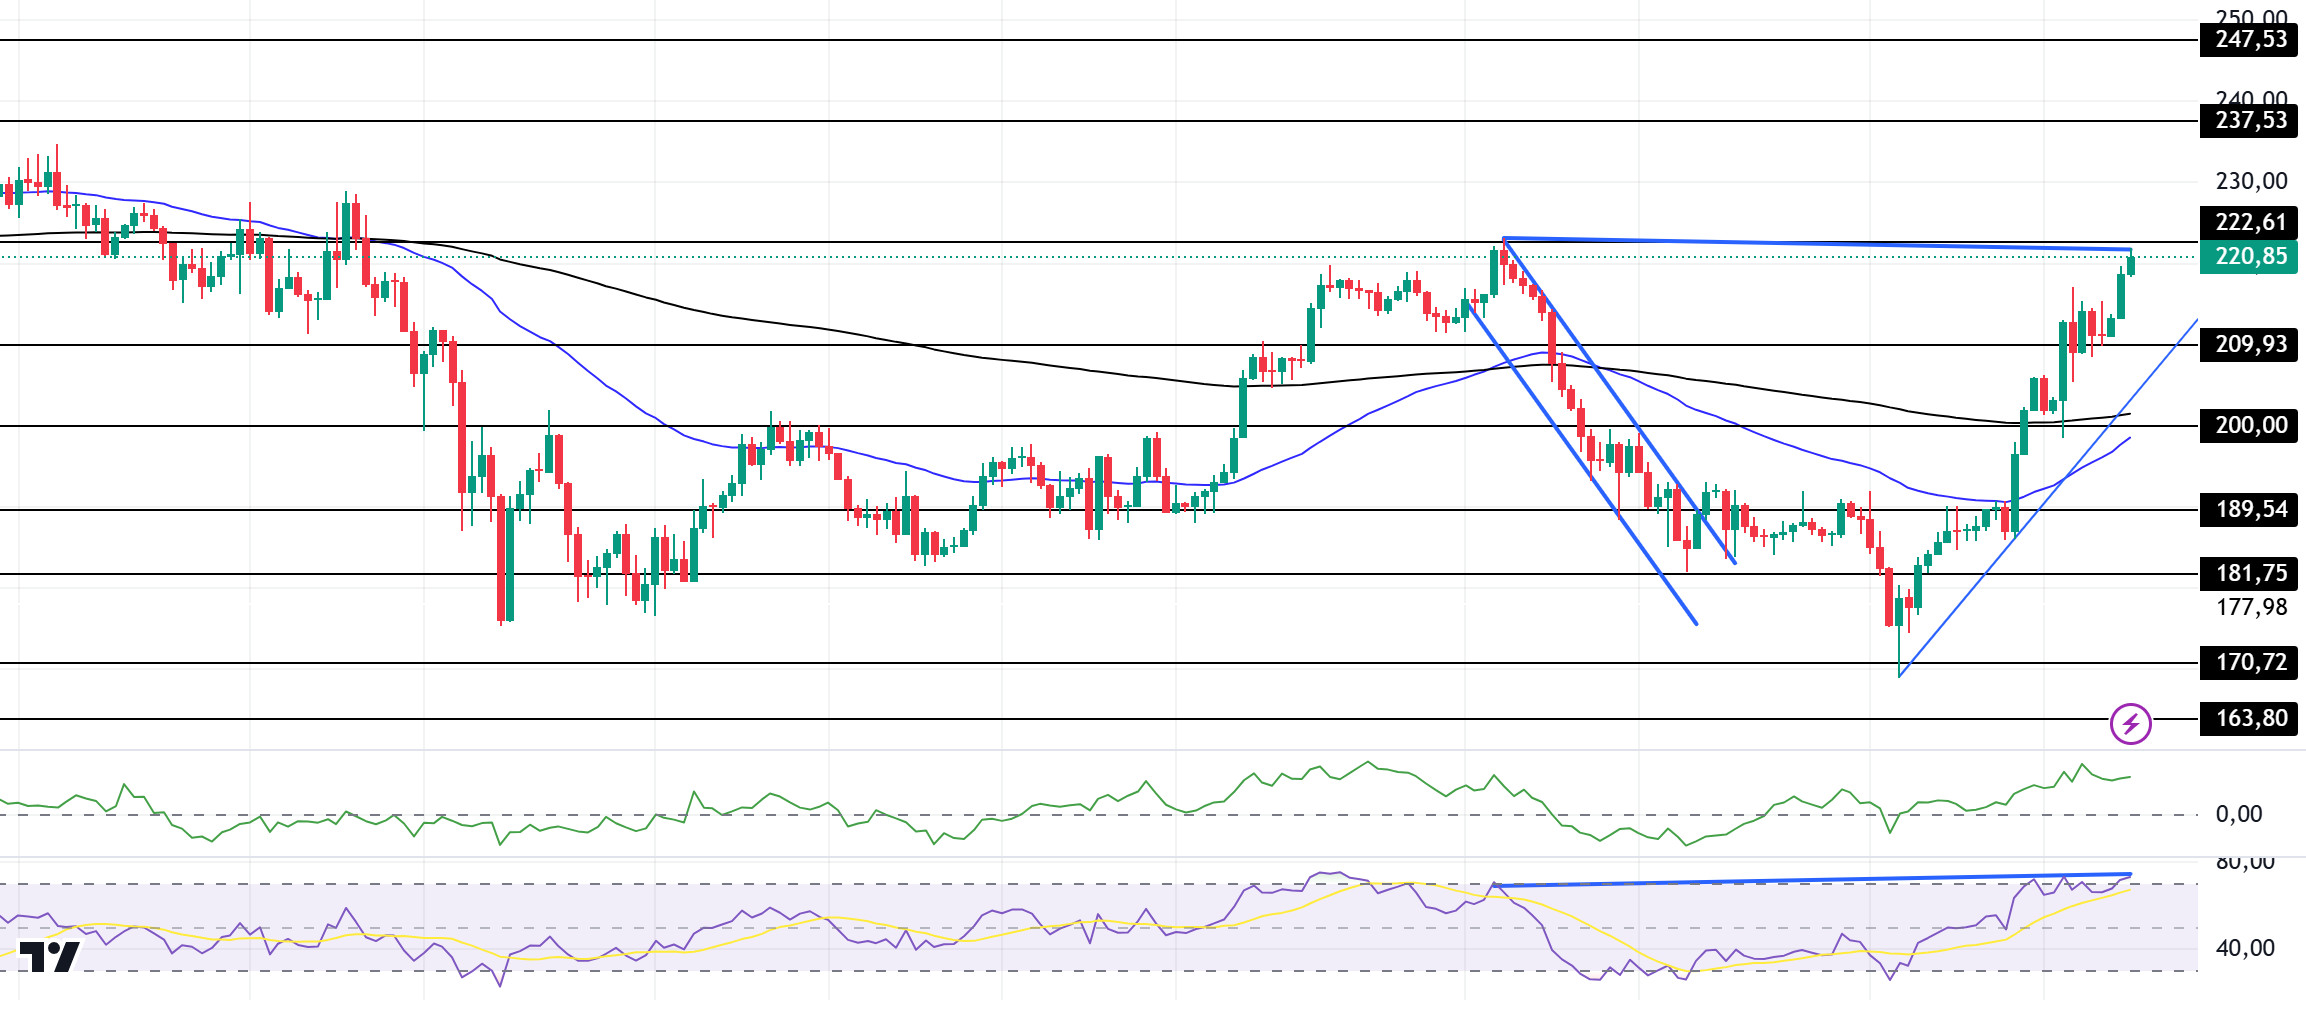
Due to the RSI’s excessive bullishness from its left upward acceleration, it moved sideways and removed this bullishness. Thus, it found an opportunity to rise again. Since our analysis in the morning, the uptrend has continued and managed to stay above 209.93. On the 4-hour timeframe, the 50 EMA (Blue Line) continues to be below the 200 EMA (Black Line). At the same time, the asset is above the 50 EMA and the 200 EMA. This suggests that the uptrend may continue in the short term. When we examine the Chaikin Money Flow (CMF)20 indicator, it is in positive territory and inflows have reached saturation and started to decrease. This may cause some pullback. However, the Relative Strength Index (RSI)14 indicator is at the overbought level. However, the negative mismatch is noteworthy. This could push the price down to the level of the moving averages. The 222.61 level is a very strong resistance point in the uptrend driven by both the upcoming macroeconomic data and the news in the Solana ecosystem. If it breaks here, the rise may continue. In case of retracements for the opposite reasons or due to profit sales, the 200.00 support level can be triggered. If the price comes to these support levels, a potential bullish opportunity may arise if momentum increases.
Supports 209.93 – 200.00 – 189.54
Resistances 222.61 – 237.53 – 247.53
DOGE/USDT
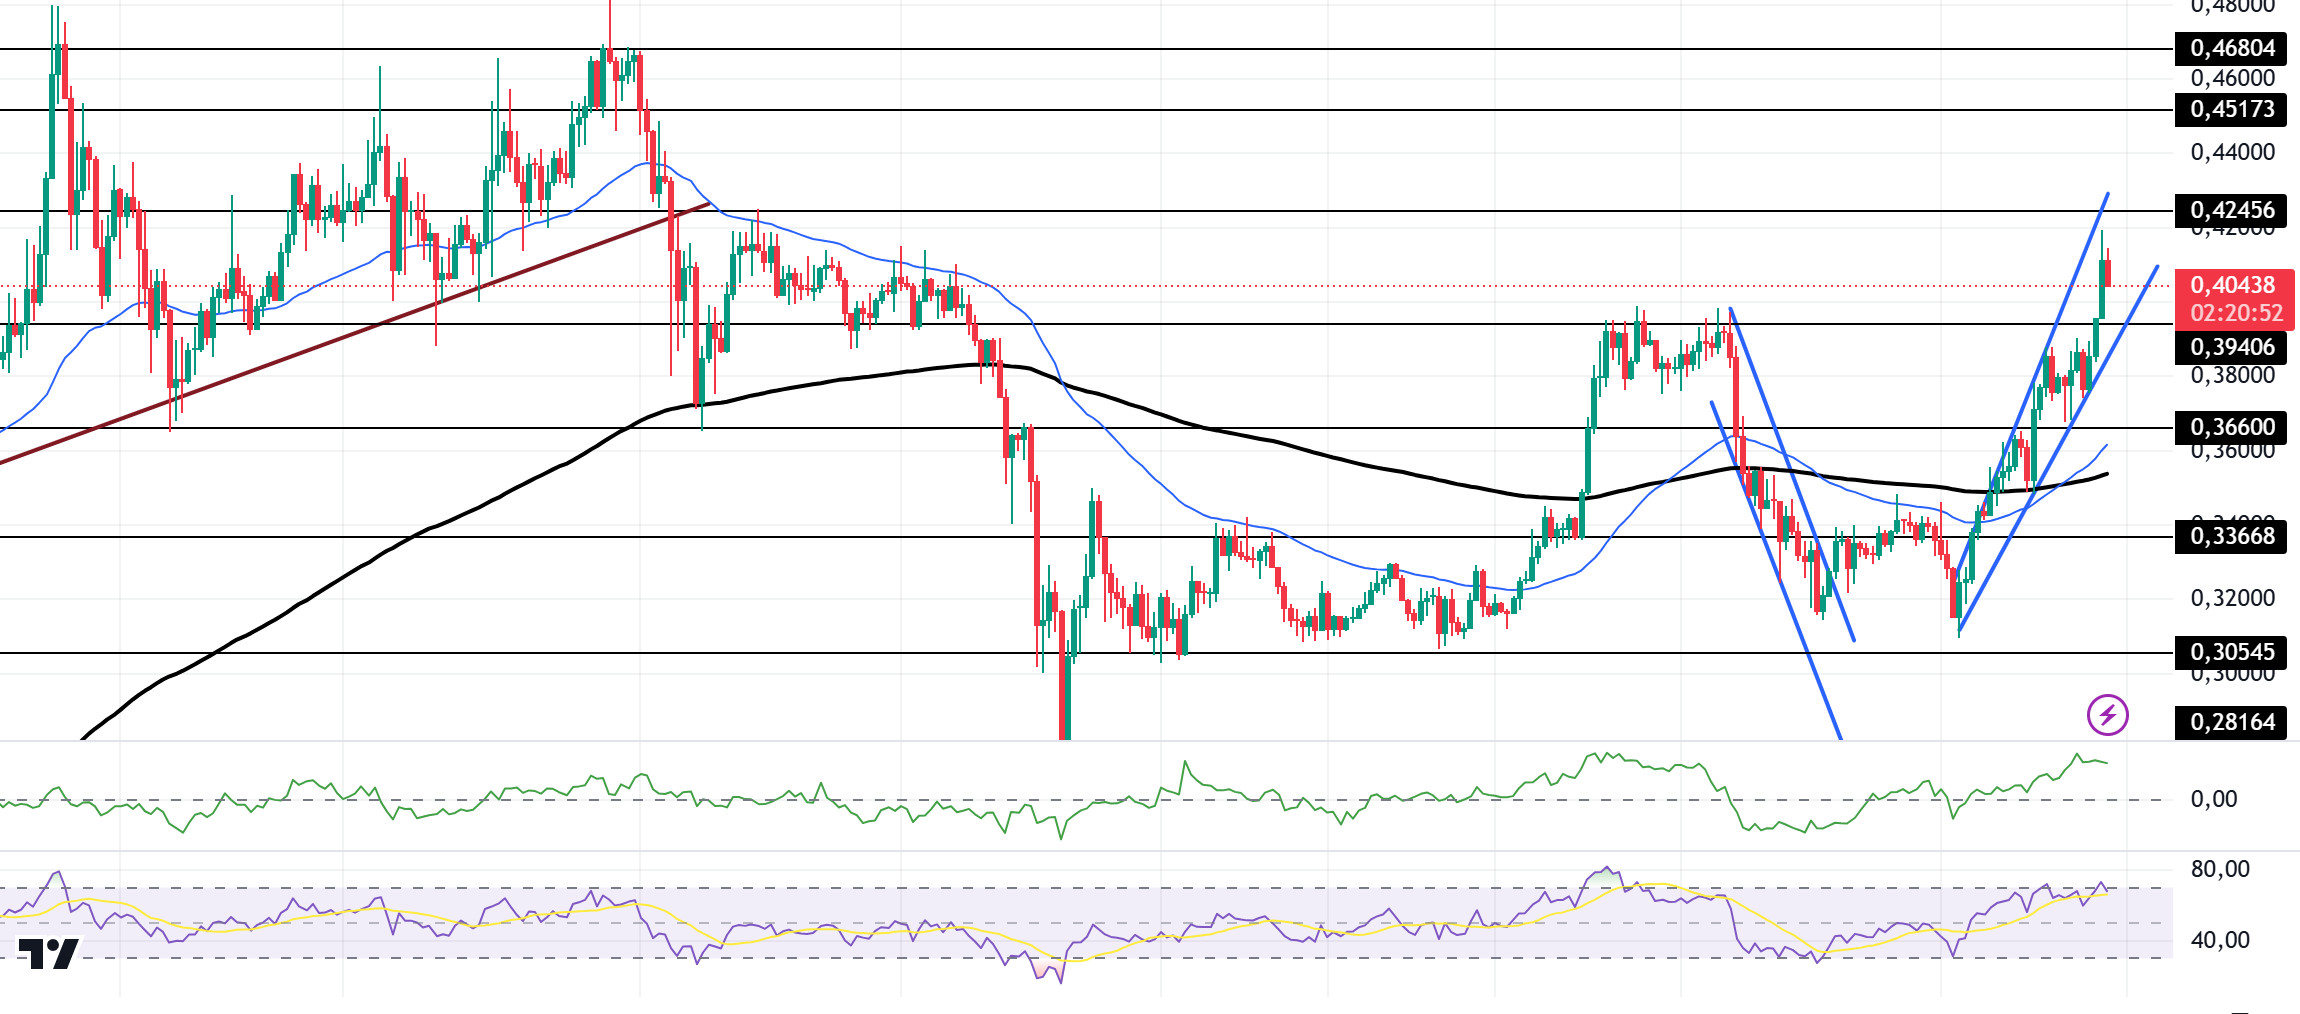
Doge has broken the 0.39406 level, continuing its uptrend. Looking at the chart, the asset is above the 50 EMA (Blue Line) and 200 EMA (Black Line) in the 4-hour timeframe. The 50 EMA is also starting to hover above the 200 EMA. This could be the beginning of a medium-term uptrend. However, the rising wedge pattern should be taken into consideration. This could be a sign that the price will retrace. The Chaikin Money Flow (CMF)20 indicator is in positive territory but money inflows and outflows are balanced. However, Relative Strength Index (RSI)14 is in the overbought zone again. This may cause a pullback. The 0.42456 level stands out as a very strong resistance point in the rises due to political reasons, macroeconomic data and innovations in the DOGE coin. In case of possible pullbacks due to political, macroeconomic reasons or negativity in the ecosystem, the 0.36600 level, which is the base level of the trend, is an important support. If the price reaches these support levels, a potential bullish opportunity may arise if momentum increases.
Supports 0.39406 – 0.36600 – 0.33668
Resistances 0.42456 – 0.45173 – 0.46804
LEGAL NOTICE
The investment information, comments and recommendations contained herein do not constitute investment advice. Investment advisory services are provided individually by authorized institutions taking into account the risk and return preferences of individuals. The comments and recommendations contained herein are of a general nature. These recommendations may not be suitable for your financial situation and risk and return preferences. Therefore, making an investment decision based solely on the information contained herein may not produce results in line with your expectations.


